X-Ray Refraction Topography and Computed Tomography for ... · Right; X-ray transmission topograph...
9
X-Ray Refraction Topography and Computed Tomography for NDE of Lightweight Materials Bernd R. MÜLLER, Axel LANGE, Michael HARWARDT, Manfred P. HENTSCHEL, Bernhard ILLERHAUS, Jürgen GOEBBELS; Federal Institute for Materials Research and testing (BAM), Berlin, Germany Joachim BAMBERG, Falko HEUTLING, MTU Aero Engines, Munich, Germany Abstract. X-Ray Refraction Topography techniques are based on Ultra Small Angle Scattering by micro structural elements causing phase related effects like refraction and total reflection at a few minutes of arc as the refractive index of X-rays is nearly unity (1 – 10 -5 ). The extraordinary contrast of inner surfaces is far beyond absorption effects. Scanning of specimens results in 2D-imaging of closed and open pore surfaces and crack surface density of ceramics and foams. Crack orientation and fibre/matrix debonding in plastics, polymers and ceramic composites after cyclic loading and hydro thermal aging can be visualized. In most cases the investigated inner surface and interface structures correlate to mechanical properties. For the exploration of Metal Matrix Composites (MMC) and other micro structured materials the refraction technique has been improved by a 3D Synchrotron Refraction Computed Tomography (SyRef-CT) test station. The specimen is situated in an X-ray beam between two single crystals. Therefore all sample scattering is strongly suppressed and interpreted as additional attenuation. Asymmetric cut second crystals magnify the image up to 50 times revealing nano meter resolution. The refraction contrast is several times higher than “true absorption” and results in images of cracks, pores and fibre debonding separations below the spatial resolution of the detector. The technique is an alternative to other attempts on raising the spatial resolution of CT machines. The given results yield a much better understanding of fatigue failure mechanisms in light weight materials for applications of high safety requirements. Introduction In Computed Tomography CT the interface contrast of heterogeneous materials can be strongly enforced due to X-ray refraction effects. This is especially desired for materials of low absorption or mixed phases of similar absorption resulting in low contrast. X-Ray refraction [1, 2] is an ultra small angle scattering (USAXS) phenomenon. Refraction contrast has been applied as well for planar Refraction Topography, a scanning technique for improved non-destructive characterization of high performance composites, ceramics and other low density materials and components [3]. X-ray refraction occurs, when X-rays interact with interfaces (cracks, pores, particles, phase boundaries) preferably at low angles of incidence similar to the behaviour of visible light in transparent materials e.g. lenses or prismatic shapes. The X-ray optical effects can be observed at small scattering angles of between several seconds and a few minutes of arc as the refractive index n of X-rays is nearly unity (n ~ 1 – 10 -5 ). In other terms due to the ECNDT 2006 - Tu.3.5.3 1
Transcript of X-Ray Refraction Topography and Computed Tomography for ... · Right; X-ray transmission topograph...

X-Ray Refraction Topography and Computed Tomography for NDE of Lightweight
Materials
Bernd R. MÜLLER, Axel LANGE, Michael HARWARDT, Manfred P. HENTSCHEL, Bernhard ILLERHAUS, Jürgen GOEBBELS; Federal Institute for Materials Research and
testing (BAM), Berlin, Germany Joachim BAMBERG, Falko HEUTLING, MTU Aero Engines, Munich, Germany
Abstract. X-Ray Refraction Topography techniques are based on Ultra Small Angle Scattering by micro structural elements causing phase related effects like refraction and total reflection at a few minutes of arc as the refractive index of X-rays is nearly unity (1 – 10-5). The extraordinary contrast of inner surfaces is far beyond absorption effects. Scanning of specimens results in 2D-imaging of closed and open pore surfaces and crack surface density of ceramics and foams. Crack orientation and fibre/matrix debonding in plastics, polymers and ceramic composites after cyclic loading and hydro thermal aging can be visualized. In most cases the investigated inner surface and interface structures correlate to mechanical properties. For the exploration of Metal Matrix Composites (MMC) and other micro structured materials the refraction technique has been improved by a 3D Synchrotron Refraction Computed Tomography (SyRef-CT) test station. The specimen is situated in an X-ray beam between two single crystals. Therefore all sample scattering is strongly suppressed and interpreted as additional attenuation. Asymmetric cut second crystals magnify the image up to 50 times revealing nano meter resolution. The refraction contrast is several times higher than “true absorption” and results in images of cracks, pores and fibre debonding separations below the spatial resolution of the detector. The technique is an alternative to other attempts on raising the spatial resolution of CT machines. The given results yield a much better understanding of fatigue failure mechanisms in light weight materials for applications of high safety requirements.
Introduction
In Computed Tomography CT the interface contrast of heterogeneous materials can be strongly enforced due to X-ray refraction effects. This is especially desired for materials of low absorption or mixed phases of similar absorption resulting in low contrast. X-Ray refraction [1, 2] is an ultra small angle scattering (USAXS) phenomenon. Refraction contrast has been applied as well for planar Refraction Topography, a scanning technique for improved non-destructive characterization of high performance composites, ceramics and other low density materials and components [3]. X-ray refraction occurs, when X-rays interact with interfaces (cracks, pores, particles, phase boundaries) preferably at low angles of incidence similar to the behaviour of visible light in transparent materials e.g. lenses or prismatic shapes. The X-ray optical effects can be observed at small scattering angles of between several seconds and a few minutes of arc as the refractive index n of X-rays is nearly unity (n ~ 1 – 10-5). In other terms due to the
ECNDT 2006 - Tu.3.5.3
1

short X-ray wavelength below 0.1 nm X-ray “light scattering” is sensitive to inner surfaces and interfaces of nano meter dimensions.
Refraction effect
In analogy to visible optics the interaction of X-rays with small transparent structures above several nano meter dimensions results in coherent scattering governed by wavelength, structural dimensions and shape, local phase shift and absorptive attenuation. But different from optical conditions, the refractive index of X-rays near One causes beam deflections into the same small angular region of several minutes of arc as does the diffraction. Thus the resulting interferences are due to phase modulation due to the refractive index and the absorptive and Raleigh diffraction, both depending on the path length through matter.
However if the dimensions of the scattering objects are much larger than several ten nano meters as common in classical small angle scattering, the interference fringes are not observable any more by classical small angle cameras as they are too narrow. The resulting smeared angular intensity distribution is then simply described by a continuous decay according to the rules for refraction by transparent media, e.g. applying Snell’s law [2]. This purely geometrical refraction approach is appropriate for small angle X-ray (and neutron) scattering effects by micro meter sized structures and applied in the following.
Orientedsmall anglescatteringby refraction
collimation
Mo-k , 20 keVα
detector / film
sample,fibres refracted
beam I (2 )*R Θ
n = 1 - with ~ ~ 10ε ε ρλ2 -5
2θ
PP fibre, 20µmPt wires, 100 µmCu wires,25 µmquartz fibres, 10 µmrefraction theory
criticalangle
0 0.2 0.4 0.6 0.8 1.0rel. Scattering angle
Inte
nsity
/a.u
.
Figure 1: Effect of oriented small angle scattering by refraction of glass fibres; n index of refraction, ε real part of n, λ wavelength
Figure 2: The normalized shape of the angular intensity distribution of cylindrical objects; P: polypropylene
If ε is the real part of the complex index of refraction n, ρ the electron density and λ
the X-ray wavelength then n is:
ε−= 1n , with 2λρε ⋅≈ and 510−≅ε for glass at 8 keV radiation (1) In contrast to optics convex lenses cause divergence of X-rays as n < 1. Fig. 1 demonstrates the effect of small angle scattering by refraction of cylindrical lenses: A bundle of 15 µm glass fibres (for composites) deflects a pinhole X-rays beam within several minutes of arc. In fibres and spherical particles the deflection of X-rays occurs twice, when entering and when leaving the object (see insert Fig. 1). The oriented intensity distribution is collected by an X-ray film or a CCD camera while the straight (primary) beam is omitted by a beam stop. The shape of the intensity distribution of such cylindrical objects is a universal
2

function independent of materials, if normalized to the "critical angle" θC of total reflection (see Fig. 2) defined by the refractive index θ2
C = 2ε. The intensity of the deflected X-rays becomes nearly zero at the critical angle (see Fig. 2), with a small contribution from total reflection.
Applying a Kratky type high resolution small angle scattering camera with slit collimation a cross section of 10-3 of the fibre diameter contributes to the detectable intensity above typically 2 minutes of arc. Total reflection of X-rays occurs as well but only 10-6 of the cylinder diameter is involved and therefore negligible, but planar surfaces may scatter all the primary intensity if well aligned. Based on Snell’s Law the angular intensity distribution of cylinders has been modeled and fitted to measurements on most different fibres, as illustrated by Fig. 2. The refracted intensity I*
R of a cylinder (without absorption effects) can be expressed by [2]:
( ) 3
2030 2
arctansin2
2θ
εθε
εθ ⋅⋅
≅⎟⎠⎞
⎜⎝⎛
′⋅
=′∗ RJRJI R (2)
J0 is the irradiation density of the incident X-rays, R is the cylinder radius and 2θ’=θ is the scattering angle. In case of spherical particles or pores I*
R becomes
( ) 4
20 2
2θ
εθ ⋅⋅≅′∗ RJ
I R (3)
The conventional understanding of "continuous" small angle X-ray scattering (SAXS) is governed by the interpretation of diffraction effects. Both the well known Guinier's theory [4] for separated particles and Porod’s theory [5] of densely packed colloids are based on diffraction of Raleigh scattering. Nevertheless Porod approximates the same angular intensity decay as in Eq. (3). However both diffraction approaches are about scattering objects two orders of magnitude smaller.
The SAXS instrumentation with X-ray fine structure tube and Kratky camera is relatively straight forward. The camera needs an additional detector for the primary beam attenuation measurement and a micro manipulation device for the sample (Fig. 3). For practical measurements the refraction detector remains at a fixed scattering angle 2θ´, so that the relative surface density C of the specimen can be measured according to [3]:
⎟⎟⎠
⎞⎜⎜⎝
⎛−
⋅⋅⋅= 11
0
0
AR
AR
IIII
dC
(4) with IR and IR0 from the refraction detector with and without sample respectively, IA an IA0 from the absorption detector and d the wall thickness of a sample. Apart from the choice of materials the relative surface density C depends merely on the scattering angle and the radiation wavelength. Absolute “inner surface density” (specific surface, surface per unit volume) is determined by comparison with a known calibration standard at retained boundary conditions (wavelength and scattering angle).
3

2Θ′referencedetector
refractiondetector
I , IR R0
specimen
I0
I , IA A0
I
sample manipulator
collimatedX-ray beam
Z
Yd
Figure 3: Basic principle of a SAXS instrumentation with collimated X-ray beam, specimen
manipulator, a refraction detector, which measures the refracted intensity IR of the specimen or IR0 if the specimen is not in place and a reference detector, which measures the intensity IA0 (without
specimen) or IA (with specimen), respectively.
Not only the inner surface of pores and particles can be determined, but interfaces and cracks like fibre debonding in composites as well. A model composite has been made in order to demonstrate the refraction behaviour of a bonded and a debonded 140 µm sapphire fibre in a polymer matrix (Fig. 4, left). Fig. 4, middle shows the resulting intensity distribution of a two-dimensional refraction scan of the model composite.
refraction topograph transmission topograph
Figure 4: left; Model composite made of wax with a bonded (top) and debonded (bottom) 140 µm sapphire fiber. Middle; X-ray refraction at the interface of the bonded (top) and debonded (bottom)
fiber. Right; X-ray transmission topograph of the model composite. The upper ray crosses the bonded fibre-matrix interface causing a small amount of deflected intensity. At the debonded fibre and at the matrix surfaces (lower ray) much more X-rays are deflected, as of the larger difference of the refractive index against air. The polymer channel is clearly separated from the fibre surface.
interface- und refraction,matrix-cracks total reflection
matrix-pores refraction
structural element effect
unbonded fibers refraction
bonded fibers refraction
vertical cracks zero
interface- und refraction,matrix-cracks total reflection
matrix-pores refraction
structural element effect
unbonded fibers refraction
bonded fibers refraction
vertical cracks zero
primary
beam
primary
beam
Figure 5: Sketch of various interfaces in a composite which causes X-ray refraction. The size of the
refraction arrow indicates the strength of the measured refraction intensity. For comparison a mapping of IA yields the transmission topograph containing only the absorption information of the projected densities like in conventional radiography (Fig. 4,
4

right). In case of a real composite material the much thinner fibres are not spatially resolved, but the higher refraction signal of debonded fibres reveals quantitatively the percentage of debonded fibres. Fig. 5 represents the various interfaces possible in a composite.
3D Synchrotron refraction computed tomography
Specimens
To enlarge the propulsive force of the next generation of aircraft engines some fundamental constructive changes has to be done. E.g. the design of the compressor section has to be changed from bladed disks (BLISK) to bladed rings (BLING) to archive a larger hub bore diameter for new compressor designs. This constructive changes (see Fig. 6 left) presuppose new materials which have the same stiffness at a lower weight. Fiber reinforced Titanium Metal Matrix Composites are especially suited to be used in the compressor part of an aircraft engine.
The cylindrical specimens for the test program have been provided by MTU Aero Engines. As reinforcing fiber the SCS6-fibre from Textron was taken. It has a 33 µm diameter carbon fiber as a core with a 1 µm pyro-C-protective coating, followed by SiC and again by a pyro-C-protective coating of 3 µm (see Fig. 6, middle). The overall diameter of the fiber measures 140 µm.
Ti-MMCrings
SCS6-fibre
Ti6242-matrix
magnetronsputtering (PVD)
Hot IsostaticPressing (HIP)
bundling
Figure 6: left, for a larger hub bore diameter for new compressor designs the Bladed disk BLISK has to
be changed to Bladed ring BLING. Middle, Assembly of the SCS6-fibre from Textron (1: pyro-C-protective coating, 2: SiC, 3: C-fiber, 4: pyro-C-protective coating) and the HIP procedure of the Low
Cycle Fatigue specimen manufacturing (right). The fibers are coated (30 µm) with the titanium base alloy Ti6242 by magnetron
sputtering and than bundled and formed by Hot Isostatic Pressing (HIP) (see Fig. 6, middle and right). Static and cyclic forces were applied parallel to the fibers which leads to the evaluation of the mechanical parameters. After the tests the specimens were examined by metallographic methods and the fractured surfaces were analyzed. As a new approach for non-destructive testing the specimens were investigated by 3D Synchrotron Refraction Computed Tomography at the materials research test station of BAM (BAMline) at the Synchrotron Facility in Berlin (BESSY) as well. The investigations should reveal whether the development of cracks and fiber failures after tensile load is distributed homogeneously across the sample, or locally concentrated.
Experimental set up for 3D Synchrotron Refraction Computed Tomography
In our laboratory we have employed conventional X-ray tubes, crystallographic small angle scattering cameras and scintillation counters, respectively. The specimens where scanned or rotated across a single beam under pre selected fixed scattering conditions in order to
5
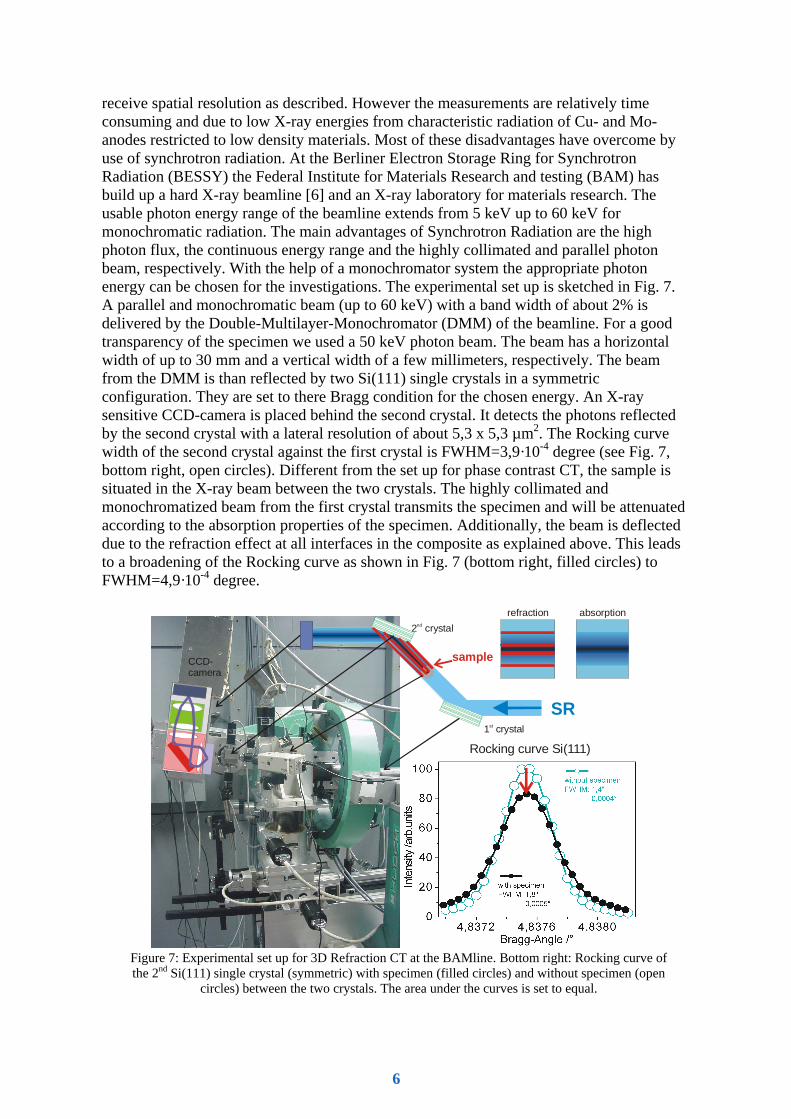
receive spatial resolution as described. However the measurements are relatively time consuming and due to low X-ray energies from characteristic radiation of Cu- and Mo-anodes restricted to low density materials. Most of these disadvantages have overcome by use of synchrotron radiation. At the Berliner Electron Storage Ring for Synchrotron Radiation (BESSY) the Federal Institute for Materials Research and testing (BAM) has build up a hard X-ray beamline [6] and an X-ray laboratory for materials research. The usable photon energy range of the beamline extends from 5 keV up to 60 keV for monochromatic radiation. The main advantages of Synchrotron Radiation are the high photon flux, the continuous energy range and the highly collimated and parallel photon beam, respectively. With the help of a monochromator system the appropriate photon energy can be chosen for the investigations. The experimental set up is sketched in Fig. 7. A parallel and monochromatic beam (up to 60 keV) with a band width of about 2% is delivered by the Double-Multilayer-Monochromator (DMM) of the beamline. For a good transparency of the specimen we used a 50 keV photon beam. The beam has a horizontal width of up to 30 mm and a vertical width of a few millimeters, respectively. The beam from the DMM is than reflected by two Si(111) single crystals in a symmetric configuration. They are set to there Bragg condition for the chosen energy. An X-ray sensitive CCD-camera is placed behind the second crystal. It detects the photons reflected by the second crystal with a lateral resolution of about 5,3 x 5,3 µm2. The Rocking curve width of the second crystal against the first crystal is FWHM=3,9·10-4 degree (see Fig. 7, bottom right, open circles). Different from the set up for phase contrast CT, the sample is situated in the X-ray beam between the two crystals. The highly collimated and monochromatized beam from the first crystal transmits the specimen and will be attenuated according to the absorption properties of the specimen. Additionally, the beam is deflected due to the refraction effect at all interfaces in the composite as explained above. This leads to a broadening of the Rocking curve as shown in Fig. 7 (bottom right, filled circles) to FWHM=4,9·10-4 degree.
CCD-camera
1 crystalst
sample
2 crystalnd
SR
absorptionrefraction
Rocking curve Si(111)
Figure 7: Experimental set up for 3D Refraction CT at the BAMline. Bottom right: Rocking curve of the 2nd Si(111) single crystal (symmetric) with specimen (filled circles) and without specimen (open
circles) between the two crystals. The area under the curves is set to equal.
6
Measurements and results
Although two-dimensional refraction topography provides an effective new probe for analyzing meso-structures of all kind of heterogeneous materials, it is sometimes interesting to have section images of transversal resolution as known from X-ray computed tomography in order to overcome the overlap of details by projection effects. The measurements were performed by rotating the specimens around there cylindrical symmetry axis for 360 degrees in steps of 1 degree. After each step an exposure was taken. The data sets were analyzed by filtered back projection as known from the data treatments for conventional absorption CT.
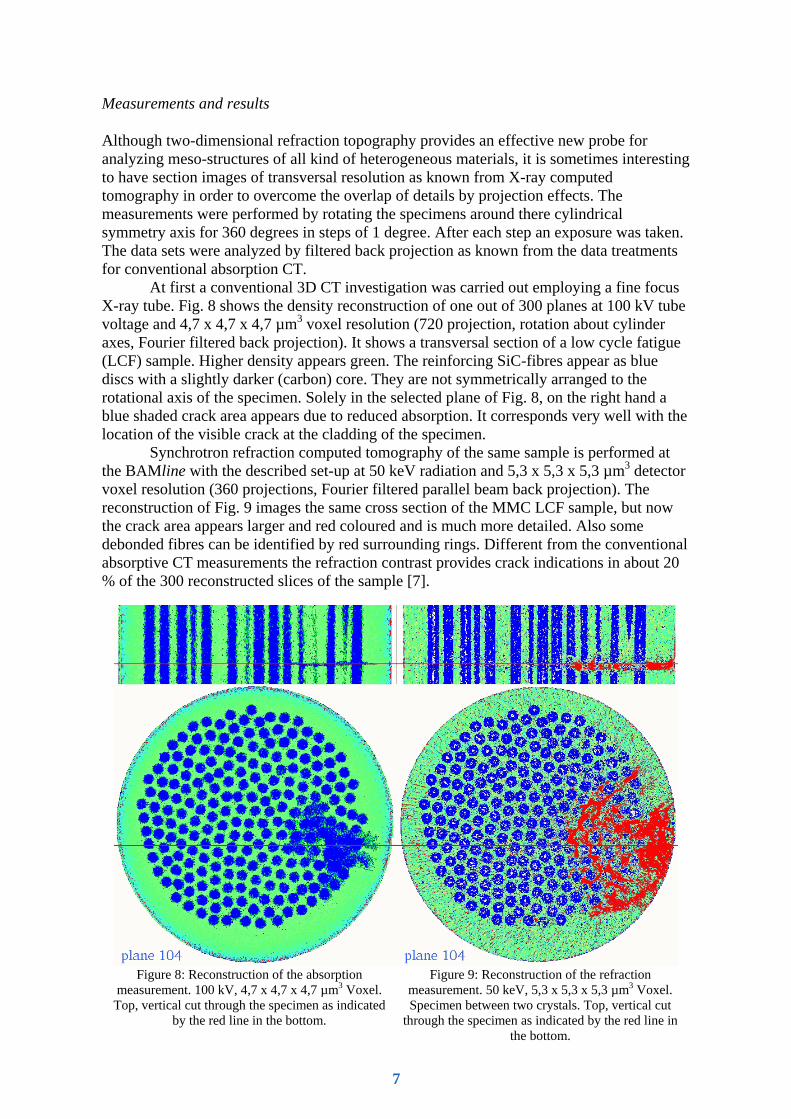
At first a conventional 3D CT investigation was carried out employing a fine focus X-ray tube. Fig. 8 shows the density reconstruction of one out of 300 planes at 100 kV tube voltage and 4,7 x 4,7 x 4,7 µm3 voxel resolution (720 projection, rotation about cylinder axes, Fourier filtered back projection). It shows a transversal section of a low cycle fatigue (LCF) sample. Higher density appears green. The reinforcing SiC-fibres appear as blue discs with a slightly darker (carbon) core. They are not symmetrically arranged to the rotational axis of the specimen. Solely in the selected plane of Fig. 8, on the right hand a blue shaded crack area appears due to reduced absorption. It corresponds very well with the location of the visible crack at the cladding of the specimen.
Synchrotron refraction computed tomography of the same sample is performed at the BAMline with the described set-up at 50 keV radiation and 5,3 x 5,3 x 5,3 µm3 detector voxel resolution (360 projections, Fourier filtered parallel beam back projection). The reconstruction of Fig. 9 images the same cross section of the MMC LCF sample, but now the crack area appears larger and red coloured and is much more detailed. Also some debonded fibres can be identified by red surrounding rings. Different from the conventional absorptive CT measurements the refraction contrast provides crack indications in about 20 % of the 300 reconstructed slices of the sample [7].
Figure 8: Reconstruction of the absorption
measurement. 100 kV, 4,7 x 4,7 x 4,7 µm3 Voxel. Top, vertical cut through the specimen as indicated
by the red line in the bottom.
Figure 9: Reconstruction of the refraction measurement. 50 keV, 5,3 x 5,3 x 5,3 µm3 Voxel. Specimen between two crystals. Top, vertical cut
through the specimen as indicated by the red line in the bottom.
7

The high inverse contrast (compared to Fig. 8) origins from the rejection of
deflected X-rays by the second Si-crystal in front of the CCD detector due to refraction and total reflection interaction of the crack boundaries. The refraction contrast is nearly independent on the width of the cracks as it is a surface effect. But the contrast depends strongly on the angle of the incident beam, which is only effective at 0 + 1 deg. (plane crack). In the given set-up with both Si-crystals set to the top of their rocking curves the image information from absorption and refraction effects are both present. If desired they can be separated by different operation of the Si-crystals.
Magnification by asymmetric Bragg reflection
Much higher spatial resolution can be achieved, when the second crystal (Fig. 7) is replaced by a crystal of asymmetric cut (Fankuchen cut). In this case the crystal surface is inclined against the reflecting lattice plane resulting in a broadened exit beam of up to 100 times magnification. An example of such nano meter resolution Refraction CT is given by Fig. 10, which presents the reconstruction of a vertical and horizontal section of a standing steel micro drill (100 µm diameter) at 19 keV radiation. Green coloured tubular pores below 1 µm diameter; refraction contrast at outer edges and around pores are visible.
Figure 10: 3D Nano Refraction CT; reconstructed vertical (left) and horizontal (right) plane of steel micro
drill from 19 keV projections; green tubular pores below 1 µm diameter; refraction contrast at outer edges and around pores; magnification by Fankuchen cut Si single crystal (at rocking curve center)
Conclusione
The presented findings demonstrate the high performance of Refraction CT for inner surfaces and interfaces including micro cracks. Even beyond the spatial resolution of the reconstruction average crack densities are determined. The techniques are expected to close an essential gap in the spectrum of non-destructive techniques for a better understanding of micro structures of materials down to the nano meter scale and their behaviour under thermal and mechanical loads.
8

References
[1] A. H. Compton, S.K. Allison, X-ray in Theory and Experiment, Macmillan and Co. Ltd., London, 1935 [2] M.P. Hentschel, R. Hosemann, A. Lange, B. Uther, R. Brückner, Acta Cryst. A 43, 506, 1987 [3] K.-W. Harbich, M.P. Hentschel, J. Schors, NDT&E International 34, 297, 2001 [4] A. Guinier, G. Fournet, Small-Angle Scattering of X-Rays, Wiley, 1955 [5] G. Porod, Kolloid.-Z. 124, 83, 1951 [6] W. Görner, M.P. Hentschel, B.R. Müller, H. Riesemeier, M. Krumray, G. Ulm, W. Diete, U. Klein, R.
Frahm, “BAMline: the first hard X-ray beamline at BESSY II”, Nuclear Instruments and Methodes in Physics Researche, A467-468, 703, 2001
[7] B. R. Müller, A. Lange, M. Harwardt, M. P. Hentschel, B. Illerhaus, J. Goebbels, J. Bamberg, F. Heutling, Materialprüfung/materials testing, 46, 314, 2004
9