X-33 Hypersonic Aerodynamic Characteristicsmln/ltrs-pdfs/NASA-aiaa-99-4162.pdf · aerodynamic and...
14
Transcript of X-33 Hypersonic Aerodynamic Characteristicsmln/ltrs-pdfs/NASA-aiaa-99-4162.pdf · aerodynamic and...
1
X-33 Hypersonic Aerodynamic Characteristics
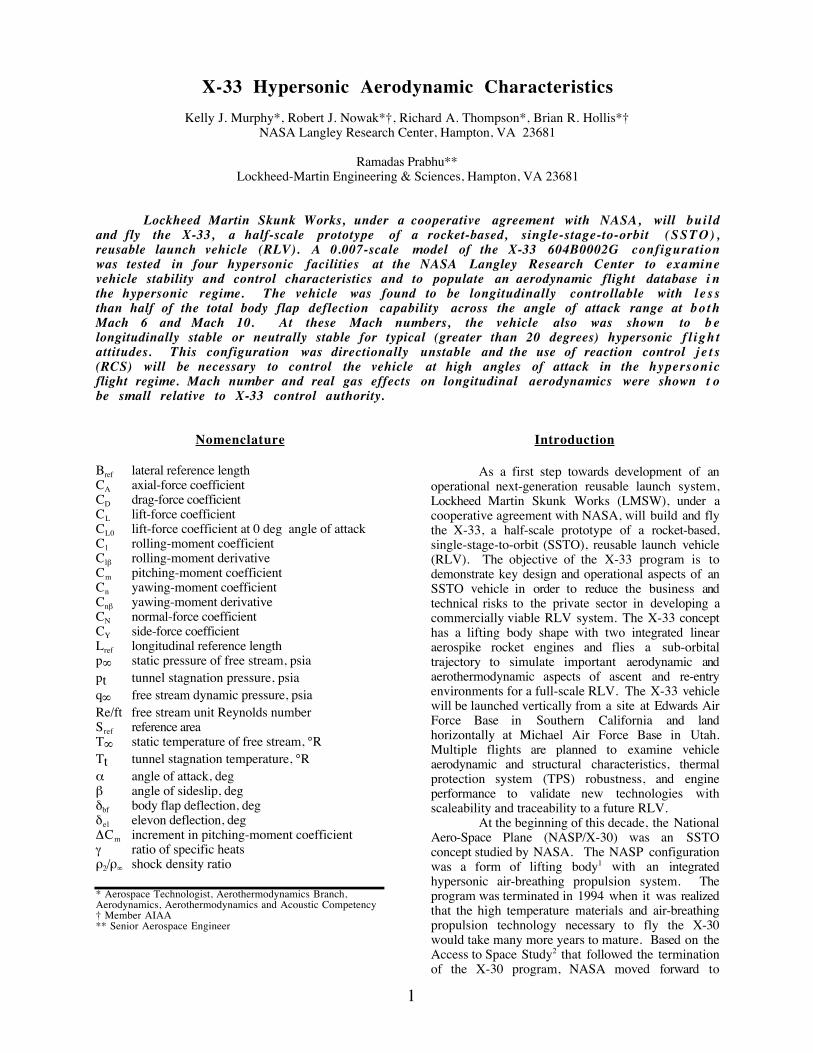
Kelly J. Murphy*, Robert J. Nowak* , Richard A. Thompson*, Brian R. Hollis* NASA Langley Research Center, Hampton, VA 23681
Ramadas Prabhu**Lockheed-Martin Engineering & Sciences, Hampton, VA 23681
Lockheed Martin Skunk Works, under a cooperative agreement with NASA, will buildand fly the X-33, a half-scale prototype of a rocket-based, single-stage-to-orbit (SSTO) ,reusable launch vehicle (RLV). A 0.007-scale model of the X-33 604B0002G configurationwas tested in four hypersonic facilities at the NASA Langley Research Center to examinevehicle stability and control characteristics and to populate an aerodynamic flight database i nthe hypersonic regime. The vehicle was found to be longitudinally controllable with l e s sthan half of the total body flap deflection capability across the angle of attack range at bo thMach 6 and Mach 10. At these Mach numbers, the vehicle also was shown to b elongitudinally stable or neutrally stable for typical (greater than 20 degrees) hypersonic f l igh tattitudes. This configuration was directionally unstable and the use of reaction control j e t s(RCS) will be necessary to control the vehicle at high angles of attack in the hypersonicflight regime. Mach number and real gas effects on longitudinal aerodynamics were shown t obe small relative to X-33 control authority.
Nomenclature
Bref lateral reference lengthCA axial-force coefficientCD drag-force coefficientCL lift-force coefficientCL0 lift-force coefficient at 0 deg angle of attackCl rolling-moment coefficientClb rolling-moment derivativeCm pitching-moment coefficientCn yawing-moment coefficientCnb yawing-moment derivativeCN normal-force coefficientCY side-force coefficientLref longitudinal reference lengthp¥ static pressure of free stream, psiapt tunnel stagnation pressure, psiaq¥ free stream dynamic pressure, psiaRe/ft free stream unit Reynolds numberSref reference areaT¥ static temperature of free stream, ¡RTt tunnel stagnation temperature, ¡Ra angle of attack, degb angle of sideslip, degdbf body flap deflection, degdel elevon deflection, degDCm increment in pitching-moment coefficientg ratio of specific heatsr2/r¥ shock density ratio
* Aerospace Technologist, Aerothermodynamics Branch,Aerodynamics, Aerothermodynamics and Acoustic Competency Member AIAA** Senior Aerospace Engineer
Introduction
As a first step towards development of anoperational next-generation reusable launch system,Lockheed Martin Skunk Works (LMSW), under acooperative agreement with NASA, will build and flythe X-33, a half-scale prototype of a rocket-based,single-stage-to-orbit (SSTO), reusable launch vehicle(RLV). The objective of the X-33 program is todemonstrate key design and operational aspects of anSSTO vehicle in order to reduce the business andtechnical risks to the private sector in developing acommercially viable RLV system. The X-33 concepthas a lifting body shape with two integrated linearaerospike rocket engines and flies a sub-orbitaltrajectory to simulate important aerodynamic andaerothermodynamic aspects of ascent and re-entryenvironments for a full-scale RLV. The X-33 vehiclewill be launched vertically from a site at Edwards AirForce Base in Southern California and landhorizontally at Michael Air Force Base in Utah.Multiple flights are planned to examine vehicleaerodynamic and structural characteristics, thermalprotection system (TPS) robustness, and engineperformance to validate new technologies withscaleability and traceability to a future RLV.
At the beginning of this decade, the NationalAero-Space Plane (NASP/X-30) was an SSTOconcept studied by NASA. The NASP configurationwas a form of lifting body1 with an integratedhypersonic air-breathing propulsion system. Theprogram was terminated in 1994 when it was realizedthat the high temperature materials and air-breathingpropulsion technology necessary to fly the X-30would take many more years to mature. Based on theAccess to Space Study2 that followed the terminationof the X-30 program, NASA moved forward to
2
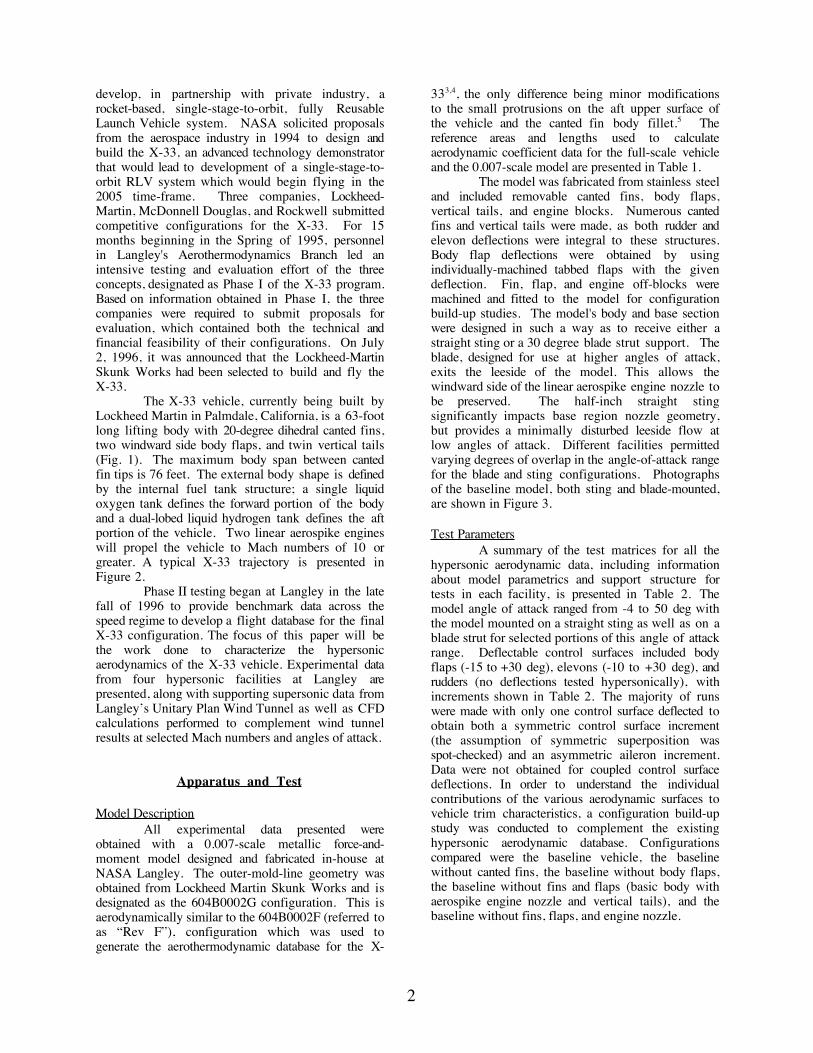
develop, in partnership with private industry, arocket-based, single-stage-to-orbit, fully ReusableLaunch Vehicle system. NASA solicited proposalsfrom the aerospace industry in 1994 to design andbuild the X-33, an advanced technology demonstratorthat would lead to development of a single-stage-to-orbit RLV system which would begin flying in the2005 time-frame. Three companies, Lockheed-Martin, McDonnell Douglas, and Rockwell submittedcompetitive configurations for the X-33. For 15months beginning in the Spring of 1995, personnelin Langley's Aerothermodynamics Branch led anintensive testing and evaluation effort of the threeconcepts, designated as Phase I of the X-33 program.Based on information obtained in Phase I, the threecompanies were required to submit proposals forevaluation, which contained both the technical andfinancial feasibility of their configurations. On July2, 1996, it was announced that the Lockheed-MartinSkunk Works had been selected to build and fly theX-33.
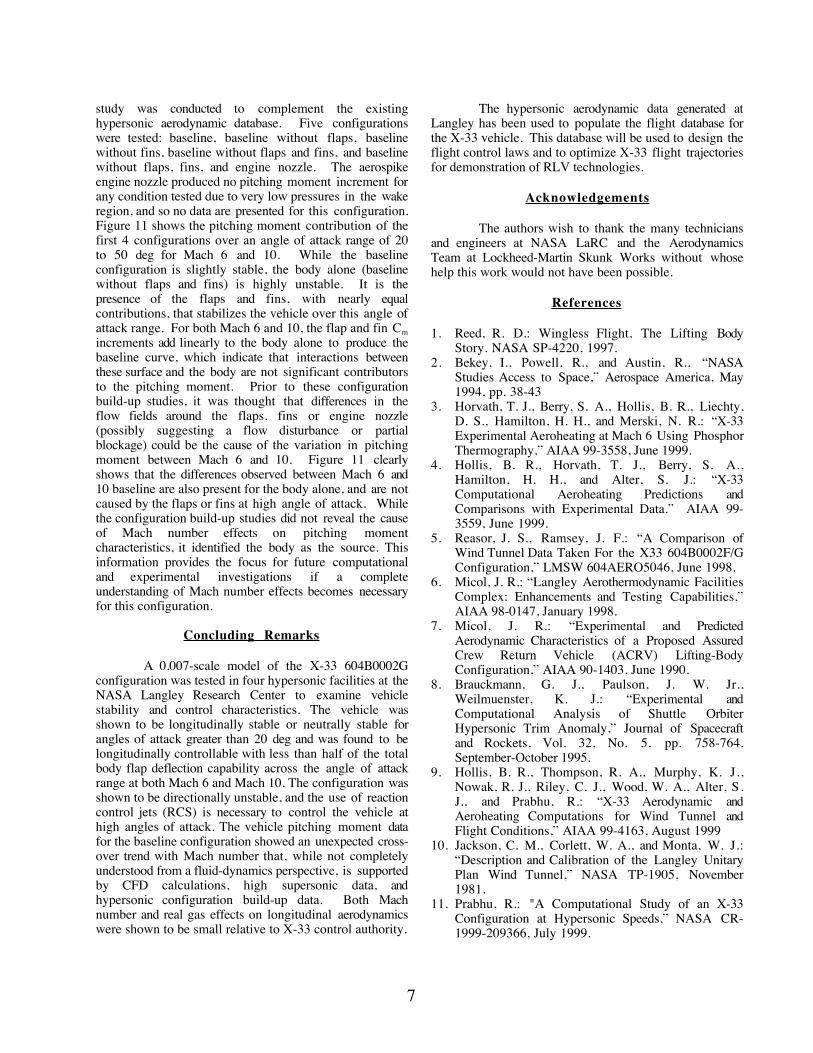
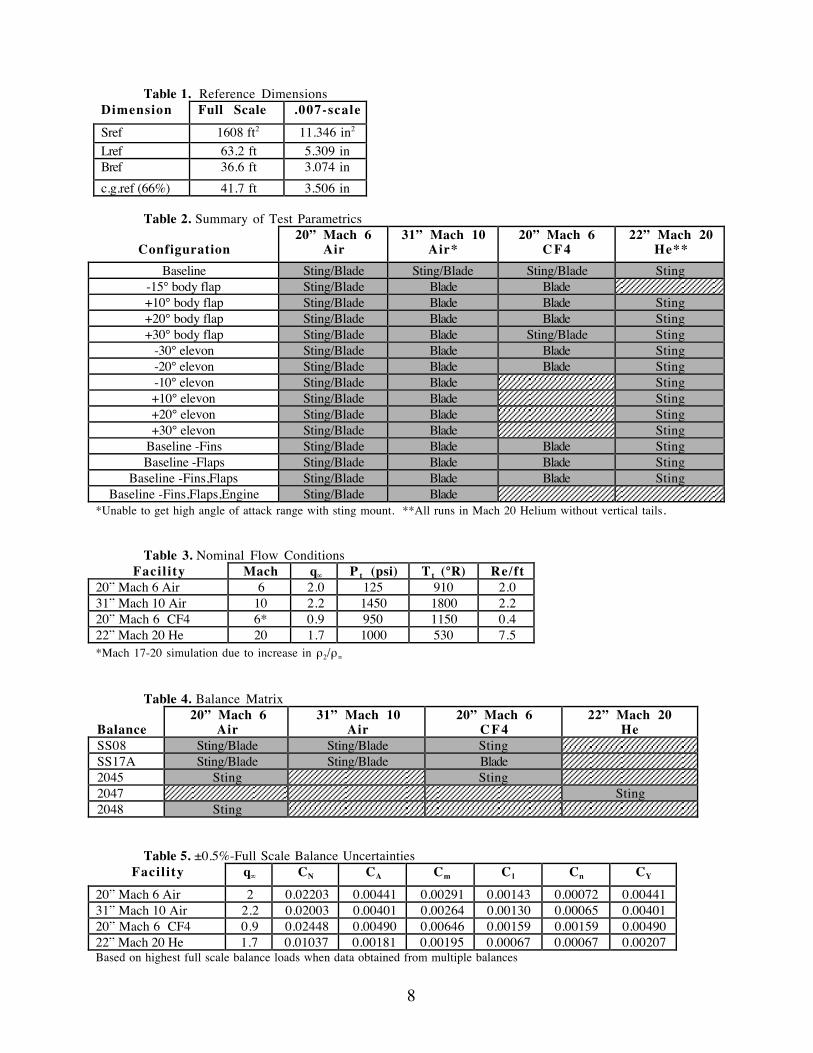
The X-33 vehicle, currently being built byLockheed Martin in Palmdale, California, is a 63-footlong lifting body with 20-degree dihedral canted fins,two windward side body flaps, and twin vertical tails(Fig. 1). The maximum body span between cantedfin tips is 76 feet. The external body shape is definedby the internal fuel tank structure; a single liquidoxygen tank defines the forward portion of the bodyand a dual-lobed liquid hydrogen tank defines the aftportion of the vehicle. Two linear aerospike engineswill propel the vehicle to Mach numbers of 10 orgreater. A typical X-33 trajectory is presented inFigure 2.
Phase II testing began at Langley in the latefall of 1996 to provide benchmark data across thespeed regime to develop a flight database for the finalX-33 configuration. The focus of this paper will bethe work done to characterize the hypersonicaerodynamics of the X-33 vehicle. Experimental datafrom four hypersonic facilities at Langley arepresented, along with supporting supersonic data fromLangleyÕs Unitary Plan Wind Tunnel as well as CFDcalculations performed to complement wind tunnelresults at selected Mach numbers and angles of attack.
Apparatus and Test
Model Description All experimental data presented were
obtained with a 0.007-scale metallic force-and-moment model designed and fabricated in-house atNASA Langley. The outer-mold-line geometry wasobtained from Lockheed Martin Skunk Works and isdesignated as the 604B0002G configuration. This isaerodynamically similar to the 604B0002F (referred toas ÒRev FÓ), configuration which was used togenerate the aerothermodynamic database for the X-
333,4, the only difference being minor modificationsto the small protrusions on the aft upper surface ofthe vehicle and the canted fin body fillet.5 Thereference areas and lengths used to calculateaerodynamic coefficient data for the full-scale vehicleand the 0.007-scale model are presented in Table 1.
The model was fabricated from stainless steeland included removable canted fins, body flaps,vertical tails, and engine blocks. Numerous cantedfins and vertical tails were made, as both rudder andelevon deflections were integral to these structures.Body flap deflections were obtained by usingindividually-machined tabbed flaps with the givendeflection. Fin, flap, and engine off-blocks weremachined and fitted to the model for configurationbuild-up studies. The model's body and base sectionwere designed in such a way as to receive either astraight sting or a 30 degree blade strut support. Theblade, designed for use at higher angles of attack,exits the leeside of the model. This allows thewindward side of the linear aerospike engine nozzle tobe preserved. The half-inch straight stingsignificantly impacts base region nozzle geometry,but provides a minimally disturbed leeside flow atlow angles of attack. Different facilities permittedvarying degrees of overlap in the angle-of-attack rangefor the blade and sting configurations. Photographsof the baseline model, both sting and blade-mounted,are shown in Figure 3.
Test ParametersA summary of the test matrices for all the
hypersonic aerodynamic data, including informationabout model parametrics and support structure fortests in each facility, is presented in Table 2. Themodel angle of attack ranged from -4 to 50 deg withthe model mounted on a straight sting as well as on ablade strut for selected portions of this angle of attackrange. Deflectable control surfaces included bodyflaps (-15 to +30 deg), elevons (-10 to +30 deg), andrudders (no deflections tested hypersonically), withincrements shown in Table 2. The majority of runswere made with only one control surface deflected toobtain both a symmetric control surface increment(the assumption of symmetric superposition wasspot-checked) and an asymmetric aileron increment.Data were not obtained for coupled control surfacedeflections. In order to understand the individualcontributions of the various aerodynamic surfaces tovehicle trim characteristics, a configuration build-upstudy was conducted to complement the existinghypersonic aerodynamic database. Configurationscompared were the baseline vehicle, the baselinewithout canted fins, the baseline without body flaps,the baseline without fins and flaps (basic body withaerospike engine nozzle and vertical tails), and thebaseline without fins, flaps, and engine nozzle.
3
Facility Description
Four hypersonic facilities at LaRC were usedto generate aerodynamic data: the 20-Inch Mach 6 AirTunnel, the 31-Inch Mach 10 Air Tunnel, the 20-InchMach 6 CF4 Tunnel, and the 22-Inch Mach 20Helium Tunnel. Reference 6 contains a detaileddescription of these facilities, their history and theircapabilities, and a brief summary of pertinentinformation is also given in tabular form below.Nominal flow conditions for the tests run can befound in Table 3.
LaRC 20-Inch Mach 6 Air TunnelType: Hypersonic blow-downTest Medium: Heated, dried, filtered airNozzle, throat: 2-D contoured,0.4x 20.5in.Run times: 2 minutesMach Range: 5.8 to 6.1Stagnation Pres. Range: 30 to 500 psiaStagnation Temp.Range: 750 to 1000 ¡RUnit Reynolds No. Range:0.5 to 8 million/ftShock Density Ratio: 6
LaRC 20-Inch Mach 6 CF 4 Tunnel Type: Hypersonic blow-downTest Medium: Heated, dried, filtered CF4
Nozzle ,throat: Axisymmetric, 0.45 in. dia.Run times: 1 minuteMach Range: 5.9 to 6Stagnation Pres. Range: 100 to 2000 psiaStagnation Temp. Range: 1100 to 1400 ¡RUnit Reynolds No. Range:0.05 to 0.7 million/ftShock Density Ratio: 12
LaRC 31-Inch Mach 10 Air Tunnel Type: Hypersonic blow-downTest Medium: Heated, dried airNozzle, throat: 3-D contoured,1.1 in. squareRun times: 1 minuteMach Range: 9.7 to 10Stagnation Pres. Range: 350 to 1450 psiaStagnation Temp. Range: 1800 ¡RUnit Reynolds No. Range:0.5 to 2.1 million/ftShock Density Ratio: 5.3
LaRC 22-Inch Mach 20 Helium TunnelType: Hypersonic blow-downTest Medium: Filtered, dried heliumNozzle, throat: Axisymmetric, 0.62 in. dia.Run times: 40 secondsMach Range: 17.6 to 22.2Stagnation Pres. Range: 300 to 3300 psiaStagnation Temp. Range: 530 ¡RUnit Reynolds No. Range:2.4 to 22 million/ftShock Density Ratio: 4
Data were obtained in the Mach 6 and Mach 10facilities to examine the effect of increasing Machnumber on the aerodynamic coefficients.Comparisons of data between the Mach 6 air and CF4
tunnels provide, through an increase in shock densityratio, an indication of the significance of real gaseffects for the configuration. Data obtained in theMach 20 Helium Tunnel were used in conjunctionwith Mach 6 and 10 data to assess the validity ofhelium simulation for high Mach number lifting-body aerodynamics.
Instrumentation and Data Reduction
Three aerodynamic forces and threeaerodynamic moments were measured using standardLangley 6-component strain gage balances. Fivedifferent 9/16-in. diameter, water-cooled balances wereused for testing in the hypersonic facilities toaccommodate different loadings and to check datarepeatability. Balance zeros were monitored beforeand after each run, and balance components weremonitored for excessive drift due to large thermalgradients across the balance gages. Balance data wereacquired in a pitch/pause manner in all facilities, witha pause typically lasting 3-5 seconds at a givenattitude. Data were averaged over 1 second with anacquisition rate of 20 samples/second. The modelattitude was measured at the strut head and correctedpost-run for sting deflections under load. Regardlessof support system or orientation, the model was keptwell within the highly uniform core (<±1% pitotpressure variation) as defined by tunnel flowfieldsurveys. Cavity pressure and limited base pressuremeasurements were obtained with external tubing andoff-board transducers. The level and variation of thepressure measurements was monitored to verify thatno corrections needed to be made to the aerodynamicdata. The hypersonic data presented were obtainedwithout the use of any boundary layer trippingdevices.
The only uncertainty applied to the data is aconservative balance precision error of ±0.5% of thefull-scale loads. The quoted balance accuracies aregenerally much smaller, but in the presence of hightemperature effects on the balance as well as othertunnel and model variations (such as flow non-uniformity and model attitude), this conservativeestimate seems a physically reasonable upper bound.A listing of balances used in this study and theuncertainties for representative flow conditions areshown in Tables 4 and 5.
Computational Methods
To complement the experimental database andto provide data at flight conditions, CFD calculationswere performed for selected configurations over arange of angles of attack and Mach numbers. Two
4
finite-volume, Navier-Stokes solvers, LAURA andGASP, and an inviscid Euler code, FELISA, wereused to obtain aerodynamic data. Computationalresults at Mach 6 and 10 will be presented with theexperimental data in subsequent sections. A thoroughdiscussion of CFD codes, models, and data ispresented by Hollis in Reference 9.
Results and Discussion
Hypersonic Aerodynamic CharacteristicsThe longitudinal characteristics of the baseline
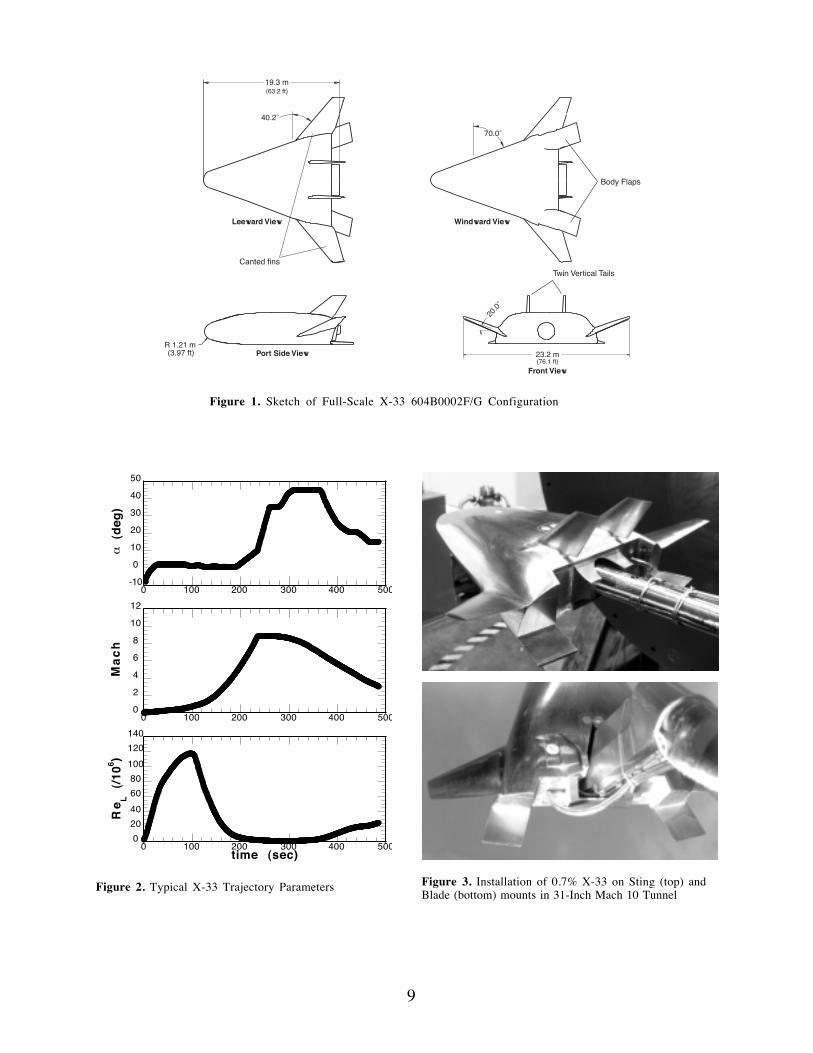
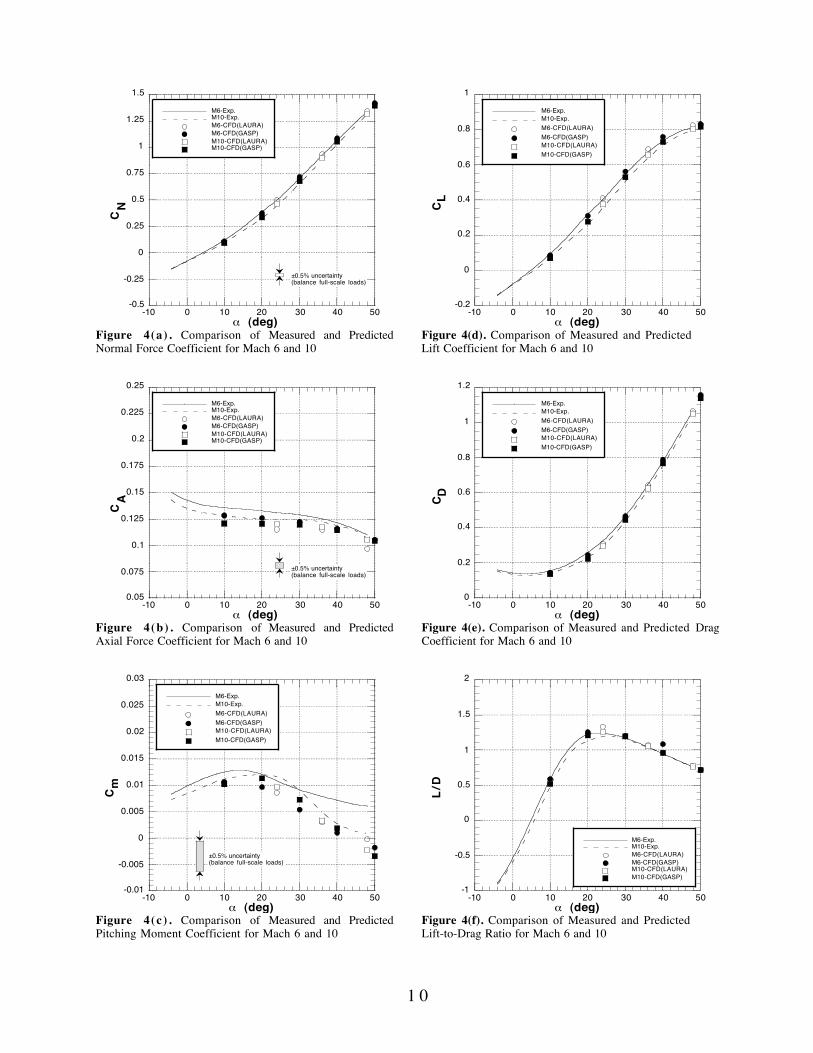
X-33 configuration are shown in Figures 4(a)-4(f),with both experimental and computational results forMach 6 and 10 plotted versus vehicle angle of attack.Low angle of attack (a < 25 deg) data were obtainedwith the model supported on a straight sting; highangle of attack (a > 25 deg) data were obtained withthe model supported on a blade sting. Theexperimental results presented in Fig. 4 are curve fitsto data representative of the mean value of dataobtained throughout the test program. Datarepeatability/uncertainty and support system effectswill be discussed in subsequent sections of this paper.
Lift coefficient data for Mach 6 and 10 arepresented in Fig. 4(d). The data exhibit nearly linearbehavior with a lift curve slope, CLa, ofapproximately .08 between a = 8 and 36 deg. Thehighest degree of non-linearity occurs at angles ofattack greater than 40 deg. CL0 values are identical forMach 6 and 10 and are negative due to negative finincidence. At angles of attack greater than 8 deg, CL
values for Mach 6 are slightly higher than for Mach10, which is an expected trend with Mach number.7,8
The maximum deviation between data sets occurs ata = 20 deg, which corresponds to the maximumdifferences in both the normal and axial forces on theconfiguration (Figs. 4(a) and 4(b)). Computationalvalues of CN and CA across the angle-of-attack rangeshow good agreement in trend and magnitude withexperimental data. Data sets for CD and L/D (Figs.4(e) and 4(f)) exhibit similar Mach number effectswith maximum deltas between Mach 6 and 10occurring at a = 20 deg. The Mach 6 experimentaldata gives a maximum L/D value of 1.25 at a = 20deg, while L/Dmax at Mach 10 is 1.2 at a = 24 deg.
Pitching moment characteristics are shown inFig. 4(c). Both Mach 6 and 10 data show aconfiguration that is longitudinally unstable (positiveCma) for a < 10 deg, and longitudinally stable(negative Cma) for a > 24 deg. Experimental datashow the vehicle to be more stable at Mach 10 thanMach 6; computational data show the same trend butshow this difference in stability level to be noticeablysmaller. The greatest differences in Cm valuesbetween Mach 6 and 10 experimental data andbetween experimental and computational data occur atthe highest angles of attack. The difference betweenMach 6 and 10 data at a = 48 deg is approximately
.005; the difference between experiment and CFD atthis same angle of attack is .006 and .003 for Mach 6and 10 respectively. Cm differences become smalleras the angle of attack decreases. Although thepitching moment curves exhibit an unexplainedcrossover in the mid-alpha range (20-30 deg), thisbehavior is also exhibited, although at a higher angleof attack, by the existing CFD data set. Reference 9shows this crossover to be a continuous function ofMach number by additional CFD calculations atMach numbers between 4 and 10. Since definition oflongitudinal trim characteristics are of greatimportance for hypersonic reentry trajectories, thepitching moment database will be more thoroughlydiscussed in light of data repeatability and controlauthority in the sections that follow.
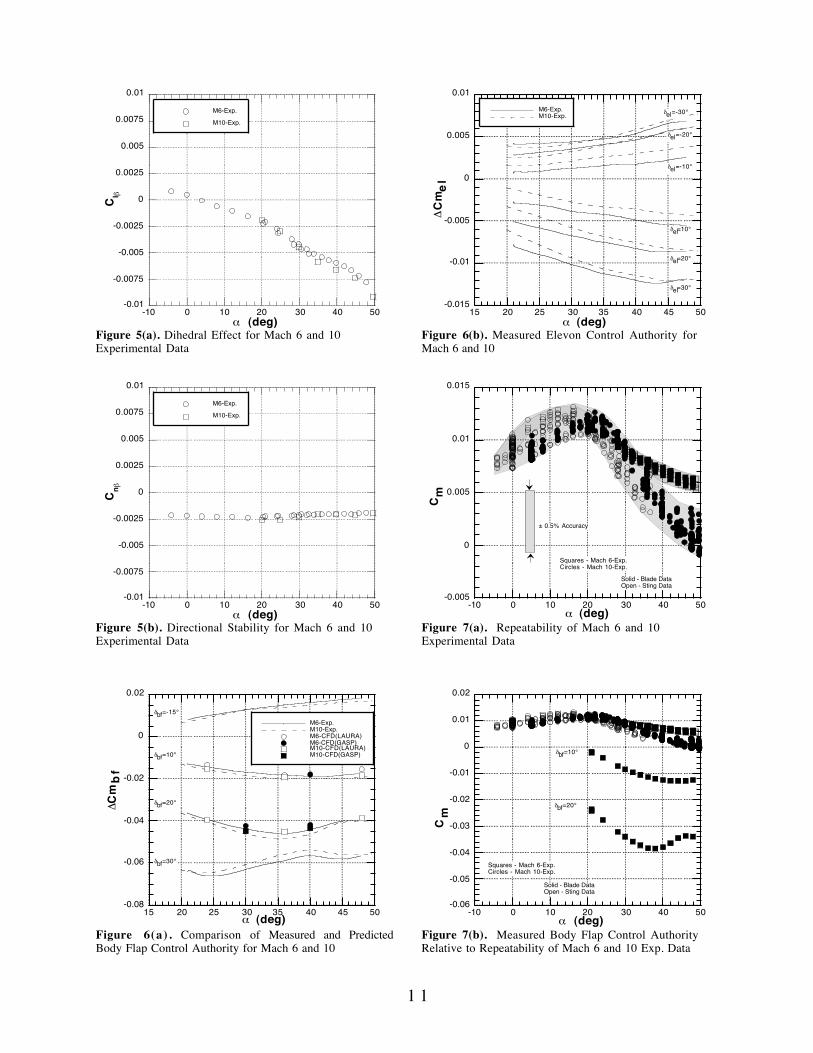
Figures 5(a) and 5(b) present the lateral-directional stability characteristics Clb and Cnb for theX-33 vehicle for Mach 6 and 10. Both experimentaldata sets show the vehicle is stable in roll (negativevalues of Clb) for all but the lowest angles of attacktested (a < 4 deg). The vehicle demonstrates positivedihedral effect, and roll stability increases nearlylinearly as the angle of attack increases and the wingdihedral becomes more effective. Cnb is nearly aconstant negative value across the angle of attackrange for Mach 6 and 10 indicating the vehicle isdirectionally unstable, which is common for thesetypes of aerospace configurations. The small twinvertical tails on the aft upper surface do little to affectyaw stability, especially at typical hypersonic re-entryattitudes when they are entirely shielded from thefreestream flow behind the body. Therefore, the useof reaction control jets (RCS) will be necessary tocontrol the vehicle. For this reason, no rudderdeflections were examined at Mach 6 and 10, and nofurther discussion of lateral-directional characteristicswill be presented.
Longitudinal Control AuthorityThe body flap effectiveness, DCm, for four flap
deflection angles at vehicle angles of attack from 20to 50 deg for Mach 6 and 10 is presented in Figure6(a). These curves represent simultaneous deflectionof both body flaps and have been constructed bydoubling the DCm measured from a single body flapdeflection. For several deflections this superpositionassumption was checked against true symmetricdeflections, and the results were indistinguishable ona physically relevant scale. Cross-talk between theflaps is not expected, as they are not in proximity toeach other. The increment in Cm due to deflecting thebody flaps up (dbf = -15 deg) is positive and increaseswith angle of attack, appearing to asymptote to aconstant value at the highest angles of attack. Theremaining sets of data represent down-flap deflectionsof 10, 20, and 30 deg. A 10-deg flap deflectionshows a negative pitch increment that smoothlyincreases with angle of attack to a nearly constantvalue of approximately -0.02 for both Mach numbers.
5
There appears to be a slight decrease in flapeffectiveness for this case at the highest angles ofattack. This could signify the beginning of aseparation of the incoming laminar boundary layer atthe flap hinge line. Recalling the baseline pitchingmoment curves in Fig. 4(c), one can see that a 10-degflap deflection produces more than twice the controlauthority needed to trim the vehicle.
As the flap is further deflected down to 20 and30 deg, flap effectiveness becomes very non-linear.To explain this behavior, experimental heating data,surface and flow field visualization techniques, andcomputational flow field solutions were used inconjunction with the aerodynamic data. At Mach 6,Horvath3 observed a complex heating pattern on thewindward surface of the 20-deg flap and a well-defineddisturbance in accompanying oil-flow visualizations.Schlieren photography at the same conditions clearlyshow interaction between the vehicleÕs bow shock andflap shock. Computations by Hollis10 show that thisdisturbance on the flap is due to the impingement ofan expansion fan resulting from the bow shock/flapshock interaction. The resulting decrease in surfacepressures on the flap appears to be the cause of thenon-linear characteristics for larger flap deflectionangles. The fact that the surface pressure distributionon the flaps is influenced by the relative location ofthe bow and flap shocks may explain why slightlygreater differences are observed between Mach 6 and10 pitch increments with increasing flap deflection.As shown in Fig. 6(a), laminar CFD calculationsalso show these non-linear effects on pitchingmoment increments. Data show that the decrease incontrol effectiveness due to this shock/shockinteraction begins at a lower angle of attack for the30-deg flap deflection, most likely owing to thesteeper flap shock associated with the larger flapdeflection. The aforementioned aeroheating resultsshowed this flow structure to be highly dependent onthe state of the boundary layer when comparinglaminar and turbulent heating distributions (turbulentresults were obtained by physically tripping theboundary layer upstream of the deflected flap). Overthe Reynolds number range tested, it is believed thatall force and moment data, and therefore body flapincrement data, were obtained for laminar conditionsonly. Increments obtained computationally forlaminar flow also agree well with the experimentaldata. Based on turbulent heating results where thesedisturbances are much less severe, it seems reasonableto believe that flap effectiveness would increase forturbulent flight cases.
The elevon effectiveness is shown in Figure6(b) and again is the result of superposition of asingle deflected surface. The elevons produce smallerpitching moment increments than the body flaps dueto a smaller surface area. The Cm increments due toincreases in elevon deflection exhibit less non-linearity than the body flaps. Thus there is noevidence of a shock/shock interaction affecting the
surface pressure distributions as was seen for the bodyflaps. Elevons at the highest negative deflection (del
= -30 deg) show a reduced increment (DCm per degreeof deflection) across the angle of attack range. Thepositive elevon deflections show much more linearbehavior with increasing deflection and increasingangle of attack. The slight decrease in effectiveness atthe highest angles of attack for del = 20 and 30 degmay be due to the effects of a larger laminarseparation at the hinge line.
Wind Tunnel DatabaseAs shown in the preceding section, there is
ample control surface authority to provide trimcontrol through the hypersonic portion of the X-33trajectory. However, there has been much scrutiny,from an academic viewpoint, of the pitching momentresults generated both experimentally andcomputationally at Mach 6 and 10. Some of thedifferences found are not easily explainable from afluid dynamics perspective. A further discussion ofthe hypersonic database, in light of repeatability,uncertainty, and control authority, will provide thereader additional insight into pitching momentphenomena and confidence about the data set as awhole.
Figure 7(a) shows numerous pitchingmoment data points generated for the baselineconfiguration for Mach 6 and 10 with both sting andblade mount supports. Two shaded gray bands aredrawn to show the extent of Cm variation for bothMach numbers. It is important to note that for alldata presented, the range of Cm values for a givenangle of attack are within the ±0.5% accuracypreviously discussed. The variation in the Mach 6data set is less than ±0.25% throughout the angle ofattack range, and model support appears to have noinfluence on pitching moment trends. The Mach 10data set shows a larger scatter in the data set and morenoticeable differences between the sting and blademounts across the angle-of-attack range but remainwith the ±0.5% accuracy band. The total temperaturein the Mach 10 facility is twice that of the Mach 6facility, and although great care was taken to monitorand minimize temperature effects, unavoidablethermal gradients across the model and balance lead tohigher uncertainty on measurements at Mach 10. Thedifferences between the sting and blade data observedin Mach 10 across the angle of attack range are notfully understood, but they are quite small. The datapresented in Figure 7(a) also represent runs onmultiple balances in upright and inverted orientationsfrom numerous tunnel entries. Thus the generalpitching moment trends observed for Mach 6 and 10were shown to be repeatable. Figure 7(b) revisitsbody flap control authority (only Mach 6 data shown)relative to the baseline Mach 6 and 10 data setspresented in Fig 7(a). As can be seen in this figure,the observed differences on experimentally measuredpitching moment data at Mach 6 and 10 correspond to
6
only 2-3 deg of body flap deflection. This incrementis a small percentage of the total flap deflectionavailable to control the vehicle at hypersonicconditions.
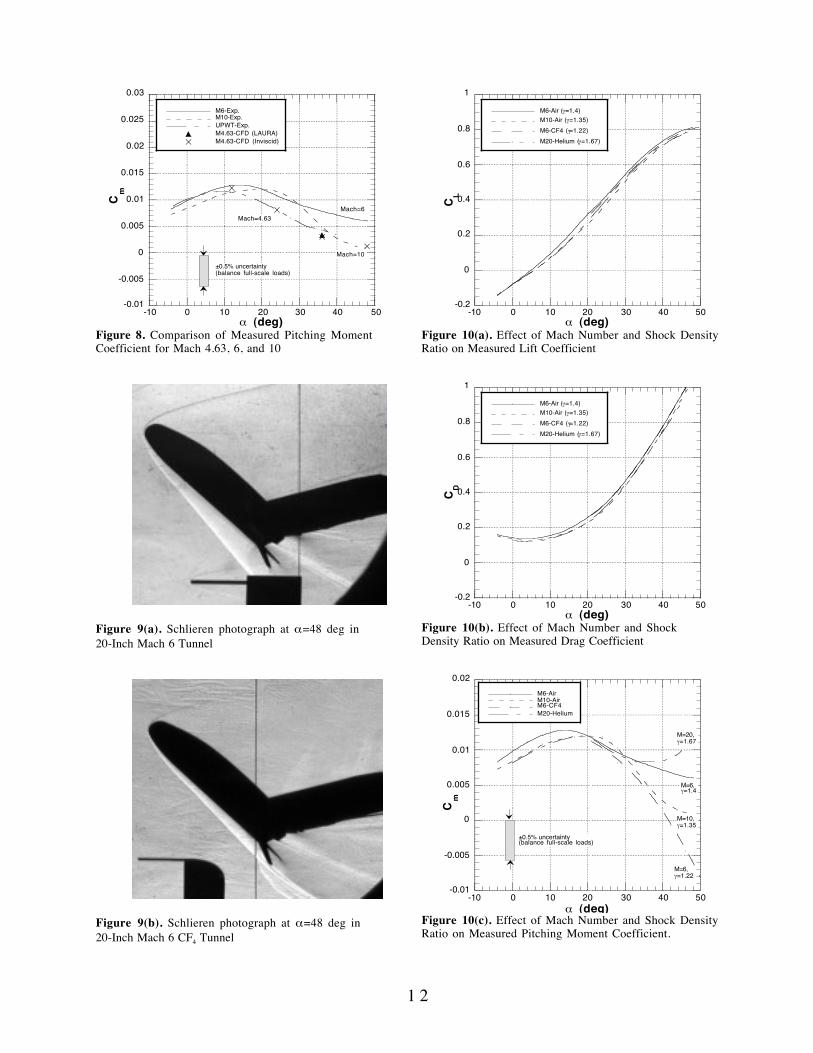
Another means of checking the validity ofthe hypersonic pitching moment database iscomparison to high supersonic Mach number data. Agreat deal of testing was done at NASA MarshallÕs(MSFC) Trisonic Facility to populate thetransonic/supersonic database for the X-33.5
Additional tests are also planned for late Fall 1999 inLockheed-MartinÕs Vought Facility to obtain highReynolds number data in these flight regimes.However, the data generated at MSFC were not atangles of attack high enough for comparison with thehypersonic database. Therefore it was decided that abrief entry of the baseline configuration in LaRCÕsUnitary Plan Wind Tunnel (UPWT) would provideadditional high supersonic data up to a = 40 deg withthe LaRC 0.007-scale model (eliminatingmodel/support variation) to support the hypersonicdatabase. A detailed discussion of the UPWT is foundin Ref. 10. Nominal flow conditions for this seriesof tests were the following: M=4.63, q¥=1.5 psi,p¥=0.1 psi, T¥=115¡R, and Re/ft=2x106. Thepitching moment data obtained from these tests,shown in Fig. 8, compares well with trends seen inthe Mach 6 and exhibits the Òcross-overÓ seen in thehypersonic data and predicted by the CFD.Supporting inviscid and viscous CFD calculation at aMach number of 4.63 show excellent agreement withexperimental data from the UPWT.
Additional Hypersonic Simulati on DataNASA Langley has two unique facilities that
allow simulation of very high Mach number flows(M = 17-20): the 20-Inch Mach 6 CF4 Tunnel and the22-Inch Mach 20 Helium Tunnel. Both CF4 andHelium have g values different from ideal air, and theeffect and relevance of this variation on predictions ofvehicle aerodynamics will be shown.
The 20-Inch Mach 6 CF4 tunnel uses aheavy gas with a lower g (1.22) than ideal air tosimulate the reduced g of a real gas (due todissociation within the shock layer) at hypervelocityconditions. (Note that actual real gas chemistry isnot simulated in this facility.) Due to the increasedshock density ratio, a Mach 6 condition in CF4
provides approximately a Mach 17-20 flightsimulation6. Schlieren photographs (Figs 9(a) and(b)) of the X-33 configuration at a = 48 deg in Mach6 air and Mach 6 CF4 clearly show the decrease inshock stand-off distance due to the increased shockdensity ratio in CF4. ÒReal gas effectsÓ during there-entry portion of the ShuttleÕs flight trajectoryproved to be significant and were predicted, post-flight, using CF4 data. With a maximum Machnumber of only 10, real gas phenomena are notexpected for the X-33Õs sub-orbital flight. CF4 datafor the X-33 will be used to gage the significance of
real-gas effects for an X-33 derived RLV, which willfly a higher Mach number re-entry trajectory, andtherefore are a valuable part of the X-33 hypersonicdatabase.
The 22-Inch Mach 20 Helium tunnel usespurified helium which behaves as an ideal gas, butwith a higher g (1.67) than air. The primaryadvantage of testing in this facility is that high Machnumber flows can be generated without heating thegas. Thus low stagnation temperatures are producedwhich allow the use of inexpensive, rapid-prototype,plastic models for testing. X-33 testing in heliumwill provide insight into the nature of air-heliumsimulation techniques for future RLV testing.
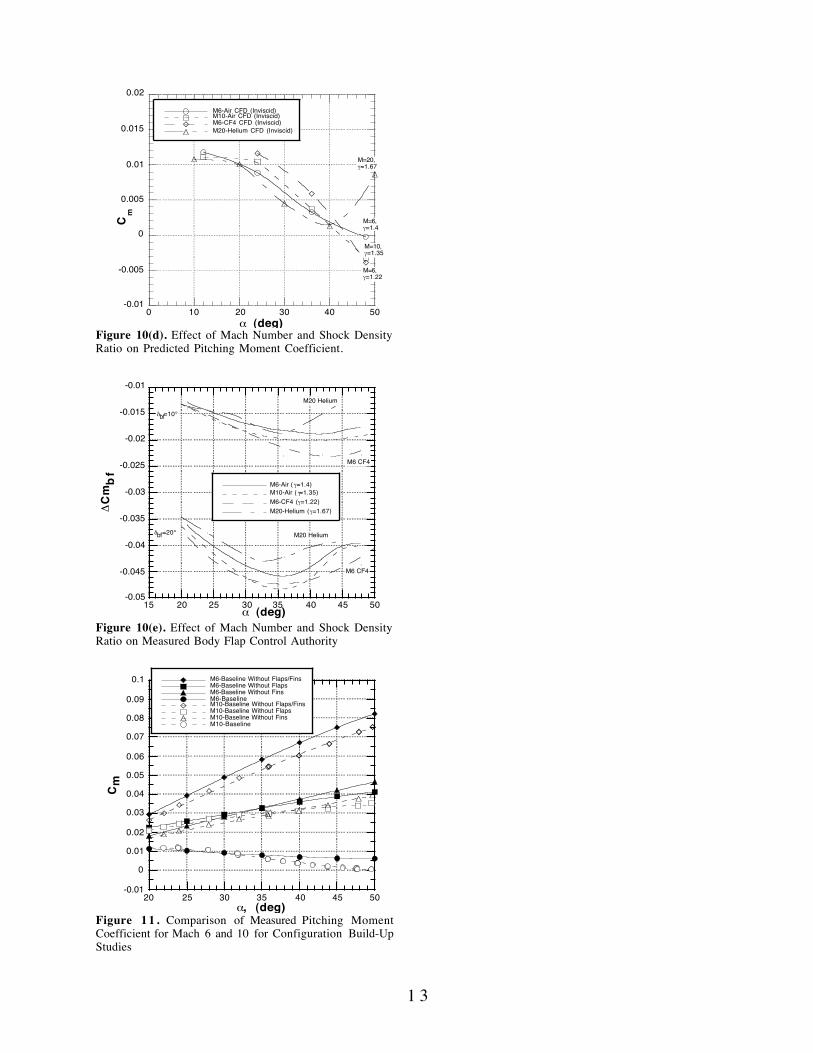
Figures 10(a)-10(c) present lift, drag, andpitching moment coefficients obtained in CF4 andhelium as compared with the previously discussedMach 6 and 10 air data to examine the effects of Machnumber and shock density ratio on longitudinalaerodynamics. There appears to be little effect of g orMach number on the integrated quantities of lift anddrag as seen in Figures 10(a) and 10(b). However, thepitching moment at high angles of attack shows amuch greater sensitivity to these parameters. Fora > 35 deg the Cm data in helium become unstableand more nose-up than the air data. The CF4 datashows the opposite trend, with the vehicle becomingmore longitudinally stable and more nose-down ascompared to both the Mach 6 and 10 data sets. Thepitching moment values and the stability levels seemto have a consistent trend with decreasing g (Notethat g for Mach 10 air is slightly below that of theideal value of 1.4 due to the high enthalpy of theMach 10 facility.) Figure 10(d) also supports thesetrends, showing inviscid calculations for Mach 6 and10 air, Mach 6 CF4 and Mach 20 helium by Prabhu.11
These calculations (shown in Ref. 9 to be in verygood agreement with viscous results for air and CF4
pitching moment predictions) clearly show theunstable pitch-up in helium and the increase instability and pitch-down in CF4 at high angles ofattack. Figure 10(e) shows the effect of helium andCF4 simulations on body-flap effectiveness for flapdeflections of 10 and 20 deg. As a general trend,helium tends to under-predict flap effectiveness athigher angles of attack. Therefore, testing in thehelium tunnel should provide a conservative estimateof vehicle control authority. The CF4 flap deflectiondata tends to show a more effective flap, leading tomore control authority with real gas effects. Whilereal gas effects for this configuration, as simulated bythe CF4 tunnel, were shown to be more significantthan Mach number effects, they are still quite smallin comparison to those previously observed for theShuttle.8
Configuration Build-Up StudiesIn order to understand the individual contribution ofthe various aerodynamic surfaces to vehicle trimcharacteristics, an extensive configuration build-up
7
study was conducted to complement the existinghypersonic aerodynamic database. Five configurationswere tested: baseline, baseline without flaps, baselinewithout fins, baseline without flaps and fins, and baselinewithout flaps, fins, and engine nozzle. The aerospikeengine nozzle produced no pitching moment increment forany condition tested due to very low pressures in the wakeregion, and so no data are presented for this configuration.Figure 11 shows the pitching moment contribution of thefirst 4 configurations over an angle of attack range of 20to 50 deg for Mach 6 and 10. While the baselineconfiguration is slightly stable, the body alone (baselinewithout flaps and fins) is highly unstable. It is thepresence of the flaps and fins, with nearly equalcontributions, that stabilizes the vehicle over this angle ofattack range. For both Mach 6 and 10, the flap and fin Cm
increments add linearly to the body alone to produce thebaseline curve, which indicate that interactions betweenthese surface and the body are not significant contributorsto the pitching moment. Prior to these configurationbuild-up studies, it was thought that differences in theflow fields around the flaps, fins or engine nozzle(possibly suggesting a flow disturbance or partialblockage) could be the cause of the variation in pitchingmoment between Mach 6 and 10. Figure 11 clearlyshows that the differences observed between Mach 6 and10 baseline are also present for the body alone, and are notcaused by the flaps or fins at high angle of attack. Whilethe configuration build-up studies did not reveal the causeof Mach number effects on pitching momentcharacteristics, it identified the body as the source. Thisinformation provides the focus for future computationaland experimental investigations if a completeunderstanding of Mach number effects becomes necessaryfor this configuration.
Concluding Remarks
A 0.007-scale model of the X-33 604B0002Gconfiguration was tested in four hypersonic facilities at theNASA Langley Research Center to examine vehiclestability and control characteristics. The vehicle wasshown to be longitudinally stable or neutrally stable forangles of attack greater than 20 deg and was found to belongitudinally controllable with less than half of the totalbody flap deflection capability across the angle of attackrange at both Mach 6 and Mach 10. The configuration wasshown to be directionally unstable, and the use of reactioncontrol jets (RCS) is necessary to control the vehicle athigh angles of attack. The vehicle pitching moment datafor the baseline configuration showed an unexpected cross-over trend with Mach number that, while not completelyunderstood from a fluid-dynamics perspective, is supportedby CFD calculations, high supersonic data, andhypersonic configuration build-up data. Both Machnumber and real gas effects on longitudinal aerodynamicswere shown to be small relative to X-33 control authority.
The hypersonic aerodynamic data generated atLangley has been used to populate the flight database forthe X-33 vehicle. This database will be used to design theflight control laws and to optimize X-33 flight trajectoriesfor demonstration of RLV technologies.
Acknowledgements
The authors wish to thank the many techniciansand engineers at NASA LaRC and the AerodynamicsTeam at Lockheed-Martin Skunk Works without whosehelp this work would not have been possible.
References
1. Reed, R. D.: Wingless Flight, The Lifting BodyStory. NASA SP-4220, 1997.
2. Bekey, I., Powell, R., and Austin, R., ÒNASAStudies Access to Space,Ó Aerospace America, May1994, pp. 38-43
3. Horvath, T. J., Berry, S. A., Hollis, B. R., Liechty,D. S., Hamilton, H. H., and Merski, N. R.: ÒX-33Experimental Aeroheating at Mach 6 Using PhosphorThermography,Ó AIAA 99-3558, June 1999.
4. Hollis, B. R., Horvath, T. J., Berry, S. A.,Hamilton, H. H., and Alter, S. J.: ÒX-33Computational Aeroheating Predictions andComparisons with Experimental Data.Ó AIAA 99-3559, June 1999.
5. Reasor, J. S., Ramsey, J. F.: ÒA Comparison ofWind Tunnel Data Taken For the X33 604B0002F/GConfiguration,Ó LMSW 604AERO5046, June 1998.
6. Micol, J. R.: ÒLangley Aerothermodynamic FacilitiesComplex: Enhancements and Testing Capabilities,ÓAIAA 98-0147, January 1998.
7. Micol, J. R.: ÒExperimental and PredictedAerodynamic Characteristics of a Proposed AssuredCrew Return Vehicle (ACRV) Lifting-BodyConfiguration,Ó AIAA 90-1403, June 1990.
8. Brauckmann, G. J., Paulson, J. W. Jr.,Weilmuenster, K. J.: ÒExperimental andComputational Analysis of Shuttle OrbiterHypersonic Trim Anomaly,Ó Journal of Spacecraftand Rockets, Vol. 32, No. 5, pp. 758-764,September-October 1995.
9. Hollis, B. R., Thompson, R. A., Murphy, K. J.,Nowak, R. J., Riley, C. J., Wood, W. A., Alter, S.J., and Prabhu, R.: ÒX-33 Aerodynamic andAeroheating Computations for Wind Tunnel andFlight Conditions,Ó AIAA 99-4163, August 1999
10. Jackson, C. M., Corlett, W. A., and Monta, W. J.:ÒDescription and Calibration of the Langley UnitaryPlan Wind Tunnel,Ó NASA TP-1905, November1981.
11. Prabhu, R.: "A Computational Study of an X-33Configuration at Hypersonic Speeds,Ó NASA CR-1999-209366, July 1999.
8
Table 1. Reference DimensionsDimension Full Scale .007-scale
Sref 1608 ft2 11.346 in2
Lref 63.2 ft 5.309 inBref 36.6 ft 3.074 in
c.g.ref (66%) 41.7 ft 3.506 in
Table 2. Summary of Test Parametrics
Configuration20Ó Mach 6
Air31Ó Mach 10
Air*20Ó Mach 6
C F 422Ó Mach 20
He**
Baseline Sting/Blade Sting/Blade Sting/Blade Sting-15¡ body flap Sting/Blade Blade Blade+10¡ body flap Sting/Blade Blade Blade Sting+20¡ body flap Sting/Blade Blade Blade Sting+30¡ body flap Sting/Blade Blade Sting/Blade Sting
-30¡ elevon Sting/Blade Blade Blade Sting-20¡ elevon Sting/Blade Blade Blade Sting-10¡ elevon Sting/Blade Blade Sting+10¡ elevon Sting/Blade Blade Sting+20¡ elevon Sting/Blade Blade Sting+30¡ elevon Sting/Blade Blade Sting
Baseline -Fins Sting/Blade Blade Blade StingBaseline -Flaps Sting/Blade Blade Blade Sting
Baseline -Fins,Flaps Sting/Blade Blade Blade StingBaseline -Fins,Flaps,Engine Sting/Blade Blade
*Unable to get high angle of attack range with sting mount. **All runs in Mach 20 Helium without vertical tails.
Table 3. Nominal Flow ConditionsFacil i ty Mach q¥ P t (psi) Tt (¡R) Re/ft
20Ó Mach 6 Air 6 2.0 125 910 2.031Ó Mach 10 Air 10 2.2 1450 1800 2.220Ó Mach 6 CF4 6* 0.9 950 1150 0.422Ó Mach 20 He 20 1.7 1000 530 7.5*Mach 17-20 simulation due to increase in r2/r¥
Table 4. Balance Matrix
Balance20Ó Mach 6
Air31Ó Mach 10
Air20Ó Mach 6
C F 422Ó Mach 20
HeSS08 Sting/Blade Sting/Blade StingSS17A Sting/Blade Sting/Blade Blade2045 Sting Sting2047 Sting2048 Sting
Table 5. ±0.5%-Full Scale Balance UncertaintiesFacil i ty q¥ CN CA Cm Cl Cn CY
20Ó Mach 6 Air 2 0.02203 0.00441 0.00291 0.00143 0.00072 0.0044131Ó Mach 10 Air 2.2 0.02003 0.00401 0.00264 0.00130 0.00065 0.0040120Ó Mach 6 CF4 0.9 0.02448 0.00490 0.00646 0.00159 0.00159 0.0049022Ó Mach 20 He 1.7 0.01037 0.00181 0.00195 0.00067 0.00067 0.00207Based on highest full scale balance loads when data obtained from multiple balances
9
70.0û�
40.2û�
19.3 m(63.2 ft)
23.2 m(76.1 ft)
20.0û�
R 1.21 m(3.97 ft)
Front View
Port Side View
Leeward View Windward View
Canted fins
Body Flaps
Twin Vertical Tails
Figure 1. Sketch of Full-Scale X-33 604B0002F/G Configuration
-10
0
10
20
30
40
50
0 100 200 300 400 500
a (
deg)
0
2
4
6
8
10
12
0 100 200 300 400 500
Mac
h
020406080
100120140
0 100 200 300 400 500
Re L (
/106 )
time (sec)
Figure 2. Typical X-33 Trajectory Parameters Figure 3. Installation of 0.7% X-33 on Sting (top) andBlade (bottom) mounts in 31-Inch Mach 10 Tunnel
1 0
-0.5
-0.25
0
0.25
0.5
0.75
1
1.25
1.5
-10 0 10 20 30 40 50
M6-Exp.M10-Exp.M6-CFD(LAURA)M6-CFD(GASP)M10-CFD(LAURA)M10-CFD(GASP)
CN
a (deg)
±0.5% uncertainty (balance full-scale loads)
Figure 4(a) . Comparison of Measured and PredictedNormal Force Coefficient for Mach 6 and 10
0.05
0.075
0.1
0.125
0.15
0.175
0.2
0.225
0.25
-10 0 10 20 30 40 50
M6-Exp.M10-Exp.M6-CFD(LAURA)M6-CFD(GASP)M10-CFD(LAURA)M10-CFD(GASP)
CA
a (deg)
±0.5% uncertainty (balance full-scale loads)
Figure 4 (b) . Comparison of Measured and PredictedAxial Force Coefficient for Mach 6 and 10
-0.01
-0.005
0
0.005
0.01
0.015
0.02
0.025
0.03
-10 0 10 20 30 40 50
M6-Exp.M10-Exp.M6-CFD(LAURA)M6-CFD(GASP)M10-CFD(LAURA)M10-CFD(GASP)
Cm
a (deg)
±0.5% uncertainty (balance full-scale loads)
Figure 4 (c ) . Comparison of Measured and PredictedPitching Moment Coefficient for Mach 6 and 10
-0.2
0
0.2
0.4
0.6
0.8
1
-10 0 10 20 30 40 50
M6-Exp.M10-Exp.M6-CFD(LAURA)M6-CFD(GASP)M10-CFD(LAURA)M10-CFD(GASP)
CL
a (deg)Figure 4(d). Comparison of Measured and PredictedLift Coefficient for Mach 6 and 10
0
0.2
0.4
0.6
0.8
1
1.2
-10 0 10 20 30 40 50
M6-Exp.M10-Exp.M6-CFD(LAURA)M6-CFD(GASP)M10-CFD(LAURA)M10-CFD(GASP)
C D
a (deg)Figure 4(e). Comparison of Measured and Predicted DragCoefficient for Mach 6 and 10
-1
-0.5
0
0.5
1
1.5
2
-10 0 10 20 30 40 50
M6-Exp.M10-Exp.M6-CFD(LAURA)M6-CFD(GASP)M10-CFD(LAURA)M10-CFD(GASP)
L/D
a (deg)Figure 4(f). Comparison of Measured and PredictedLift-to-Drag Ratio for Mach 6 and 10
1 1
-0.01
-0.0075
-0.005
-0.0025
0
0.0025
0.005
0.0075
0.01
-10 0 10 20 30 40 50
M6-Exp.
M10-Exp.
Cl b
a (deg)Figure 5(a). Dihedral Effect for Mach 6 and 10Experimental Data
-0.01
-0.0075
-0.005
-0.0025
0
0.0025
0.005
0.0075
0.01
-10 0 10 20 30 40 50
M6-Exp.
M10-Exp.
Cn b
a (deg)Figure 5(b). Directional Stability for Mach 6 and 10Experimental Data
-0.08
-0.06
-0.04
-0.02
0
0.02
15 20 25 30 35 40 45 50
M6-Exp.M10-Exp.M6-CFD(LAURA)M6-CFD(GASP)M10-CFD(LAURA)M10-CFD(GASP)
D Cm
bf
a (deg)
dbf=10¡
dbf=20¡
dbf=-15¡
dbf=30¡
Figure 6(a) . Comparison of Measured and PredictedBody Flap Control Authority for Mach 6 and 10
-0.015
-0.01
-0.005
0
0.005
0.01
15 20 25 30 35 40 45 50
M6-Exp.M10-Exp.
DC
me
l
a (deg)
del=-30¡
del=-20¡
del=-10¡
del=10¡
del=20¡
del=30¡
Figure 6(b). Measured Elevon Control Authority forMach 6 and 10
-0.005
0
0.005
0.01
0.015
-10 0 10 20 30 40 50
Cm
a (deg)
± 0.5% Accuracy
Squares - Mach 6-Exp.Circles - Mach 10-Exp.
Solid - Blade DataOpen - Sting Data
Figure 7(a). Repeatability of Mach 6 and 10Experimental Data
-0.06
-0.05
-0.04
-0.03
-0.02
-0.01
0
0.01
0.02
-10 0 10 20 30 40 50
dbf=10¡
Cm
a (deg)
Squares - Mach 6-Exp.Circles - Mach 10-Exp.
Solid - Blade DataOpen - Sting Data
dbf=20¡
Figure 7(b). Measured Body Flap Control AuthorityRelative to Repeatability of Mach 6 and 10 Exp. Data
1 2
-0.01
-0.005
0
0.005
0.01
0.015
0.02
0.025
0.03
-10 0 10 20 30 40 50
M6-Exp.M10-Exp. UPWT-Exp.M4.63-CFD (LAURA)M4.63-CFD (Inviscid)
Cm
a (deg)
±0.5% uncertainty (balance full-scale loads)
Mach=6
Mach=10
Mach=4.63
Figure 8. Comparison of Measured Pitching MomentCoefficient for Mach 4.63, 6, and 10
Figure 9(a). Schlieren photograph at a=48 deg in20-Inch Mach 6 Tunnel
Figure 9(b). Schlieren photograph at a=48 deg in20-Inch Mach 6 CF4 Tunnel
-0.2
0
0.2
0.4
0.6
0.8
1
-10 0 10 20 30 40 50
M6-Air (g=1.4)M10-Air (g=1.35)M6-CF4 (g=1.22)M20-Helium (g=1.67)
CL
a (deg)Figure 10(a). Effect of Mach Number and Shock DensityRatio on Measured Lift Coefficient
-0.2
0
0.2
0.4
0.6
0.8
1
-10 0 10 20 30 40 50
M6-Air (g=1.4)M10-Air (g=1.35)M6-CF4 (g=1.22)M20-Helium (g=1.67)
CD
a (deg)Figure 10(b). Effect of Mach Number and ShockDensity Ratio on Measured Drag Coefficient
-0.01
-0.005
0
0.005
0.01
0.015
0.02
-10 0 10 20 30 40 50
M6-AirM10-AirM6-CF4M20-Helium
Cm
a (deg)
±0.5% uncertainty (balance full-scale loads)
M=20, g=1.67
M=6, g=1.4
M=6, g=1.22
M=10, g=1.35
Figure 10(c). Effect of Mach Number and Shock DensityRatio on Measured Pitching Moment Coefficient.
1 3
-0.01
-0.005
0
0.005
0.01
0.015
0.02
0 10 20 30 40 50
M6-Air CFD (Inviscid)M10-Air CFD (Inviscid)M6-CF4 CFD (Inviscid)M20-Helium CFD (Inviscid)
Cm
a (deg)
M=20, g=1.67
M=6, g=1.4
M=6, g=1.22
M=10, g=1.35
Figure 10(d). Effect of Mach Number and Shock DensityRatio on Predicted Pitching Moment Coefficient.
-0.05
-0.045
-0.04
-0.035
-0.03
-0.025
-0.02
-0.015
-0.01
15 20 25 30 35 40 45 50
M6-Air ( g=1.4)M10-Air ( g=1.35)M6-CF4 (g=1.22)M20-Helium (g=1.67)D
Cm
bf
a (deg)
dbf=10¡
dbf=20¡ M20 Helium
M20 Helium
M6 CF4
M6 CF4
Figure 10(e). Effect of Mach Number and Shock DensityRatio on Measured Body Flap Control Authority
-0.01
0
0.01
0.02
0.03
0.04
0.05
0.06
0.07
0.08
0.09
0.1
20 25 30 35 40 45 50
M6-Baseline Without Flaps/FinsM6-Baseline Without FlapsM6-Baseline Without FinsM6-BaselineM10-Baseline Without Flaps/FinsM10-Baseline Without FlapsM10-Baseline Without FinsM10-Baseline
Cm
a, (deg)Figure 1 1 . Comparison of Measured Pitching MomentCoefficient for Mach 6 and 10 for Configuration Build-UpStudies