X-231B technology demonstration for in situ treatment of ...
86
Transcript of X-231B technology demonstration for in situ treatment of ...


... . . . , . . ... ............ ... .... . .., ~~ .. I
~ . . , . , . . , . . .

ORNLfI'M-12259
q5 1.1 ENVIRONMENTAL, SCIENCES DIVISION I I
X-231B Technology Demonstration for In Situ Treatment of Contaminated Soil: Laboratoty Evaluation of Chemical Oxidation Using Hydrogen Peroxide
D. D. Gates R. L. Siegrist
Environmental Sciences Division Publication No. 4106
Date Published: September 1993
Prepared for US. Department of Energy Portsmouth Gaseous Diffusion Plant
Piketon, Ohio (64 70 36 00 1)
Prepared by the OAK RIDGE NATIONAL LABORATORY
Oak Ridge, Tennessee 3783 1-6285 managed by
MARTIN MARIETTA ENERGY SYSTEMS €or the
U.S. DEPARTMENT OF ENERGY under contract DE-AC05-840R21400
3 Y 4 5 b 0 3 7 7 7 2 b 3


. . . . .
L I S T O F H G U R E S .................................................. v
LIST OF TABLES ................................................... vii
ACRONYMS AND ABBREVIATIONS .................................. ix
PREFACE ......................................................... xi
... ACKNOWLEDGMENTS .............................................. xlll
ABSTRACT ........................................................ xv
1 . INTRODUCTION ................................................ 1 1.1 PROCESS DESCRIPTION ..................................... 1
1.1.1 Chemical Oxidation Processes ............................... 1 1.1.2 Application of Chemical Oxidation with H,O, . . . . . . . . . . . . . . . . . . . 2
1.1.2.1 Use of H202 in Aqueous Systems . . . . . . . . . . . . . . . . . . . . . . . 2 1.1.2.2 Use of H, 0, in Soil Systems .......................... 2
1.2 EXPERIMENTAL STUDIES . . . . . . . . . . . . . . . . . . . . . . . . . . . . . . . . . . . . 4
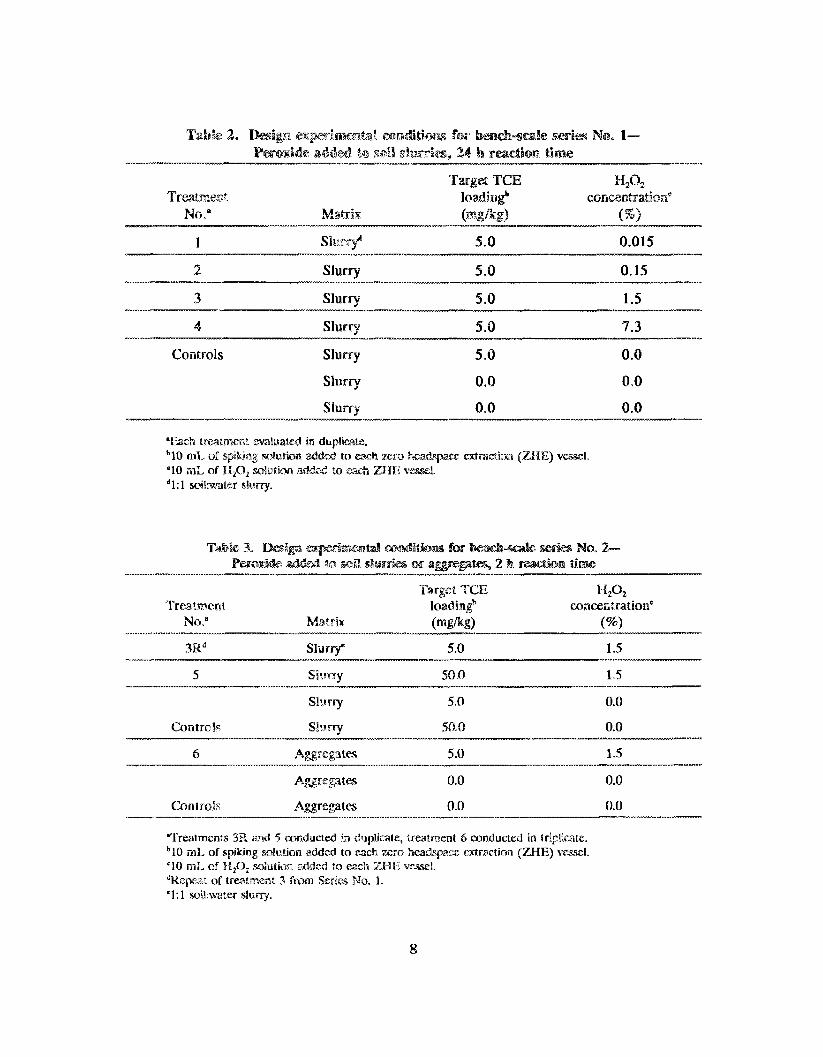
2 . BENCH-SCALE STUDIES . . . . . . . . . . . . . . . . . . . . . . . . . . . . . . . . . . . . . . . . . 6 2.1 OBJECTIVES AND SCOPE .................................... 6 2.2 MATERIALS AND METHODS ................................. 9
2.2.1 Experimental Apparatus . . . . . . . . . . . . . . . . . . . . . . . . . . . . . . . . . . . 9 2.2.2 Soil Sample Collection .................................... 11 2.2.3 Soil Slurry Preparation .................................... 14 2.2.4 Peroxidation of TCE-Contaminated Slurries Experiment
Series No.1 Methods ...................................... 14 2.2.5 Peroxidation of TCE-Contaminated Soil Slurries and Aggregates..
Experiment Series No . 2 Methods ............................ 16 2.2.6 Analysis . . . . . . . . . . . . . . . . . . . . . . . . . . . . . . . . . . . . . . . . . . . . . . . . 16
2.3.1 TCE Destruction Efficiency ................................. 18 2.3.2 Effects on System Chemistry ................................ 26
2.3 BENCH-SCALE STUDY RESULTS . . . . . . . . . . . . . . . . . . . . . . . . . . . . . . 18
2.4 BENCH-SCALE STUDY DISCUSSION . . . . . . . . . . . . . . . . . . . . . . . . . . . . 26
3 . PILOT-SCALE TREATABILITY STUDIES ............................ 41 3.1 OBJECTIVES AND SCOPE ..................................... 41 3.2 MATERIALS AND METHOD ................................... 43
3.2.1 Experimental Apparatus ................................... 43 3.2.2 Experimental Methods . . . . . . . . . . . . . . . . . . . . . . . . . . . . . . . . . . . . 43 3.2.3 Analysis . . . . . . . . . . . . . . . . . . . . . . . . . . . . . . . . . . . . . . . . . . . . . . . 47
... 111

3.3 TREATA4931L71TYY S'I'UDY RESIJLTS . . . . . . . . . . . . . . . . . . . . . . . . . . . . . 48 3.4 TREATABILITY STUDY DISCUSSION ........................... 48
4 . DISCIJSSTON . . . . . . . . . . . . . . . . . . . . . . . . . . . . . . . . . . . . . . . . . . . . . . . . . . . 55
5 . CONCLUSIONS ,W .D 1IECOMMENDATIONS ........................ 59 5.1 CONCLIJSIONS . . . . . . . . . . . . . . . . . . . . . . . . . . . . . . . . . . . . . . . . . . . . . 59 5.2 RECOMMENDATIONS . . . . . . . . . . . . . . . . . . . . . . . . . . . . . . . . . . . . . . . 59
6 . REFERENCES . . . . . . . . . . . . . . . . . . . . . . . . . . . . . . . . . . . . . . . . . . . . . . . . . . . 61
APPENDIX A . CALCULATION OF 'TCE DISTRIBUTION IN CONTROL BENCH EXPERIMENT . . . . . . . . . . . . . . . . . . . . . . . 63
iv

LIST OF FIGURES
Figure Paae
10
11
12
13
14
15 16 17 18
19
20 21 22 23 24 25 26 27 28 29
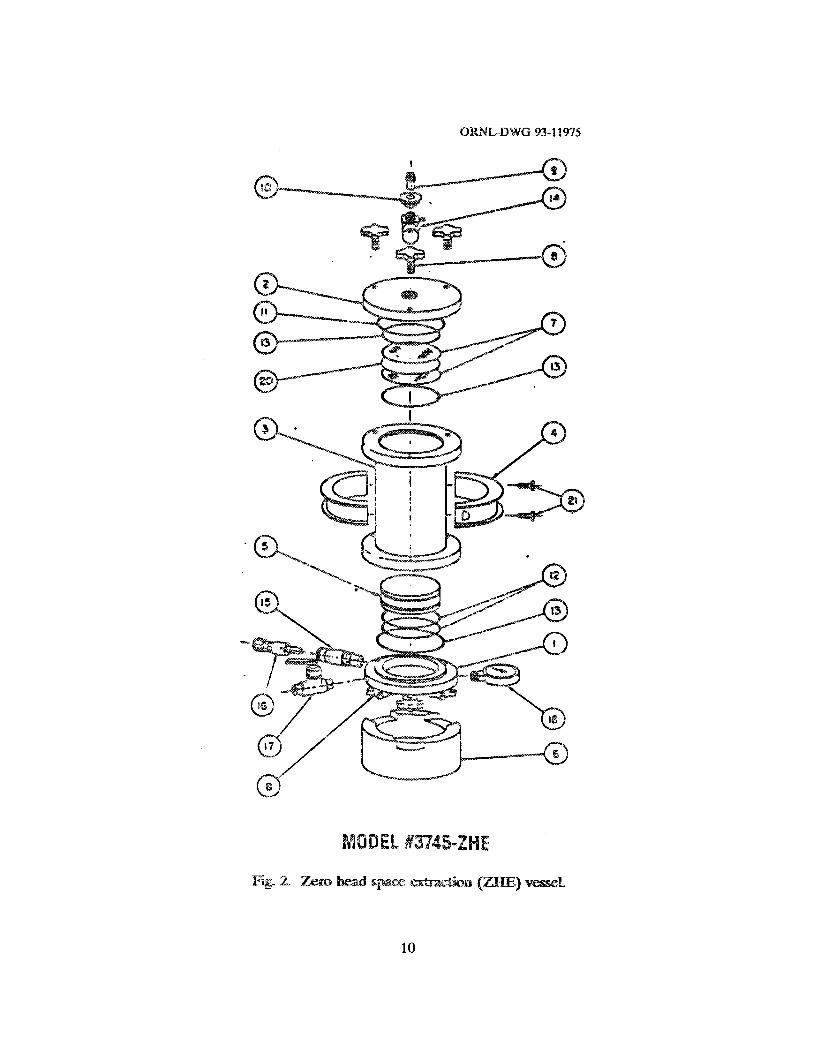
Bench-scale experimental method summary . . . . . . . . . . . . . . . . . . . . . . . . . . . . 7 Zero head space extraction vessel ................................... 10
11 Injection of fluid into a zero headspace extraction vessel .................. 15 Photograph of extraction of aqueous samples from zero headspace extraction vessel ................................................ 17 TCE concentration reduction in bench-scale experiment No . 1 . . . . . . . . . . . . . 22 TCE removal in bench-scale study No . 1 .............................. 25 TCE removal efficiency in bench-scale study No . 2 . . . . . . . . . . . . . . . . . . . . . . 27 Pressure changes following hydrogen peroxide addition to TCE-contaminated soil slurries in bench scale study No . 1 ................. 29 pH changes following hydrogen peroxide addition to TCE-contaminated soil slurries in bench scale study No . 1 ................................... 30 Total organic carbon changes following hydrogen peroxide addition to TCE-contaminated soil slurries in bench scale study No . 1 ................. 31 Iron changes following hydrogen peroxide addition to TCE-contaminated soil slurries in bench scale study No . 1 . . . . . . . . . . . . . . . . . . . . . . . . . . . . . . . . . . . 32 pH changes following hydrogen peroxide addition to TCE-contaminated soil slurries and aggregates in bench scale study No . 2 . . . . . . . . . . . . . . . . . . . . . . . 33 Total organic carbon changes following hydrogen peroxide addition to TCE-contaminated soil slurries and aggregates in bench scale study No . 2 . . . . . 34 TCE removal with peroxide addition at different initial TCE loading levels . . . . 36 TCE removal as a function of peroxide loading ......................... 37 Increase in soluble total organic carbon after the addition of peroxide . . . . . . . . 38 TCE removal with the addition of peroxide at different initial TCE concentrations and reaction times ................................... 39 TCE removal as a function of reaction time (peroxide strength constant at1.5%). . . . . . . . . . . . . . . . . . . . . . . . . . . . . . . . . . . . . . . . . . . . . . . . . . . . . . 40 ORNL soil-core mixing apparatus .................................. 44 Mixing blade design used during peroxidation treatability studies . . . . . . . . . . . 45 Apparatus used during peroxidation trcatability studies . . . . . . . . . . . . . . . . . . 46 Peroxidation treatability study results . . . . . . . . . . . . . . . . . . . . . . . . . . . . . . . . 50 Change in soil moisture content with fluid addition . . . . . . . . . . . . . . . . . . . . . . 51 Portsmouth soil before treatment ................................... 52 Portsmouth soil after treatment ..................................... 52 Off-gas generation after peroxide addition ............................ 53 TCE removal in bench- and pilot-scale studies ......................... 56 TCE removal in bench- and pilot-scale studies ......................... 57
Photograph of a disassembled zero headspace extraction vessel . . . . . . . . . . . . .
V


Table Page
1 2
3
8
9 10
11 12 13
Comparison of peroxidation experiments ............................ added to soil slurries. 24 h reaction time ............................ 8
added to soil slurries or aggregates. 2 h reaction time ................... Soil properties typical of the X-231B site ........................... 13 Soil slurry composition .......................................... 13 Methods of analysis for peroxide bench-scale studies ................... 19 Bench-scale study results with peroxide added to TCE-contaminated soil slurries -24 h reaction time .................................. 20 Bench-scale study results with peroxide added to TCE-contaminated soil slurries or aggregates-2 h reaction time 21 TCE recovery in control studies ................................... 24 Bench-scale study summary of peroxidation of TCE-contaminated soil slurries .................................................. 28 Peroxide treatability study design experimental conditions ............... 42 Methods of analysis for the peroxide treatability study .................. 49 Peroxidation treatability study results summary ........................ 49
5 Design experimental conditions for bench-scale series No . l-Peroxide
Design experimental conditions for bench-scale series No . 2-Peroxide 8
.........................


ACRONYMS AND ABBREVIATIONS
deionized
U.S. Environmental Protection Agency
ferrous iron
gas chromatograph
hydrogen peroxide
octachlorodibenzo-p-dioxin
outer diameter
Oak Ridge National Laboratory
perchloroethylene
pentachlorophenol
Resource Conservation and Recovery Act
revolutions per minute
trichloroethylene
toxic characteristic leaching procedure
total organic carbon
U.S. Department of Energy
volatile organic analysis
volatile organic compounds
zero headspace extraction
DI
EPA
Fez'
GC
H 2 0 2
OCDD
OD
ORNL
PCE
PCP
RCRA
RPM
TCE
TCLP
TOC
DOE
VOA
vocs
ZHE


PREFACE
Fine-textured soil and sediments contaminated by trichloroethylene (TCE) and other chlorinated organics present a serious environmental restoration challenge at U.S. Department of Energy (DOE) sites. Although in situ processes such as bioremediation and soil vapor extraction are feasible at sites with permeable soils (e.g., K > PO-3 cmts), their application is normally infeasible in wet, clay soils, and sediments. Environmental restoration of these sites has normally consisted of either (1) excavation and on-site storage, off-site land filling, or thermal treatment; or (2) in-place containment by capping and slurry wall emplacement.
In November 1990, DOE and Martin Marietta Energy Systems, Inc., initiated a research and demonstration project at Oak Ridge National Laboratory (ORNL). The goal of the project was to demonstrate a feasible and cost-effective process for closure and environmental restoration of the X-231B Solid Waste Management Unit at the DOE Portsmouth Gaseous Diffusion Plant located in southern Ohio. Silt and clay deposits (K < 1U6 ends) beneath the unit were contaminated with volatile organic compounds (VOCs) such as TCE (approximately 1-100 ppm range) and low levels of radioactive substances. The shallow groundwater (water table at approximately 12-14 ft depth) was also contaminated, and some contaminants were at levels well above drinking water standards.
After an initial technology evaluation and screening phase, the X-2313 project focused on research and demonstration of in situ vapor stripping, chemical oxidation, and solidification; and reagent delivery to the subsurface was achieved by soil mixing techniques. The primary objectives of the project were to develop processes as necessary and appropriate and to characterize the operation and performance of each process with regard to in situ treatment of VOCs in clay soils. Secondary objectives were to determine the treatment process zone of influence; the treatment process effects on air emissions, soil chemistry, and microbiology properties; and the fate of heavy metal and radioactive materials. Soil homogenization and translocation were also studied.
Since July 1991 varied research activities have been conducted. Site characterization and contaminant modeling work has included use of a hydraulic probe for collection of nearly 200 soil samples with on-site laboratory analysis for target VcTCs. These data were used for statistical simulation and 3-dimensional modeling of contaminant distribution. A series of laboratory experiments were completed using bench-scale apparatus as well as a pilot-scale soil mixing system in which soil cores from the site were treated. A full-scale field demonstration was completed at the X-2313 site in June 1992. Replicated tests of in situ vapor stripping, peroxidation, and solidification were made in soil columns measuring 10 ft. in diameter and 15 to 22 ft. deep. A computerized data acquisition system linked to approximately 60 sensors enabled near-continuous monitoring of prows.. operation and performance (e.g., recording intervals of' 0.2 to 2 min. for auger psition, off-gas air flow rate and VOC content, soil vapor pressure and temperature). In addition, nearly 500 soil and gas samples were collected before, during, and after soil
xii
Many individuals and organizations have contributed to the successhl completion of this research project. Technical staff at O W L provided outstanding support in completing laboratory work ia a timely and effective manner. Significant contributions were also made by university research collaborators. The following individuals are recognized for their contributions:
0. M. West C. M. Morrissey D. S. Marshall H. L Jennings A. J. Lucero D. W. Greene R. A. Jenkins M. I”. Maskarinec R. Eiger C. Rogers N. M. Ferguson
Environmental Sciences Division Environmental Sciences Division Environmental Scienus Division Chemical Technology Division Chemical Technology Division Wealth and Safety Research Division Analytical Chemistry Division Analytical Chemistry Division Analytical Chemistry Division Analytical Chemistry Division Analytical Chemistry Division
D. Hurst University of T e r n w e e , Knoxville K. G. Robinson University of Tennessee, Knoxville S. Schmunk Michigan Teehnobgical University


Treatability studies were conducted as part of a comprehensive research project initiated to demonstrate as well as evaluate in situ treatment technologies for volatile organic compounds (VOCs) and radioactive substances in wet, slowly permeable soils. The site of interest for this project was the X-W1B Oil Biodegradation Unit at the Portsmouth Gaseous Diffusion Plant, a U.S. Department of Energy (DOE) facility in southern Ohio. This report describes the. treatability studies that investigated the feasibility of the application of low-strength hydrogen peroxide (H202) solutions to treat trkhioroethylene (TCE)-eontaminated soil.
The processes investigated in this research included the oxidative destruction of VOCs and a combination of deep soil mixing and chemical oxidation. Upon introduction of a weak peroxide solution ( 4 ~ 5 % ) to a contaminated soil, the peroxide nonselectively oxidizes any available oxidizable matter, including the target contaminants (in these studies, TCE). Two types of laboratory studies were conducted to evaluate peroxidation: bench-scale studies conducted in 300-mL zero headspace extraction (ZHE) vessels; and pilot-scale treatability studies conducted using -7.5-L soil columns. All laboratory studies were conducted using soils retrieved from the Portsmouth X-231B site and artificidy contaminated with TCE at concentrations comparable to the level of contamination found at the X-231B site.
The bench-scale studies demonstrated that TCE reductions as great as 98% of initial concentration could be achieved when H,O, is added to TCE-contaminated slurries preparedl from Portsmouth soil, Evaluation of reaction by-products by gas chromatograph analysis revealed that no TCE daughter products were formed, which supports the conclusion that complete destruction of 'ICE resulted from the addition of H202 to the contaminated soils. These studies also indicated that peroxidation is a rapidly occurring reaction (2 h or less), and process efficiency appears to be independent of initial TCE concentration. The studies; also demonstrated that TCE degradation efficiency increased with increasing peroxide strength.
The pilot-scale studies demonstrated that Portsmouth soil physical properties would not be adversely impacted by the addition of a weak peroxide (5%) solution at a b e l equal to 10% of the pretreated soil volume. The off-gas generation rate and composition were also monitored during the pilot-scale studies. It was observed during the pilot studies that most of the off-gas that was generated (>90%) evolved within 10 min of H,B, addition, giving further evidence of the rapid rate of peroxidation reactions. A decrease in TCE destruction efficiency was noted when decreasing volumes of equal strength H,O, solutions were used to treat contaminated soils, which suggests that the process may be mass transfer limited.
On the bask of the results of this investigation, peroxidation of contaminated soils at the Portsmouth X-W1B site appears to be a viable treatment technology. Further experimentation and field demonstration will be required to optimize the process.


Eknch-, pibt- and fieeld-smle studies were conducted to determine the technical feasibility of in situ soil mixing combined with hydrogen p e r o d e (H20,) injection as an environmental restoration technique for slow permeable soil contaminated with trichtoroethylene (TCE) and other volatile organic compounds (VOCs). This repart describes the processes investigated and summarizes the findings of the laboratory studies completed to support the design and conduct of the field demonstration.
Chemical oxidation processes have been used to effectively treat many compounds that are refractory, toxic, or inhibitory to conventional wastewater treatment processes. Oxidants commonly applied €or this purpose include H,O, ozone (0,) and chlorine dioxide (Clod. Hydrogen peroxide is often selected as an oxidant because of its ease of application (at low concentrations), availability and reasonable cost, and its ability to oxidize a wide variety of compounds (Weber 1972). Although W,O, itself is only a moderate oxidant, it has been demonstrated that in the presence of ferrous iron (Fe2"), Fenton's reagent, which has p rovd to be a very powerful and effective oxidizing agent, is formed. Fenton's magent refers to the catalytic decomposition of H202 in the presence of Fez* with the generation of hydroxyl radicals. A wkkly accepted mechanism for this reaction is given Mow:
The oxidation of organic compounds by Fenton's reagent can proceed by both chain and nonchain mechanisms. The rate limiting step is the formation of the hydroxyl radicals.
+ H 2 0 , - pe3+ + OH- + Ho* chain ini t iat ion (7) R-H + HO* + R* + n20 chain propagation (8) Re + H202 -+ ROH + HQ* chain pxopaga ti OR (9)
Fe2+ + HQ* --c Fe3+ + OH- chain termination (18) Re + Ho* -, RQH non-chain termination (11)
2R. -4 Products non-chain termination (12)

Bowcs et al. (1359) invmtigatcd the applicability of II 0 as a biorcmcdiatiow 2 .
enhancer for an industrial wastewatea contaminated with 2,4 dichlnrophenol and dinitro- ortho-rraal. Bowc~s ct al. dcfinrd the mntaminants a ing "non-biscompatible" becauss: thcy are klpown to be toxic, inhibitory, or refrac to cnmnmn micrmrganisms, H,O, was added to thc wastewater itn baSc1-1 reactors over a period of 4 h. '1: used batch-fed rcactors s d d with waste activatexl sludge to evaluate the b of tbe reaction products and noted that thc peroxide-treated %askwafer wa mcxe biodegradahlc than the untreated wastewater.
Recent works have tcgurn to fcpcus os1 thc me of chemical oxidation as a so,il/sediment romnediation procam Wavikeimar and Gurol (191) percolated H202 through
2

sand columns pre-contaminated with pentachlorophenol (PCP) and TCE and observed a 98% reduction in contaminant concentration following treatment with N,O, Gurol and Ravikumar (1991) furthcr explored the application of Fe(n) in conjunction with H,O, to sand columns precontaminated with PCE and TCE to determine if the addition of Fe(1l) would increase process efficiency by supporting the production of Fenton's reagent. The authors concluded that the addition of Fe@) did indeed enhance the chemical oxidation of BCP and TCE in the test sand columns. Watts e t al. (1990) in column studies similar to those of Gurol and Ravikumar did not observe any increase in PCP oxidation when Fe(1l) amendments were made to natural soils spiked with PCP. Both Gurol and Ravikumar and Watts ct al. measured stoichiometric increase in chloride concentration following H202 addition and used this finding to support their conclusions that chemical oxidation was the mechanism of contaminant destruction.
h u n g et al. (1992) and Watts et al. (1991) conducted laboratory studies of peroxidation of soils contaminated with PCP and octachlorodibenzo-p--dioxin (OCDD), respectively. In the Leung e t al. studies, silica sand and two natural soils were artificially contaminated with PCP. In batch test, 2.5 g of contaminated soil werc treated with 12.5 mL of 6.5% H,O, (H20, load = 327 g/kg soil) followed by the addition of 1 mL of FeSO,. More than 99.9% of the initial PCP was degraded in 24 h. h u n g also noted a decrease in total organic carbon (TQC) accompanied PCP destruction, and the oxidative processes proceeded without iron amendments in natural soils. Watts et al. treatcd 1 g aliquots of either natural soils or silica sand contaminated to 200 pg OCDDkg with 1 mC , and 2 mL of 12% H,O,. Reactant addition was repeated four times for each soil sample. Watts also conducted studies in which the M,O, concenlrahion was varied to either 3.5% or 35%, and temperatures of 20, 40, 60, and 80" C were evaluated. Watts observed that OCDD destruction was inversely related to soil organic carbon content, which thc researchers concluded reflected the competition of soil organic carbon and OGDD for oxidants. The maximum QGDD removal by peroxidation found in their studies was 96%. Peroxidation of contaminant material was found to increase with incrcasing temperature but to be independent of H,O, concentration for the natural soils studied. It should be noted that ferrous iron amendments wcrc used in all of the studies conducted by Watts et al,
Watts (1992) reported the field application of peroxidation of contaminated soil at an equipment storage yard in Reno, Nevada. This work included the excavation and batch treatment of soil contaminated with petroleum hydrocarbons (ex situ treatment). Excavated soil was treated in the batch mode at pW 3 with no soluble iron addition and the addition of H,02 of either 2 or 7% strength (weight) to the reactors at a volume equal to four times the field capacity of the untreated soil. After two H202 additions the target contaminant level was reduced to lbclow detection limits [2008 mg/kg TPH (total petroleum hydrocarbons) reduced to < 100 mgkg TPI-X].
3

4

Tabk 1. Cbmparison of permridation expedments
Experiment type/ research
organization Scale Scope Approach
Effect of reaction Peroxide added to %HEa time and peroxide soil slurries
(ORNL) Bench s t rengt b and crumbs
studies Impact on soil mixed into Treatability Peroxide injected and
( O R W ) Pilot properties soil cores
TCE fate Soil. minicolumns studies spiked with
Bench Fate of TCE radiolabeled TCE (-7 Metals
mobilization studies (UTKI Bench metals soil slurries
Adsorption isotherms Mobilization of developed using
In situ injection and Demonstration mixing of peroxide in
(QRNL) Field contaminated soils
%HE = zero headspace extraction vessel. bOKNL is Oak Ridge National Laboratory. WTK is the University of Tennessee, Knoxville.
5
1. To determine if W20, marEd oxidize TCE in a clay soil matrix witho of r'e01).
6

ORNL-DWG 93-1 19'74
Prepare soil slurry or aggregates for loading
n
Spike contents of ZHE i___________li
Peroxide addition
n Analyze samples for I YOCS
Fig. 1. Bench-scale experimental methad summary.
7
a 5 .0 1 .s Slurry 5.0 7.3
c0Titr01s 5.0 0.0

The bench studies were conducted using 1-L gas-tight stainless steel reactors identical to those used for TCLP [US. Environmental Protection Agency (EPA) Method S W W ] analysis manufactured by Associated Design and Manufactuxkg Company (Figs. 2 and 3). The apparatus included the following parts:
1-L stainless steel evacuation chamber (Part No. 3);
stainless steel pistoq (Part No. 5) which can be moved within the evacuation chamber to change the dimension of the open space in the evacuation chamber and eliminate head space if' desired;
end eaq (Part No. 1) through which air can be introduced to move the piston within the evacuation. chamber;
a fittration assemblv Parts No. 7 and 20), consisting of one 0.7 micron glass fiber filter placed between (t stainless steei W m m mesh screens;
top cap (Part No. 2) with Luer-LOP fitting, which allowed the introduction and extraction of fluids from the ZHE vessel;
pressure eagE (Part No. 18) used to indicate the pressure exerted on the piston within the evacuation chamber;
rotating rack (not Shawn), which could accommodate 12 assembled ZWE vessels and rotate them end Over end at the rate of 30 revolutions per minute (rpm) and;
a x o r t d viton 0-rines (Parts No- 11 and 13) were conditions within the evacuation chamber.
to ~ a ~ r a t ~ ~ ~ gas-tight
Soils were collected from the X-231B unit during January 199'2 using conventional drilling and sampling methods. Soil cores were collected from multiple depths using a split-barrel sampler lined with stainless steel sleeves 2.5 in. wide and 6 in. long. Tlne cores were sealed with aluminum foil and plastic end caps and stored in coolers filed with "'blue-ice" during transportation back to O W L laboratories. At O W L the cores were refrigerated at 4°C until the start of the laboratory experiments.
For the bench-scale experiments two soil cores were selected that had negligible concentrations of the target VOCs (nondetectable, <1S&kg). This was done so that controlled experiments muld be conducted using actual material from the X-231B site; TCE, the principal target VOC, would be added to each experimental treatment at a known concentration. The soils used were collected from a depth zone of 9.5 to 10.5 ft
9
10

ORNGPHOTO 9881-91
11

at the site. Representative soil properties are summarized in Table 4. Detailed information about the characteristics ol the X-231B site is contained in other project reports (Siegrist et al. 1992a).
Soil slurries were prepared using a blender (SoilTest model 936 Mechanical Analysis Stirrer) with a stainless steel dispersion cup. The following procedures were used:
1. The stainless steel soil cores were removed from cold storage and opened. The soil contained within the core was removed with a preclcaned stainless steel spatula and placed in a mixing bowl. The soil was then manually cut into small, bloclry fragments, typically 0.5 to 1.0 cm in length.
2. The desired amount of soil for the slurry being prepared was weighed out in 100-g portions (see Table 5).
3. Soil and deionized (DI) water were added to the blender container in 100-g and 100- QC 50-rnL aliquots, respectively. New soil additions were incorporated into the slurry by blending at mcdiurn-high speed for - 3 min.
4. After the slurry was prepared, the blender container with slurry was placed in a hot-water bath for 3 h. The slurry was periodically mixed to ensure homogeneity.
5. After heating, the soil slurry was reblended and then poured into a large glass beaker.
The prepared slurries werc covered with foil and plastic wrap, and refrigerated when not in use.
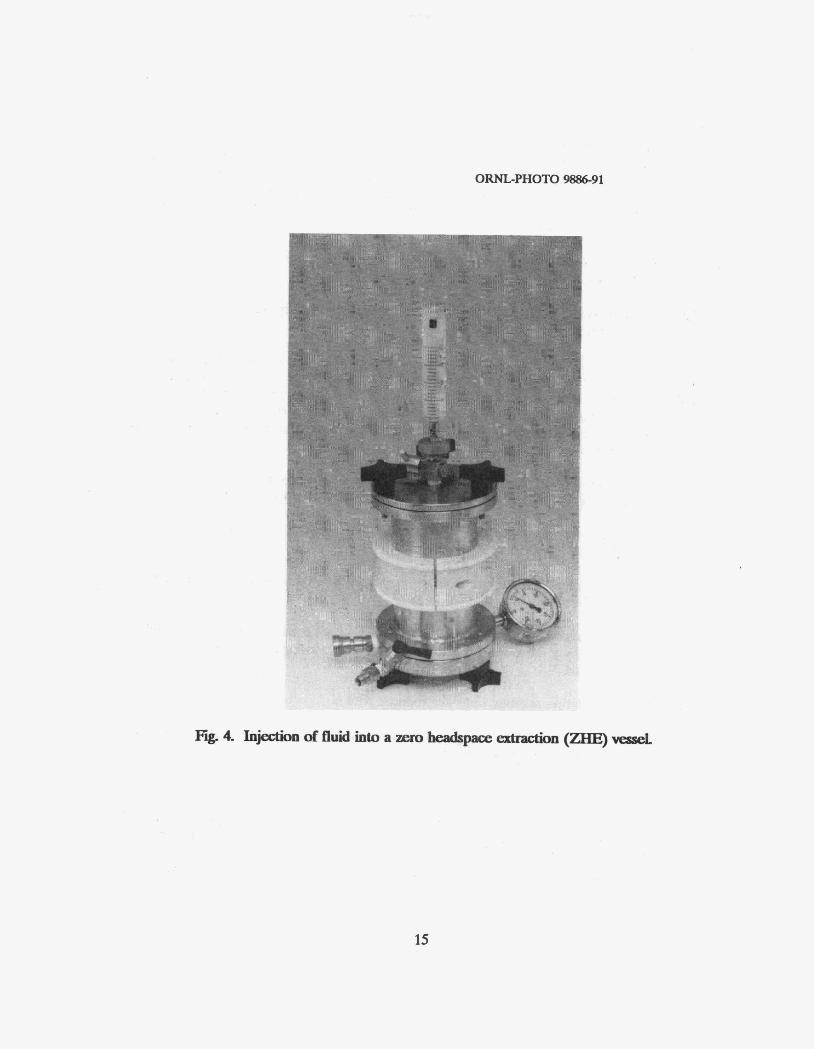
1. Elcven ZME vessels were assembled with their pistons positioned to leave a reaction chamber of - 1 cm-depth in each vessel. 'This depth provided a reaction volun~e of -45 mL. This volume was sufficient to accommodate the initial soil slurry and solutions added to the vessels.
2. Sixty gratns of soil slurry were weighed out and carefully transferred to the reaction chamber of each vessel.
3. Aqueous stock solutions containing TCE were prepared using reagent grade neat TCE and DI water. The solutions wcrc prepared in either 258-mL Teflon Tedlar bags or 108-mE plastic bottles covered with Teflon-lined septum caps. The stock TCE solution concentration of 12.5 mgL. was selected for the first series of bench experiments.
12

Tabk4. Soil- + dtk X-231B rite (Siegript et PL 1992)
Parameter Units Representative properties
Texture ..--.. Silty clay loam 10% Sand 60% Silt 2025% Clay
PN - 5.5-6.0
Toc Dry wt% 8.064.12
Fe (acid extract) Dry wt% 2.5-3.5
Fe (free iron oxide) Dry wt% 1.5-2.0
Mn (acid extract) Dry wt% 0.01%),1
2 1035 18.8% m m 0.7
"soil cores were cullected using a split-barnell sampler during a full investigation conducted in
bDry weight basis. January 1992.
13

4.
7.
8.
9.
10.
11.
12.
13.
After the reac:ion time had elapsad, the ZKE v.esscL were rem rotating rack and depr~~suri~xxl in preparation for water addition.
After the addition DI water, the ZNE vessels were again p r w u r l d to 10 psi and mixed for 24 h. T h i s "extractinn tiwc" was selccted tn allow the TCE in the ZHE vessels to soalubiliz.
r.
15

14.
15.
2.23
Posttreatment solution samples were
the piston in the ZHE chamber which To through the fi)lter assembly and into 7-mk glass vola (Fig. 5). Ail vials of posttreatment extract were cap caps and stored at 4°C prior to analysis.
196cted after the extraction
e solution in the Z Samples were collected by applying press much as 50 psi) to
organic analysis (VQA) vials with Teflon-lined septum
Thc ZME vessels were then opened, and the remaining contents were transferred to glass jars, which were covered nd refrigerated.
The s m n d seri Be peroxidation studies were ~ ~ ~ u c ~ ~ to eonfirm tigate the effect of reaction time
Le., soil slurry vs soil aggregates) on nducted in a manner similar
concentration on This series of experiments was also
series of %WE irnents with the
1. Soil aggregates were treated in e ZWE vessels inste minated as EO~~QWS:
a. A soil core was removed from refrigerated storage and broken into 1-cm-diam aggregates.
fieid-moist soil a egates were weighed and placed in each
L of TCE solution (125 mg KE/L target ~ ~ ~ ~ t r a t ~ ~ n ) were rapidly nge, and the ZME vessel r the surface of the a regates with a
was closed.
2. The peroxidation reaction time was redu
3. The amount of DI water added to the ZHE vessels containing soil aggregates was increased to 137 mL during the e ~ r a ~ t ~ ~ n step (No. 12).
ZHE ~ $ ~ t r e ~ ~ ~ ~ n t spiking d u t i o ~ ~ were anal with EBA method glass vials and anal
6t samples (Step No. 14) and sa^^^^^ of the TCE content by gas chro
so^^^^^^^^ were stored in 4 - m L reatment slurry mixtures were
16

. .
...
17

placed in 50-mE eentri then decanted and ana summarizer% in Table 6.
tubes and spun for iron, TW,
n e d ~ t r u c t ~ ~ ~ of TCE levels in the ZME v (control) vessels. TCE from the vessels after vessels to be partition mixtures formed in the ZHE ve;eb after IX wate the majority of the TCE in the system would be calculations in Appendix A support this ~ u ~ ~ ~ ~ o n revealing that <I% of the TCE remaining in the ZHE vessels after treatment would bg: sorbed to the soil, The percent removal based on aqueous extract concentration is therefore an estimation of the TCE
after the addition of H2 infened by comparing the treated with W2O2 with E levels io the untreated rations were me u r d in the aqueous extracts ~ t h ~ r a ~
1e to expect the TCE in the phases, it was assumed that the
n were dilute enough so that e aqueous phase. The
The initial TCE concentration, the cal~ulatcd X E loading (mass TCE/mass soil), the measured final (posttreatment) TCE concentration in the filtrate from the
ZRE vessels are ~ u ~ ~ a ~ in Tables 7 and 8. The data presented in Tables 7 and 8 and shown in Fig. 6 indicate that a ~ ~ u c t ~ ~ n in TCE concentration resulted from the a ~ d ~ t i o n
agreement between treatments evaluat
bench-scale experiments.
18

Table 6. Methods of analysis for peroxide bench-scale studies
Medium/ Preserva- Holding Parameter sample type Container tion time measured Method
6 in. Stainless Methods s tee! Moisture of soil
Soil sleeve 4°C >GO d content analysis
Post- treatment 7-mL aqueous Glass VQA extract vials 4°C <7 d TCE SW 8240"
- ~ ~
25-mL TCE Glass
spiking VOA solution vials 4°C €7 d TCE SW 8240
40-mL Dilution Glass
water vial 4°C <7 d TCE SW 8240
40-mL Peroxide amber
stock glass Idornetric solution vial 4°C n/a H20, titrationb
Post- treatment 50-mL PH EPA 150.1
S l U I t y Plastic TQC 9060 (cen trate) beakers 4°C n/a Fe 236.1
"Test niethods for the evaluation of solid waste, Physical/Chemical Methods, SW-846, 3rd edition. Environmental Protection Agency, Office of Solid Waste and Emergency Response. Washington, D.C. Novernher 1986.
bKolthofi et al. 1969. Quantitative Chemical Analysis. 'The Macmillan Company, Toronto. p. 854.
19

180 0.015 96
313.9 -- lb 1.M
1.87 313.7 629
52.8 1.85 312-8 0,15%
3 3a l*% 313.3 15.5
3b 1.87 313s 17.8 15%
4 4a 1"s 313.2 <5
<5 7.3%
_c
4b 1 .% 313.3
CP 1.86 313.4 209.3
Slurry

Treatment NO./
matrix
3R Slurry
33.8
33.7
Predicted Predicted H202 pretreatment pretreatment Dosed Posttreatment
TCE TCE solution W E mass loading' concentrationb strength wnwmtrationC
mgntg Pg/L (W%) P@
3Ra 4.0 sos.6 23
37 3Rb 3.9 6029 1.5 %
5237.6
5233.6
Controls SlUrrgr
13%
CS1 3.9 603.5 1035
68271 cs2 34.1 5247.6
6a 6.1 1682 1 .5 534
0
15 1
64
Controls aggregates
CA1 1.1 1682 423
em 1.1 1682 709
0
Aggregates 1 6b 1.1 1682 1S 518
I & 1.1 1682 1.5 250
"calculated on the basis of TCE spiking solutian concentration and masc of soil in slurry. bCakulated on the basis of total volume of fluid in vessel (includes slurry9 TCE sadution, pe~oxide
solution and DT water added for extraction) using measured stock TCE solution concentration and wuming all TCE in aqueous phase.
'Measured value in posttreatment extract.
21

OKNL-DWG 93-1 1976
1 250
51)
l C O I
-
....
-r ...... I--.-
0 0 0 0 0 Initial TCE (mg/L)
- ______ Avg TCR rccovered in control
v v
0- C 1 CZ la l b Z a
Treatment N o ....
0 1 2
v 3 v . 1 L 1 5
1 1 - 5 III 2b 3a 3b 4a 4 b
Treatment N o .
22

The percentage of TCE removed from the soil slurries in the ZHE vessels was calculated relative to the level of TCE recovered in the control vessel using the following equations :
TCE1eInv
where
TCE,,, =
TCEkikI =
TCEfwl =
TCEadjj, =
percent TCE removed due to peroxidation (%),
the initial concentration of TCE in the ZHE vessel based on the measured TCE concentration of the stock solution USMI for spiking and the measured volume of water within the ZHE @g/L),
the measured concentration of TCE in the ZHE vessels based on post- treatment sampling and analyses (pgJL),
an adjusted concentration based on the change in TCE within the control ZMEs which accounts for changes in TCE concentration associated with the experimental and analytical procedures ol,g/L):
with
TCE,-i,i,, =: the initial concentration of TCE in the control ZHE vessel based on measured TCE concentration of the stock solution used for spiking and the measured volume of water within the control ZHE vessel @g/L)
TCEc-fid = the measured concentration of TCE in the control ZHE vessels based on post- treatment sampling and analyses &g/L>.
The control experiments in ZHE series No. 1 yielded a 69% recovery of the dosed TCE while the control experiments in ZHE series No. 2 slurries yielded TCE recoveries > 180% (Table 9). In the case where the calculated TCk,,,,, was negative (series No. 2 control experiments with slurries), TCE,,, was assigned a value of 0.0 in Equation 14. The TCE recoveries observed in most of the control experiements were within the range of recoveries found to be acceptable when working with volatile organic compounds (Siegrist 1992).
In Fig. 7 the percentage of TCE removed in bench-scale experiment No. 1 i s shown as a function of the concentration of the H,Q, solution used for treatment when the same volume (10 mL) of N,O, solution was added in each vessel. TCE removal percentages in the first series of experiments increased as the H,O, concentration increased from an average of 19.6% removed with 1.5% H,Oz to 97.7% removal with 7.3% H,O,.
23

_l_l
Predicted Measured pretreatment posttreatment
1'CB TCE Percent
Series No. Control No. Matrix YBIL rg/L recovery concentrationb concentration" T( ; E
--.- 1 CI Slurry 313.4 209.3 66.8
1 c2 Slurry 3 13.5 224.3 71.6
2 cs 1 Slurry 603.5 1035 170
2 cs2 Slurry 5247.6 1027 I 195
2 CAI Aggregates 1682 423 25
2 Ch2 Aggregates 1682 709 42
"TCE-contaminated soil slurries and aggregates with no peroxide added. bCalculated on the basis of total volume of fluid in vessel (includes slurry, 'TCE solution, peroxide
solution and DI water added for extraciion) using measured stock 'I 'CX solution concentration and assuming a11 ' K E in aqueous phase.
'Measured value in posttreatment extract.
24

ORNL-DWG 93-1 1977
0 1 2 .3 4 5 6 7 8 9 10 H,O, Strength (%)
1 I I I I I I I I
0 5 10 15 20 25 30 35 40 H,O, Loading (g H,02/Kg soil)
Fig. 7. TCE removal in bench-scale study No. 1.
2.5

Figure 8 shows the TCE reductions observed during the second series of experiments, which indicate that significant TCE reduction occurred i, the vessels filled with slimy, while minimal TCE reduction took place in the vessels loaded with TCE-contaminated soil aggregates. TCE removals observed during the bench-scale experiments are summarized in Tahle 10.
2.3.2 Effects on LFystem Chemistry
An increase in pressure in the ZWE vessels after M,O, addition was tlie first indication that some type of reaction had occurred in the ZHE experiments. It should he noted that the pressure gages on the apparatus were not designed to measure small changes in pressure but were able to confirm the generation of gaq if a sufficient amount were formed. The greatest increase in pressure occurred with the addition of the 7.3% H,O, solution in the ZHE series No. 1 experiments (Fig, 9). Although the increases in pressure observed were interpreted as indicating that some type of gas-evolving reaction had taken place (chemical oxidation), no attempt was made to capture or analyze the off-gas geneiatd.
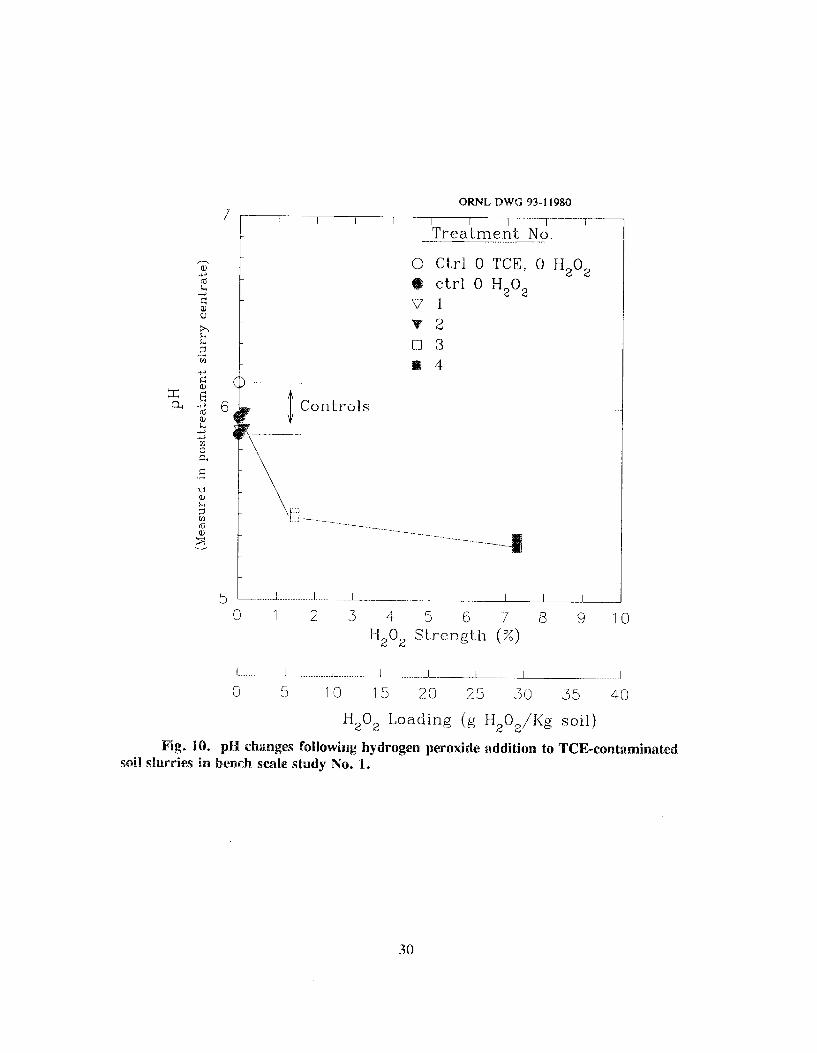
‘The pH, TOC, aiid iron levels in the posttreatment slurry centrates are shown in Figs. 10-14. Similar trends were observed during both scries of ZHE experiments. It should be noted that the posttreatment slurries were stored for several days prior to analysis. It was observed that the pH of the slurry centrate decreased with respect to the pM of the control at E I , O , concentrations > 1.5%. This result is not unexpected, since tkie Id,O, solutions are acidic, and if Fenton’s-type reactions did occur, this would also result in the release of H’ upon the reduction of Fe3+ as detailed in Eq~ation 6. No significant chaages in pH were observed at the Bower (< 1.5%) H,O, concentrations.
Iron levels in the posttreatment slurry centrates differed from the control iron lcvels with an increase in iron concentration observed at lower W,O, concentration and a decrease in iron concentration observed at higher H,O, concentrations. In the absence of data detailing iron speciation, little can $e inferred from the level of iron measured in the posttreatmcnt slurry centrate.
The TO@ concentration in the posttreatment slurry centrates increased at the higher H202 concentrations. This suggests that at the higher H,O, concentrations the soil organic riiatter is partially oxidized, which results in solubilization of organic carbon.
2.4 BENCH-SCALE STUDY DISCUSSION
TCG removals as high as 98% were obtained when H,O, was added to TCE- contaminated slurries. Although W E reduction was observed at all H,O, concentrations, the maxiinurn TCE removals (> 70%) were observed when H,O, concentrations > 1.5% were uscd. The trends in pH, TOC, and iron concentrations all suggest that it is possible that Fenton’s-like chemical reactions may be occurring and yielding ‘ACE oxidation.
26

ORNL-DWG 93-1 1978
100
90
80 n R
(d > - 70 +
d 60
SO
40
30
20
10
0
h 4 0) k
W u E-.
.... _.._..
v
v V
I I I I -1 1-1 3 R a 3 R b 5a 5b 6a 6b 6c
Treatment (replicate) N o .
Fig. 8. TCF, removal efficiency En bench-scale study No. 2.
27

Table 10. Bench-sale stracily sr~mmsry of ~ ~ ~ o x i ~ ~ ~ ~ ~ ~ of TCEcontarninate
H2132 dose SQlUtiOiil
Pretreatment strength TCE loading (wt %) Reaction Avg. TCE
Treatmen; No. (mg/kg) time (h) removal
1 1.9 0 .015 24 20
2 1.9 0 .15 24 73
3 1.9 1.5 24 92
4 1.9 7.3 24 98
3R 4.0 1.5 2 95
5 34.0 1 s 2 98
28

ORNL-DWG 93-1 1979
1- - - . ~ - ~
I I I I I
- Treatment No.
0 control
I.__-
I
-
I
-
-
-
I
-
I I
10
9
8
7
6
5
4.
3
2
1
0
I L I 1 I I I 1 I
0 5 10 15 20 25 30 35 40 H,O, Loading ( g H,O,/Kg soil)
Fig. 9. Pressure changes following hydrogen peroxide addition to TCE-contaminated soil slurries in bench sale study No. 1 .
29
5 ....... l...~ .......... I ............ I. .. --I i I I I I
0 1 2 3 4 5 6 7 8 9 1 0 H,O, Strengtl1 ( 7 5 )
............. I 1.. J L.-.l.. 1 I I ........ 1
0 5 10 15 20 25 30 35 40 H,O, Loading (g H,O,/Kg soil)
Fig. 18. pH changes following hydrogen peroxide addition to TCE-contaminated Soil ShPFiCS in bew@h S 6 i k Study NO. 1.
30

ORNL-DWG 93-11981
Treatment N o .
o ctri Q rrm, o I
4 Ctrl 0 H,O, 0 1 e 2
Controls 0 3 r 4
0 1 2 3 4 5 6 7 8 9 1 0 H,O, Strength (%)
-____ I... ..I.- I I I I
0 5 10 15 20 25 30 35 40 H,O, Loading ( g H,O,/ICg soil)
Fig. 11. Total organic carbon (TOC) changes following hydrogen peroxide addition to TCEcontaminated soil slurries in bench scale study No. 1.
31

ORNE-DWG 93-1 1982 ...... 20
I. 0 1 2
..... .- ..
.. .~ ~1 1----
Treatment N o .
0 Ctrl 0 TCE, 0 H,O,
Ctrl 0 H202 0 1
.. IJ I I
3 4 5 6 7 8 9 1 0 H,O, Strength (%)
......... L ......... J L' ...... 1 .................. I u 1
0 5 10 15 20 25 50 35 40 H,O, Loading ( g I-I,O,/Kg soil)
Fig. 12. Iron changes followin ~ ~ d ~ ~ ~ e ~ peroxide addition to ~ ~ ~ c o n t a ~ i n a t ~ ~ soil slurrie in bench scale study No. 1.
32
ORML-DWG 93-1 1983 I I
Aggregates TCE,,, = 1.1 mg/Kg
V Slurry
0 Slurry
TCEint = 3.9 mg/Kg
TCEir,l = 33.8 mg/Kg
I 1 I 1 1 I I I I
0 1 2 3 1 5 6 7 8
H,O, Loading (g H,O,/Kg soil)
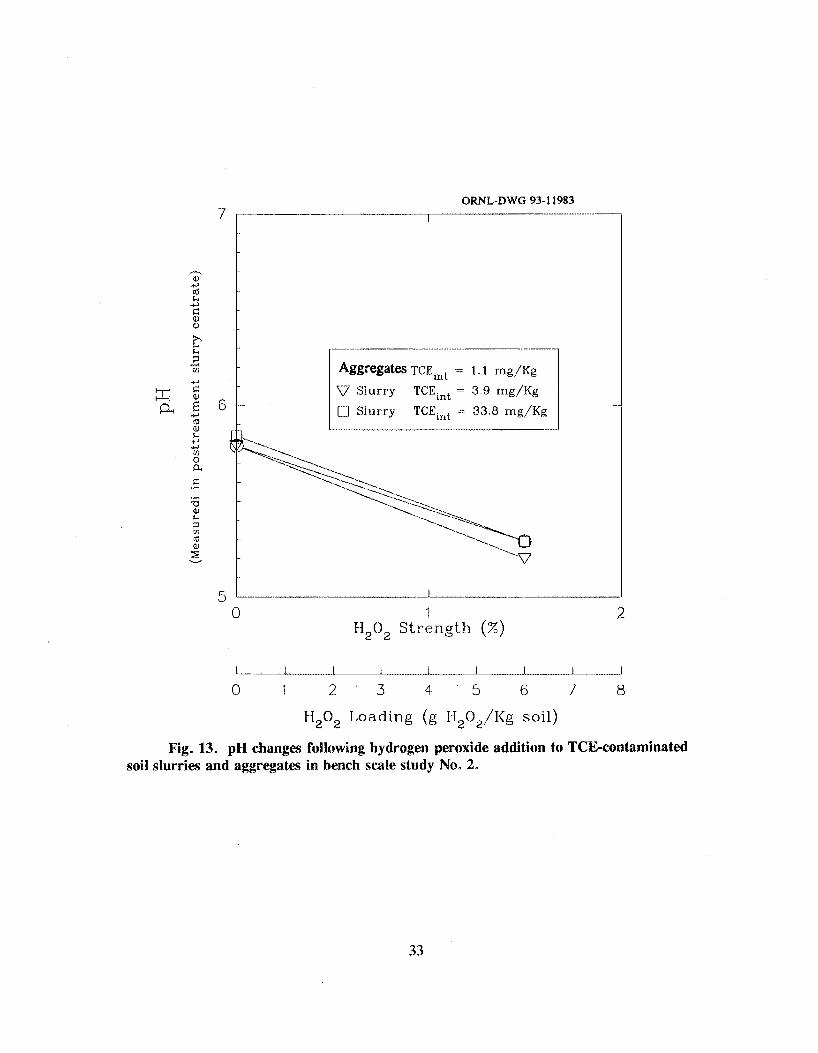
Fig. 13. pH changes following hydrogen peroxide addition to TCEcontaminated
33

ORNL-DWG 93-1 1984 ...................... I I 25
0
Slurry WEin t = 3.9, 33.8 rrig/Kg
Aggregates 'WEint = 1.1 1 mg/Kg I _ I
A ._ ................................. J ___-I
0.0 0.5 1 . o 1.5 2.0 Fi,O, S t rength (Z)
I J...~ J - - 1 1 I I I .......... ............
0 1 2 3 4 S 6 7 8 H,Q, Loading (g H,O,/Kg soil)
Fig. 14. Total organic cashon (TOC) changes following hydrogen pes a ~ ~ ~ t i ~ ~ to TCE-contaminated soil slurries and aggregates in bench sale study No. 2.
34

Limited data from the experiment suggest TCE reduction due to peroxidation may be independent of initial TCE concentration (see Fig. 15). TCE reductions > 90% were reached in experiments with initial TCE concentrations of 4.0 and 34.0 mg/kg soil at equivalent H202 doses
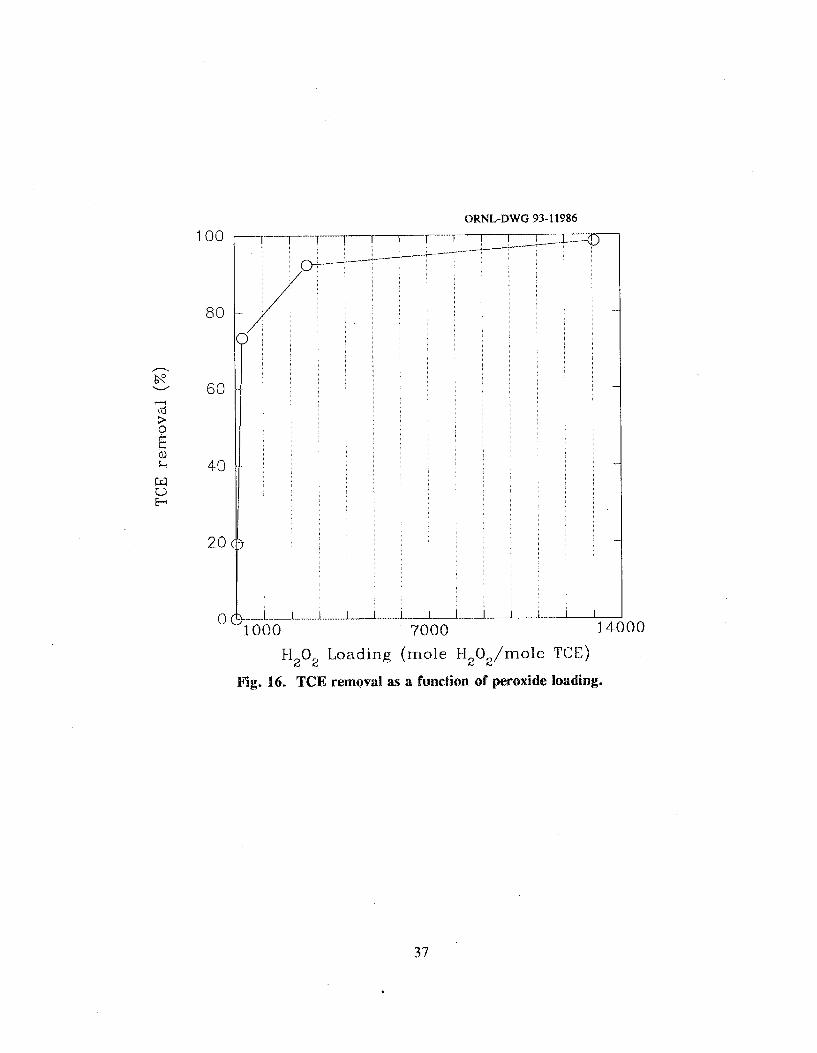
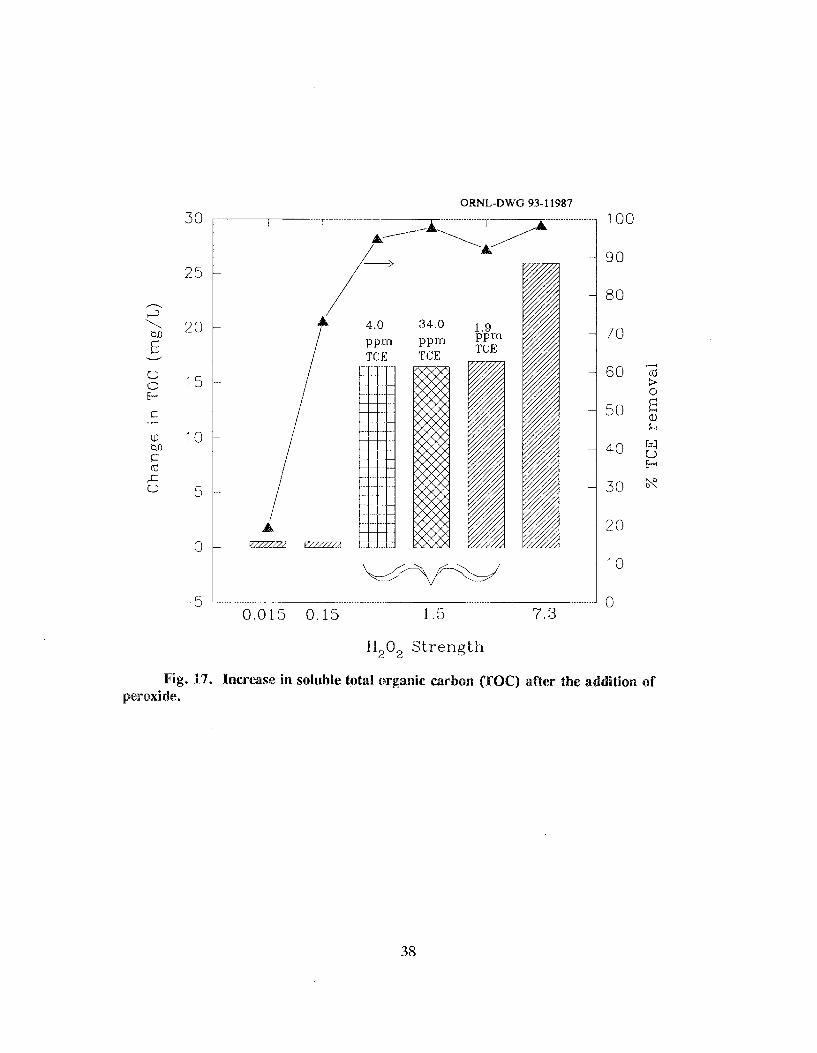
Peroxide concentrations far greater than the theoretical (or stoichiometric) amount needed for complete TCE destruction (Equation 13) were used in the bench-scale studies. In Fig. 16 the TCE removal percentage is shown as a function of the H,02 molar loading (mole H,Q,/rnole TCE). The data shown in Fig. 16 suggest that the peroxidation process requires a H202 dose sufficient to oxidize the target contaminant in addition to that consumed by simple decomposition and the oxidation of nontarget material. In soil systems the predominant nontarget oxidizable material is most probably soil organic matter. In fact, it is possible that TCE degradation is merely incidental to soil TOC degradation, considering the predominance of soil organic matter relative to the number of contaminant molecules in the matrix evaluated in this study. The increase in soluble TOC in the posttreatment slurry centrate was presumed to be indicative of partial soil organic matter oxidation. A comparison of soluble TOC increases at different TCE loading and the same H,O, dose (Fig. 17) revealed nearly identical increases in soluble TOC. These preliminary findings suggest that soil composition, particularly TQC content, may impact the effectiveness of peroxidation, Therefore, soil TOC levels need to be taken into consideration when the H,O, dose required to achieve a desired level of VOC reduction i s being determined-perhaps the TO@ content is even more important than the initial TCE concentration.
Similar TCE reductions were found in experiments with reaction times of 24 h and 2 h (Figs. 18 and 19). These tindings support the conclusion that the principal peroxidation process is very rapid, possibly occurring within minutes of the introduction of H,O, into the contaminated media.
35

6000
5000
4000
.3 0 0 0
2000
1000
ORML-DWG 93-1 1985
3.9 rng/Kg 33.8 mg/Kg In i t i a 1 1'C E loading loadjng Treatment 3 R ?'reatmerit 5
Initial TCE
0
100
90
80
70 R
60 2 W
> 50 :
a, L4
u E3
40 611
30
20
10
0
36
0 0
0
00 0
CQ
0
ni
0
30
25
20
15
10
5
0
-5
BRNL-DWG 93-1 1987
1.9 PPIn TCE
0.015 0.15 1 .is 7 . 3
H202 Strength
100
90
80
70
d 60
50 ; Q)
k
40 E-+
30
20
10
0
Fig. 17. Increase in solrihle total organic arbon @OC) after the a peroxide.
38

6000
5000
4000
so00
2000
1000
0
ORNL-DWG 93-1 1988
Y rxn time ---+
3
rn rxn time
100
90
80
70 n R
60 .;
v
+ 50
a k
40 w V E3
30
20
10
0 4.0 pprri 34.0 ppm 1.9 pprn Initial TCE Initial TCE Initial TCE 1 o a d i ng loading lo adi rig
Fig. 18. TCE removal with the addition of peroxide at different initial TCE concentrations and reaction (mn) times.
39

ORNL-DWG 93-1 1989
l -
...
__
-
-
-
24 ---h Reac t ion
100
90
80
R 70
3 60
50
40
30
20
10
0
n
W
d a 8 E L
w E-.
2-h Reaction t,ime time
Fig. 19. TCE removal os a function of reaction time (peroxide strength constant at 1.5%).

3. PILOT-SCALE TBEATBBILITY STUDIES
Pilot-scale treatability studies were conducted after the completion of the bench-scale studies to further investigate peroxidation of TCE-contaminated soils. This series of experiments was conducted with the use of an %in. outside diameter (OD), 9-in.-long reaction lysimeter packed with Portsmouth soil. The soil in the reaction lysimeter was mixed and injected with a H,O, solution using a modified core drill assembly. This type of experiment was needed to study the process for in situ peroxidation of clay soils.
3.1 OBJECTIVES AND SCOPE
The objective of the treatability studies was to further investigate peroxidation with the use of a soil-mixing system to deliver H,O, solutions into a zone of contaminated soil. This system is more closely related to field conditions than the bench-scale studies and was expected to provide data to aid in the design of a full-scale field demonstration of peroxidation. The following specitic objectives were established for the treatability studies:
1. To evaluate the extent of TCE reduction possible by peroxidation conducted with a soil-mixing and oxidant delivery system.
2. To investigate the effect of H,O, loading volume on TCE reduction.
3. To evaluate the amount and characteristic of the off-gas generated during the course of peroxidation of TCE.
4. To determine the effect of H,O, addition on soil properties.
Three treatability experiments were conducted to generate sufticient data to meet the objectives previously set forth. The first series was conducted using clean soil from the Portsmouth site, whereas the second and third series were conducted using Portsmouth soil that was artificially contaminated with TCE prior to HzO, treatment. In all cases the soils were mixed and H,O, was injected as part of the treatment process. The experimental conditions maintained during the treatability study are summarized in Table 11.
41

Table 11. Peroxide ~ ~ ~ t ~ ~ ~ ~ ~ ~ ~ y study design ~ x ~ ~ ~ i ~ ~ ~ ~ ~ ~ conditions
%O; H,O, TCE volume loading Reaction target contamination
Series Treatment added @g soil time level No. (h) (WZJw
la 80 mL 2.5
l b 0 mL 0
2a 80 mL 2.5
2b 80 mE 2.5
3a 40 mL 2.2
3b 40 mL 1.2
1 2 None
2 2 5
3 2 5
____II
"Five percent pcroxide solution used for all treatments except ab which bad 80 mL of deionized water added.
42

3.21 Ekperimental Apparatus
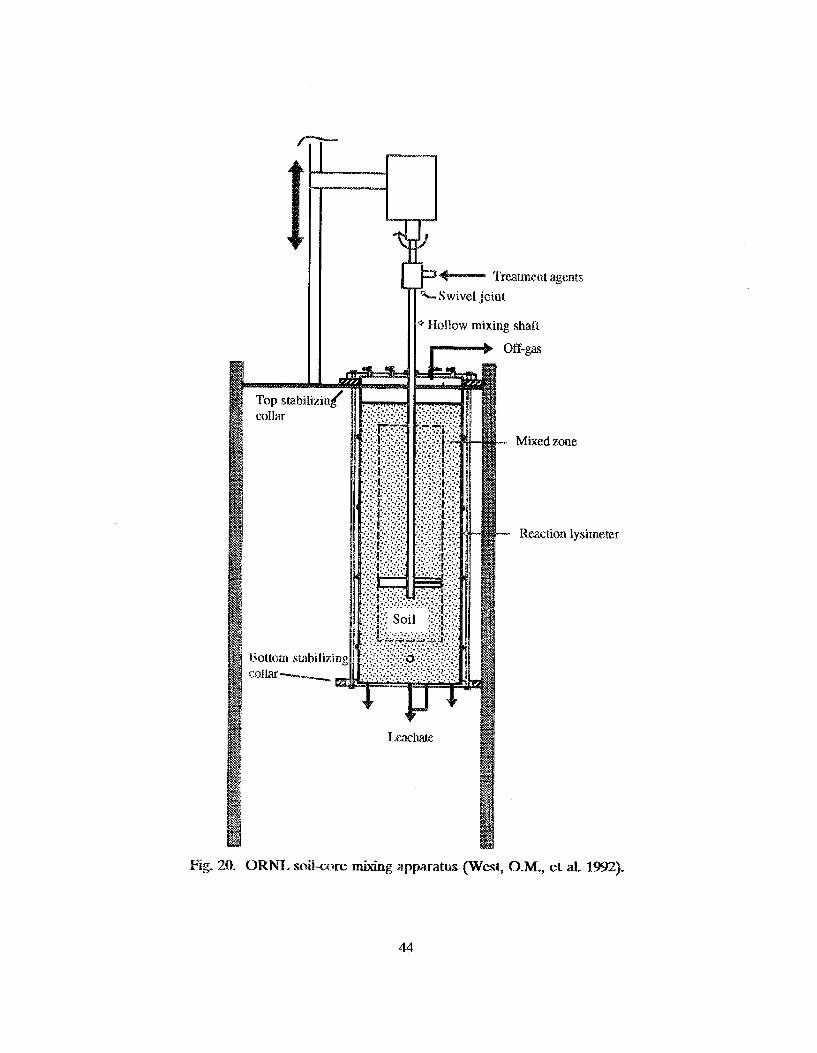
The main components of the apparatus used for the treatability studies are as follows (see Figs. 20-22):
A stainless steel 8-in-OD, 9-on.-long reaction lysimeter which could be packed with soil requiring treatment. The reaction lysimeter was sealed using viton gaskets to minimize the loss of VOC during treatment as a result of leakage from the system.
* A core drill equipped with a swivel joint to allow H20, injection into the rotating hollow shaft during the mixing process. The core drill was manually lowered during the course of a treatability experiment.
e A perforated mixing blade through which H2Q2 solution was injected into the soil mixing zone
Furthcr details of the design and operation of the treatability apparatus can be found elsewhere (West e t a!. 1992).
3-22 Experimental Methods
The treatability s tudia consisted of the following steps:
1. Preparation of a soil core by packing soil into the reaction lysimeter and spiking the soil with TCE solution (no TCE spiking for experiment No. 1). The soil cores used in the treatability studics were collccted and handled in a manner similiar to that given in Section 2.2.2 with the exception that sleevcs 8 in. in diam by 24 in. in length were used to collect largcr soil samples. Field soil core #SB08, from a depth of 11 to 13 ft with a field-screening VOC level of 49 &kg was used for the peroxidation treatability studies. Spiking was done as follows:
a. A preweighed mass of ficld moist soil was packed into the soil core treatment mnc and compacted into an even layer - 1.5 cm thick.
b. Tbe upper surface of the packed soil was scored in a crosshatch pattern using the blade of a screwdriver.
c. TCE solution (10 mL) was quickly and evenly distributed over the scored soil surface using a glass syringc fittcd with a metal needle.
d. Another preweighed layer of soil was placed in the treatment zone and steps b and c were repeated until a total of 4 layers of soil had been placed in the treatment zone and contaminated with TCE.
43
44
Lower inclined blade - I2.cI
d 0 ./-
,*'
I in.
Hollow mixing shaft
Upper inclined blade
i I--- Hollow mixing shaft ! I
Upper inclined blade
Perforated tube (1/8" D) Drill bit
t 5 in. h
Effective mixing diameter
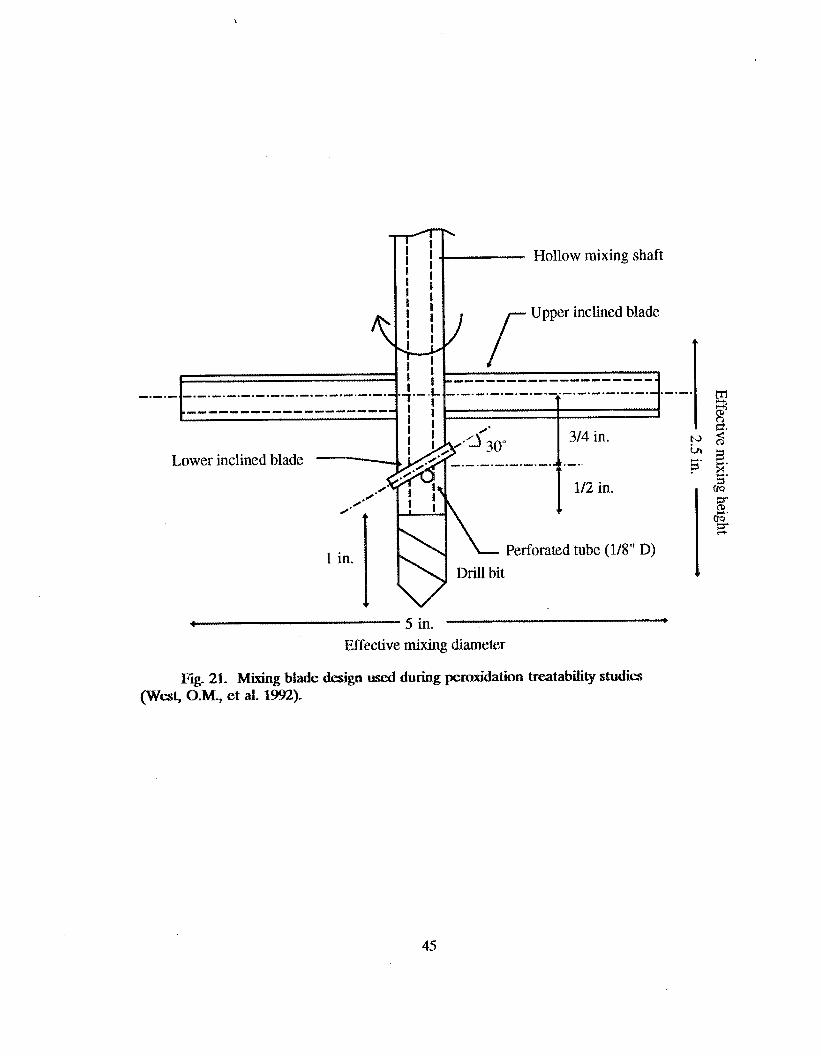
Fig. 21. Mixing blade dcsign u d during peroxidation treatability studies (West, O M , et al. 1992).
45

ORNGPHOTO 4131-92
Fig. 22 Apparatus used during peroxidation treatability studies (West, 0- et at 1992).
46

2.
3.
4.
5.
e. A final layer of soil was placed in the treatment zone and compacted in glace but was not contaminated with TCE.
f. The reaction lysimeter was capped and sealed and then allowed to sit undisturbed for at least 2 hours before H28, treatment was initiated.
The lysimeter was opened and pretreatment soil samples were collected. A total of two pretreatment samples were taken at separate locations for each experiment, using a 3/4-in. diam stainless steel soil probe. After the soil probes were withdrawn, the contents were divided into three equal portions which were then placed in preweighed amber VOA vials. The vials werc closed using Teflon-lined septum caps and then rcfrigerated at 4°C prior to analysis.
Mixing of soil cores and injection of The soil treatment zone was premixed with one pass of the mixing blades prior to N202 injection. The mixing blade was operated at the rate of -3 in. per min. Following premixing, the soil core drill was manually lowered and raised while H20, was injected at the rate of 40 ml/min. Injection of the H202 solution was complete in under 3 min. The H202 solution was prepared daily and supplied to the swivel joint by a masterflex pump. After H2Q2 addition was completed, two additional passes of the mixing blade were made to promote thorough mixing.
,O, werc accomplished as ~ Q ~ ~ O W S :
H202 addition and soil mixing were foallowed by a 2 h reaction time in which each treated core was allowed to sit undisturbed, and off-gas generation was monitored.
Withdrawal of posttreatment samples. (see Step No. 2)
Peroxidation is an exothermic reaction that can proceed with the generation of gas. The off-gas generated during peroxidation would be expected to consist oE mostly 0, and CQ, and possibly some gaseous TCE. The rates of off-gas generation and total off-gas volume were measured during treatability runs No. 1 and 3 (1Q% and 5% H202 addition by volume, respectively). In addition, during treatability run No. 3 the off-gas was cokcted in a Tedlar bag and analyzed for TCE.
Thermocouples were installed in the reaction lysimeter, but they did not register any appreciable increase in temperature during peroxidation. It should be noted that the thermocouples measured the temperature of the annular region of soil surrounding the mixed treatment zonc and not the temperature within the treatment zone.
During the peroxidation treatability studies, the TCE concentration in the soil samples was measured directly using a heated head space gas injection into a gas chromatograph. The procedure followcd was similar to EPA Field Screening Method F1M-5, with the exception that -6 g soil samples were placed in 40-m)l reaction vials for analysis, and an autosampler was not used. Samples were heated for 1 h at 60°C before analysis.
47

A Perkin EBmer Sigma 2000 GC with a VOCOL column measuring 30 rn x 0.53 mm was used. N, was used as the carrier and make-up gas. 'The detection and injection temperature were 300 and 200°C respcctively. Treatahility study sample analysis is summarized in Table 12.
The percentage of TCE removed during the treatability experimcnt was calculated using the following equation:
where
TCE,,,,, = percent 'I'CE removed during treatability experiment,
TCEinitial i- average pre-trcatrnent sample TCE concentration (m g dry soil basis),
TCEfina, = average posttreatment sample TCE concentration (mg/kg dry soil basis).
The 'ICE removals observed during the treatability studies are summarized in Table 13 and shown in Fig. 23. TCE reductions >70% were obscwed at both M,O,-loading volumes investigated.
Treatability run No. 1 (uncontaminated soil) was conductcd to determine the impact of in situ mixing with H202 injection on bulk soil properties. The changes in moisture content observed after the addition of equal volumes of water (run la ) or H,O, (run 1b) (10% of total volume of soil) are summarized in Fig. 24. Photographs of soil before and after in situ mixing and M,O, addition (10% of total volume of soil) arc shown in Figs. 25 and 26.
'T'hc rate of off-gas generation during treatability runs 2a and 3b is shown in Fig. 27. During treatability run 2b, thc off-gas was collected in a Tedlar bag and analyzed, This analysis did not measure any significant quantities of CO, in the off-gas but did detect a small quantity of TCE in the off-gas.
A decrease in TCE rcmoved was noted when the level of H,O, added to treat the soil was decreased. The measured initial TCE concentration was somewhat higher for the runs receiving thc lower volume of H,O,. On the basis of the results of the bench-scale studies, in which it was shown that initial TCE concentration did not have an apparent
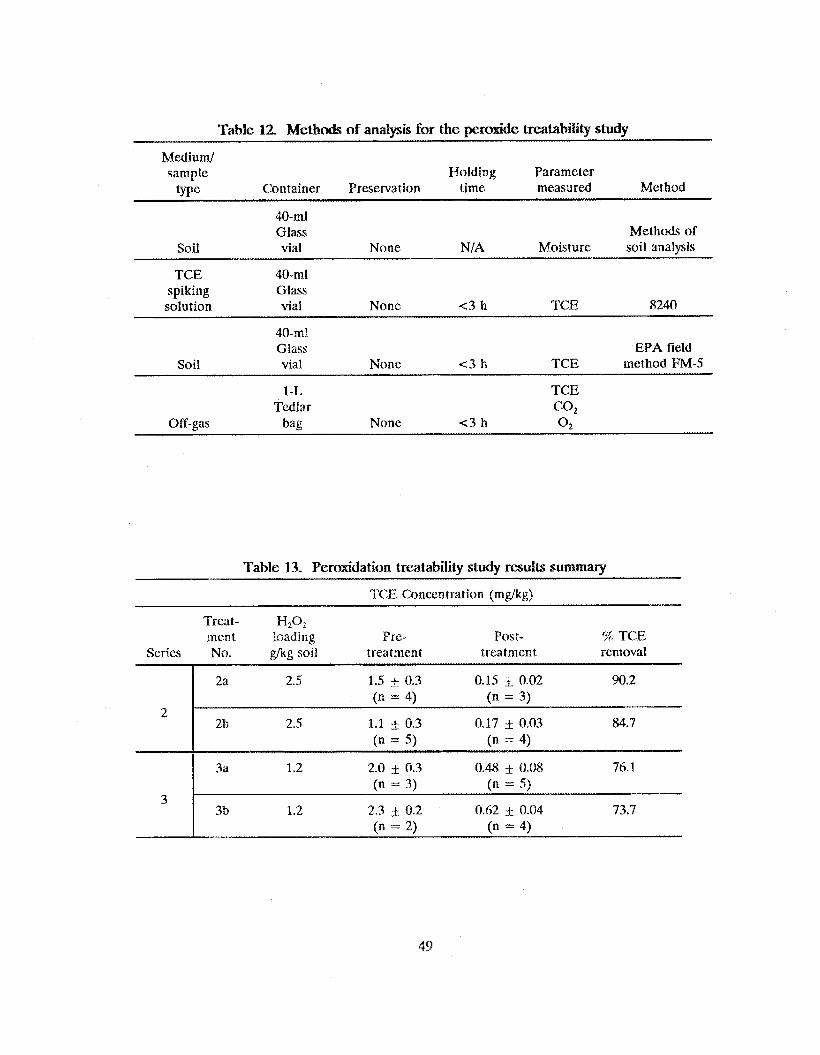
Table 12 Methods of analysis for the peroxide treatability study
Medium/
W" sample Holding Faramcter
Container Presesvation time measured Method
40-ml Glass Methods of
Soil vial None NtA Moisture soil analysis
TCE 40-1111 spiking Glass solution vial Nonc €3 h TCE 8240
40-mi Glass EPA field
Soil vial None € 3 h TCE method FM-5
1 -L TCE Tedlar CO,
Off-gas bag None < 3 h 0 2
Table 13. Peroxidation treatability sludy results summary
TCE Concentration (mg/kg)
Treat- H202 nnent loading Pre- Post- % TCE
treatment removal Series No. g / k g soil treatment
3
3a 1.2 2.0 f 0.3 0.48 I 0.08 76.1
3b 1.2 2.3 f 0.2 0.62 * 0.04 73.7
(n = 3)
(n = 2)
(n = 5 )
(n = 4)
-
49

2 . I-j
2.0
1.5
1 .o
0.5
0.0
ORNL-DWG 93-1190 . . . ~.~ ~ .. ___...........I..__ ........ .. -
w r\\y Pretreatment TCE 0 Posttreatment TCE
Series No 1 Series No 2 80 mL H,O, Added 40-mL H202 Added
Avg TCE removal = 87% Avg 'I'CE removal = 75%
(H,o, Load : z 5 g I)I,o,/K~ soli) (HzO, Load = 1 2 g I%Oz/Kg ~011)
2.3. Peroxidation treatability study results.
50

ORNL-DWG 93-1 1891
n €R
a, 18
2
E
v -
t,
-P 5
Q
4 .A
0 c/L
16 -
r
R u n l b
A f t e r
addition H202 HZQ t r e at in en t
addition
Fig- 24. Change in soil moisture content with fluid addition.
51

ORNLFHOTO 412992
. . . - .
fig 26. Portsmouth soil after treatment.
52

OMNL-DWG 93-1191)2
2.0 1.9 1.8 1.7 1.6 1.5
+-a 1.4 n
W
Q, 1 .;3 E 1.2 3 4 1 . 1 0 3 1.0 ; 0.9
0.8 2 0:7 O 0.6
0.5 0.4 0.3 0.2 0.1 0.0 I
I
I I I I I 1 -1------T----
l__l____l I
I____.__._._._.--I-
--.---I /.-------
c__------
-/-- -4 _/---
/---
/--- /&--- I
0 10 20 30 40 50 G O 70 80 'l'ime following introduction o f H,O, (miii)
Fig. 27. Off-gas generation after pertmde addition.

cffect on TCE destruction efficiency, it was concluded that the decrease in ef€ificier,cy observed was not due to the increased TCE concentration. The results observed were not unexpected and suggest that the process of interest may be mass transfer limited.
At both X12Q2 addition Icvek, more than 90% of the total off-gas generated was evolved within 10 min of H,O, addition. This was interpretcd as being indicative of the rapid rate of peroxidation reactions. PkF expected, a decrease in the total amount of off- gas generated was observed when the level of H202 added was decreased. The TCE measured in the o€€-gas was assumed to be carried over from TCE volatilized in the head- space of the reaction lysimeter prior to H202 addition and not to be indicative of in- complete TCE degradation.
In both treatability runs, in which 10% by volume of either water or H202 was mixed with Portsmouth soil, the posttreatment soil was considerably more moist than the untreated soil, but no freestanding moisture was observed. After treatment, the soil could be formed into a ball that held together after compaction. It was observcd that the peroxidc-treated soil formed smaller, i no re finely divided clumps than the DI water-treated soil.
54

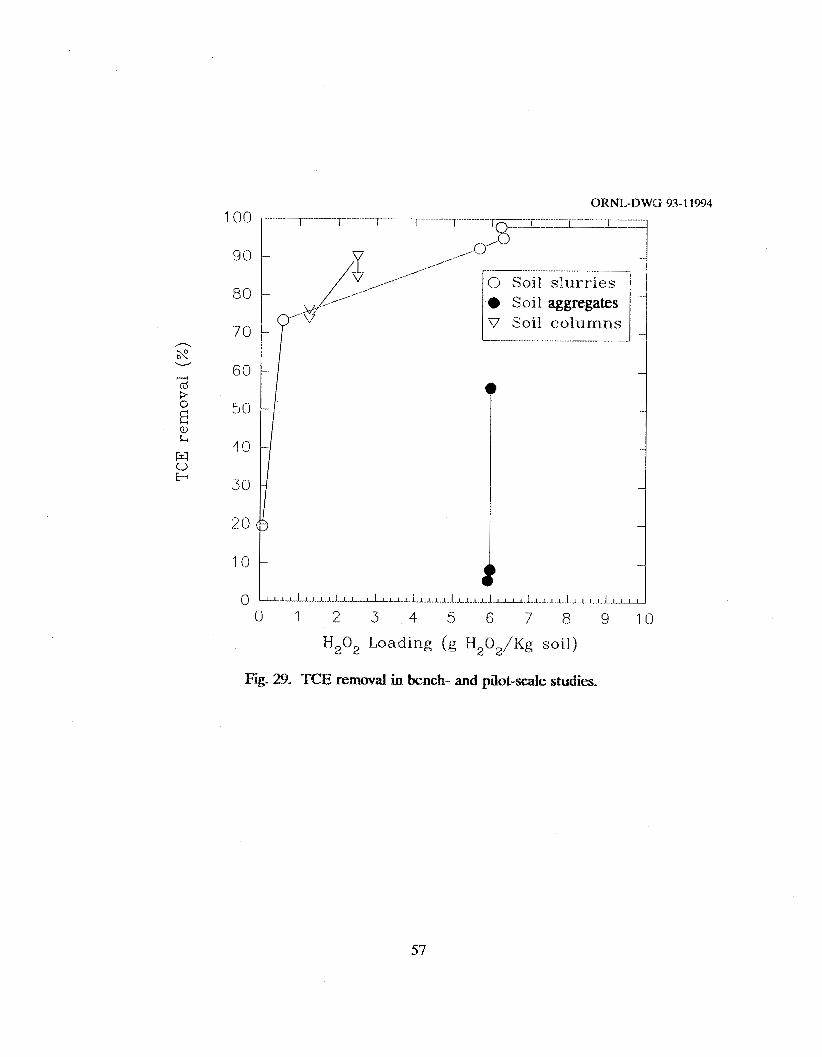
In Figs. 28 and 29 the combined results oC the bench-scalc and pilot-scale studies are shown. Fig. 29 gives more detail of peroxidation at lower H,O, loadings (corresponding to H20, strengths €376 in the slurry studies and 5% in the treatability studies). The same trends are observed for both types of studies with the exception of the bench-scale studies using soil aggregates. The data shown in Fig. 29 demonstrate that removal efficiency is dependent on H,O, loading and apparently independent of initial TCE concentration. Peroxide loadings >3 g H202/kg soil appear to be required to achieve TCE removal efficiencies >%I% for the soils used in these studies, which had TOCs in the range 0.05 to 0.1%. Rapid reaction times (<2 hr) were also observed in both the bench and pilot-scalc studies.
The experirncntal methods used in the laboratory studics conducted during the X-2318 project differed in several significant ways from the studies reportcd in the litcraturc review. This study used exclusively a fine-textured clayey soil, whereas many of the other studics used quartz sand as their soil material. The laboratory studies also used lower H20, loadings with only one treatment of H,O, as opposed to repeated treatments with H,O, used by Watts (1991) and h u n g (1991).
There were, however, sevcral areas in which the findings of this study agreed with those pubfishcd in the Iitcrature. The maximum destruction cfficiencies observed in this study were similar to those reported hy other investigators using TCE-contaminated soils [TCE reductions as high as 98% were reported in this study and by Gurol and Ravikumar (1991)j. Similarly high dcstruction ef€iciciencies were reported by several authors for othcr contaminants in cither soil or aqueous systems. An increase in peroxidation efficiency as the H202 dose increased was observed in this and many of the other studies previously reviewed. Iron amendments were not required to reach high removal cfficiencies, which suggests that sufficient iron is present in native soils to support the formation of Fenton's- like reagents if they are indeed responsible for peroxidative dcstruction of contaminants. Watts e t al. (1991) found peroxidation Lo bc indcpendent of initial contaminant concentration but dependent on soil organic carbon content. The cffect of soil organic carbon was not evaluated in this study because only one soil source was used. However, in the laboratoiy studies, several initial TCE concentrations were studied, and the independence of removal efficiency on contaminant concentration was demonstrated.
The laboratory studics conducted at ORNL were onc component of a series of studics dcsigned to evaluate thc peroxidation of clay soils contaminated with VOCs. These activitics were conducted to support a field demonstration of this process at thc Portsmouth X-231B site. Rcscarchers at the University of Tcnnessce, Knoxville, led by Dr. Kevin Robinson, evaluated the fate of radiolabled TCE during peroxidation and the impact of peroxkkition on the mobilization of mctals. 'Thcsc studim are described in detail

ORNL-DW(3 93-1 1993
100
90
80
70
I
0 Soil slurries S o i 1 aggregates
V Soil colurnns -
\
0 5 10 15 20 25 30 35 40 H202 T.,oading (g II,O,/Kg soil)
56
ORNL-DWG 93-11934 100
90
80
70
60
50
n
R
cd 3
W
r--i
10
0 0 1 2 3 4 5 6 7 8 9 10
H,02 Loading (g H,O,/Kg soil)
Fig. 29. TCE removal ia bench- and pilot-scale studies.
57

in a separate report (Robinson 1992). A brief discussion of this research is presented in the following paragraph,
TCE destruction due to peroxidation was studied in batch experiments performed using 40-mL Vola vials and in minicolumn (6O-mL, 1-in. diam syriiagcs) experimcnts in which soils were contaminated with radiolabeled (e-14) TCE prior to peroxidation. Due to logistical concerns regarding the handling of X-231B soil, the soil used in the university studies was not from the X-231B site. The objective of these studies was to account for TCE and its oxidation by-products during and after peroxidation. A loam soil with an organic carbon content of -0.3% was used. R ~ b i n s ~ n observed TCE reductions as great as 60% and a significant (as much as 60%) volumetric expansion of soils after peroxidation. The radiolabeled ‘I’CE studies showed an incrcase in activity in both carbon and alkaline vapor traps as the H20, loading was increased from 0 to 25 g H202/kg. ?‘he maximum TCE rcduction cabservcd in the radiolabelcd TCE studies was 40%. Metals mobilization studies indicated that with repeated peroxidations treatmcnts, some leaching of metals will occur. However, at the K,O, loading levels determined to be effective in the ORNL studies (4% N20, strength; <20 g H,O,/kg soil), metals mobilization did not appear to QCCUC in the experiments conducted by Robinson.

5.1 CONCLUSIONS
The hench- and pilot-scale peroxidation studies described herein were conducted to assess the potential for peroxidation as an environmcntal restoration technique for VOC-contaminated, low permeability, clayey soils such as those found at the Portsmouth 231-B site. 'The laboratory studies were conducted using a limited number of operating conditions. Only those paramcters that could be easily and cconomically varied in1 the field wcre evaluated. As a result of the laboratory investigations, the following conclusions have been reached:
1.
2.
3.
4.
5.
6.
5.2
H202 degrades TCE under the conditions maintained during the laboratory studies, with removal rates as high as 98%.
TCE degradation efficiency increases with increasing H202 strength.
Peroxidation treatment effeciencies appear to be independent of initial TCE concentration for the range of conditions tested. Treatment efficiency may be more dependent on soil mineralogy and TQC content than initial TCE,
Peroxidation is a rapid reaction and is near completion within 2 after W20, addition.
In soil matrices, peroxidation efficiency may be limited by the ability to deliver oxidant to the site of the target contaminant.
Soil does not appear to bc adversely affected by the addition of a wcak H202 s~lu t ion (5% strcngth) at a volumetric kvel equal to 10% of the pre-treatcd soil volume.
On the basis of the results of this investigation, peroxidation of Portsmouth soil contaminated with VOCs appears to be a viable environmental restoration technique. Further experimentation and field demonstration are required to determine the design and operating conditions under which treatment would be optimal.
The ORNL laboratory studies described herein provide information regarding the peroxidation of Portsmouth soil contaminaled with TCE undcr a limited number of operating conditions. Future laboratory studies should be broadened to include rnorc than one soil source and target contaminant.
59

Specific areas that should be inc!uded in future laboratory studies include the following:
1. Evaluate the effects of soil mineralogy a i d TOC content on peroxidation treatment efficiency.
2. Evaluate effccts of temperature and pH on peroxidation treatment efficiency.
3. Evaluate effects of peroxidation on microbial activity.
4. Evaluate effects of peroxidation on metals mobilization.
5. Evaluate effects of peroxidation on other chlorinated and nonchlorinated organics.
6. Investigate alternative methods to deliver M2Q2 to contaminated soil.
60

Bellamy, W. D., G. T. Mickman, P. A. Mueller, and N. Ziernba. 1991. Treatment of VOC- contaminated groundwatcr by hydrogen pcroxide and ozone oxidation. Res. J. WPCF 63: 120-28.
Bowcrs, A. R., P. Gaddipati, W. W. Eckenfclder, Jr., and R. M. Monsen. 1989. Treatment of toxic or refractory wastewaters with hydrogen peroxide. Wat. Sci. Tech, 21:477-86.
Glazc, W. H., and J.-W. Kang. 1988. Advanced oxidation processes for treating groundwater contaminated with TCE and PCE: Laboratory studies. Res. Technol. J- AWWA 5:57-63.
Gurol, M. D., and J. X. Kavikunnar. 1991. Chemical oxidation of hazardous ampounds in soil. pp. 296-302. In Proceedings of National Research and Development Conference on the Control of Hazardous Material.
h u n g , S. W., R. J. Watts, and G . C. Miller. 1992. Degradation of perchloroethylene by Fenton's reagent: Speciation and pathway. J. Environ. Qual. 21:377-81.
Murphy, A. P., W. J. Rocgli, M. K. Fricc, and C. ID. Moody. 1989. A fenton-like reaction to neutralize formaldehyde waste solutions, Environ. Sci. Technol. 23:166-69.
Ravikumar, J. X., and M. D. Gurol. 1991. Effectiveness of chemical oxidation to enhance the biodegradation of ~ e ~ t a c ~ ~ ~ ~ r o p h e ~ ~ ~ ~ in soil: A laboratory study. pp. 21 1-21. Proceedings of the Twenty-Third Mid-Atlantic Industrial Waste Conference. Tcchnomic, Lancaster, Pennsylvania.
Robinson, K. G. 1992. In situ hydrogen peroxide treatment of solvent contaminated soils. Report. University of Tennessee, Knoxville.
Siegrist, R. L. 1992. Volatile organic compounds in contaminated soils: "he nature and validity of the measurement process. J. X-Iazard. Mater. 293-15.
Siegrist, R.L. 19%. Measurement error potential and control when quantifying volatile hydrocarbon concentrations in soils.
Sicgrist, R. L., D. A. Pickcring, C. A. Muhr, 0. M. West, and T. J. Mitchell. 19%. The X-23 1B Project for in situ treatment using physicochcmical processes coupled with soil mixing: Site characterization and contaminant distribution modeling. ORNL/TM-12258. Oak Ridge National Labosato;ly, Oak Ridgc, Tennessee.
61

Watts, R. J., B. A. Rausch, S. W. h u n g , and M. D. IJdell. (1.990). Treatment of pentachlorophenol-contaminated soils using Fenton’s reagent. Waz. Waste Haz. Mater. 7335-45.
Watts, R. J., S . W. Leung, M. D. Udell, 191. Treatment of contaminated soils using catalyzed hydrogen peroxide. In Proceedings to the First International Symposium on Chemical Oxidation. Technomic, Nashville, Tennessee.
Watts, W. J. 1992. Hydrogen peroxide for physicochemically degrading petroleum- contaminated soils. Remediation 3:413-25.
Weber, W. J., Jr. 1972. Physicochemical Processes for Water Quality Control. Wiley- Knterscience, A Division of John Wiky SC Sons, ilnc., New York.
West, 0. M., R. L. Siegrist, k J. Lucero, H. I-,. Jennings, D. W. Greene, and S . Schmunk. 1393. The X-23 1R project for in situ treatment using physicochemical processes coupled with soil mixing: Laboratory evaluation of vapor stripping processes. ORNIJTM-12260. Oak Ridge National Laboratory, Oak Ridge, Tennessee.
62

APPENDIX A
CALCULATION OF TCE DTSTRIBUTXON IN CONTROL BENCH EXPERIMENT
Question: N t e r water has been added to the contents of a ZHE vessel (posttreatment) how much of the remaining TCE is sorbed onto soil and how much TCE remains in solution (Le., what percentage of the TCE remaining after treatment can be found in the ayeous phase)?
where
C, = Total VQC concentration per unit weight dry soil (pg/g)
= Soil vapor phase VOC concentration (pg/cm3)
C, = soil solution vOC concentration (pg/crn3>
C, = So41 sorbed VOC concentration ( p g / g )
pb = soil bulk density (g/cm3)
0 =: Soil water content (cin3/cm3)
Q! = Soil air content (cm3/cm3)
Freundlich isotherm relationships can be used to describe the amount of VOCs (in this case TCE) sorbed from aqueous solutions onto soils:
1 I
Cs = KC,"
where: n = empirical constant K = partition coefficient (mL/g)
For dilute aqucous solutions of VQCs, K is often referrcd to as the distribution cocffiicient, K,, a parameter strongly related to soil organic matter content, foM and the organic mattcr/water partition coeflicient,
63

For TCE bM I= 27.4 mL/g
and the average percent TOC in the soil, used to prepare slurries was 0.09 wt%
Thus:
KD = 2 7 . 4 x --- 0 ' 0 9 = 0.025mL/g 100
The following information pertaining to the control study No. 1 is needed to determine the percentage of TCE sorbed to soil particles:
ms = mass of soil in slurry = 25.7 g
CT = total mass of TCE spiked to slur~gr = 0.048 mg
V = final volume of fluid in ZHE vessel = 153 mI,
Using the experimentally determined value of C, and assuming that n is equal to 1 (a valid assumption for dilute aqueous TCE solutions), substituting into equation (2) yields:
Calculate mass of TCE sorbed onto known mass of soil in slurry.
?lCEsorhed = 0 . 0 0 5 4 x 2 5 . 7 g == 0.14 pg 57
Calculate mass of TCE in aqueous phase in ZlIE vessel.
64

Percentage of total TCE remaining sorbed to soil can now be calculated:
%TCEs = 0m14pg x 1 0 0 = 0.42% 3 3 . 3
This series of calculations reveals that less than 1 % of the TGE remaining in the ZWE vessel after extraction with large volumes of deionized water would be expected to be sorbed to soil surfaces. Therefore, it is reasonable to assume that the all (>93%) of the TCE remaining after treatment will be found in the posttreatment aqueous extracl.

QRNLITM- 12259
INTERNAL DISTRIBUTION
1. 2. 3. 4. S. 6. 7. 8. 9.
10. 11. 12.
13-19. 20. 21. 22. 23. 24. 25. 26. 27. 25.
R. 0. Barnett, Jr. E. D. Bates D. A. Bell H. L. Boston C. H. Brown J. B. Cannon J. W. Cushman N, H. Cutshall T. L. Donaldson T. 0. Early W. Fulkcrson C. W. Francis D. D. Gates C. W. Gehrs T. M. Gilliam D. W. Greene S. E. Herbes S. G. Hildcbrand K. k Jenkins H. L. Jennings P. Kanciruk A. J. Lucero
29. 30. 31. 32. 33. 34. 35. 36 37. 38.
39-43. 44. 45. 46. 47. 48.
49-54. 52.
53-54. 55. 56.
A. P. Malinauskas T. McKnight T. J. Mitchell M. 1. Morris C. A. Muhr D. A. Pickering D. E. Reichle W. Sanford F. E. Sharples D. S. Shriner R. L. Siegrist S. H. Stow R. I. Van Hook J. S. Watson 0. R. West Central Research Library ESD Library ORNL Y-12 Technical Library Document Reference Section Laboratory Records Laboratory Records, RC ORNL Patent Section
EXTERNAL DISTRlBUTION
57-61.
62.
63. 54.
65.
D. T. Davenport, Environmental Restoration Division, Martin Marietta Energy Systems, Portsmouth Gaseous Diffusion Plant, MS 5025, Piketon, Ohk~. R. D'Antoni, Chemical Engineering, Portsmouth Gaseous Diffusion Plant, MS 5025, Pikcton, Ohio. Jeff Dick, SAIC, Portsmouth Gaseous Diffusion Plant, Piketon, Ohio. R. W. Farvolden, Professor, Department of' Earth Scicnces, IJniversity of Water, Ontario N2E 3G1 Canada. J. F. Franklin, Rloedcl Professor of Emsystem Analysis, College of Forest Resources, University of Washington, Anderson Mail AR-IO, Seattle, WA 98195. J. S . Gierke, Assistant Professor, Michigan Technological University, 1400 Townsend Drive, H ~ g h t o n , MI 4993 1-1295.
66.
67
67.
68.
69.
'90.
71.
72. 73.
74.
75.
74.
7'7.
78.
99 -80.
D. Geiser, Office of Technology Development, Tntcrnational Technology Exchange Program, EM-53, U. S. Department of Energy, Washington, D.C. 20585 11. C. Warriss, Institute for the Study of Earth, Oceans, and Space, Science and Engineering Research Buildirng, University of New Hampshire, Durham, NH 03824. G. Y. Jordy, Director, Office of Program Analysis, Office of Energy Research, ER-30, G-226, U.S. Departrncnt of Energy, Washington, DC 20545. P. M. Kearl, ORNL Grand Buiictiosa Office, 2597 B 3/4 oad, Grand Junction, CO 81502. R. Mcehan, DOE Environmental Restoration, Portsmouth Gaseous Diffusion Plaiizt, Piketon, Ohio. Dave Mentzer, SAIC, Portsmouth Gaseous Diffusion Plant, Piketon, Ohio. W. M. Olsen, Professor, Microbiology and Immur?ology Department, University of Michigan, Medical Scicnccs 11, #5605, 1381 East Catherine Street, Ann Arbor, MI 48189-0620 A. Patriaos, Director, Environmental Sciences Division, Office of Health and Environmental Rescwch, ER-74, US. Department of Energy, Washington, DC 20585. M. G. Robinson, Assistant Brofcssor, The University of Tennessee, Berkins Hall, Knoxville, TN 3799$-2(BlQ. F. 9. Wobber, Environmental Sciences Division, Office of Health and Environmental Research, ER-74, U.S. Department of Energy, Washington, P X 20585" J. Zutnian, ORNL Grand Junction Office, 2597 13 3/4 Road, Grand Junction, co 81502. Office of Assistant Manager for Energy Research and Development, US. Department of Energy Oak Ridge Operations, Y.O. Box 2001, Oak Ridge,
Office o f ScientXic and Technical Information, P.O. BQX 62> Oak Ridge, 1 N 37831
TN 37831-8600.
68