X / 1 Measurement Accuracy Considerations for Characterizing Low Impedance Stripline and Microstrip...
84
x / Measurement Accuracy Considerations for Characterizing Low Impedance Stripline and Microstrip PC Board Traces John Rettig Principal Engineer Tektronix, Inc. Beaverton, OR 97077 (503)-627-3232 [email protected]
-
Upload
bethanie-richardson -
Category
Documents
-
view
222 -
download
0
Transcript of X / 1 Measurement Accuracy Considerations for Characterizing Low Impedance Stripline and Microstrip...
x /1
Measurement Accuracy Considerations for Characterizing Low
Impedance Stripline and Microstrip PC Board Traces
John Rettig
Principal EngineerTektronix, Inc.
Beaverton, OR 97077(503)-627-3232

x /2
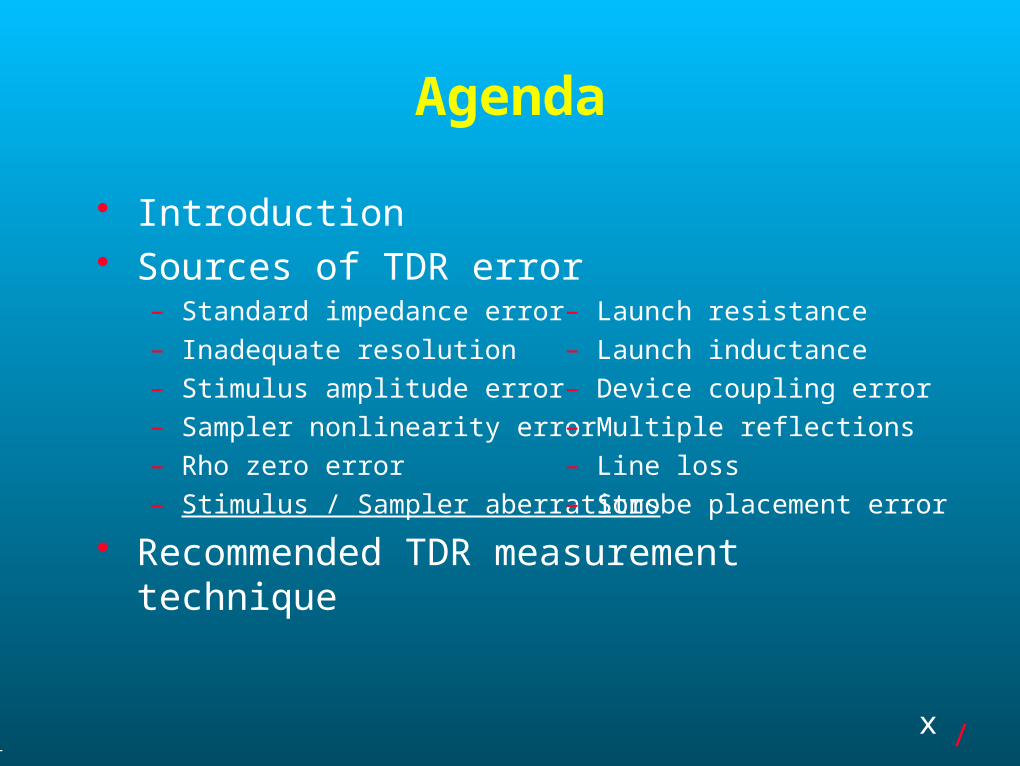
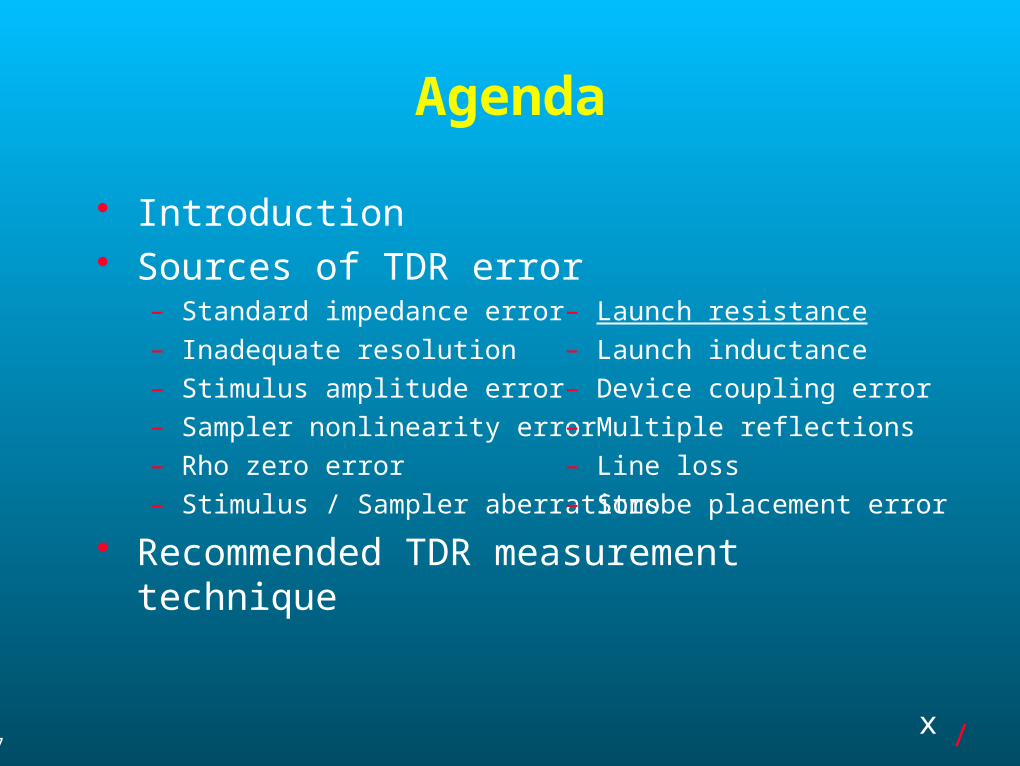
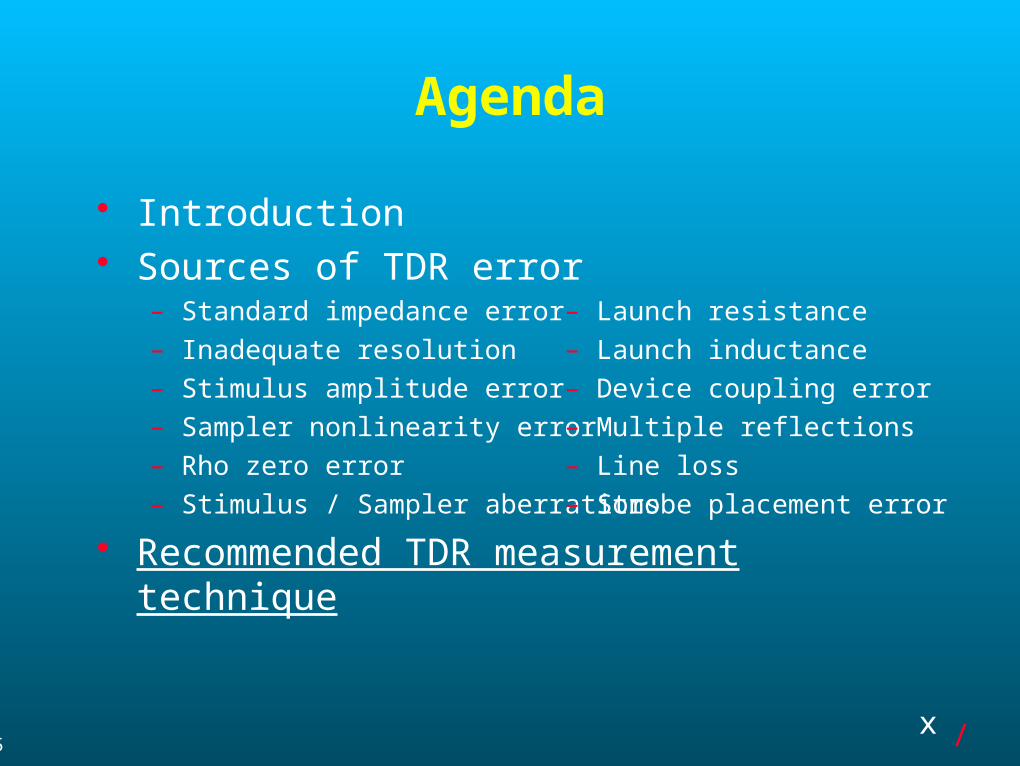
Agenda
Introduction Sources of TDR error
– Standard impedance error– Inadequate resolution– Stimulus amplitude error– Sampler nonlinearity error– Rho zero error– Stimulus / Sampler aberrations
Recommended TDR measurement technique
– Launch resistance– Launch inductance– Device coupling error– Multiple reflections– Line loss– Strobe placement error

x /3
Interconnect Issues At high-speeds, interconnect limits system
performance. It is desirable to characterize and model
interconnect to predict the performance early in the design phase.
ImpedanceChange
Transmitted Energy
Incident Energy
Reflected Energy

x /4
Interconnect Issues
Whenever energy transmitted through any medium encounters a change in impedance, some of the energy is reflected back toward the source
The amount of energy reflected is a function of the transmitted energy and the magnitude of the impedance change
The time between the transmitted energy and the reflection return is a function of the distance and velocity of propagation

x /5
Time Domain Reflectometry - a measure of reflection in an unknown device, relative to the reflection in a standard impedance.
Compares reflected energy to incident energy on a single-line transmission system– Known stimulus applied to the standard impedance is
propagated toward the unknown device– Reflections from the unknown device are returned toward
the source– Known standard impedance may or may not be present
simultaneously with the device or system under test
TDR Overview

x /6
TDR Overview - Typical System
Incident Step
50
Step Generator
Reflections
Sampler
t = 0

x /7
TDR Overview
Elements– High speed stimulus, usually a step
generator
– High speed sampling oscilloscope
– Back (internal) termination
– Interconnect system
– Device launch
– Known standard impedance

x /8
TDR Overview
TDR Waveforms - Open, Short and 50 terminationsAmplitude
Open (Z =)
(Z = 50)
Short (Z = 0)
Time
Reflected
+ 1
0
- 1
t0 t1
Incident

x /9
Reflection Coefficient and Impedance
Where Z represents the test impedanceZ0 is the reference impedance is measured by the oscilloscope
0
0)(ZZ
ZZ
incident
reflectedRho
1
10ZZ

x /10
Measuring Impedance
200ps/div
div
Cursor 1 at 50Reference Line
Cursor 2 at Reflection from Load Resistor
752.01
2.0150
1
10
ZZ
2.0
)(
incident
reflectedRho

x /11
Measuring Impedance
1
10ZZ
020406080
100
120140160180200
-1 -0.8 -0.6 -0.4 -0.2 0 0.2 0.4 0.6 0.8 1
500 Z
x /12
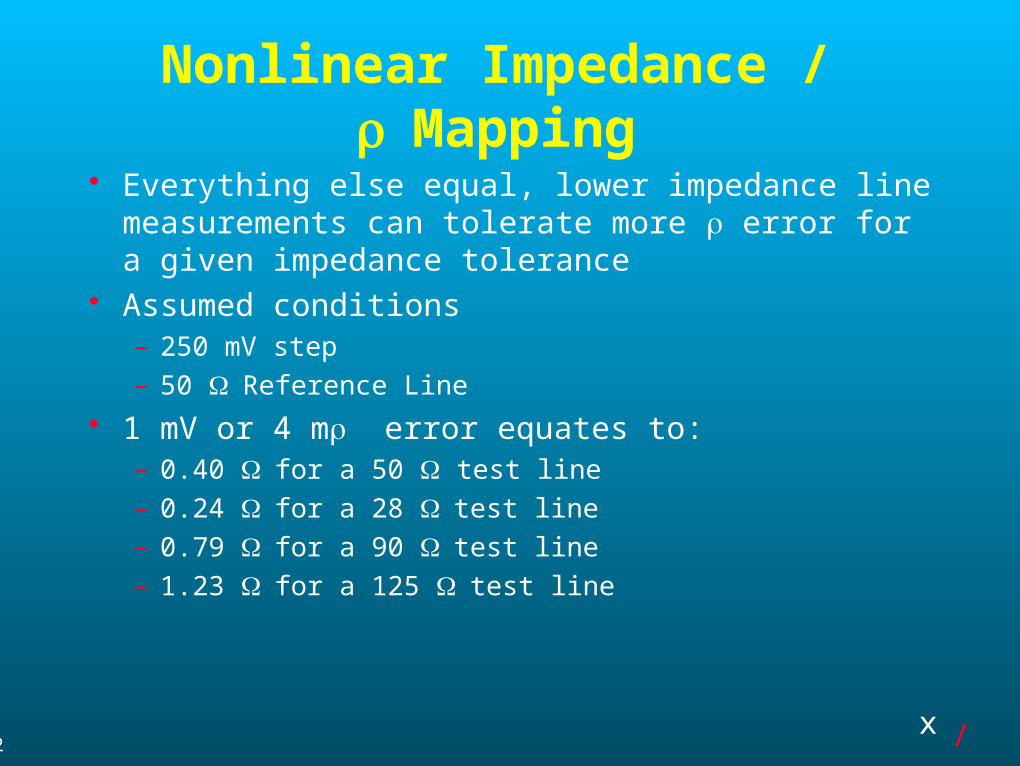
Nonlinear Impedance / Mapping
Everything else equal, lower impedance line measurements can tolerate more error for a given impedance tolerance
Assumed conditions– 250 mV step
– 50 Reference Line
1 mV or 4 m error equates to:– 0.40 for a 50 test line
– 0.24 for a 28 test line
– 0.79 for a 90 test line
– 1.23 for a 125 test line

x /13
Measuring Impedance
20
21
2
ZZ
020406080
100
120140160180200
-1 -0.8 -0.6 -0.4 -0.2 0 0.2 0.4 0.6 0.8 1
500 Z

x /14
TDR Overview - Lumped Discontinuities

x /15
TDR Overview - Microstrip Discontinuities
ConnectorCapacitive
DiscontinuityInductive
Discontinuity
Open Circuit
Incident Step
Volts or
Round Trip Time

x /16
TDR Accuracy Issues - First Order, no Explicit Z0
Standard Controlled-impedance environment
– Back termination impedance– Interconnect system
Vertical– Step amplitude accuracy– Sampler vertical accuracy
Horizontal– Step position accuracy– Sampler position accuracy

x /17
Agenda
Introduction Sources of TDR error
– Standard impedance error– Inadequate resolution– Stimulus amplitude error– Sampler nonlinearity error– Rho zero error– Stimulus / Sampler aberrations
Recommended TDR measurement technique
– Launch resistance– Launch inductance– Device coupling error– Multiple reflections– Line loss– Strobe placement error

x /18
Employing a Standard Impedance
Inline with launch Exchange with device under test
TDR UNIT1
2
DUT
INTERCONNECT
EXCHANGE
INLINE

x /19
Standard Impedances
Absolute Standards– Usually air lines built with extreme care employed for
control of physical dimensions– Easily disassembled for checking dimensions– Standards Labs can characterize and periodically
check– Based on physical equations like coaxial expression
inner
outer
R
RZ ln
20
x /20
Standard Impedances
Golden Standards– Absolute accuracy less important– Can be anything stable, repeatable, portable– Often need several sets depending upon supply chain– Characterization needs “round robin” or similar
redundant checking

x /21
Microstrip Standards
Microstrip standards depend on many parameters with dispersed controls– Physical dimension (width w, thickness t, height h)– Dielectric media (glass and epoxy characteristics,
glass/epoxy ratio, homogeneity)– PCB processes
backw
w th
backtrel
0
x /22
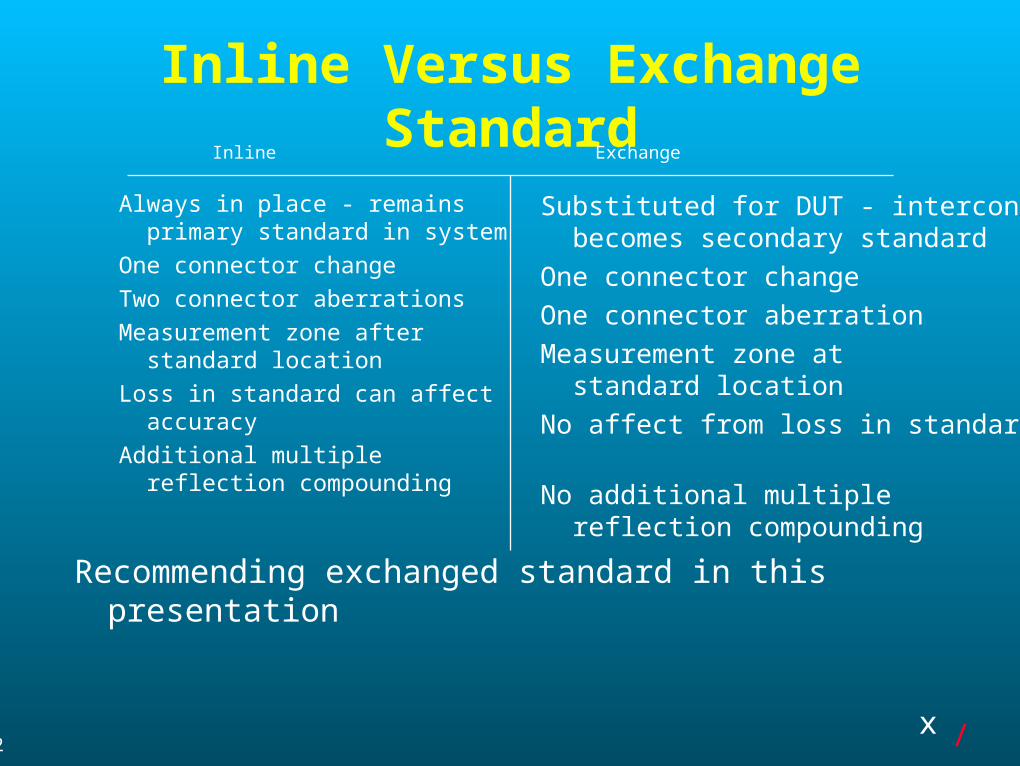
Inline Versus Exchange Standard
Always in place - remainsprimary standard in system
One connector change
Two connector aberrations
Measurement zone afterstandard location
Loss in standard can affectaccuracy
Additional multiplereflection compounding
Recommending exchanged standard in this presentation
Substituted for DUT - interconnectbecomes secondary standard
One connector change
One connector aberration
Measurement zone atstandard location
No affect from loss in standard
No additional multiplereflection compounding
Inline Exchange

x /23
Standard Impedances
For reasons that will become apparent, want to use standard impedance close to device under test– Error on device measurement is primarily additive
50 is the most commonly available and least expensive line– Can Parallel Two Lines for 25Using Tee(s)
Z1
Z2

x /24
Agenda
Introduction Sources of TDR error
– Standard impedance error– Inadequate resolution– Stimulus amplitude error– Sampler nonlinearity error– Rho zero error– Stimulus / Sampler aberrations
Recommended TDR measurement technique
– Launch resistance– Launch inductance– Device coupling error– Multiple reflections– Line loss– Strobe placement error
x /25
TDR Resolution
Insufficient TDR resolution– Results from closely spaced discontinuities being
smoothed together– Can miss details of device under test– May lead to inaccurate impedance readings

x /26
TDR Resolution
SMA through F-F barrel(8.6 mm dielectric)
Each end individually loosened 2.5 turns(1.8 mm)
Both ends loosened 2.5 turns; risetime limits
–Top -- Full (~28 ps)–Mid -- 50 ps–Bottom -- 75 ps

x /27
TDR Resolution
TDR system risetime is related to resolution– Reflections last as long as the incident step and display as
long as the system risetime– First discontinuity reflection is witnessed– Twice the propagation delay between discontinuities elapses– Second discontinuity reflection is witnessed– Ideally, leading corner of reflection from second discontinuity
arrives back at first discontinuity no earlier than lagging corner of reflection from first discontinuity, thus
)()( 21
systemRresolution TT

x /28
TDR Resolution
Previous rule assumes 0-100% ramp model; real world specifies 10-90% quadratic-type responses
System rise time is characterized by fall time of reflected edge from ideal short at test point
Other second order factors enter picture System rise time approximated by:
2)(int
2)(
2)()( erconnectRsamplerRstepgenRsystemR TTTT

x /29
TDR Resolution
Resolution Factors– Rise Time– Settling Time– Foot and Preshoot
Settling Time
Foot
Rise Time
Preshoot
x /30
Agenda
Introduction Sources of TDR error
– Standard impedance error– Inadequate resolution– Stimulus amplitude error– Sampler nonlinearity error– Rho zero error– Stimulus / Sampler aberrations
Recommended TDR measurement technique
– Launch resistance– Launch inductance– Device coupling error– Multiple reflections– Line loss– Strobe placement error

x /31
Stimulus Amplitude Error
Percentage Z error roughly doubles percentage error near Z0
Amplitude shift with DC termination– 6-8 m typical 0 - 50– 6-8 m typical 50 - open
Can be entirely compensated by directly measuring incident amplitude
0
0)(ZZ
ZZ
incident
reflectedRho
20
21
2
ZZ Amplitude impacts here

x /32
Stimulus Amplitude Compensation
Measure incident amplitude during calibration cycle
Keep same DC loading on TDR system during device test
Calibration cycle can be same as standard impedance check
Note that use of standard impedance close to device minimizes any residual errors

x /33
Agenda
Introduction Sources of TDR error
– Standard impedance error– Inadequate resolution– Stimulus amplitude error– Sampler nonlinearity error– Rho zero error– Stimulus / Sampler aberrations
Recommended TDR measurement technique
– Launch resistance– Launch inductance– Device coupling error– Multiple reflections– Line loss– Strobe placement error

x /34
Sampler Nonlinearity Error
Samplers have limited dynamic range relative to general purpose oscilloscopes
Extremes of dynamic range may have small nonlinear behavior
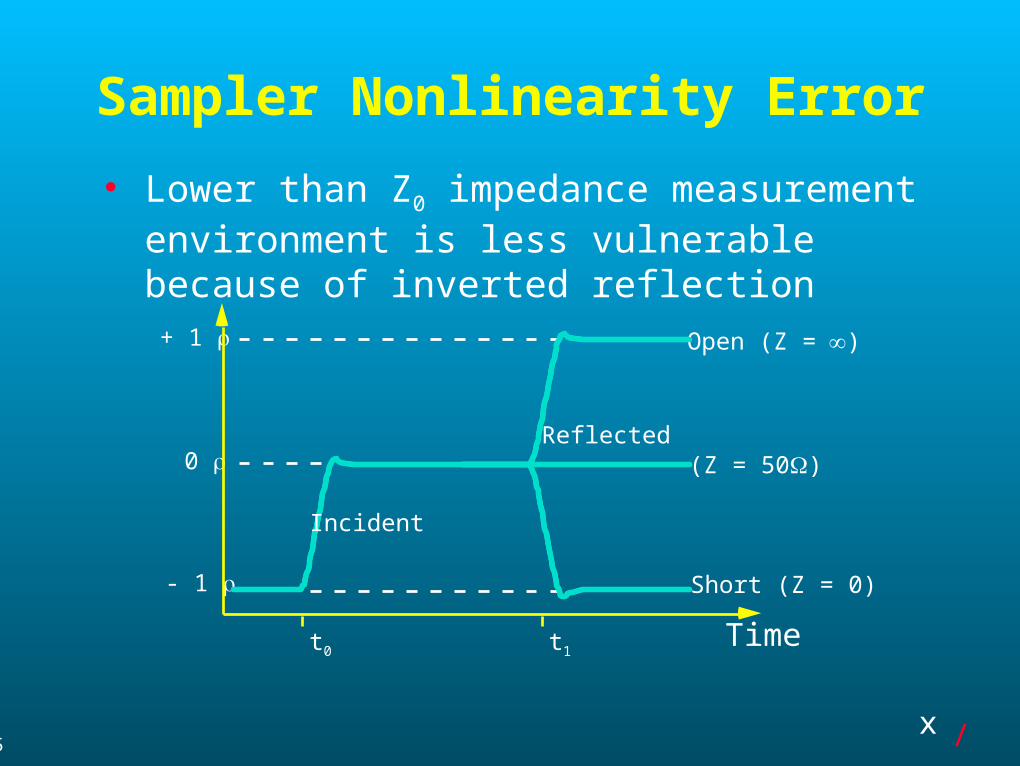
Use of limited range stimulus minimizes this Lower than Z0 impedance measurement
environment is less vulnerable because of inverted reflection
Usually very small effect
x /35
Sampler Nonlinearity Error
Lower than Z0 impedance measurement environment is less vulnerable because of inverted reflection
Open (Z =)
(Z = 50)
Short (Z = 0)
Time
Reflected
+ 1
0
- 1
t0 t1
Incident

x /36
Sampler Nonlinearity - Recommendations
Preserve identical gain and possibly offset settings for all portions of a given standard impedance calibration followed by DUT measurements

x /37
Agenda
Introduction Sources of TDR error
– Standard impedance error– Inadequate resolution– Stimulus amplitude error– Sampler nonlinearity error– Rho zero error– Stimulus / Sampler aberrations
Recommended TDR measurement technique
– Launch resistance– Launch inductance– Device coupling error– Multiple reflections– Line loss– Strobe placement error

x /38
Rho Zero Error
Start of incident edge may not register as zero Ohms calibration usually assumes -1 = 0
1
10ZZ
20
21
2
ZZ

x /39
Rho Zero Error
Physical hardware may not use zero volt baseline - baseline instead restored in software
Typical 2 mhysteresis total (1 m) in software algorithm
x /40
Rho Zero Error
Can be entirely compensated - use amplitude measurements for incident and reflected amplitudes
Disable software baseline restoration if present In absence of other accuracy improvement
techniques, use of a set zero rho feature along with standard impedance close to device, provides remarkable improvement
x /41
Agenda
Introduction Sources of TDR error
– Standard impedance error– Inadequate resolution– Stimulus amplitude error– Sampler nonlinearity error– Rho zero error– Stimulus / Sampler aberrations
Recommended TDR measurement technique
– Launch resistance– Launch inductance– Device coupling error– Multiple reflections– Line loss– Strobe placement error

x /42
Stimulus / Sampler Aberrations
Aberrations - foot, preshoot, ringing, longer term effects– Can amount to several percent– Short or long term– All reflections are replicas of the original step, filtered
by reflecting device– Foot distorts response before the reflection, affecting
establishment of baseline
With linear devices, it doesn’t matter how aberrations are apportioned between stimulus and sampler

x /43
Aberration Replication
Settling replica
Preshoot replica
Incident
Reflected

x /44
Stimulus / Sampler Aberrations
Typical specifications– 10 ns to 20 ps before step: ±3% or less– <300 ps after step: +10%, -5% or less– 300 ps to 5 ns after step: ±3% or less– Elsewhere: ±1% or less

x /45
Stimulus / Sampler Aberrations
100 ps/div
1 ns/div
10 ns/div
100 ns/div

x /46
Stimulus / Sampler Aberrations
Measurement over a zone to establish levels and amplitude includes:– Device reflections– Stimulus / Sampler aberrations incident– Stimulus / Sampler aberrations reflected
Recommended measurement technique will involve:– Use of exchanged impedance standard– Measurement over identical zones for both standard
impedance and device
x /47
Agenda
Introduction Sources of TDR error
– Standard impedance error– Inadequate resolution– Stimulus amplitude error– Sampler nonlinearity error– Rho zero error– Stimulus / Sampler aberrations
Recommended TDR measurement technique
– Launch resistance– Launch inductance– Device coupling error– Multiple reflections– Line loss– Strobe placement error
x /48
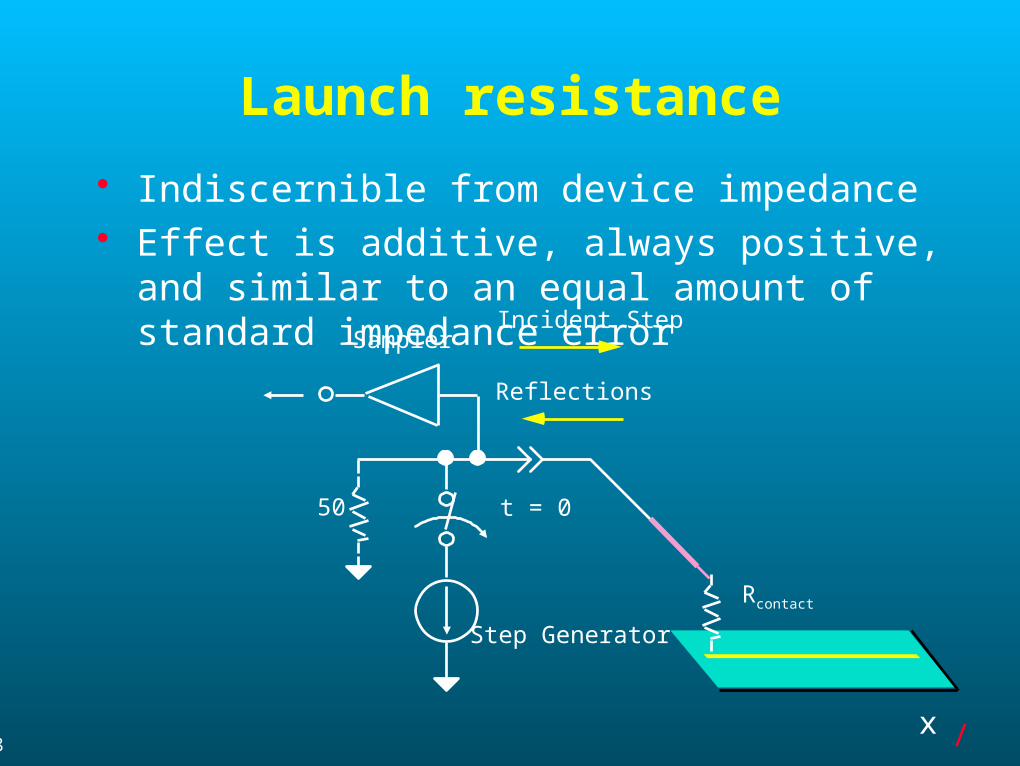
Launch resistance
Indiscernible from device impedance Effect is additive, always positive, and similar to
an equal amount of standard impedance errorIncident Step
50
Step Generator
Reflections
Sampler
t = 0
Rcontact

x /49
Launch resistance May not necessarily be repeatable Most often is reasonable bounded (tens of m)
– Can be measured with 4-wire measurement - replicate several in series if necessary
May also be present to some degree in ground contact
Use of exchanged standard impedance will cancel launch resistance provided it is constant
Otherwise, make estimate of mean value and include for every measurement

x /50
Agenda
Introduction Sources of TDR error
– Standard impedance error– Inadequate resolution– Stimulus amplitude error– Sampler nonlinearity error– Rho zero error– Stimulus / Sampler aberrations
Recommended TDR measurement technique
– Launch resistance– Launch inductance– Device coupling error– Multiple reflections– Line loss– Strobe placement error

x /51
Launch Inductance
Caused by– Non-characteristic launches– Air gaps at launch– contorted launch paths– Poor attention to ground attach
Time constant is longer for smaller Z0
DUTZZ
L
0
0Z DUTZL
x /52
Launch Inductance
May affect measurement zone– Lumped time constant decay usually lasts much
longer than propagation through– Multiple reflections carried into zone– If C present, may have second order ring (though
usually only a larger ZDUT is more vulnerable)
May be partially compensated– Must be absolutely repeatable attach geometry
– Standard impedance Z0 must be very close to ZDUT

x /53
Launch Inductance
Launch from 0.141” semi-rigid coax to microstrip through center and ground wires, with gap
L-R: gap = 0/1/2/3 mm

x /54
Agenda
Introduction Sources of TDR error
– Standard impedance error– Inadequate resolution– Stimulus amplitude error– Sampler nonlinearity error– Rho zero error– Stimulus / Sampler aberrations
Recommended TDR measurement technique
– Launch resistance– Launch inductance– Device coupling error– Multiple reflections– Line loss– Strobe placement error

x /55
Crosstalk The coupling of energy from one line to another Three Elements Contribute to Crosstalk:
– Port terminations
– Stimulus
– Moding on transmission system
Generalities:– Proportional to the line length
– Proportional to rise time of driving signal
– Can be positive or negative (inductive or capacitive)
– Occurs in both forward (near-end) and backward (far-end) directions
– Non-characteristic port terminations make it worse

x /56
Crosstalk Measurement Techniques
Set up TDR on aggressor line Observe victim lines with TDT Take care to terminate all other lines
TDR1
2
+
50
50
DUT

x /57
Crosstalk
Crosstalk between adjacent 50 runs on FR4 withW=2.5 mmS=2 mmFar end 50 terminations
Aggressor: 200 m/divVictim: 4%/div
x /58
Crosstalk Adjacent microstrips and striplines will always
crosstalk to a degree if fringing fields overlap Impedance measurements include loading of
adjacent lines, whether intended or not Three key questions:
– Is the geometry measured representative of the geometry in the application?
– Are the port terminations of adjacent lines representative?
– Are the driving conditions of adjacent lines representative?

x /59
Agenda
Introduction Sources of TDR error
– Standard impedance error– Inadequate resolution– Stimulus amplitude error– Sampler nonlinearity error– Rho zero error– Stimulus / Sampler aberrations
Recommended TDR measurement technique
– Launch resistance– Launch inductance– Device coupling error– Multiple reflections– Line loss– Strobe placement error

x /60
Superposition of Reflections
Z1 Z2 Z3 Z4 Z0Z0
Effect of multiple impedance discontinuities

x /61
Problems with Multiple Reflections
Multiple reflections– Can appear anywhere in a waveform– Can look like anomaly or Z-shift– Might be controllable, but always are predictable
TDR trace is a reflection profile, not a true impedance profile
Resolution may be lost due to rise time degradation

x /62
Problems with Multiple Reflections
TDR trace may be difficult to interpret in the presence of multiple reflections
Can be deconvolved with DSP if impedance profile and other information is needed
Can be compensated with techniques using exchanged standard impedance, if only impedance is needed

x /63
Agenda
Introduction Sources of TDR error
– Standard impedance error– Inadequate resolution– Stimulus amplitude error– Sampler nonlinearity error– Rho zero error– Stimulus / Sampler aberrations
Recommended TDR measurement technique
– Launch resistance– Launch inductance– Device coupling error– Multiple reflections– Line loss– Strobe placement error

x /64
Transmission Line Losses
Affects TDR and TDT measurements– Long dribble up time constants– Impedance accuracy affected– High frequency details attenuated– Risetime (and therefore resolution) increased
Loss mechanisms– DC resistive losses– Skin effect losses– Dielectric losses– Coupled losses (crosstalk loss)

x /65
Transmission Line Losses
100 mm 50 microstrip on FR4
Same with 1.5 meters RG58 inserted in front of DUT
x /66
Transmission Line Losses
Generally, skin effect losses dominate at microwave frequencies
Skin effect loss effect on impedance measurements can be compensated within reason
Resolution cannot be regained easily

x /67
Agenda
Introduction Sources of TDR error
– Standard impedance error– Inadequate resolution– Stimulus amplitude error– Sampler nonlinearity error– Rho zero error– Stimulus / Sampler aberrations
Recommended TDR measurement technique
– Launch resistance– Launch inductance– Device coupling error– Multiple reflections– Line loss– Strobe placement error

x /68
Sequential Timebase Architecture
TriggerRecognizer
GatedOscillator
Counter DelayVernier
Integer (30 bits) Fractional (18 bits)
Programmed Delay Register (48 bits)(11801C Illustrated)
Tdelay = 0 - 2.62144 nsTGVCO = 2.62144 ns
Strobe driveSamplingHead
Delay
VernierCompensation
Strobe driveSamplingHead
Delay
VernierCompensation

x /69
Horizontal Error Sources
Gated oscillator error Segment mismatch error Delay vernier error

x /70
Horizontal Error Sources
Time from trigger event (programmed)
(actual)Gated oscillator period error
Trigger to event error T0
Segmentation
Segmentlength Tsegment
mismatch error Ti
Time from trigger event
vernier error (t)
Delay
Ideal 1:1 slope
Gated oscillatorperiod TGVCO
x /71
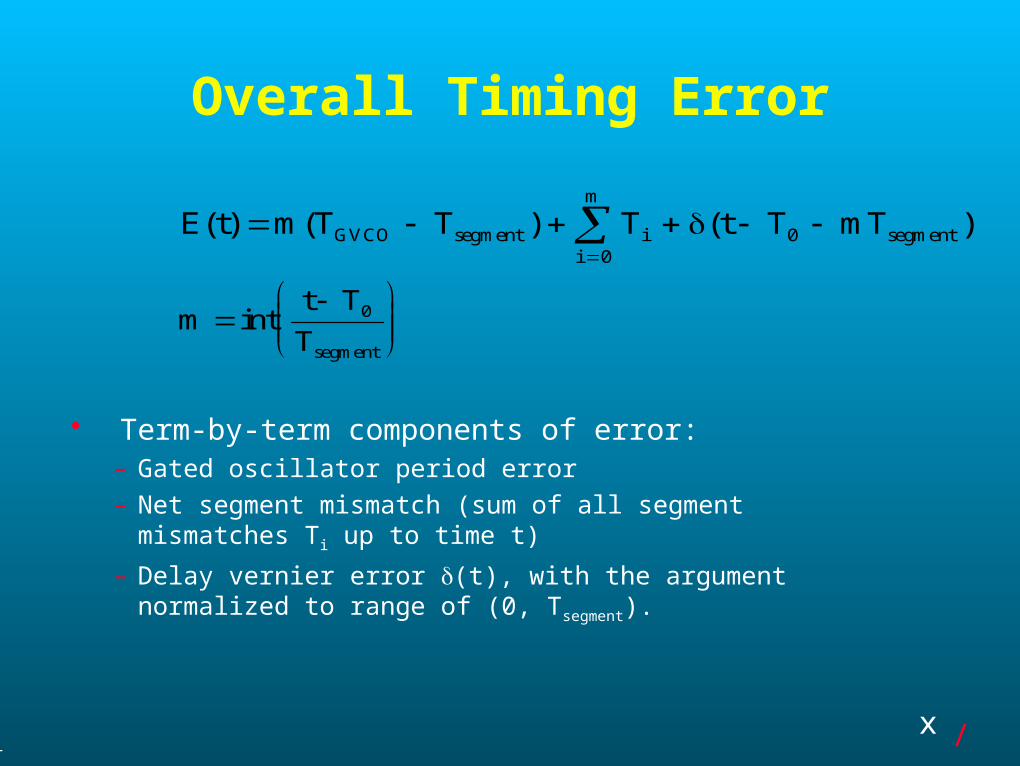
Overall Timing Error
Term-by-term components of error:– Gated oscillator period error
– Net segment mismatch (sum of all segment mismatches T i up to time t)
– Delay vernier error (t), with the argument normalized to range of (0, Tsegment).
E t m T T T t T mTGVCO segment ii
m
segment( ) ( ) ( )
00
mt T
Tsegment
int 0

x /72
Interval Error
Mismatch and GVCO contributions cancel outside of (t1, t2) interval
For short time intervals, delay vernier error terms dominate.
E t t t T nT t T mT
n m T T T
segment segment
GVCO segment ii m
n
( , ) ( ) ( )
( )( )
1 2 2 0 1 0
1
• Single measurement (t1, t2):

x /73
Interpreting Specifications
10 ps interval:1 ps + 4 ppm of position, typical
100 ps interval:2.5 ps + 4 ppm of position, typical
1 ns interval:4 ps + 40 ppm of interval + 4 ppm of position, typical

x /74
Does This Matter?
No, for most TDR testing Yes, for a few situations:
– Absolute accuracy on long run characterizations– Matching long runs (clock distribution)
Accuracy improvement technique“Picosecond Time Interval Measurements”, John B.
Rettig and Laszlo Dobos, IEEE Transactions on Instrumentation And Measurement, Vol. 44, No., 2, April 1995, pp. 284-287.
x /75
Agenda
Introduction Sources of TDR error
– Standard impedance error– Inadequate resolution– Stimulus amplitude error– Sampler nonlinearity error– Rho zero error– Stimulus / Sampler aberrations
Recommended TDR measurement technique
– Launch resistance– Launch inductance– Device coupling error– Multiple reflections– Line loss– Strobe placement error

x /76
TDR Accuracy ImprovementIPC - TM - 650 Method
Eliminates These Errors– Stimulus amplitude error– Sampler nonlinearity error– Rho zero error– Most Stimulus / Sampler aberrations– Launch resistance and inductance, provided it is
duplicated on the standard impedance– Multiple reflections up to exchange point– Line loss
x /77
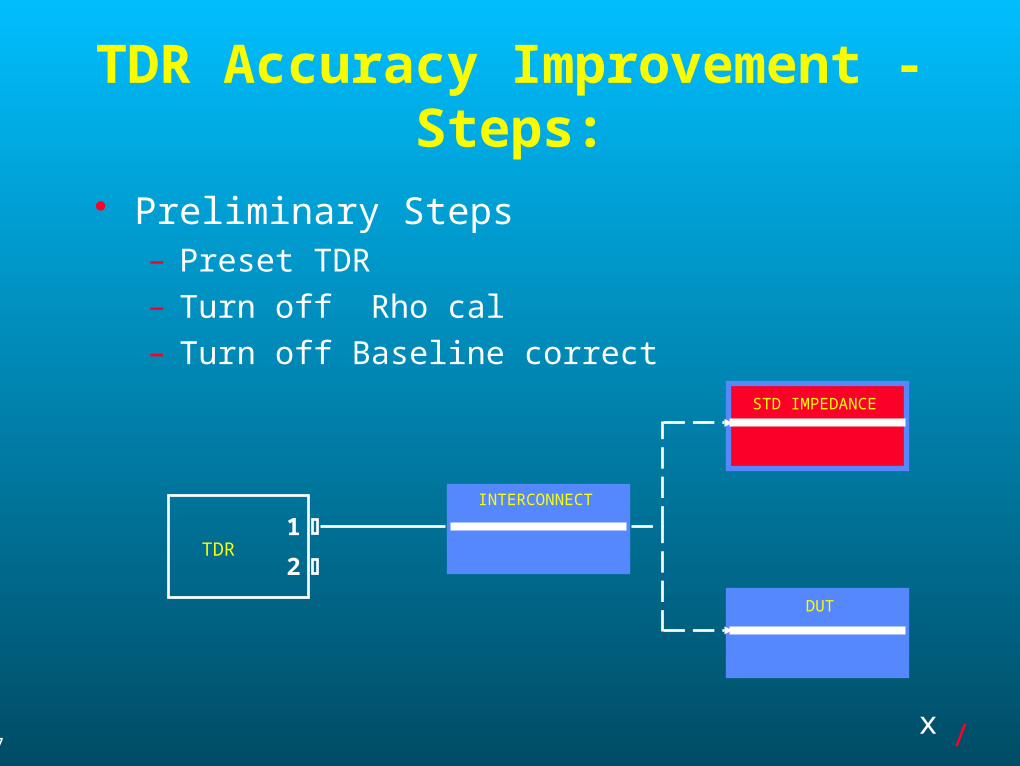
TDR Accuracy Improvement - Steps:
Preliminary Steps– Preset TDR– Turn off Rho cal– Turn off Baseline correct
TDR1
2
DUT
INTERCONNECT
STD IMPEDANCE

x /78
TDR Accuracy Improvement Characterize interconnect as secondary standard
– Disconnect standard impedance and measure size of step incident on standard impedance VI that arrives back at sampler.
Re-connect standard impedance and measure size of step reflected from standard impedance VR, that arrives back at sampler.
Calculate ZINT: ZINT = ZSTANDARD(VI - VR) / (VI + VR) VI
intercon
Open
VRinterconstandard
Open

x /79
TDR Accuracy Improvement Measure DUT impedance against interconnect
– Disconnect DUT and measure size of step incident on DUT VI that arrives back at sampler.
– Re-connect DUT and measure size of step reflected from DUT VR that arrives back at sampler.
Calculate ZDUT: ZDUT = ZINT(VI + VR) / (VI - VR)
VI
intercon
Open
VRintercon DUT
Open

x /80
TDR Accuracy Improvement -
Advantages Reduces problem to three critical measurements
– Interconnect (secondary standard) impedance ZINT
– Incident step at DUT VI
– Reflected step from DUT VR
Employs primary traceable standard - exchange method
Eliminates or minimizes most controllable sources of error
x /81
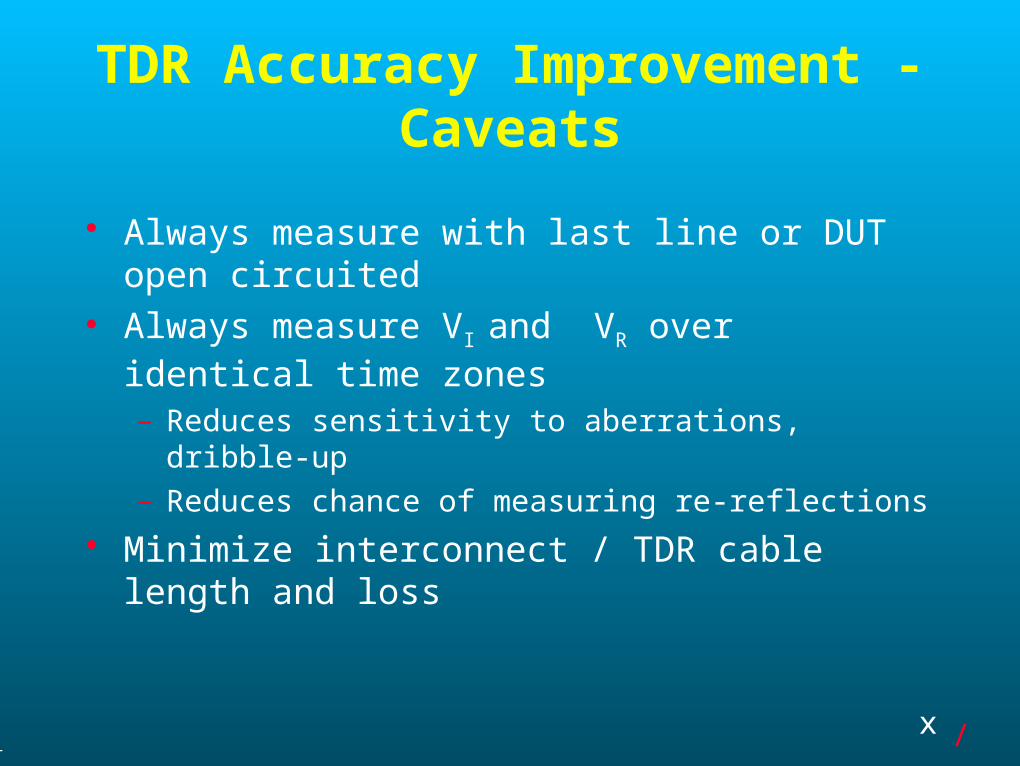
TDR Accuracy Improvement - Caveats
Always measure with last line or DUT open circuited
Always measure VI and VR over identical time zones– Reduces sensitivity to aberrations, dribble-up– Reduces chance of measuring re-reflections
Minimize interconnect / TDR cable length and loss

x /82
TDR Accuracy Improvement - Caveats
Use short, repeatable connector between interconnect and standard impedance or interconnect and DUT
Keep impedances close between impedance standard and DUT– Helps keeping baseline and topline on same screen
– VR will be small, making high accuracy possible
– Sensitivity to accuracy of VR will be very low

x /83
TDR Accuracy Improvement Example
Standard (25 )
VI = 243.04 mV
VR = -84.32 mV
DUT
VI = 243.04 mV
VR = -54.56 mV
ZINT = 51.56
ZDUT = 32.66
x /84
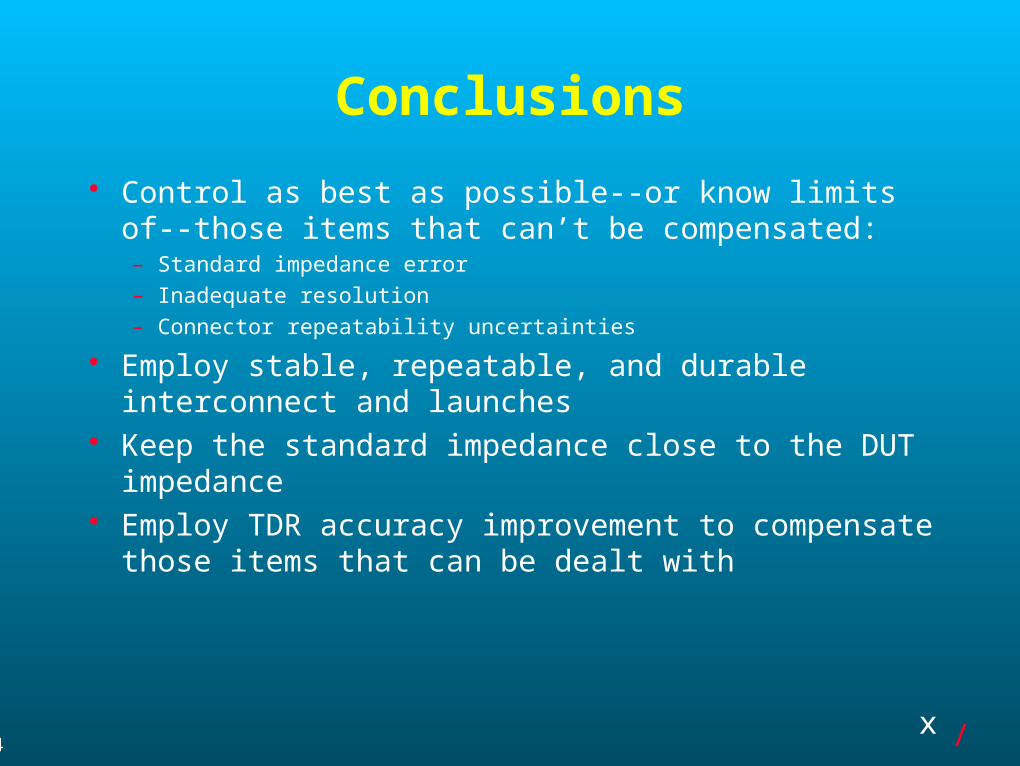
Conclusions
Control as best as possible--or know limits of--those items that can’t be compensated:– Standard impedance error– Inadequate resolution– Connector repeatability uncertainties
Employ stable, repeatable, and durable interconnect and launches
Keep the standard impedance close to the DUT impedance
Employ TDR accuracy improvement to compensate those items that can be dealt with