WYOMING STATE TREASURER A NNUAL REPORTs_Annual... · Walt Disney’s quote pretty well sums up what...
92
WYOMING STATE TREASURER ANNUAL REPORT FOR THE PERIOD JULY 1, 2016 THROUGH JUNE 30, 2017 Mark Gordon, State Treasurer Patricia O’Brien Arp Ph.D., Deputy State Treasurer Patrick D. Fleming, Chief Investment Officer Erica L. Legerski, Director of Finance Lachelle L. Brant, Director of Unclaimed Property
Transcript of WYOMING STATE TREASURER A NNUAL REPORTs_Annual... · Walt Disney’s quote pretty well sums up what...

WYOMING STATE TREASURER
ANNUAL REPORT
FOR THE PERIOD
JULY 1, 2016 THROUGH JUNE 30, 2017
Mark Gordon, State Treasurer Patricia O’Brien Arp Ph.D., Deputy State Treasurer
Patrick D. Fleming, Chief Investment Officer Erica L. Legerski, Director of Finance
Lachelle L. Brant, Director of Unclaimed Property

Mark Gordon WYOMING’s 32nd STATE
TREASURER

Valerie Gordon-Johnson moving cows
Gordon Ranch owned by Mark and Jennie Gordon Photographic Contribution: Mark Gordon
Message from Treasurer Mark Gordon
“Times and conditions change so rapidly that we must keep our aim constantly focused on the future.” Walt Disney’s quote pretty well sums up what Wyoming has experienced over the past decade or so — perhaps longer. Just in my five years as State Treasurer, Wyoming has seen both record high and record low prices for oil, coal, gas and other minerals. Three years ago, Wyoming enjoyed one of her flushest years ever only to find she would suffer a catastrophic loss in revenue the next when commodity prices collapsed. 2016 will be remembered for the fact it represented the biggest loss in revenue for the state on record. 2017, happily, has been a better year.
The story of how important our state’s portfolio is to our economic wellbeing should be familiar by now. It begins with the idea that investment income should help smooth the ups and downs of the commodity cycles Wyoming has known throughout statehood. It continues with the realization that investments have become one of the three leading contributors to our state’s general fund. They now provide a significant part of financing our education system, a crucial ingredient of assuring a bright future; and a means of assuring Wyoming will continue to be a low tax state. Keeping our aim on that future has been the watchword of the Treasurer’s Office during my term in office.
In this annual report, readers will find a lot that is new and, as in the past, I hope you will find the information contained herein to be informative, useful, and constructive. Together with a completely redesigned web page at state.treasurer.wyo.gov, we have worked hard to improve our outreach to the public. Our efforts garnered us recognition in the Peterson Institute’s international transparency rankings for all sovereign funds last year. We came third just behind Norway and New Zealand and ahead of all our domestic peers.

Transparency is important to us because we believe everyone in Wyoming should know what we do in this office. Over this past year from educating on the value of Constitutional Amendment A, to establishing and hosting the Stroock International Sovereign Wealth Forum, to openly recasting the asset allocations for each of Wyoming’s funds, to reorganizing the Unclaimed Property department, to professionalizing our entire office, we have been extraordinarily busy.
This annual report outlines the significant changes we have made to our office in virtually everything we do which has laid the groundwork necessary to modernize, internalize, and revise antiquated and obsolete systems that no longer meet the State’s increasing needs. We undertook these efforts for two principal reasons: 1. The Treasurer’s Office needed to become more efficient, and 2. The Treasurer’s Office could improve its performance while proportionally reducing the budget needed to run it. In short we knew we could do it better, for less.
From top to bottom, we looked at every system and process looking for ways to improve functionality and streamline operations. Some of the most striking differences might be found in the Unclaimed Property division where Director Lachelle Brant and her staff have focused on improving and streamlining the experience of clients who are anxious to recover properties that have gone missing. The results of the division’s efforts are noteworthy: each year on average about eight million dollars of unclaimed properties are sent to the State Treasurer’s Office for safekeeping. Examples of the types of properties that are conveyed to our office can include deposits, uncashed checks, mineral royalties and so on, all of which have not been claimed by a rightful owner. By statute, we are charged with locating the owners of every piece of it or holding it in perpetuity. This last year, the Treasurer’s Unclaimed Property staff completely revamped their processes, brought new technology on board, and as a result have returned almost seven million dollars. Their efforts are more than double the amount of any year’s prior best effort, and is indicative of an office dedicated to returning wayward properties to their rightful owners as promptly and courteously as possible.
The way Wyoming’s Investment Portfolio is managed has undergone extensive changes as well. Here too the office has been working to upgrade quarter-century old technology and the processes to modern state-of-the-art standards. We began with a thorough review of all that we do and why. We measured ourselves against peer funds, and learned from them. What we discovered was that while Wyoming was cheap keeping our staff to a minimum, our approach was not inexpensive. The fees the state paid to outside managers were considerable and, in some cases, managers were unable to return more than we paid them.
Consequently, we realized sizable savings by bringing some of our more routine investments in-house and tying them to well-established indexes. Thus we reduced our overall office budget and improved our returns.

Chief Investment Officer Patrick Fleming and Director of Finance Erica Legerski have played a large role in transforming an antiquated government agency towards a modern investment program at the very time when Wyoming’s reliance on investment returns is more critical than perhaps it has ever been before. The importance of these returns to our state’s wellbeing will only grow in the years to come.
All of this is to say, this office has been extraordinarily busy over the course of this past year from educating the public about the landmark constitutional “Amendment A” to reworking almost every system we rely upon. We are working to make sure our office is equipped to meet the challenges of tomorrow as well as today. In all of this, I want to thank an exceptional staff and a dedicated leadership team including Erica Legerski, Patrick Fleming, Betsy Anderson, and Lachelle Brant for their hard work under trying circumstances.
I especially want to thank Deputy Patricia Arp for persevering in what must have seemed like a year-long log rolling contest. She has kept our ship on course through thick and thin and is delivering one of the foremost Treasury Operations in the country.
The people of Wyoming can be justifiably proud of the work of the Wyoming State Treasurer’s Office. Our record can be found in the pages of this report. Times do change, but our responsibilities to the citizens of Wyoming and our focus on her future does not. Sincerely, Mark Gordon State Treasurer


TABLE OF CONTENTS
Introduction Organization Chart ......................................................................................................................................................... i Investments CIO Outlook .................................................................................................................................................................. 1 Investment Portfolio Pool Balances ............................................................................................................................... 2 Investment Account Balances ........................................................................................................................................ 5 Permanent Wyoming Mineral Trust Fund FY13-FY17 Data ........................................................................................ 6 Permanent Wyoming Mineral Trust Fund Revenue Receipts........................................................................................ 7 Common School Permanent Land Fund FY13-FY17 Data ........................................................................................... 8 Permanent Land Fund Revenue Receipts ...................................................................................................................... 9 Funds Management RVK’s Annual Review ................................................................................................................................................ 13 Pool Allocation ........................................................................................................................................................... 16 Annual Asset Class Performance (Quilt) ..................................................................................................................... 17 Investment Performance by Manager .......................................................................................................................... 18 Manager Fees ............................................................................................................................................................... 20 Investment Income by Pool ......................................................................................................................................... 21 Public Purpose Investments ......................................................................................................................................... 22 Interfund Loans ........................................................................................................................................................... 24 School Foundation Borrowing & Cash Flow .............................................................................................................. 26 Approved Depositories ................................................................................................................................................ 28 Time Deposits-Wyoming Banks (TDOA) ................................................................................................................... 29 WYO-STAR (Local Government Investment Pool) .................................................................................................... 30 Spending Policies & Reserve Accounts Permanent Mineral Trust Fund .................................................................................................................................... 32 Common School Permanent Land Fund ...................................................................................................................... 34 Excellence in Higher Education .................................................................................................................................. 36 Hathaway Scholarship Program .................................................................................................................................. 38 Distributions Distributions to Counties ............................................................................................................................................. 41 Distributions to Cities & Towns .................................................................................................................................. 42 Federal Mineral Royalty Distributions ........................................................................................................................ 44 Capital Facilities Revenue Bonds ................................................................................................................................ 45 Bond Guarantee Programs ........................................................................................................................................... 46 Endowment Challenge Fund Matching Programs ....................................................................................................... 48 Unclaimed Property The State’s Lost & Found Program ............................................................................................................................. 51 Legislative Reports & Statutory Authority Legislative Reports ...................................................................................................................................................... 53 Legislative Authority ................................................................................................................................................... 65 Appendix Balance Sheet .............................................................................................................................................................. 67 Statement of Cash Flows ............................................................................................................................................. 68


WYOMING STATE TREASURER'S OFFICE
State TreasurerMark Gordon
Deputy State TreasurerPat Arp
Finance & Investment Operations
Erica Legerski, Investment Financial Director
Rhonda Harsy, Principal AccountantAlice Portz, Compliance AccountantShuyeh Liu, Principal Investment AccountantJeanne Hartman, Administration AccountantVacant, Investment AccountantJody Janicek, Fiscal SpecialistSue Larson, Accountant
Administrative Services
Mitch Haden, Computer Technology SupervisorPatricia Kramer, Business AnalystDeebs Sullivan, Human Resources
Unclaimed Property
Lachelle Brant, Unclaimed Property Director
Marianne Beaudoin, Compliance AccountantSusan Harris, Securities SpecialistHeather Schoeneberg, Receipts & Claims SpecialistMisty Williams, Mutual Funds Specialist Kristin Bridges, Claims SpecialistMary Cooper, Unclaimed Property SpecialistVacant, Unclaimed Property Specialist
Investments
Patrick Fleming - CIO
Matt Smagacz, Senior Investment ManagerKalib Simpson, Senior Investment Analyst
Betsy Anderson, General Counsel
Kathy Ramsey, Executive Assistant
dsulli
Typewritten Text
dsulli
Typewritten Text
dsulli
Typewritten Text
i


INVESTMENTS


CIO OUTLOOK For fiscal year end June 30, 2017, the results of the State’s Funds show our four permanent funds had returns ranging from 9.4% to 8.4%, while our State Agency Pool, which mainly invests in short duration bonds, had a return of 1.1%. The total assets for the period grew to $20.756 billion compared to $19.581 billion on June 30, 2016. The total of all funds had a return of 6.10 % net of fees vs. our stated benchmark return of 5.16 %, or an outperformance of 94 basis points. This is the fund’s best performance above our benchmark over a one, three, five and 10 year period. Currently, we have approximately 60% of our assets in fixed income securities and the remaining in equity-type securities. With recent legislative changes, we are now able to increase our equity exposure, which has historically lead to higher returns. At present, we are not increasing our equity exposure however, because the stock market is on the high end of its historical valuation. A few examples of this overvaluation are: - The S&P 500 is selling at 22 times trailing-twelve-month earnings, which is in the 98th percentile of valuations since 2006. - The Shiller Cyclically Adjusted Price Earnings Ratio stands at 31.1 and is 85% higher than its historical mean of 16.8. This multiple was exceeded only in 1929 and 2000 after which the stock market experienced a major correction. -Total U.S. stock market capitalization as a percentage of GDP, which Warren Buffet said is, “Probably the best single measure of where valuations at any given moment,” reached a 17 year high October 2017 of 137. This compares to a 1995-2017 median of about 100. Berkshire Hathaway now holds 15% in cash. This is the highest percentage of cash that they have held since 2007. Our view is that the overall US stock market is expensive, and we would look to add to our equity exposure when the market corrects or continue to reduce our exposure accordingly if the market continues to rally. Global assets continue to be distorted by central bank purchases. The three major government central banks (The Federal Reserve, European Central Bank and Bank of Japan) own approximately $13.7 trillion in bonds. To put this in perspective, total outstanding sovereign debt is approximately $44 trillion. This has distorted global interest rates and inflated values in equities and riskier assets. Japanese and most major European government bonds have a negative interest rate for maturities of two years and under. These low interest rates cause many asset managers to “reach” for higher yielding and riskier assets, even if the asset is very expensive when compared to historical standards. In the U.S., many Wall Street firms have recently scaled back their expectations for fiscal stimulus under President Trump and the degree of monetary tightening by the Federal Reserve. However, the Federal Reserve has signaled that they will be maturing and not reinvesting approximately $2 trillion of debt and the ECB has mentioned that they are looking to reduce the size of their bond purchases. We are entering unchartered waters as the world has never seen what happens when the major central banks unwind their very large asset holdings. When we see inflation and/or U.S. GDP growth increasing on a sustainable upward trajectory, we will look to reduce our bond exposure accordingly. Most major asset classes are historically expensive across numerous valuation methods. We are in the process of changing our asset allocation to reduce risk while trying to keep our interest income at a similar level to last year. We will continue to strive to protect the assets of the state while looking to provide the best risk-adjusted returns possible. Sincerely,
Patrick Fleming, Chief Investment Officer
1

Cost Basis Market Value
MV as a Percent of Total MV
Permanent Wyoming Mineral Trust Fund $7,127,236,101 $7,665,940,594 36.9%
Permanent Land Funds 3,792,018,222 4,070,849,681 19.6%
Hathaway Scholarship Endowment Fund 552,564,524 588,863,703 2.8%
Excellence in Higher Education Endowment Fund 114,147,274 121,412,872 0.6%
Workers' Compensation Fund 1,909,367,169 1,984,625,770 9.6%
Tobacco Settlement Fund (FY18 will be moved to Pool A) 84,120,446 84,071,542 0.4%
State Agency Pool 6,244,191,368 6,240,106,375 30.1%
GRAND TOTAL ALL FUNDS $19,823,645,102 $20,755,870,537 100.0%
Funded with federal mineral royalties. Investment income is used to pay for recruitment and retention of faculty, to establish endowed faculty positions and to support the work of endowed faculty at the University of Wyoming and Wyoming's community colleges. Up to 70 percent of the Higher Education Endowment Fund may be invested in equities.
Funded with employer premiums. Investment income is used to assist in the payment of Workers' Compensation costs including administrative and indemnity costs, and vendor payments. Up to 45 percent of the Workers' Compensation Fund may be invested in equities.
Funded with settlement proceeds received by Wyoming under the 1998 Master Settlement Agreement between states and tobacco companies. Income from the fund goes to health improvement programs.
Monies from all other state funds pooled for investment. Income is distributed back to a specific state agency or to the state general fund.
WYOMING STATE INVESTMENT PORTFOLIOAs of June 30, 2017
The State Treasurer's Office manages $20.8 billion in non-pension investable funds across seven fund types. Five funds, the Permanent Wyoming Mineral Trust Fund, the Permanent Land Funds, the Hathaway Scholarship Endowment Fund, the Excellence in Higher Education Endowment Fund and the Workers' Compensation Fund may hold equities under current law. The other funds cannot: the State Agency Pool and the Tobacco Settlement Fund.
Funded with constitutional and intermittent statutory mineral severance tax revenues, and occasional direct legislative appropriations. Income from the PWMTF goes to the state general fund. Up to 70 percent of the PWMTF may be invested in equities.
Funded with royalties, leases, fees and permits, and other revenue generated from state lands. Investment income from these funds go to state public institutions. The Common School Permanent Land Fund is the largest of the land funds: $3.6 billion book/cost, $3.85 billion market; its investment income helps to fund Wyoming's K-12 schools. Up to 70 percent of the Permanent Land Funds may be invested in equities.
Funded with federal mineral royalties. Investment income is used to pay higher education tuition for qualifying Wyoming high school graduates at the University of Wyoming and Wyoming's community colleges. Up to 70 percent of the Hathaway Scholarship Fund may be invested in equities.
2

$-
$2.00
$4.00
$6.00
$8.00
$10.00
$12.00
$14.00
$16.00
$18.00
$20.00
$22.00
08 09 10 11 12 13 14 15 16 17
Mar
ket V
alue
(bill
ions
)
Fiscal Year End
TOTAL STATE PORTFOLIO VALUE
Perm Mineral TrustCommon SchoolPerm LandUniversityHathawayHigher EdWorkers CompTobaccoState Agency
$-
$200.00
$400.00
$600.00
$800.00
$1,000.00
$1,200.00
08 09 10 11 12 13 14 15 16 17
Ear
ning
s D
istr
ibut
ed (
mill
ions
)
Fiscal Year End
INVESTMENT EARNINGS
Gains DistributedInterestDividends
3

4

CASH & RECEIVABLES(STATE AGENCY POOL INVESTMENTS ACCOUNT BALANCE
INVESTMENTS) (at Cost) (Corpus)
Common School Permanent Land Fund $389,569,749.25 $3,201,554,994.00 $3,591,124,743.25Common School II $5,000,000.00 $0.00 $5,000,000.00University Permanent Land Fund $1,725,125.22 $18,150,775.87 $19,875,901.09Miner's Hospital Permanent Land Fund $5,630,511.18 $57,696,982.80 $63,327,493.98Public Buildings At Capitol Permanent Land Fund $1,071,850.77 $10,983,470.85 $12,055,321.62Fish Hatchery Permanent Land Fund $489,349.41 $5,014,462.04 $5,503,811.45D.D. & B. Asylum Permanent Land Fund $380,461.12 $3,898,661.79 $4,279,122.91Carey Act Permanent Land Fund $206,488.95 $2,115,933.92 $2,322,422.87Omnibus Permanent Land Fund $4,858,777.46 $49,788,871.88 $54,647,649.34State Hospital Permanent Land Fund $247,560.87 $2,536,806.08 $2,784,366.95State Training School Permanent Land Fund $398,741.56 $4,085,985.11 $4,484,726.67Penitentiary Permanent Land Fund $1,369,395.79 $14,032,474.60 $15,401,870.39Agricultural College Permanent Land Fund $996,762.71 $10,214,028.35 $11,210,791.06
Subtotal-Permanent Land Fund $411,944,774.28 $3,380,073,447.30 $3,792,018,221.58
Hathaway Scholarship Endowment 59,971,606 492,592,918 552,564,524Higher Education Endowment 11,065,255 103,082,018 114,147,274Permanent Wyoming Mineral Trust Fund 725,786,112 6,401,449,989 7,127,236,101
Subtotal-All Permanent Funds $1,208,767,748 $10,377,198,372 $11,585,966,120
Workers' Compensation 285,093,089 1,624,274,080 1,909,367,169
Total Permanent Funds & Workers' Compensation $1,493,860,837 $12,001,472,452 $13,495,333,289
Tobacco Settlement Fund 5,300,890 78,819,556 84,120,446State Agency Pool (1,499,161,726) 7,743,353,094 6,244,191,368
TOTAL $0 $19,823,645,102 $19,823,645,102
NOTES:
FUND/ACCOUNT NAME
INVESTMENT ACCOUNT BALANCESAs of June 30, 2017
The Cash & Receivables column represents the portion of the State Agency Pool investment attributable to each of the permanent funds, the Hathaway Scholarship Endowment Fund, the Higher Education Endowment Fund and the Workers' Compensation Fund and is included in each specific fund, thus it is removed from the State Agency Pool cash and receivables balance. The State Agency Investment Pool includes the total of the cash and receivable column plus the cash balance of all the other funds for which specific investments have not been made.
5

FY 13 FY 14 FY 15 FY 16 FY 17
Beginning Book Value $5,440.9 $5,888.5 $6,368.3 $6,848.9 $7,066.4Beginning Market Value 5,595.5 6,112.8 6,979.1 7,172.2 7,319.4 - Difference 154.5 224.2 610.8 323.3 253.0 - Percent 2.8% 3.8% 9.6% 4.7% 3.6%
Additions to Corpus - Constitutional Severance Tax 1.5% Deposit $207.3 $211.7 $207.9 $136.2 $32.3 - Additional Severance Tax 138.2 141.1 138.6 90.8 21.6 - Additional Legislative Deposits/Diversions 0.0 0.0 0.0 0.0 0.0 - Spending Policy Reversions 102.1 127.1 134.2 0.0 0.0 - Spending Policy for Prior Year Adjustment 0.0 0.0 0.0 0.0 0.0 - Income Distribution Adjustment ($32K) (0.0) 0.0Reduction of Corpus - Deferred Realized Capital Gain (Loss) 0.0 0.0 0.0 (9.4) 6.9
Total Increase to Corpus $447.6 $479.8 $480.6 $217.5 $60.8
Ending Book Value $5,888.5 $6,368.3 $6,848.9 $7,066.4 $7,127.2Ending Market Value 6,112.8 6,979.1 7,172.2 7,319.4 7,665.9 - Difference 224.2 610.8 323.3 253.0 538.7 - Percent 3.8% 9.6% 4.7% 3.6% 7.6%
Total Distributed Income (Gross of Fees) $373.1 $403.3 $504.6 $151.5 $313.9 - Interest 79.0 61.8 61.1 67.1 98.8 - Dividend 61.3 75.4 94.2 93.8 75.0 - Realized Net Capital Gain 232.8 266.1 349.3 (9.4) 140.1 Change in Book Value $447.6 $479.7 $480.6 $217.5 $60.8Change in Market Value 517.3 866.3 193.1 147.2 346.6
Cash Yield 6.57% 6.56% 7.62% 2.31% 4.37%Total Return 8.19% 12.67% 2.91% 1.07% 8.69%
NOTES:
PERMANENT WYOMING MINERAL TRUST FUNDFiscal Years 13 Through 17 Analyzed and Compared
($ Millions)
The State Treasurer adopted an interpretative policy for accounting purposes whereby earnings consisting of interest and dividends would be treated as ordinary income and disbursed accordingly. Capital gains and losses are reconciled for each fund at the end of the fiscal year. If capital gains and losses are net positive, the Treasurer distributes the net capital gain as income. If capital losses exceed capital gains at year end, the losses are carried forward through the next fiscal year.
"Total Income" is spendable investment income including dividends, interest and realized capital gains. "Total Return" is comprised of dividends, interest and realized and unrealized capital gains. The State Treasurer's Office calculates the "Cash Yield" return above based on average book value. R.V. Kuhns calculates total return based on the time-weighted rate of return - essentially compounded growth.
6

JUNE 30, 2016 JUNE 30, 2017CORPUS BALANCE REVENUE CORPUS BALANCE
Beginning Balance $7,066,416,652
Severance Tax Coal 14,033,534 Stripper Oil 5,085,798 Other Valuable Products (3,132,522) Oil 9,929,642 Natural Gas 23,404,910 Condensate-Gas 4,584,840Gain (Loss) Income Deferred-Prior year 9,428,213State Agency Pool & Tobacco Settlement Not Distributed (2,547,398)Income Distribution Adjustment-Prior Year 32,432
$60,819,448.30 $7,127,236,101
Revenue Receipts as of June 30, 2017
TOTAL REVENUE
PERMANENT WYOMING MINERAL TRUST FUND: CORPUS
7

FY 13 FY 14 FY 15 FY 16 FY 17
Beginning Book Value $2,318.0 $2,533.4 $2,782.3 $3,261.7 $3,401.1Beginning Market Value 2,371.3 2,630.6 3,046.5 3,405.3 3,520.3 - Difference 53.3 97.2 264.2 143.6 119.2 - Percent 2.3% 3.8% 9.5% 4.4% 3.5%
Additions to Corpus - Sales, Royalties, etc. $176.8 $190.5 $414.4 $142.7 $191.7 - Additional Legislative Deposits 0.0 0.0 0.0 0.0 0.0 - Spending Policy Reversions 38.7 58.4 64.9 0.0 0.0 - Income Accrued 0.0 0.0 0.0 0.0 0.0
Reduction of Corpus - Deferred Realized Capital Gain (Loss) 0.0 0.0 0.0 (3.3) 3.3 - Reverse Income Accrued 0.0 0.0 0.0 0.0 0.0
Total Increase to Corpus $215.4 $248.9 $479.4 $139.5 $195.0
Ending Book Value $2,533.4 $2,782.3 $3,261.7 $3,401.1 $3,596.1Ending Market Value 2,630.6 3,046.5 3,405.3 3,520.3 3,859.8 - Difference 97.2 264.2 143.6 119.2 263.7 - Percent 3.8% 9.5% 4.4% 3.5% 7.3%
Total Distributed Income (Gross of Fees) $145.6 $175.9 $220.4 $78.4 $162.1 - Interest 34.7 26.9 32.6 39.0 58.0 - Dividend 26.4 32.7 41.1 42.7 35.6 - Realized Net Capital Gain 84.5 116.4 146.7 (3.3) 68.4
Change in Book Value $215.4 $248.9 $479.4 $139.5 $195.0Change in Market Value 259.3 415.9 358.8 115.0 339.5
Cash Yield 5.96% 6.57% 7.14% 2.45% 4.59%Total Return 8.47% 12.52% 2.95% 1.40% 8.87%
NOTES:
In May 2009, the State Treasurer adopted an interpretative policy effective July 1, 2008, for accounting purposes whereby earnings consisting of interest and dividends would be treated as ordinary income and disbursed accordingly. Capital gains and losses are reconciled for each fund at the end of the fiscal year. If capital gains and losses are net positive, the Treasurer distributes the net capital gain as income. If capital losses exceed capital gains at year end, the losses are carried forward through the next fiscal year. "Income Accrued" represents income held in Common School Pool on June 30.
Includes Common School Permanent Land Fund II.
COMMON SCHOOL PERMANENT LAND FUNDFiscal Years 13 Through 17 Analyzed and Compared
"Total Income" is spendable investment income including dividends, interest and realized capital gains. "Total Return" is comprised of dividends, interest and realized and unrealized capital gains. The State Treasurer's Office calculates the "Cash Yield" return above based on average book value. R.V. Kuhns calculates total return based on the time-weighted rate of return - essentially compounded growth.
($ Millions)
8

JUNE 30, 2016 JUNE 30, 2017FUND/ACCOUNT NAME CORPUS BALANCE REVENUE CORPUS BALANCE
L01 MINER'S HOSPITAL Beginning Balance $60,227,569
$103,756Oil & Gas Lease Royalties 104,764Sodium & Trona Lease Royalties 2,480,495Right-of-Way Easements 115Inflation Proofing Income Diversion W.S. 9-4-305(b) 325,229Gain (Loss) Income Deferred 85,566
3,099,925 63,327,494
L02 PUBLIC BUILDINGS AT CAPITOL Beginning Balance 11,332,787Oil & Gas Lease Royalties 623,766Sand & Gravel Royalties 2,665Right-of-Way Easements 15,282Surface Damage 4,369Inflation Proofing Income Diversion W.S. 9-4-305(b) 61,197Gain (Loss) Income Deferred 15,255
722,534 12,055,322
L03 FISH HATCHERYBeginning Balance 5,466,461Inflation Proofing Income Diversion W.S. 9-4-305(b) 29,519Gain (Loss) Income Deferred 7,832
37,351 5,503,811
L04 COMMON SCHOOL (1)(2)Beginning Balance 3,396,119,823Bentonite Lease Royalties 540,877Coal Lease Royalties 59,060,010Miscellaneous Mineral Lease Royalties 55,781Oil & Gas Lease Royalties 70,305,727Sand & Gravel Royalties 206,411Sodium & Trona Lease Royalties 13,099,845Right-of-Way Easements 620,036Uranium Lease Royalties 275,366Surface Damage 1,542,135Real Estate Sales 46,019,661Gain (Loss) Income Deferred 3,279,069
195,004,920 3,591,124,743
PERMANENT LAND FUNDSRevenue Receipts as of June 30, 2017
Bentonite Lease Royalties
9

JUNE 30, 2016 JUNE 30, 2017FUND/ACCOUNT NAME CORPUS BALANCE REVENUE CORPUS BALANCE
L14 COMMON SCHOOL II (1)(2)Beginning Balance 4,995,321Gain (Loss) Income Deferred 4,679
4,679 5,000,000
L05 DEAF, DUMB & BLINDBeginning Balance 4,241,490Oil & Gas Lease Royalties 2,202Right-of-Way Easements 328Surface Damage 6,000Inflation Proofing Income Diversion W.S. 9-4-305(b) 22,904Real Estate- Sales 122Gain (Loss) Income Deferred 6,077
37,633 4,279,123
L06 CAREY ACTBeginning Balance 2,279,061Oil & Gas Lease Royalties 22,478Right-of-Way Easements 8,058Inflation Proofing Income Diversion W.S. 9-4-305(b) 12,307Gain (Loss) Income Deferred 518
43,361 2,322,423
L07 OMNIBUSBeginning Balance 53,198,840Oil & Gas Lease Royalties 1,023,345Sand & Gravel Royalties 60,267Right-of-Way Easements 1,405Surface Damage 56Inflation Proofing Income Diversion W.S. 9-4-305(b) 287,274Real Estate- Sales 918Gain (Loss) Income Deferred 75,545
1,448,809 54,647,649
L08 WYOMING STATE HOSPITALBeginning Balance 3,013,637Oil & Gas Lease Royalties 87,060Inflation Proofing Income Diversion W.S. 9-4-305(b) 16,274Per Session Laws 2016, Ch 31, Sec 048 (337,065)Gain (Loss) Income Deferred 4,461
(229,270) 2,784,367
10

JUNE 30, 2016 JUNE 30, 2017FUND/ACCOUNT NAME CORPUS BALANCE REVENUE CORPUS BALANCE
L09 WYOMING LIFE RESOURCE CENTERBeginning Balance 4,369,692Oil & Gas Lease Royalties 179,348Inflation Proofing Income Diversion W.S. 9-4-305(b) 23,596Per Session Laws 2016, Ch 31, Sec 048 (94,318)Gain (Loss) Income Deferred 6,408
115,035 4,484,727
L10 WYOMING STATE PENITENTIARYBeginning Balance 22,194,665Oil & Gas Lease Royalties 741,385Right-of-Way Easements 14,977Surface Damage 71,708Inflation Proofing Income Diversion W.S. 9-4-305(b) 119,851Per Session Laws 2016, Ch 97, Sec 3 (7,750,000)Per W.S. 28-5-101 (24,173)Gain (Loss) Income Deferred 33,457
(6,792,794) 15,401,870
L11 WYOMING STATE AGRICULTURAL COLLEGE (1)Beginning Balance 11,046,661Oil & Gas Lease Royalties 42,574Right-of-Way Easements 44,217
1,345Inflation Proofing Income Diversion W.S. 9-4-305(b) 59,652Real Estate- Sales 244Gain (Loss) Income Deferred 16,098
164,130 11,210,791
L12 WYOMING STATE UNIVERSITY (1)Beginning Balance 19,682,355Oil & Gas Lease Royalties 64,682Right-of-Way Easements 9,426Surface Damage 2,227Inflation Proofing Income Diversion W.S. 9-4-305(b) 106,285Gain (Loss) Income Deferred 10,926
193,546 19,875,901
TOTAL REVENUE $193,849,860 $3,792,018,222
NOTES:
Revenue from above "sales" is the principal payment from the sale of state lands and from right-of-ways granted on state lands. "Royalties" are derived from oiland mineral leases on state lands.
Uranium Lease Royalties
1. These funds are not available for appropriation.
2. In Fiscal Year 2009 Common School Permanent Land Fund II was added to the Common School Pool along with Common School Permanent Land Fund andis being invested there. Income is diverted to the Education Trust Fund per Special Session Laws 1997 Chapter 3 Section 504.
11


FUND MANAGEMENT


RVK’S ANNUAL REVIEW In a year marked by strong performance for risk assets, all of the State’s investment pools earned positive absolute returns ranging from 1.1% to 9.4%. All nine investment pools outperformed their respective benchmarks during the year by at least 0.7%. Relative returns were bolstered by the State’s Fixed Income portfolio, which significantly outperformed the Bloomberg US Agg Bond Index amidst a negative return environment for the broad US bond market. The Federal Reserve raised target interest rates three times during the fiscal year, supported by strengthening economic data in the US. Public equities and alternatives contributed to strong absolute results for the permanent funds with strategic allocations to these asset classes. Despite persistent political divisiveness in the US, heightened geopolitical risks (most notably in North Korea), and a range of other international issues, most risk assets produced strong gains over the fiscal year. Although positive economic fundamentals have thus far supported the “risk-on” environment, it is possible that these risks along with unanticipated global central bank policy could have a larger influence on markets going forward.
The Permanent Mineral Trust and Common School Permanent Land Fund ended the fiscal year with returns of 8.7% and 8.9%, respectively. The Permanent Land Fund and University Permanent Land Fund ended the fiscal year with returns of 8.4% and 9.4%, respectively. All of these four Permanent Funds outperformed their respective custom benchmarks by at least 0.8%. Hathaway Scholarship Endowment and Higher Education Endowment each returned 7.4%, both outperforming their custom benchmarks by 0.7%. The Workers Compensation Fund returned 5.1%, outperforming its custom benchmark by 0.8%.
Absolute performance for the Non-Permanent Funds (Tobacco Settlement and State Agency Pool) was lower than that of the Permanent Funds, while the Non-Permanent Funds outperformed their custom benchmarks to a greater degree due to strong relative performance of the fixed income portfolio. The Tobacco Settlement Trust returned 1.4% versus 0.2% for its custom benchmark, and the State Agency Pool returned 1.1% versus 0.2% for its custom benchmark.
Over the last year, fixed income markets experienced heightened volatility as interest rate hikes (actual and anticipated) affected bond market returns.
The Total Fixed Income Portfolio (including Convertibles) produced a positive fiscal year return of 1.7% compared to the Bloomberg US Aggregate Bond Index return of -0.3%. Diversification away from core US bonds into convertibles, bank loans, high yield, and emerging markets debt contributed to outperformance, as duration sensitive strategies were negatively impacted by rising interest rates during the period. The Internally managed fixed income portfolio also contributed meaningfully to outperformance during the year, outperforming its benchmark by 1.9%.
Non-US fixed income exposures contributed positively to relative and absolute returns within the fixed income portfolio. Opportunistic European credit earned 11.1% over the trailing one-year period and local currency emerging market debt returned 6.7%.
13

Consistent with global markets, the State’s equity and alternative investment managers produced strong absolute results during the fiscal year. Relative results were mixed as evidenced by the fiscal year returns below:
The US equity portfolio returned 17.5% compared to 18.5% for the Russell 3000 Index. The international equity portfolio returned 20.9% compared to 20.5% for the MSCI ACW
Ex US Index. The fixed income portfolio returned 1.7%, compared to -0.3% for the Bloomberg US
Aggregate Bond Index. The core real estate portfolio returned 7.1%, compared to 7.9% for the NCREIF ODCE
Index. The absolute return portfolio returned 5.6%, compared to 6.5% for the HFRI FOF Comp
Index.
14

15

POOL ALLOCATION The June 30, 2017 allocation mix of the portfolio is shown below; charts later in this report provide a detailed allocation for each pool. Equities Fixed PPIs* Cash
Permanent Wyoming Mineral Trust Fund 47.7% 41.1% 1.7% 9.5% Common School Permanent Land Fund 45.1 34.5 10.2 10.2 Remaining Permanent Land Funds 47.5 44.2 0.0 8.3 University Permanent Land Fund 52.8 39.3 0.0 7.9 Hathaway Scholarship Endowment Fund 42.1 47.7 0.0 10.2 Higher Education Endowment Fund 42.2 48.7 0.0 9.1 Workers’ Compensation Fund 26.0 59.6 0.0 14.4 Tobacco Settlement Fund 0.0 93.7 0.0 6.3 State Agency Pool 0.0 76.4 3.7 19.9 TOTAL 30.4% 58.3% 3.9% 7.4%
* Public Purpose Investments Below is the breakdown of how our pools are managed.
Internal External
Passive 0.8%
International Equity
14.6%
Domestic Equity International Equity
TIPs
Active 12.4%
Fixed Income
72.2% Domestic Equity
Global Equity International Equity
Private Equity Absolute Return
Real Estate Convertible Bonds Core Fixed Income
Credit Fixed Income Opportunistic Fixed Income
Emerging Market Debt
16

17

Total Current Interest/ Realized Gains/ FYTD 3 Year 5 YearInvestment Value Market Value Dividends Losses Return Return Return
Wyoming State Total Fund $19,823,645,102 $20,755,870,537 $475,988,687 $222,108,278 6.10% 3.53% 5.06%Wyoming State Actual Allocation Index 5.16% 3.50% 4.79%
US EquityState Street All Cap $1,188,502,548 $1,468,388,420 $33,511,388 $70,169,543 17.28% N/A N/A
State Street All Cap Custom Index 17.41% 9.03% 14.60%Russell 3000 18.51% 9.10% 14.58%
Epoch $219,989,195 $263,860,478 $4,967,465 $10,447,787 22.82% N/A N/ALazard $274,251,382 $319,270,163 $4,323,891 $28,637,742 12.98% N/A N/A
Russell 3000 18.51% 9.10% 14.58%
UW Portfolio Management Program $1,000,000 $1,410,522 $25,334 $0 17.51% 9.18% 12.01%S&P 500 17.90% 9.61% 14.63%
RBC $167,071,858 $201,620,672 $2,843,452 $17,945,280 20.82% N/A N/ARussell 2000 24.60% 7.36% 13.70%
Total US Equity $1,850,814,984 $2,254,550,255 $45,671,531 $127,200,351
Global EquityArrowstreet $379,181,793 $426,401,778 $10,384,280 $44,991,468 21.47% N/A N/A
MSCI ACW 18.78% 4.82% 10.54%
Total Global Equity $379,181,793 $426,401,778 $10,384,280 $44,991,468
International EquityInternal International Equity Portfolio $135,000,000 $160,143,255 $4,229,459 $0 20.18% N/A N/A
FTSE All World Ex US 20.31% 1.15% N/A
Northern Trust $757,938,260 $839,582,600 $21,332,941 ($8,402,764) 20.09% 0.83% 7.28%MSCI ACW Ex US 20.45% 0.80% 7.22%
Fisher Investments $360,151,032 $427,481,219 $8,675,338 $8,277,554 25.62% 3.75% 9.14%MSCI ACW Ex US [4] 20.45% 0.80% 7.22%
Manning & Napier $221,901,479 $245,415,336 $3,841,844 ($1,023,237) N/A N/A N/A
Total International Equity $1,474,990,771 $1,672,622,409 $38,079,582 ($1,148,447)
Private EquityAccess Venture Partners II $7,423,423 $14,559,968 $0 $0Cheyenne Capital Fund, L.P. $188,935,234 $294,496,615 $1,478,940 $61,149,522Hamilton Lane Nowood Fund, L.P. $105,765,193 $119,855,970 $2,201,272 $3,841,454Neuberger Berman Sauger Fund, L.P. $115,600,000 $156,244,016 $99 $0
S&P 500 + 5% 23.79% 15.09% 20.36%
Total Private Equity $417,723,851 $585,156,569 $3,680,311 $64,990,976
Real EstateClarion Lion $266,303,630 $324,319,700 $10,408,772 $0 8.33% 12.62% 12.11%UBS Trumbull $241,303,630 $272,122,890 $8,567,298 $0 5.63% 9.60% 9.81%
NCREIF ODCE 7.87% 11.34% 11.79%
Core Real Estate $507,607,260 $596,442,590 $18,976,069 $0
Barings (formerly Cornerstone) $7,051,845 $7,305,816 $731,181 ($52,184)Heitman $1,764,838 $75,996 $85,124 $1,561,219M&G $81,386,488 $64,640,734 $6,357,681 $0Northwood $107,975,443 $125,693,992 ($1,271,086) $19,043,091SC Capital $14,815,679 $15,520,739 ($64,739) $0TA Realty $9,236,508 $7,257,306 $54,253 $0WestRiver $35,630,057 $48,317,599 $1,938,337 $0
NCREIF Property 6.97% 10.17% 10.49%
Value-Added Real Estate $257,860,857 $268,812,182 $7,830,750 $20,552,126
Total Real Estate $765,468,117 $865,254,772 $26,806,820 $20,552,126
See Notes next page
See Notes next page
See Notes next page
See Notes next page
See Notes next page
See Notes next page
INVESTMENT PERFORMANCE - TOTAL PERFORMANCEAs of June 30, 2017
See Notes next pageSee Notes next page
See Notes next pageSee Notes next page
18

Total Current Interest/ Realized Gains/ FYTD 3 Year 5 YearInvestment Value Market Value Dividends Losses Return Return Return
Absolute ReturnPAAMCO - Jackalope Fund $499,635,960 $507,134,714 $191 $7,476,383 5.63% -0.35% 4.46%
HFN FOF Multi-Strat 6.48% 1.55% 3.87%Grosvenor Global Recovery Fund $0 $0 $22,843 $0
Total Absolute Return $499,635,960 $507,134,714 $23,034 $7,476,383
Convertible BondsAllianz Global Investors $486,668,624 $517,843,821 $15,473,506 $99,861 15.29% 3.68% 10.17%
BofA ML All Quality Convertible 16.80% 4.83% 11.20%
Fixed IncomeWAMCO Core Plus $0 $0 $0 $0 N/A N/A N/A
C.S. McKee $1,260,222,361 $1,265,292,081 $25,074,078 $5,296,102 -0.01% 2.67% N/AJP Morgan Core $2,135,451,811 $2,158,626,120 $56,910,529 ($9,104,339) -0.34% 2.83% N/AMacKay Shields $0 $0 $10,037,536 ($671,421) N/A N/A N/ANeuberger Berman Core $0 $0 $25,814,073 ($14,496,780) N/A N/A N/APIMCO Core $2,182,226,781 $2,220,137,910 $61,779,391 ($3,824,815) 0.32% 2.76% N/AWells Capital $0 $0 $22,067,821 ($14,331,025) N/A N/A N/A
Barclays US Aggregate -0.31% 2.48% 2.21%
Neuberger Berman Credit $934,275,615 $939,349,147 $26,184,634 ($1,983,439) 5.79% 3.34% N/ASeix $943,160,037 $965,016,793 $29,613,333 $0 7.42% 3.98% N/A
Credit Custom Index 7.33% 3.62% 4.88%
Grosvenor Silvery Lupine Fund $273,296,102 $323,784,574 $3,896,354 $0 11.18% 6.06% N/ACS Western European HY 12.21% 5.70% 8.83%
Investec $297,714,010 $213,007,182 $10,673,387 $0 7.04% -2.99% N/AStone Harbor $297,712,381 $204,548,478 $9,874,767 $0 6.31% -3.36% N/A
JPM GBI-EM Glbl Dvf'd 6.41% -2.80% -0.67%
State Street TIPS $727,479,516 $713,634,440 $6,017,768 ($1,080,295) -0.84% 0.75% N/ABarclays US Trsy: US TIPS (Series B) -0.67% 0.71% 0.29%
Internal Fixed Income Portfolio $2,547,984,119 $2,573,039,000 $9,528,763 $620,861 0.62% 1.95% 1.58%Barclays US Gov't: Int. Term Bond Index [6] -1.25% 1.47% 1.07%
Total Fixed Income $11,599,522,733 $11,576,435,726 $297,472,433 ($39,575,150)
Public Purpose Investments $811,819,612 $811,819,612 $21,550,688 $0 N/A N/A N/A
Cash & Cash EquivalentsJP Morgan Cash Composite $1,537,818,657 $1,538,608,117 $9,170,759 ($2,479,380) 0.53% 0.45% 0.37%
JP Morgan Cash Custom Index 0.37% 0.33% 0.27%
Other IncomeJPM Securities Lending $0 $0 $7,645,285 $0Gabelli $0 $0 $28,615 $0 N/A N/A N/AThe Boston Company $0 $42,764 $1,843 $91 N/A N/A N/A
- Returns are stated in traditional total return terms and do not specify realized income.- State Street All Cap Custom Index consists of 69% R 3000, 24% FTSE RAFI US 1000, 7% MSCI USA Minimum Volatility.- Market value shown for The Boston Company represents residual assets and subsequent transactions from the liquidation process.- Fisher Index consists of MSCI EAFE (Gross) through July 2010 and the MSCI ACW Ex US (Net) thereafter.- Market values for non-core real estate and private equity are as of the most recent valuation, adjusted for subsequent cash flows. Investment (Cost) Values are not lagged.- Performance for Private Equity and Value-Added Real Estate investments is calculated on an IRR basis. For further analysis, please refer to the supplementary alternatives report.- Market values for M&G are converted from British Pounds using the noon New York City Federal exchange rate. Cost values are converted using the 5 p.m. London WM Benchmark rate.-- Returns are stated in traditional total return terms and do not specify realized income.- Market value shown for WAMCO Core Plus represents residual assets and subsequent transactions from the liquidation process.- The Credit Custom Index consists of 20% Barclays US Credit, 20% BofA ML US HY Master II Constrained, 60% S&P/LSTA Leveraged Loan.- Internal Fixed Income Portfolio performance excludes distressed securities taken in from dismissed managers (market value includes distressed securities).- Internal Fixed Income Portfolio Index consists of the Barclays US Gov't: Int. Term Bond Index; prior to December 2009 the index consisted of the Barclays US Gov't/Credit Bond Index.- Market values shown for Public Purpose Investments reflect cost value of the investments. -
INVESTMENT PERFORMANCE - TOTAL PERFORMANCEAs of June 30, 2017
NOTES:
Performance shown is gross of fees with the exception of absolute return and convertible bonds, which are shown net of fees.
At the end of FY 17 deferred losses were held over in the Tobacco Settlement Pool as well as the State Agency Pool (SAP). Since all funds participate in the SAP, all funds participate in the losses. Realized gains and losses will differ depending on if they are reported at the manager level or fund level until the SAP is made whole.
19

Total Fees Mgmt Fee Incentive Fee Total Fees Mgmt Fee Incentive Fee
Wyoming State Total Fund $90,652,655 $64,489,516 $26,163,139 $14,764,105 -$2,192,342 $16,956,447% of Beginning WSTO FY Value 0.46% 0.33% 0.13% 0.08% -0.01% 0.09%Percentage of Total Fee 100% 71% 29% 0% -17% 17%
US Equity $4,769,275 $4,769,275 $0 -$404,686 -$404,686 $0State Street All Cap $553,344 $553,344 $0 $230,512 $230,512 $0Epoch $1,277,737 $1,277,737 $0 -$180,652 -$180,652 $0Lazard $1,690,992 $1,690,992 $0 $66,280 $66,280 $0RBC $1,247,203 $1,247,203 $0 -$520,826 -$520,826 $0
Global Equity $2,028,598 $2,028,598 $0 -$4,749 -$4,749 $0Arrowstreet $2,028,598 $2,028,598 $0 -$4,749 -$4,749 $0
International Equity $3,447,608 $3,447,608 $0 -$523,453 -$523,453 $0Internal International Equity Portfolio $108,886 $108,886 $0 $57,890 $57,890 $0Northern Trust $257,364 $257,364 $0 -$10,283 -$10,283 $0Manning & Napier $1,254,063 $1,254,063 $0 -$21,205 -$21,205 $0Fisher Investments $1,827,295 $1,827,295 $0 -$188,321 -$188,321 $0The Boston Company $0 $0 $0 -$361,534 -$361,534 $0
Private Equity $24,668,314 $11,755,391 $12,912,922 $11,415,597 $1,151,960 $10,263,637Access Venture Partners II $56,900 $110,876 -$53,977 -$210,777 -$77,360 -$133,417Cheyenne Capital Fund $17,140,141 $6,133,524 $11,006,617 $8,686,754 -$250,252 $8,937,006Hamilton Lane Nowood Fund $3,744,130 $2,730,991 $1,013,139 $1,615,593 $569,572 $1,046,021Neuberger Berman Sauger Fund $3,727,143 $2,780,000 $947,143 $1,324,027 $910,000 $414,027
Real Estate $13,055,360 $8,516,071 $4,539,289 $1,309,436 $501,026 $808,410Clarion Lion Properties Fund $2,183,095 $2,183,095 $0 -$3,975 -$3,975 $0UBS Trumbull Property Fund $2,429,731 $1,940,918 $488,813 $367,248 $399,580 -$32,332Cornerstone Core Mortgage Fund I $44,228 $44,228 $0 -$24,766 -$24,766 $0Heitman Value Partners II $20,037 $20,037 $0 -$2,313 -$2,313 $0M&G Real Estate Debt Fund II $947,311 $726,821 $220,490 $227,326 $95,034 $132,292Northwood Real Estate Partners IV $6,863,972 $3,033,987 $3,829,985 $901,012 $192,563 $708,449SC Capital Core Fund $50,409 $50,409 $0 $50,409 $50,409 $0TA Realty VIII $81,078 $81,078 $0 -$33,301 -$33,301 $0WestRiver Real Estate Finance Fund $435,498 $435,498 $0 -$172,205 -$172,205 $0
Absolute Return $12,352,484 $9,705,137 $2,647,347 $2,129,842 $1,224,793 $905,049PAAMCO $12,352,484 $9,705,137 $2,647,347 $2,129,842 $1,224,793 $905,049
Convertible Bonds $2,607,961 $2,607,961 $0 -$215,856 -$215,856 $0Allianz Global Investors $2,607,961 $2,607,961 $0 -$215,856 -$215,856 $0
Fixed Income $27,107,328 $21,043,747 $6,063,581 $1,458,732 -$3,520,618 $4,979,351C.S. McKee $1,604,834 $1,604,834 $0 $535,836 $535,836 $0JP Morgan Core $2,240,437 $2,240,437 $0 -$60,458 -$60,458 $0MacKay Shields $68,905 $68,905 $0 -$2,243,376 -$2,243,376 $0Neuberger Berman Core $811,351 $811,351 $0 -$883,740 -$883,740 $0PIMCO Core $2,378,403 $2,378,403 $0 -$1,741,783 -$1,741,783 $0Wells Capital $1,145,350 $1,145,350 $0 -$110,944 -$110,944 $0Neuberger Berman Credit $1,872,888 $1,872,888 $0 $279,168 $279,168 $0Seix $2,709,585 $2,709,585 $0 $577,279 $577,279 $0Grosvenor Silvery Lupine $11,670,368 $5,606,787 $6,063,581 $5,352,808 $373,457 $4,979,351Investec $1,258,469 $1,258,469 $0 $13,792 $13,792 $0Stone Harbor $1,182,744 $1,182,744 $0 -$262,668 -$262,668 $0State Street TIPS $163,994 $163,994 $0 $2,819 $2,819 $0Internal Fixed Income Portfolio $0 $0 $0 $0 $0 $0
Cash & Cash Equivalents $615,728 $615,728 $0 -$400,758 -$400,758 $0JP Morgan Cash Composite $615,728 $615,728 $0 -$400,758 -$400,758 $0
NOTES:
Fund of fund management fees shown include management fees for the fund of fund and underlying fund levels.
As of June 30, 2017TOTAL FUND - DIRECT (MGMT) & INDIRECT (INCENTIVE) INVESTMENT FEES
Difference vs. FY 2016FY 2017
Management fees are fees charged for the costs of running the investment. These include both fees paid via explicit invoice and fees paid directly out of the investment itself.
Incentive fees are fees that are dependent on the manager's performance over a given period. These fees are typically paid from a portion of investment profits.
PAAMCO incentive fee shown for FY 17 consists of CY 2016. Data as of 6/30/17 is unavailable at this time.State Street All Cap FY17 fees are estimated based on the investment manager's fee schedule.Fees are based on actual quarterly fees paid and were provided by Investment Managers and records of the State Treasurer's Office.
20

TotalInvestment Value
CurrentMarket Value
GrossDividends
GrossInterest
Funds Diverted for Fees &
Other ExpensesDistributed
Capital GainsNet Income Distributed
Realized Losses Held Over
Fiscal Year To Date Return 3 Year 5 Year
Permanent Wyoming Mineral Trust Fund $7,127,236,101 $7,665,940,594 $75,041,044 $98,780,518 ($15,137,905) $140,106,356 $298,790,012 ($2,547,398) 8.69% 4.17% 6.62%
Common School Permanent Land Fund $3,596,124,743 $3,859,838,175 $35,638,723 $58,004,649 ($6,893,725) $68,409,791 $155,159,439 $0 8.87% 4.36% 6.76% - Common School 3,591,124,743 3,854,471,512 35,587,841 57,921,834 (6,883,864) 68,311,831 154,937,642 0 N/A N/A N/A - Common School II 5,000,000 5,366,663 50,882 82,815 (9,861) 97,960 221,796 0 N/A N/A N/A
University Permanent Land Fund $19,875,901 $21,764,049 210,198 271,989 (43,090) $391,914 $831,011 (5,107) 9.38% 4.44% 6.74%
Remaining Permanent Land Funds: $176,017,577 $189,247,457 $1,843,530 $2,486,058 ($354,687) $3,799,286 $7,774,186 $0 8.38% 4.14% 6.47% - Miner's Hospital Permanent Land Fund 63,327,494 68,087,332 641,285 864,793 (123,330) 1,318,695 2,701,444 0 N/A N/A N/A - Public Buildings @ Cap Permanent Land Fund 12,055,322 12,961,427 120,632 162,676 (23,194) 248,971 509,086 0 N/A N/A N/A - Fish Hatchery Permanent Land Fund 5,503,811 5,917,490 56,705 76,469 (10,911) 116,919 239,182 0 N/A N/A N/A - D.D. & B. Permanent Land Fund 4,279,123 4,600,751 44,046 59,398 (8,475) 90,803 185,772 0 N/A N/A N/A - Carey Act Permanent Land Fund 2,322,423 2,496,981 23,754 32,033 (4,570) 48,941 100,158 0 N/A N/A N/A - Omnibus Permanent Land Fund 54,647,649 58,755,091 556,925 751,030 (107,132) 1,147,836 2,348,659 0 N/A N/A N/A - State Hospital Permanent Land Fund 2,784,367 2,993,646 29,746 40,114 (5,727) 61,526 125,659 0 N/A N/A N/A - State Training School Permanent Land Fund 4,484,727 4,821,809 45,780 61,736 (8,807) 94,123 192,832 0 N/A N/A N/A - Penitentiary Permanent Land Fund 15,401,870 16,559,510 209,642 282,708 (40,412) 434,688 886,626 0 N/A N/A N/A - Agriculture College Permanent Land Fund 11,210,791 12,053,420 115,014 155,100 (22,129) 236,784 484,768 0 N/A N/A N/A
Hathaway Scholarship Endowment Fund $552,564,524 $588,863,703 $5,788,760 $8,428,123 ($1,158,421) $4,733,203 $17,791,665 ($202,188) 7.36% 3.85% 5.83%
Higher Education Endowment Fund $114,147,274 $121,412,872 $1,196,946 $1,727,786 ($238,150) $1,023,318 $3,709,900 ($35,216) 7.39% 3.82% 5.82%
Workers' Compensation Fund $1,909,367,169 $1,984,625,770 $15,695,806 $33,463,590 ($3,958,565) $6,309,237 $51,510,068 ($1,021,211) 5.07% 3.19% 4.68%
Tobacco Settlement Fund $84,120,446 $84,071,542 $410,847 $1,901,654 ($165,654) $0 $2,146,847 ($449,199) 1.40% 2.38% 2.57%
State Agency Pool $6,244,191,368 $6,240,106,375 $25,930,112 $109,168,354 ($9,317,782) $0 $125,780,683 ($22,692,714) 1.10% 2.04% 2.18%
TOTAL $19,823,645,102 $20,755,870,538 $161,755,965 $314,232,720 ($37,267,980) $224,773,105 $663,493,810 ($26,953,033) 6.10% 3.53% 5.06%
NOTES:The State Treasurer adopted an interpretative policy for accounting purposes whereby earnings consisting of interest and dividends would be treated as ordinary income and disbursed accordingly. Capital gains and losses are reconciled for each fund at the end of the fiscal year. If capital gains and losses are net positive, the Treasurer distributes the net capital gain as income. If capital losses exceed capital gains at year end, the losses are carried forward through the next fiscal year.
At the end of FY 17 deferred losses were held over in the Tobacco Settlement Pool as well as the State Agency Pool (SAP). Since all funds participate in the SAP, all funds participate in the losses. Realized gains and losses will differ depending on if they are reported at the manager level or fund level until the SAP is made whole.
INVESTMENT INCOME As of June 30, 2017
21

See NotesNext Page
Permanent Mineral Trust FundAeronautics Commission - Airport Loans (OSLI) A 5.00% $10,000,000 $2,907,190 $155,762Farm Loans (OSLI) B 7.00% * 275,000,000 21,742,001 933,705Hot Springs State Park (OSLI) C 6.00% 2,000,000 244,125 10,659Hydro-Power Development Loans (OSLI) D 4% -6% 10,000,000 - - Industrial Development Bonds (repealed July 1, 2016) E 5.75% - - - IDB - Lost Creek 23,382,642 1,504,826 IDB - Uranerz 12,444,327 786,507Irrigation Loans (OSLI) F 4% -6% 20,000,000 446,818 24,304Joint Powers Loans (OSLI) G 5.83% * 60,000,000 4,956,088 284,435Natural Resource Board (OSLI) H 0.00% 300,000 - - Reimbursement to Counties for Deferred Taxes I 0.00% 2,000,000 - - Small Business Assistance & FmHA Ag Loans (statute repealed 2008) J 5.00% - 29,189 1,908Water Development - Gillette Madison Pipeline Project K 4.00% 44,328,358 44,328,358 - Water Development - Shoshone Municipal Pipeline Treatment Plant L 4.00% 12,073,148 - 688,549
$435,701,506 $110,480,738 $4,390,656Common School Permanent Land FundDrainage District Bonds M 4.00% 24,000 24,000 - Wyoming Real Estate-State Land Purchases N 0.00% 86,683,553 18,335,738 -
$86,707,553 $18,359,738 $0State Agency Pool (Pooled Investments)Time Deposit Open Account Banking Program O 0.62% * UNLIMITED $138,499,000 $896,499
Sub-Total $522,409,059 $267,339,476 $5,287,154
Other Wyoming Investments from Permanent Mineral Trust FundBasin Electric Power Bond P - $22,498,000 $1,129,141Large Project Fund (ending June 2019) Q Set by SLIB $25,000,000 - -
Total Puplic Purpose Investments $547,409,059 $289,837,476 $6,416,295
* Average Interest Rates
PUBLIC PURPOSE INVESTMENTSAs of June 30, 2017
Statutory Allotment
Interest Paid
Interest Rate
Outstanding Investments
22

PUBLIC PURPOSE INVESTMENTS Notes & Statutory References
(A) Aeronautics Commission, Airport construction, development and improvement loans under W.S. 9-12-703;
(B) Farm loans under W.S. 11-34-129; $275 million authorized of which $27.5 million is for beginning agriculture producer loans and $55 million is for a livestock enhancement program;
(C) Hot Springs State Park loans under W.S. 36-8-318; (D) Hydro-Power Development loans under W.S. 11-34-306(a); (E) Industrial Development Bonds, no investment in excess of $100 million is to be made for any one
project without specific legislative authority; expires June 30, 2017 unless extended under W.S. 9-4-715(m)(vii); repealed July 1, 2016;
(F) Irrigation district loans under W.S. 11-34-302; (G) Joint Powers loans under W.S. 16-1-109; (H) Natural Resource Board under W.S. 11-34-303; (I) Deferred Property Taxes under W.S. 9-4-715(j); (J) Guaranteed portion of certain Small Business Assistance Act loans and guaranteed portion of
certain Farmers Home Administration. Up to $55 million was previously authorized and no new loans were to be made after December 31, 2006. W.S. 9-4-701(e) was repealed when investment statutes were amended in the 2008 legislative session;
(K) Water Development - Gillette Madison Pipeline Project under Wyoming Session Laws, 2009, Chapter 103 ($5,527,500), and Wyoming Session Laws, 2010, Chapter 115 ($8,085,000), and Wyoming Session Laws, 2011, Chapter 61 ($15,939,739) and ($14,776,119). Interest on monies loaned does not begin to accrue until the Water Development Commission determines the project beneficial to the sponsor. Information provided by the Water Development Agency indicates that the benefits accrual date is estimated to occur before July 1, 2018;
(L) Water Development - Shoshone municipal water treatment project, under Wyoming Session Laws, 1987, Chapter 117, as amended;
(M) Drainage District Bond Program under W.S. 41-6-201 through 202; (N) Wyoming Real Estate-State Land Purchases authorizes the investment of funds received from
sale of state trust lands plus up to $2 million one-time seed money contained in the Common School Permanent Land Fund (CSPLF) by purchasing land and improvements within Wyoming as assets of the trust. There was $4 million appropriated to the State Loan and Investment Board from the CSPLF in 2005 for this purpose as well under W.S. 9-4-715(k);
(O) Time Deposit Open Account authorizes the State Treasurer to deposit state funds in approved Wyoming banks and Wyoming savings and loans. Currently, the amount the State Treasurer has made available to banks each year is five percent (5%) of the State Agency Pool assets as of December 31 under W.S. 9-4-803;
Appropriations
(P) Basin Electric Power Bond under W.S. 37-5-406;
(Q) Large Project Fund under Wyoming Session Laws, 2014, Chapter 46, and Wyoming Session Laws, 2016, Chapter 41.
23

See NotesInterfund Loans Next Page
Permanent Mineral Trust FundCapitol Building Rehabilitation and Restoration Account (project completion) A 0.00% UNLIMITED ** - - Unemployment Compensation Fund B 0.00% 20,000,000 - -
Common School Permanent Land FundSchool Foundation Interfund Loan (FY17 interest rate changes to 0%) C 6.00% UNLIMITED ** 375,000,000 15,133,334
State Agency Pool (Pooled Investments)General Fund Interfund Loan (ending June 2018) D 0.00% UNLIMITED ** 100,000,000 - Govenor Fire Fighting Interfund Loan (ending June 2018) E 2.07% 20,000,000 - - Group Health Insurance Loan (ending June 2018) F 2.07% 24,599,000 - - Hathaway Scholarship Loan (ending June 2018) G 2.07% UNLIMITED ** - - WYDOT Interfund Loan (ending June 2018) H 2.07% 100,000,000 - - WYDOT Interfund Loan (ending June 2018) I 0.00% 82,000,000 46,982,136 -
WYDOT Interfund Loan (effective 7-1-2018) J2% or
SAP Rate of Rtn 200,000,000 - -
General Fund or Budget Reserve Account (Pooled Investments)Any other fund or account to meet obligations K 0.00% 60,000,000 - - Group Insurance Plan Coverage & Cost of Discontinuing Coverage L 0.00% 60,000,000
Legislative Stabilization Reserve Account (Pooled Investments)Facilities Construction M 0.00% 4,300,000 - - Strategic Investment and Projects Account (SIPA) Construction N 0.00% 150,000,000 - -
Severence Tax Account (Pooled Investments)Budget Reserve Account (on June 30, 2018) O 0.00% 104,550,000 - -
Risk Management PoolVeterinary Biosafety Levell III Laboratory P 0.00% UNLIMITED ** - -
Total Interfund Loans 825,449,000 521,982,136 15,133,334
** Totals do not include figures for Unlimited Loans as this is unknown.
Interest Paid
INTERFUND LOANS
Interest Rate
Statutory Allotment
Outstanding Investments
As of June 30, 2017
24

INTERFUND LOANS Notes & Statutory References
Permanent Mineral Trust Fund
(A) Capitol Building Rehabilitation and Restoration Account under 2014 Wyoming Session Laws, Chapter 40, Section 4(c) & 4(d);
(B) Unemployment Compensation Fund under W.S. 27-3-303 (d) & (e);
Common School Permanent Land Fund
(C) School Foundation Loan under W.S. 21-13-316;
State Agency Pool (SAP)
Pooled Investments
(D) General Fund Loan under 2016 Wyoming Session Laws, Chapter 31, Section 301(a);
(E) Governor Fighting Wild Land Fires Loan under 2016 Wyoming Session Laws, Chapter 31, Section 318(a);
(F) Group Health Insurance Loan under 2016 Wyoming Session Laws, Chapter 31, Section 318(b);
(G) Hathaway Scholarship Loan under 2016 Wyoming Session Laws, Chapter 31, Section 302;
(H) WYDOT Loan under 2016 Wyoming Session Laws, Chapter 31, Section 301(b);
(I) WYDOT Loan under 2016 Wyoming Session Laws, Chapter 31, Section 318(c);
(J) WYODOT Loan under W.S. 9-1-418;
General Fund or Budget Reserve Account
(K) Any other fund or account can borrow under W.S. 9-1-417;
(L) Group Insurance Plan Coverage to School Districts under W.S. 9-3-205 (e);
Legislative Stabilization Reserve Account (LSRA)
(M) Facilities Construction under 2017 Wyoming Session Laws, Chapter 78, Section 1(e);
(N) Strategic Investment and Projects Account (SIPA) under Wyoming Session Laws, 2016, Chapter 97, Section 8&9 ;
Severance Tax Account in SAP
(O) Budget Reserve Account (BRA) under 2016 Wyoming Session Laws, Chapter 31, Section 322;
Risk Management Pool Appropriation
(P) Veterinary Biosafety Level III Laboratory under 2016 Wyoming Session Laws, Chapter 97, Section 5.
25

INTERFUND LOAN School Foundation Program
For several years the state issued Tax and Revenue Anticipation Notes (TRANs), as authorized by W.S. 9-4-1101 through 9-4-1105, to fund temporary cash flow shortfalls in the School Foundation Fund in order to make School Foundation Program payments to Wyoming school districts as required by Wyoming Statutes. However, since FY 07, the State of Wyoming has not issued any TRANs. Instead, School Foundation Program payments are made by a temporary interfund loan from the corpus of the Common School Permanent Land Fund (CSPLF) at 6% interest as allowed by W.S. 21-13-316. The primary reason for the lack of liquidity to make scheduled School Foundation Program payments is due to the timing of receipt of revenues primarily from federal mineral royalties and ad valorem taxes. A cash flow analysis spreadsheet, on the following page, shows the schedule of actual revenue receipts during FY 17, the schedule of statutory School Foundation Fund payments and the incorporation of the interfund loan from and repayment to the CSPLF for FY 17. Interest payments from the School Foundation Program for this interfund loan totaled $15,133,334 for FY 17. The amount of interest paid to the CSPLF account was reported as income to the account to be distributed among all school districts during FY 17 as provided by W.S. 21-13-316. Liquidity needs were built into the State’s Investment Asset Allocation Plan for the CSPLF for FY 17. To ensure liquidity needs are met, an interfund loan will again be used to fund the cash flow for the School Foundation Program during FY 18. FY 17 was the first year since inception of the loan that the balance was not paid back prior to the end of the fiscal year. Historical School Foundation
FY Date of Borrowed Amount Borrowed Interest Paid
2016-17 7/29/2016 $375,000,000 $15,133,3342015-16 9/1/2015 $220,000,000 $10,693,3332014-15 11/1/2014 $225,000,000 $7,100,0002013-14 10/1/2013 $50,000,000 $1,547,5002012-13 11/1/2012 $160,000,000 $5,147,5002011-12 11/1/2011 $155,000,000 $3,947,5002010-11 11/1/2010 $365,000,000 $10,402,5002009-10 10/1/2009 $378,000,000 $4,460,0002008-09 11/1/2008 $25,000,000 $125,0002007-08 10/1/2007 $369,500,000 $4,565,834
Source: WDE payment and cash flow records.
26

WYOMING DEPARTMENT OF EDUCATIONSchool Foundation Account - with CSPLF Borrowing Cash Flow LSO & CREG
As of June 30, 2017 EstimatesJan 2017 CREG
1st QTR 2nd QTR 3rd QTR 4th QTR FY 2017 Totals LSO Fiscal ProfileBeginning Balance 63,364,505 (8,932,214) 63,471,328 39,418,248 63,364,505 63,364,505
Revenues and TransfersEducation Program Revenue 14,119,666 132,391,969 71,484,016 157,229,162 375,224,812 344,119,735Federal Mineral Royalties - under $200M 22,176,000 22,176,000 22,176,000 22,176,000 88,704,000 0Federal Mineral Royalties - over $200M 0 22,080,669 7,960,017 92,715,891 122,756,578 189,499,3366404-State Treasurer1 0 0 73,935,704 42,496,742 116,432,446 93,100,4006404-State Treasurer5 0 44,765,565 0 0 44,765,565 44,765,5652299-Net Undist Capital Gain/(Loss) 54,953 53,545 (167,233) (59,809) (118,544) 0CSPLF Borrowing 185,000,000 80,000,000 60,000,000 50,000,000 375,000,000 0
Total Revenues and Transfers 221,350,619 301,467,749 235,388,504 364,557,987 1,122,764,858 671,485,036
Expenditures by AgencySchool Foundation Program (205) (282,940,618) (223,747,423) (252,223,460) (130,936,016) (889,847,517) (900,115,769)Borrowing Cost payable to CSPLF (1,911,667) (3,855,000) (3,975,000) (5,391,667) (15,133,333) (10,000,000)Department of Education (005 | 206) (886,829) (963,760) (528,875) (766,707) (3,146,169) (5,511,431)State Treasurer (004)
Capital Facilities Bond Debt Service (FMR)2 (3,456,550) 2,896,500 1,105,500 0 545,450 0Auto. Appropriation to CSPLF Reserve3 0 0 0 0 0 0Transfer to School Capital Construction4 0 0 0 0 0 0
Military Department (007) (785,382) (831,108) (1,005,428) (933,718) (3,555,636) (2,486,713)Attorney General (015) (107,010) (109,430) (111,386) (119,444) (447,270) (852,269)State Parks & Cultural Resources (024) 0 (80,000) 0 0 (80,000) (50,000)School Facilities Department (027) (2,790) (8,884) 0 0 (11,674) (697,345)Department of Workforce Services (053) (6,399) 0 0 0 (6,399) (536,087)Community College (057) (92,791) (75,205) (84,023) (83,861) (335,880) (1,146,160)State Lands and Investments (060) (19,329) (62,478) (10,135) (14,280) (106,222) (1,502,206)Enterprise Technology Services (077) (3,340,158) (2,159,981) (2,454,024) (2,163,430) (10,117,593) (7,608,246)Legislative Service Office (201) (74,209) (163,843) (59,178) (17,334) (314,564) (350,000)Vouchers (23,608) 96,406 (95,575) (812) (23,589) 0
Total Expenditures (293,647,338) (229,064,207) (259,441,583) (140,427,268) (922,580,397) (930,856,225)
Ending Balance (8,932,214) 63,471,328 39,418,248 263,548,967 263,548,967 (196,006,683)
CSPLF Loan Balance 185,000,000 265,000,000 325,000,000 375,000,000 375,000,000 0
NOTES:1. W.S. 21-13-301 - Transfer from Common School Income Fund 2. W.S. 9-4-605 - FMR Divert/Repay Cap Fac Bond Debt Service 3. W.S. 9-4-719 - Common School Spending Policy Transfer to Common School Reserve4. W.S. 21-13-306(c) - Transfer from SFPA to Cap Con5. 2014 Wyo. Sess. Laws Section 300(k)(iii) - Transfer from PLFHA to SFPA
27

APPROVED DEPOSITORIES
On June 2, 2016, the Board of Deposits (Board) approved those Wyoming banks and savings institutions that had applied at that time and were qualified as eligible state depositories for the purpose of placing public funds. On February 2, 2017, the Board added an additional institution as an approved depository. Below is an inclusive listing of all 42 approved depositories as of June 30, 2017. Each institution will remain on the list until its authority is revoked by the Board.
FY 2017 Approved Depository List
ANB Bank of Bridger, NA Bank of Commerce Bank of Jackson Hole Bank of Star Valley Bank of the West Big Horn Federal Savings Bank Buffalo Federal Bank Central Bank and Trust Cheyenne State Bank Commerce Bank of Wyoming Converse County Bank Cowboy State Bank Farmers State Bank First Federal Bank & Trust First Interstate Bank First National Bank of Gillette First Northern Bank of Wyoming First State Bank of Newcastle First Western Trust Bank FirsTier Bank
Glacier Bank Hilltop National Bank Jonah Bank of Wyoming Lusk State Bank Oregon Trail Bank Pinnacle Bank Platte Valley Bank Points West Community Bank Rawlins National Bank Rocky Mountain Bank Rolling Hills Bank & Trust Security State Bank State Bank Summit National Bank Sundance State Bank Uinta Bank US Bank, NA Wells Fargo Bank Wyoming Bank & Trust Wyoming Community Bank Wyoming State Bank
All deposits in excess of the federally insured amount are protected by a pledge of securities, mortgage loans or Certificate of Deposit Account Registry (CDARS), in lieu of a pledge of assets, to the State Treasurer as prescribed by statute. The State Treasurer and the Department of Audit have determined that the parent bank and its branches will be considered a single entity for FDIC Insurance, Time Deposit-Open Accounts (TDOAs) and other deposit programs. The parent bank will hold the depository relationship.
28

TIME DEPOSIT OPEN ACCOUNT (TDOA)
The TDOA program is a discretionary State Treasurer program by which public funds are placed in banks approved as eligible state depositories. This program assists banks that lack an asset base sufficient to meet their lending needs. Banks utilizing this program must fully collateralize the deposits and pay interest to the State Treasurer at rates set quarterly by the State Loan and Investment Board. The Board meets quarterly, in advance of each calendar quarter, to set the interest rate for the ensuing quarter. The TDOA rates for the four quarters of FY 17 were set at 0.58%, 0.57%, 0.56% and 0.76%. Therefore, the annualized TDOA rate for FY 17 was actually 0.62%. TDOA income received in FY 17 was $896,499. Only 23 of the 42 approved depositories had TDOA funds as of June 30, 2017.
TDOA Deposits in Wyoming Banks as of June 30, 2017 Totaled $138,499,000 ANB 14,900,000 Glacier Bank 2,000,000 Bank of Bridger 3,800,000 Jonah Bank of Wyoming 1,000,000 Bank of Jackson Hole 25,600,000 Oregon Trail Bank 800,000 Buffalo Federal Bank 3,500,000 Pinnacle Bank 9,200,000 Central Bank and Trust 2,650,000 Platte Valley Bank 13,300,000 Cheyenne State Bank 1,300,000 Points West Community Bank 4,900,000 Commerce Bank of Wyoming 7,500,000 Rocky Mountain Bank 5,000,000 Farmers State Bank 249,000 Summit National Bank 500,000 First Federal Bank & Trust 11,000,000 Uinta Bank 2,900,000 First National Bank of Gillette 5,400,000 Western States Bank 6,800,000 First Northern Bank of Wyoming 8,000,000 Wyoming Community Bank 3,700,000 FirsTier Bank 4,500,000
29

WYO-STAR Wyoming State Treasurer’s Asset Reserve
In 1987, the Wyoming State Legislature authorized any county, municipality, school district or any other local government entity to participate in the WYO-STAR program (W.S. 9-1-416.) The Wyoming State Treasurer established an investment pool, or common fund, in which all monies are commingled for investment purposes. The primary goal of the WYO-STAR portfolio is to pursue a short-term and extended-term fixed income investment strategy. The WYO-STAR portfolio maintains an exceptionally strong credit profile. This rigorous risk management approach has been tailored to meet the State’s investment guidelines and position the WYO-STAR portfolio defensively. With liquidity being the second objective, WYO-STAR continues to guarantee the return of funds on a 24-hour notice. J. P. Morgan Asset Management manages the WYO-STAR portfolio. Each WYO-STAR participant has an individual interest in the pool based on the ratio of that participant’s cash balance as a percentage of the total cash balance of the pool. Separate accounts are maintained for each governmental entity. All WYO-STAR investments conform to the statute covering the State Treasurer’s other investments (W.S. 9-4-831). WYO-STAR investments, conformance to state statutes, and manager performance are reviewed quarterly by the State Loan and Investment Board's consultant R.V. Kuhns. As of June 30, 2017, there were 179 active WYO-STAR participants, some with multiple accounts. The WYO-STAR pool balance on June 30, 2017, was $659,517,942.48. Participants earned $4,041,093.33 in FY 17. WYO-STAR yields realized in FY 17 are as follows: 07/16 0.528% 01/17 0.582% 08/16 0.480% 02/17 0.666% 09/16 0.452% 03/17 0.761% 10/16 0.444% 04/17 0.811% 11/16 0.418% 05/17 0.789% 12/16 0.546% 06/17 0.841% The annualized yield for FY 17 was 0.610%.
Participants can access their accounts via the internet. This service is called Internet Participant Access System (IPAS). General information about the WYO-STAR program, daily rate information and forms are available on the Treasurer’s website.
30
dsulli
Typewritten Text

SPENDING POLICIES &
RESERVE ACCOUNTS


31

PERMANENT MINERAL TRUST FUND Spending Policy Reserve Account
W.S. 9-4-719 establishes the annual spending policy for earnings from the Permanent Mineral Trust Fund (PMTF). To the extent earnings exceed an amount set in statute for the PMTF, the excess flows to the PMTF reserve account. For those years in which PMTF earnings fail to reach the spending policy amount, monies in the reserve account are available to supplement. If the reserve account reaches more than 90% of the spending policy amount, the excess reserves are placed in the PMTF corpus. The purpose of the spending policy is to even out the ups and downs of investment income. The bottom of this page shows a summary of the cash flows from FY 13 through FY 17 for the PMTF reserve account. The illustration on the following page shows the flow of the spending policy for the PMTF.
PERMANENT WYOMING MINERAL TRUST FUND RESERVE ACCOUNT
SUMMARY FROM FY 13 TO FY 17 AS OF JUNE 30TH
Current Fiscal Year
Prior Fiscal Year
Cost
Prior Fiscal Year Investments at Market
Current Spending
Policy Amount
Current Investment
Income
Investment Income Over
Spending Policy-Reserve
Reserve Cash
Balance Before
Spillover
90% of Spending
Policy
Spillover from Reserve
to Corpus
Reserve Ending Cash
Balance
2013 5,440,883,650 5,595,493,940 233,646,816 366,635,722 132,988,906 277,304,391 175,235,112 (102,069,279) 175,235,112 2014 5,888,454,802 6,112,755,251 253,420,015 395,337,466 141,917,451 317,152,564 190,065,011 (127,087,552) 190,065,011 2015 6,368,298,515 6,979,071,775 284,272,300 494,234,268 199,961,968 390,026,980 255,845,070 (134,181,910) 255,845,070 2016 6,848,939,024 7,172,217,627 311,853,676 149,823,404 10,000,000 265,845,070 280,668,308 0 265,845,070 2017 7,066,416,652 7,319,388,150 331,789,267 298,790,011 0 265,845,070 298,610,341 0 265,845,070
Replacement Chart
32

PMTF Spending PolicyPermanent Mineral Trust Fund (PMTF)
Corpus
PMTF Investment Earnings
(Interest, Dividends and Realized Capital Gains)
$298,790,011
General Fund(2.5%)
$165,894,634
Spending Policy Amount (SPA) = 5% of five-year average value
of corpus$331,789,267
LSRA: Legislative
Stabilization Reserve Account(1.25%)
$62,147,688
SIPA: Strategic
Investments and Projects
Account (1.25%)
$66,447,688
LSRA & SIPAReceive up to 2.5% of earnings in excess of the first 2.5% given to
the General Fund
HB0291 Directs funds to the State Facilities Construction account and the remaining to
the LSRA$4,300,000
PMTF Reserve Account receives
earnings in excess of SPA (>5%)
Balance=$265,845,070
Excess over 90% of SPA in Reserve Account directed back to PMTF corpus –effective immediately
33

COMMON SCHOOL PERMANENT LAND FUND Spending Policy Reserve Account
W.S. 9-4-719 establishes the annual spending policy for earnings from the Common School Permanent Land Fund (CSPLF). Earnings in excess of the spending policy amount flow to the Common School Land Income account and School Foundation Program account. For those years in which CSPLF earnings fail to reach the spending policy amount, monies in the reserve account are available to supplement. If the reserve account reaches more than 90% of the spending policy amount, the excess reserves are placed in the CSPLF corpus. The purpose of the spending policy is to even out the ups and downs of investment income. The bottom of this page shows a summary of the cash flows from FY 13 through FY 17 for the CSPLF reserve account. The illustration on the following page shows the flow of the spending policy for the CSPLF.
COMMON SCHOOL PERMANENT LAND FUND RESERVE ACCOUNT
SUMMARY FROM FY 13 TO FY 17 AS OF JUNE 30TH
Current Fiscal Year
Prior Fiscal Year
Cost
Prior Fiscal Year Investments at Market
Current Spending
Policy Amount
Current Investment
Income
Investment Income Over
Spending Policy-Reserve
Reserve Cash
Balance Before
Spillover
90% of Spending
Policy
Spillover from
Reserve to Corpus
Reserve Ending Cash
Balance
2013 2,318,017,076 2,371,333,538 98,978,909 142,833,282 43,854,373 112,890,821 74,234,182 (38,656,639) 74,234,182 2014 2,533,432,505 2,630,640,734 107,624,856 172,478,233 64,853,377 139,087,559 80,718,642 (58,368,916) 80,718,642 2015 2,782,303,206 3,046,528,217 121,865,368 215,739,848 93,874,480 174,593,123 109,678,831 (64,914,291) 109,678,831 2016 3,261,661,104 3,405,296,800 136,903,302 76,888,127 0 109,678,831 123,212,972 0 109,678,831 2017 3,401,115,144 3,520,306,569 149,741,059 154,937,642 5,196,584 114,875,415 134,766,953 0 114,875,415
Replacement Chart
34

CSPLF Spending PolicyCommon School Permanent Land
Fund (CSPLF) Corpus
CSPLF Investment Earnings
(Interest, Dividends and Realized Capital Gains)
$154,937,642
Common School Land
Income Fund
Spending Policy Amount (SPA) = 5% of five-year average value
of corpus$149,741,059
SFP: School Foundation
Program(3%)
$89,844,635
CSPLF Reserve Account
Balance = $114,875,415
Excess over 90% of SPA in Reserve Account directed back to CSPLF corpus –
effective immediately
SFP Reserve Account
receives the difference
between 3% of investment earnings from
CSLIF and SPA (2%)
$59,896,423
Federal Mineral Royalties –Automatic appropriation to
the CSPLF Reserve Account or the SFP-RA from Federal Mineral Royalties above or below the $200 million cap equal to the extent to which
earnings exceed the SPA, or in the case of the SFP-RA
exceed 3%
Back flow – to ensure at least 2.5% is going to the SFP
$74,870,530
35

EXCELLENCE IN HIGHER EDUCATION FUND Spending Policy Reserve Account
W.S. 21-16-1201 through 1204, passed in 2005, authorized the creation of the Excellence in Higher Education Endowment Program which consists of three separate accounts, the Excellence in Higher Education endowment fund (Higher Ed fund), the Excellence in Higher Education income account (Higher Ed income account) and the Excellence in Higher Education endowment reserve account (Higher Ed reserve account). A portion of the federal mineral royalties, over the $200 million cap, was transferred from the School Foundation fund to the Higher Education fund (corpus) until a maximum of $105 million had been deposited. It was fully funded in April of FY 08.
Investment earnings from the Higher Ed fund (corpus) are transferred to the Higher Ed income account and distributed quarterly to the University of Wyoming (University) and community colleges. The earnings distributed are used by the University and community colleges for the recruitment and retention of faculty, establishing endowed faculty positions and to acquire instructional and resource materials, classroom equipment and other resources necessary to support the work of endowed faculty.
W.S. 9-4-719(k), created the Higher Ed endowment reserve account and W.S. 9-4-719(o) established the annual spending policy amount for the Higher Ed fund (currently 5% of the average five-year rolling average market value). Earnings from the Higher Ed (corpus) fund during each fiscal year in excess of the spending policy amount are deposited into the Higher Ed reserve account. To the extent investment earnings from the Higher Ed fund are less than the 5% of the spending policy amount, an amount equal to the difference is taken from the Higher Ed reserve account and distributed to the University and community colleges in accordance with W.S. 21-16-1201. If the Higher Ed reserve account balance exceeds 75% of the spending policy amount, the excess is to flow to the Higher Ed fund (corpus).
The bottom of this page shows a summary of the cash flows from FY 13 through FY 17 for the reserve account. The illustration on the following page shows the flow of the spending policy for the Higher Education fund.
EXCELLENCE IN HIGHER EDUCATION ENDOWMENT FUND SUMMARY FROM FY 13 TO FY 17
AS OF JUNE 30TH Current Fiscal Year
Prior Fiscal Year
Cost
Prior Fiscal Year
Investments at Market
Spending Policy
Amount
Investment Income Off Expenditure
Account
75% of Spending
Policy
Transferred to Cover
Distributions to UW and Community
Colleges
Net Transfers
In/Out
Investment Income Off
Reserve Account
Total Of Net
Transfers and
Reserve Account Income
Reserve Cash
Balance Before
Spillover
Spillover to Corpus
Reserve Ending Cash
Balance
2013 108,407,594 111,829,141 5,268,752 7,791,230 3,951,564 (5,268,752) 2,549,657 159,810 2,709,467 6,413,822 (2,462,258) 3,951,564 2014 110,870,385 113,851,145 5,359,054 6,727,157 4,019,290 (5,359,054) 1,381,257 36,211 1,417,468 5,369,032 (1,349,742) 4,019,290 2015 112,220,128 121,068,507 5,608,790 7,652,452 4,206,593 (5,608,790) 2,043,662 70,787 2,114,449 6,133,739 (1,927,147) 4,206,593 2016 114,147,273 117,971,275 5,761,758 2,528,330 4,321,318 (5,761,758) (3,238,920) 55,357 (3,183,563) 1,023,030 0 1,023,030 2017 113,895,458 116,902,439 5,816,225 3,686,485 4,362,169 (4,717,944) (1,031,459) 8,429 (1,023,030) 0 0 0
Replacement Chart
36

Higher Education Spending PolicyExcellence in
Higher Education (Higher Ed)
Corpus
Higher Ed Investment Earnings
(Interest, Dividends and Realized Capital Gains)
$3,686,485
2/3 to UW and1/3 equally to Community
Colleges($4,717,944)
Spending Policy Amount (SPA) = 5% of
five-year average value of corpus
$5,761,758
Higher Ed Reserve Account receives
earnings in excess of SPA (>5%). Insufficient
funds in the income account are to be
taken from the reserve account
Balance = $0
Excess over 75% of SPA in Reserve Account directed back to Higher Ed corpus
37

HATHAWAY STUDENT SCHOLARSHIP PROGRAM Spending Policy Reserve Account
Wyoming Statute 21-16-1301 through 1302, authorized the creation of the Hathaway Scholarship Program which consists of three separate accounts, the Hathaway Student Scholarship endowment fund (Hathaway fund), the Hathaway Student Scholarship expenditure account (expenditure account) and the Hathaway Student Scholarship reserve account (reserve account). To fund the Hathaway Scholarship Program (corpus), a portion of the federal mineral royalties, over the $200 million cap, was transferred from the School Foundation fund to the Hathaway fund until a maximum of $400 million had been deposited. The Hathaway Scholarship Program was fully funded in April of FY 07. Investment earnings from the Hathaway fund (corpus) are transferred to the Hathaway expenditure account to fund scholarships for Wyoming students to attend the University and community colleges, if students meet certain criteria set by the legislature. At the end of each fiscal year, any unencumbered, unobligated funds in the Hathaway expenditure account must be transferred to the Hathaway reserve account. If funds in the Hathaway expenditure account are ever insufficient to cover payment for the scholarships, funds are to be transferred from the Hathaway reserve account to the Hathaway expenditure account. At the end of each fiscal year, if funds in the reserve account are more than the greater of $12 million or the amount equal to 4.5% of the previous five year average market value of the corpus, the excess amount in the reserve is transferred to the corpus on or after July 1 each year. The bottom of this page shows a summary of the cash flows from FY 13 through FY 17 for the Hathaway reserve account. The illustration on the following page shows the flow of the spending policy for the Hathaway Scholarship Program.
HATHAWAY STUDENT SCHOLARSHIP RESERVE ACCOUNT
SUMMARY FROM FY 13 TO FY 17 AS OF JUNE 30TH
Prior Fiscal Year
Prior Fiscal Year
Cost
Prior Fiscal Year Investments at Market
Greater of 4.5% or $12
million (FY13 – FY16
3.75%)
Current Investment
Income
Funds Transferred
to cover Scholarships
Net Transfers
In/Out
Current Investment Income Off
Reserve Account
Total Of Net
Transfers and Reserve
Account Income
Reserve Cash Balance
Before Spillover
Spillover to Corpus
Reserve Ending Cash
Balance
2013 501,340,390 518,418,148 17,530,270 33,627,614 (15,333,728) 18,293,886 607,100 18,900,986 34,780,467 (17,250,197) 17,530,270 2014 518,590,588 533,108,982 18,393,608 31,000,894 (15,531,595) 15,469,299 193,560 15,662,859 33,193,129 (14,799,521) 18,393,608 2015 533,390,109 575,666,227 19,478,027 35,903,622 (15,956,535) 19,947,087 311,747 20,258,834 38,652,442 (19,174,414) 19,478,027 2016 552,564,524 571,323,309 20,260,202 12,189,112 (16,405,512) (4,216,400) 251,376 (3,965,024) 15,513,003 0 15,513,003 2017 551,215,264 566,842,582 24,888,233 17,651,225 (16,997,873) 653,352 196,170 849,522 16,362,525 0 16,362,525
38

Hathaway Scholarship Spending PolicyHathaway Student
Scholarship (Hathaway)
Corpus
Hathaway Investment Earnings
(Interest, Dividends and Realized Capital Gains)
$17,651,225
Hathaway Scholarship Expenditure Account
pursuant to W.S. 21-16-1304
through 21-16-1306
($16,997,873)
Hathaway Reserve Account receives
earnings in excess of scholarships awarded
during fiscal year. Insufficient funds in the
expenditure account are to be taken from the
reserve account
Balance = $16,362,525
If the Reserve Account balance exceeds the greater of $12M or 4.5% of the five-
year average value of corpus, the excess is transferredback to Hathaway corpus
39


DISTRIBUTIONS


LivestockPredatory Fines Native
Railroad Veterans US Forest Taylor Severance Tax Animal & American LotteryCar Tax Exemption Reserve Grazing Act Distribution Control Fees Penalties Exemption Funds
Counties W.S. 39-13-104 W.S. 39-13-105 W.S. 39-4-501 W.S. 9-4-401 W.S. 39-14-711 W.S. 11-6-210 W.S. 8-1-109 W.S. 31-3-101 W.S. 9-17-111 Total
Albany 149,654.00 245,690.62 181,759.53 49,386.51 369,612.16 53,199.03 125,369.13 0.00 19,000.87 1,193,671.85
Big Horn 61,794.00 112,492.71 56,039.75 25,362.61 151,416.80 48,958.73 67,138.05 0.00 12,855.30 536,057.95
Campbell 234,224.00 161,401.16 0.00 45,057.30 444,264.20 82,898.90 241,427.17 0.00 138,112.09 1,347,384.82
Carbon 126,376.00 116,452.87 303,175.77 40,979.11 166,772.76 102,620.90 124,322.06 0.00 13,555.74 994,255.21
Converse 250,699.00 110,230.51 36,359.40 29,402.26 138,309.88 62,891.90 91,808.69 0.00 43,619.48 763,321.12
Crook 27,646.00 83,519.79 125,648.27 19,505.33 113,167.44 67,165.01 29,504.07 0.00 19,479.91 485,635.82
Fremont 40,782.00 378,376.95 76,145.87 31,586.59 397,609.08 71,081.85 140,588.62 305,682.13 65,453.95 1,507,307.04
Goshen 125,680.00 159,628.66 0.00 4,867.34 170,496.92 58,736.60 57,289.86 0.00 14,908.42 591,607.80
Hot Springs 24,744.00 70,461.48 3,262.48 20,038.81 107,078.44 17,431.55 18,066.45 8,896.56 5,935.72 275,915.49
Johnson 0.00 117,137.06 52,255.34 60,390.89 98,713.04 68,287.66 46,650.10 0.00 22,207.02 465,641.11
Laramie 234,710.00 1,513,754.51 0.00 38,408.21 887,723.52 19,329.26 344,450.00 0.00 166,778.75 3,205,154.25
Lincoln 67,059.00 114,746.85 78,312.88 13,779.75 185,964.80 57,251.76 89,034.12 0.00 39,596.15 645,745.31
Natrona 69,154.00 593,298.35 2,676.89 142,419.05 731,117.20 44,694.65 273,367.21 0.00 57,148.86 1,913,876.21
Niobrara 75,576.00 27,967.56 0.00 24,096.81 103,647.40 57,475.00 18,907.48 0.00 4,134.49 311,804.74
Park 38,856.00 333,491.91 131,265.68 23,972.86 283,897.60 34,881.15 100,988.40 0.00 52,053.68 999,407.28
Platte 96,282.00 141,454.23 547.31 14,964.73 125,098.24 16,645.82 29,974.37 0.00 20,019.99 444,986.69
Sheridan 86,097.00 391,742.68 62,357.86 5,172.06 300,508.16 58,726.15 100,812.48 0.00 46,104.81 1,051,521.20
Sublette 0.00 67,471.84 125,638.58 16,590.47 102,067.12 13,202.15 52,077.58 0.00 66,353.66 443,401.40
Sweetwater 244,168.00 305,870.01 5,089.44 54,997.43 424,024.96 17,537.00 375,093.62 0.00 59,341.24 1,486,121.70
Teton 0.00 49,686.26 266,882.54 307.05 210,603.84 0.00 73,965.75 0.00 200,603.59 802,049.03
Uinta 110,128.00 149,288.60 11,418.05 14,233.24 223,910.24 40,637.68 76,017.19 0.00 16,904.09 642,537.09
Washakie 22,701.00 87,019.28 5,751.04 24,014.90 146,894.48 42,290.44 31,238.68 0.00 9,287.21 369,197.03
Weston 95,502.00 81,430.10 4,537.98 207,753.94 131,101.72 47,856.25 33,710.80 0.00 10,729.00 612,621.79
Grand Total 2,181,832.00 5,412,613.99 1,529,124.66 907,287.25 6,014,000.00 1,083,799.44 2,541,801.88 314,578.69 1,104,184.02 21,089,221.93
DISTRIBUTIONS TO COUNTIESQuarterly Distributions
As of June 30, 2017
41

Federal Severance Mineral Lottery
Tax Royalty FundsCity/Town W.S. 39-14-801 W.S. 9-4-601 W.S. 9-17-111 Total
Afton 71,144.28 144,101.88 8,507.09 223,753.25Albin 6,720.84 20,060.33 985.41 27,766.58Alpine 30,745.00 70,791.42 3,676.35 105,212.77Baggs 16,337.92 29,778.39 2,776.79 48,893.10Bairoil 3,935.96 16,461.73 870.68 21,268.37Bar Nunn 82,172.36 97,252.42 11,175.26 190,600.04Basin 47,714.20 94,932.44 3,923.77 146,570.41Bear River 19,271.32 40,682.83 1,820.92 61,775.07Big Piney 20,868.00 61,440.98 5,669.87 87,978.85Buffalo 170,248.68 238,098.54 27,363.39 435,710.61Burlington 10,693.92 29,914.81 879.42 41,488.15Burns 11,176.64 25,404.21 1,638.73 38,219.58Byron 22,019.08 51,887.11 1,810.73 75,716.92Casper 2,054,234.92 2,071,236.05 279,371.45 4,404,842.42Cheyenne 2,214,458.04 2,670,738.61 324,676.37 5,209,873.02Chugwater 7,871.92 21,266.38 1,243.18 30,381.48Clearmont 5,235.56 18,059.60 655.63 23,950.79Cody 353,493.40 445,896.84 41,210.07 840,600.31Cokeville 19,865.44 51,048.80 2,375.41 73,289.65Cowley 24,321.24 55,743.78 2,000.05 82,065.07Dayton 28,182.92 47,561.36 3,529.29 79,273.57Deaver 6,609.44 23,072.35 543.53 30,225.32Diamondville 27,366.04 64,659.75 3,272.29 95,298.08Dixon 3,601.76 15,257.96 612.15 19,471.87Douglas 227,022.96 312,926.05 56,718.31 596,667.32Dubois 36,463.28 73,876.32 3,289.71 113,629.31East Thermopolis 9,431.44 20,951.52 1,034.77 31,417.73Edgerton 7,240.68 19,247.67 984.71 27,473.06Elk Mountain 7,092.16 18,415.15 1,205.37 26,712.68Encampment 16,709.24 30,114.25 2,839.89 49,663.38Evanston 459,949.88 627,973.54 43,460.12 1,131,383.54Evansville 94,128.76 109,220.45 12,801.31 216,150.52Fort Laramie 8,540.28 21,441.96 629.28 30,611.52Frannie 5,829.68 21,444.18 503.63 27,777.49Gillette 1,107,006.24 1,585,220.82 283,696.12 2,975,923.18Glendo 7,612.00 20,960.41 1,202.14 29,774.55Glenrock 95,614.04 140,475.88 23,887.74 259,977.66Granger 5,161.32 17,850.74 1,141.74 24,153.80Green River 464,702.76 541,776.58 102,798.28 1,109,277.62Greybull 68,582.16 129,891.24 5,639.85 204,113.25Guernsey 42,590.00 65,134.55 6,726.10 114,450.65Hanna 31,227.72 43,246.88 5,307.43 79,782.03Hartville 2,302.16 14,709.98 363.58 17,375.72Hudson 17,117.68 42,639.49 1,544.35 61,301.52Hulett 14,184.28 41,284.12 1,851.19 57,319.59Jackson 357,243.72 517,079.42 165,339.43 1,039,662.57Kaycee 9,765.64 24,797.13 1,569.60 36,132.37Kemmerer 98,621.68 193,963.76 11,792.71 304,378.15Kirby 3,416.12 15,242.28 374.79 19,033.19La Barge 20,459.56 52,126.89 2,446.45 75,032.90La Grange 16,635.00 33,391.31 1,225.72 51,252.03
(Continued on Next Page)
DISTRIBUTIONS TO CITIES & TOWNSQuarterly Distributions
As of June 30, 2017
42

Federal Severance Mineral Lottery
Tax Royalty FundsCity/Town W.S. 39-14-801 W.S. 9-4-601 W.S. 9-17-111 Total
DISTRIBUTIONS TO CITIES & TOWNSQuarterly Distributions
As of June 30, 2017
Lander 282,089.24 468,693.31 25,450.02 776,232.57Laramie 1,144,212.24 720,916.34 111,749.92 1,976,878.50Lingle 17,377.60 34,212.35 1,280.45 52,870.40Lost Springs 148.52 12,194.91 37.11 12,380.54Lovell 87,630.72 161,802.00 7,206.30 256,639.02Lusk 58,185.32 168,672.71 8,028.18 234,886.21Lyman 78,125.00 119,116.94 7,381.94 204,623.88Manderson 4,233.00 19,091.29 348.11 23,672.40Manville 3,527.52 21,316.48 486.71 25,330.71Marbleton 40,176.44 104,411.27 10,916.02 155,503.73Medicine Bow 10,545.40 21,538.78 1,792.30 33,876.48Meeteetse 12,142.04 29,800.77 1,415.51 43,358.32Midwest 15,001.20 30,015.80 2,040.14 47,057.14Mills 128,586.96 143,712.20 17,487.55 289,786.71Moorcroft 37,465.84 84,380.74 4,889.66 126,736.24Mountain View 47,899.84 78,835.94 4,526.00 131,261.78Newcastle 131,186.16 164,332.45 14,720.62 310,239.23Opal 3,564.64 18,468.60 426.24 22,459.48Pavillion 8,651.68 25,969.64 780.55 35,401.87Pine Bluffs 41,921.64 65,276.94 6,146.57 113,345.15Pine Haven 18,194.52 48,693.33 2,374.56 69,262.41Pinedale 75,228.76 182,418.88 20,439.80 278,087.44Powell 234,449.32 300,785.98 27,331.97 562,567.27Ranchester 31,821.84 51,765.59 3,984.97 87,572.40Rawlins 343,802.04 325,984.28 58,432.34 728,218.66Riverside 1,930.84 13,746.54 328.17 16,005.55Riverton 397,123.12 656,224.26 35,828.35 1,089,175.73Rock River 9,097.24 17,612.51 888.57 27,598.32Rock Springs 855,364.96 984,622.49 189,217.82 2,029,205.27Rolling Hills 16,263.68 36,343.09 4,063.24 56,670.01Saratoga 62,752.52 71,762.44 10,665.37 145,180.33Sheridan 647,947.48 763,610.94 81,141.09 1,492,699.51Shoshoni 24,098.44 53,911.13 2,174.16 80,183.73Sinclair 16,078.00 29,543.26 2,732.61 48,353.87Superior 12,401.96 29,079.71 2,743.49 44,225.16Star Valley Ranch 55,808.88 116,273.56 6,673.35 178,755.79Sundance 43,889.64 96,276.52 5,728.02 145,894.18Ten Sleep 9,654.24 24,210.33 866.71 34,731.28Thayne 13,590.20 39,661.43 1,625.05 54,876.68Thermopolis 111,729.16 121,043.70 12,258.44 245,031.30Torrington 241,392.92 281,879.23 17,786.68 541,058.83Upton 40,844.84 61,494.67 4,583.26 106,922.77Van Tassell 556.96 13,471.02 76.84 14,104.82Wamsutter 16,746.36 33,983.32 3,704.52 54,434.20Wheatland 134,676.52 173,533.61 21,269.05 329,479.18Worland 203,741.44 272,685.02 18,291.08 494,717.54Wright 67,096.92 110,173.65 17,195.87 194,466.44Yoder 5,606.88 18,198.85 413.13 24,218.86GRAND TOTAL 14,337,500.00 18,562,499.94 2,250,890.56 35,150,890.50
43

DISTRIBUTIONS OVER $200 TOTAL FY 17UNDER $200 MADE IN MILLION DIST ROYALTY MONEYMILLION % FY 17 FY 17 DISTRIBUTED
Mineral Royalty:Cities & Towns 9.375% $18,562,500.00 $0.00 $18,562,500.00University Of Wyoming 6.750% 13,365,000.00 0.00 $13,365,000.00School Foundation Fund 44.800% 88,704,000.00 126,770,656.35 $215,474,656.35Highway Fund-redirect to the General Fund 30.375% 60,142,500.00 0.00 $60,142,500.00Highway Fund State Roads 2.250% 4,455,000.00 0.00 $4,455,000.00Cities, Counties & Special
Districts Capital Const. 3.750% 7,425,000.00 0.00 $7,425,000.00School Districts - Grants 2.700% 5,346,000.00 0.00 $5,346,000.001% General Fund 2,000,000.00 0.00 $2,000,000.00UW Bond Coverage 0.00 $0.00Budget Reserve Account 253,465,265.45 $253,465,265.45
TOTAL 100.00% $200,000,000.00 $380,235,921.80 $580,235,921.80
Coal Lease Bonus:Cities, Counties & Special
Districts Capital Const.* 37.50% $5,625,000.00 0.00 $5,625,000.00School Capital Construction 40.00% 115,287,115.06 0.00 $115,287,115.06Community College Commission** 10.00% 1,600,000.00 0.00 $1,600,000.00Highway Funds* 12.50% 1,875,000.00 0.00 $1,875,000.00
TOTAL 100.00% $124,387,115.06 $0.00 $124,387,115.06
$324,387,115.06 $380,235,921.80 $704,623,036.86
$704,623,036.86
NOTES:Distribution FY 17 plus FY 17 "over $200 million" = Total FY 17 royalty money distributed.The "over $200 million FY 17" distribution was completed 4/17.Mineral Royalties are distributed quarterly to Cities & Towns and State Agencies but monthly to the School Foundation Fund.*The first seven million five hundred thousand dollars of Coal Lease Bonus payments shall be distributed according to 9-4-601(b)(i)(A). ** 9-4-601(b)(iv)(A) ten percent but not to exceed one million six hundred thousand dollars.
FY 17 GRAND TOTAL DISTRIBUTIONS
FY 17 GRAND TOTAL COLLECTIONS
FEDERAL MINERAL ROYALTY DISTRIBUTIONS
44

CAPITAL FACILITIES REVENUE BONDS
BONDS PRINCIPALAMOUNT INTEREST OUTSTANDING PAYMENTS YEAR OF BALANCE
SERIES ISSUED RANGE % JULY 1, 2016 FY17 MATURITY JUNE 30, 2017
1992 28,750,000 3.0-6.25 8,040,000 1,650,000 (2020) 6,390,0002012 16,905,000 0.5-2.0 15,970,000 885,000 (2024) 15,085,000
Total Outstanding Revenue Bonds $21,475,000
Future minimum payments for revenue bonds are as follows:
FISCAL YEAR ENDEDJUNE 30 PRINCIPAL INTEREST
2018 2,645,000 834,9812019 2,745,000 723,4442020 2,860,000 591,5942021 2,685,000 456,1942022 2,810,000 338,900
2023-2025 7,730,000 342,500
Wyoming Statute 9-4-605 authorizes the State Loan and Investment Board to borrow up to $105 million through the issuance ofrevenue bonds for capital construction purposes. Funds for the payment of principal and interest on these bonds is restricted tothe federal mineral royalties distributed to the school foundation program or to the highway construction funds.
45

BOND GUARANTEE AND BOND SUPPLEMENTAL COVERAGE PROGRAMS
The Wyoming State Legislature established bond guarantee programs for school districts and local governments during the 1994 legislative session and they established a bond supplemental coverage program for the University of Wyoming bonds during the 2011 legislative session as described on the following page.
School District
Bond Guarantee Program Wyoming Statute 9-4-1001 authorizes the State Loan and Investment Board to guarantee school district general obligation bonds issued under W.S. 21-13-701 through 21-13-721. However, the 2002 Legislature closed the state guarantee for future issues, except for the refunding of bonds issued on or before November 1, 2001. The State Treasurer is authorized to pledge up to $300 million from the Common School Permanent Land Fund to guarantee the school district bonds. The program is intended to benefit school districts by guaranteeing payment of bonded indebtedness of creditworthy districts by reducing the interest rate at which the bonds may be issued. If a district fails to deposit sufficient debt service monies with the State Treasurer, funds will be advanced from the Common School Permanent Land Fund. Repayment to the Common School Permanent Land Fund will be made from the district’s next payments from the School Capital Construction account and the School Foundation Fund. As of June 30, 2017, the State Loan and Investment Board had approved guaranteeing school district bonds issues with original amounts totaling $169,639,000. Of these, 28 issues have now been called or paid off completely and $1,265,000 is still outstanding.
46

University of Wyoming Revenue Bond Supplemental Coverage Program
Wyoming Statute 9-4-1003 authorizes the State Loan and Investment Board to provide supplemental coverage for repayment of revenue bonds issued by the University of Wyoming under W.S. 21-17-402 through 21-17-450 on or before November 1, 2015, only. This program is intended to benefit the University of Wyoming by reducing the interest rate at which the bonds may be issued. If the University fails to deposit sufficient debt service monies with the State Treasurer within a certain time period, funds necessary to make the revenue bond payments will be advanced from Federal Mineral Royalty revenue received in excess of $200 million that would otherwise be distributed to the Budget Reserve account. Repayment to the Budget Reserve account is to be made from the University’s general fund. As of June 30, 2011, the State Loan and Investment Board had approved supplemental coverage for one bond issued by the University for facility improvements and refunding revenue bonds in the amount of $16,740,000. As of October 26, 2016, the 2011A Bond was defeased through an advance refunding. The 2011B Bond remains with an outstanding amount of $5,635,000 as of June 30, 2017. As of June 30, 2012, the State Loan and Investment Board approved another supplemental coverage for one bond issued by the University for facility improvements and refunding revenue bonds in the amount of $39,655,000. Of this amount $33,030,000 remains outstanding as of June 30, 2017.
47

ENDOWMENT CHALLENGE FUND MATCHING PROGRAMS
There were five endowment challenge fund matching programs administered by the State Treasurer’s Office as of June 30, 2017, involving 33 eligible institutions. These matching programs are incentive based to encourage donations to the institutions. When the institution receives a pledge of an endowment gift it submits a commitment form to the State Treasurer’s Office to encumber funds within the endowment fund. When the institution collects on the pledge or receives a qualifying contribution, it submits a request to the State Treasurer’s Office for a distribution of matching funds from the endowment fund associated with that institution. Upon receiving the match, the institution transfers the gift and match to its foundation, where it is invested and held inviolate. Only the earnings may be spent for the purposes of the endowment specified, with the exception of the University of Wyoming’s Athletic program and Academic Facilities program. The University of Wyoming programs may spend all of the funds for the costs of establishing new or renovating existing university facilities as approved by the university president and the board of trustees. The initial appropriation to an endowment challenge fund matching program occurred in fiscal year 2001. The Wyoming State Legislature has appropriated matching funds totaling $278.4 million as of June 30, 2017.
The following is a list of the endowment challenge fund matching programs authorized by the state statutes as of June 30, 2017 that are to be administered by the State Treasurer:
The University of Wyoming (UW) Endowment Challenge Program, W.S. 21-16-901 through 21-16-904 established in fiscal year 2001.
The University Athletics Challenge Account, W.S. 21-16-1001 through 21-16-003 established in fiscal year 2004.
The University Academic Facilities Challenge Account, W.S. 21-16-1401 through 21-16-1403 established in fiscal year 2006.
The Community College Challenge Programs, seven (7) in total, W.S. 21-16-1101 through 21-16-1104 established in fiscal year 2004.
The Wyoming Public Library Endowment Challenge Program, twenty-three (23) in total, W.S. 18-7-201 through 18-7-205 established in fiscal year 2009.
The community college challenge program has a statutory provision (W.S. 21-16-1004(f)(ii)(iv)) that allows colleges to enter into an agreement permitting one college to encumber and collect funds in excess of the amount within their challenge account by using unencumbered funds from another college. The statute does stipulate, however, that the match disbursed by the State Treasurer must be divided equally between the colleges participating in the agreement.
48

The following tables display the appropriations, commitments and payments for the University and Community College, and the Public Library Endowment Challenge Program since their inception.
Total Unfunded RemainingInstitution Appropriation Commitments Payments Appropriation
UW $105,197,598 $5,123,034 $94,424,564 $5,650,000UW Athletics $49,000,000 $591,129 $48,408,871 $0UW Academic Facilities $42,329,880 $0 $42,329,880 $0Casper $12,047,619 $0 $11,328,483 $719,136CWCC $6,964,286 $0 $6,964,286 $0EWCC $4,314,839 $0 $4,086,095 $228,744LCCC $10,031,536 $0 $9,836,518 $195,018NWCC $11,297,619 $74,785 $11,222,834 $0Sheridan $11,879,816 $321,099 $11,558,717 $0WWCC $6,964,286 $0 $6,523,086 $441,200
TOTAL $260,027,478 $6,110,047 $246,683,334 $7,234,097
Total Unfunded RemainingCounty Library Appropriation Commitments Payments Appropriation
Natrona $1,030,032 $0 $1,030,032 $0Laramie $1,042,406 $0 $1,042,406 $0Sheridan $976,082 $0 $976,082 $0Sweetwater $657,795 $0 $555,480 $102,315Albany $797,826 $0 $797,826 $0Carbon $797,826 $0 $797,826 $0Goshen $797,826 $0 $797,826 $0Platte $797,826 $0 $632,066 $165,760Big Horn $694,528 $0 $694,528 $0Fremont $797,826 $0 $465,189 $332,637Park $797,826 $0 $797,826 $0Lincoln $712,570 $0 $712,570 $0Converse $528,209 $0 $528,209 $0Niobrara $862,854 $0 $851,489 $11,365Hot Springs $797,826 $0 $784,928 $12,898Johnson $762,826 $0 $727,790 $35,036Campbell $901,124 $0 $901,124 $0Crook $797,826 $0 $797,826 $0Uinta $797,826 $0 $797,826 $0Washakie $797,826 $0 $734,564 $63,262Weston $665,659 $0 $665,659 $0Teton $797,826 $0 $797,826 $0Sublette $739,826 $0 $658,000 $81,826
TOTAL $18,349,996 $0 $17,544,898 $805,098
PUBLIC LIBRARY ENDOWMENT CHALLENGE PROGRAMSInception through June 30, 2017
49


UNCLAIMED PROPERTY


UNCLAIMED PROPERTY: THE STATE’S LOST & FOUND PROGRAM
Wyoming law requires banks, insurance companies, and many other types of entities (known as holders) to transfer to the Wyoming State Treasurer's Office personal property considered abandoned by owners. These “unclaimed” properties include utility security deposits, customer overpayments, savings accounts, checking accounts, stocks, uncashed dividends or payroll checks, refunds, traveler’s checks, trust distributions, unredeemed money orders, insurance payments or refunds, life insurance policies, annuities, certificates of deposit, and mineral royalty payments. Insurance payments are currently the most reported property type, followed closely by customer credits. Real property, such as houses, land and certain types of personal property, such as automobiles, are not covered by the State’s Unclaimed Property Law.
The State takes custody of unclaimed property and maintains an indefinite obligation to reunite the property with owners or heirs, should they come forth and make a claim. In essence, the state acts as the custodian and/or fiduciary of the unclaimed funds and stands in the shoes of the owner. The state makes a concerted effort to locate and refund all property at no cost. The Unclaimed Property fund currently stands at $60 million. Interest is earned on the fund and pays the operating costs of the Unclaimed Property Division and the residual goes to the general fund on June 30th of each year.
Over the past 24 years, the state has routinely taken in more unclaimed property than it has reunited with owners and the amount of unclaimed property that could theoretically be claimed by owners has grown each year. More than $100 million has been received and approximately $40 million has been disbursed thus, leaving a current balance of $60 million. However, in Fiscal Year 2017, the Unclaimed Property Division had a banner year for disbursements. Implementation of new technology and enhanced methodologies resulted in the highest annual return in Wyoming’s Unclaimed Property program history. The Unclaimed Property Division paid over 4,000 claimants totaling $6.5 million. In addition, the Division received $8 million remitted by holders.
With $60 million remaining in the Unclaimed Property fund, the division will continue to work towards becoming increasingly electronic as well as seek more effective ways to reunite owners and heirs with their lost money. We believe with the positive changes taking place, Wyoming citizens will continue to greatly benefit from Wyoming’s Unclaimed Property program.
51

52

LEGISLATIVE REPORTS &
STATUTORY AUTHORITY


Wyoming State Treasurer Mark Gordon
SPENDING POLICY RECOMMENDATIONS Report to the Legislature
MEMORANDUM To: Select Committee on Capital Financing & Investments From: The Honorable Mark Gordon Due: November 1, 2017 Re: Spending Policy Modification Recommendations In accordance with Wyoming State Statute 9-4-719(p), the State Treasurer is to provide by November 1 of each year recommendations to the Select Committee on Capital Financing and Investments regarding modifications to the spending policy for the earnings on the Permanent Wyoming Mineral Trust Fund (PMTF), the Common School Account within the Permanent Land Fund (CSPLF) and the Excellence in Higher Education Endowment Fund (Higher Ed Fund). As you recall, I made several recommendations regarding modifications to the spending policies last year. I appreciate the consideration given to those recommendations by the members of this committee, some of which were implemented by the legislature. At this time, I have no further recommendations for changes to the spending policies. For detailed information regarding the spending policies and the balances of the various PMTF, CSPLF and Higher Ed Fund accounts, please refer to the “Spending Policy” tab in this Annual Report.
53

Wyoming State Treasurer Mark Gordon
EXCELLENCE IN HIGHER EDUCATION ENDOWMENT FUND RESERVE ACCOUNT
Report to the Legislature MEMORANDUM To: The Honorable Matthew H. Mead Joint Appropriations Committee Joint Education Committee Select Committee on Capital Financing & Investments From: The Honorable Mark Gordon Due: November 1, 2017 Re: Excellence in Higher Education Endowment Fund Reserve Account In accordance with Wyoming State Statute 9-4-719(n), the State Treasurer, in consultation with the University of Wyoming and the Community College Commission, is to report to the Governor, the Joint Appropriations Committee, Joint Education Committee and Select Committee on Capital Financing and Investments no later than November 1st of any year in which funds have been or are anticipated to be distributed from the Excellence in Higher Education Endowment Fund (Higher Ed Fund) reserve account. Total investment income earned on the Higher Ed Fund during the fiscal year amounted to $3,686,484.54 which was below the spending policy amount of $5,816,225.07. The spending policy for the Higher Ed Fund requires that funds in the amount that the investment income falls below the spending policy amount be transferred from the Higher Ed Fund reserve account to the Higher Ed Fund expenditure account but the reserve account had no remaining funds as of January 2017 so no funds were transferred. In addition, the balance of the reserve account did not exceed 75% of the spending policy amount and thus no funds were transferred back to the Higher Ed Fund corpus. The balance in the reserve account at the end of fiscal year 2017 was zero. 2017 Wyoming Session Laws, Chapter 120, Section 309 provides for an appropriation from the legislative stabilization reserve account to the Higher Ed Fund reserve account in the amount of $1,250,000 no later than September 30, 2017. It is anticipated that this appropriated amount will be distributed from the reserve account almost immediately and that, based on current CREG income projections (which do not include any projections for capital gain/loss distributions), the reserve account will again have no remaining funds by the end of March 2018, if not earlier, unless investment income along with any realized capital gains are greater than current CREG projections would indicate. For detailed information showing the previous five years cash flow for the Higher Ed Fund and the ending cash balance in the Higher Ed Fund reserve account, please refer to the “Spending Policy” tab in this Annual Report.
54

Wyoming State Treasurer Mark Gordon
HATHAWAY STUDENT SCHOLARSHIP RESERVE ACCOUNT Report to the Legislature
MEMORANDUM To: Joint Education Committee Select Committee on Capital Financing & Investments From: The Honorable Mark Gordon Due: November 1, 2017 Re: Hathaway Student Scholarship Reserve Account In accordance with Wyoming State Statute 21-16-1302(b), the State Treasurer is to report to the Select Committee on Capital Financing and Investments and the Education Committee by November 1 each year on the amount of funds within the Hathaway student scholarship reserve account at the end of the previous fiscal year and as of July 1 of the current fiscal year. The balance in the reserve account on June 30, 2017 and on July 1 of the current fiscal year was $16,362,525.38. Since this amount was lower than the statutory cap (4.5% of the previous five year average market value of the corpus which was $24,888,233.23), no funds were transferred to the corpus of the Hathaway endowment fund. For detailed information showing the previous five years cash flow for the Hathaway student scholarship fund and the ending cash balance in the Hathaway student scholarship reserve account, please refer to the “Spending Policy” tab in this Annual Report.
55

Wyoming State Treasurer Mark Gordon
COLLEGE SAVINGS PROGRAM Report to the Legislature
MEMORANDUM To: Select Committee on Capital Financing & Investments From: The Honorable Mark Gordon Due: December 31, 2017 Re: Wyoming Family College Savings Program In accordance with Wyoming State Statute 21-16-813(c)(ix), the State Treasurer is required to report annually to the Select Committee on Capital Financing and Investments on the performance of the Wyoming Family College Savings Program Trust Fund. The Wyoming Family College Savings Program was established by Chapter 71 of the 2000 Legislative Session pursuant to Section 529 of the Internal Revenue Code (State Statutes 21-16-809 through 21-16-818). Legislation was passed during the 2006 legislative session (Senate File 0062, Chapter 46) which now allows, but does not require, the State Treasurer to have a 529 college savings program. At this time, Wyoming does not offer a state-sponsored 529 college savings program nor does it participate in any other state’s 529 plan.
56

Wyoming State Treasurer Mark Gordon
PUBLIC PURPOSE INVESTMENTS AND LOANS Report to the Legislature
MEMORANDUM To: Select Committee on Capital Financing & Investments From: The Honorable Mark Gordon Due: November 1, 2017 Re: Public Purpose Investments and Loans In accordance with Wyoming State Statute 9-4-715(n), by November 1 of each calendar year, the State Treasurer, in consultation with the State Loan and Investment Board, the Wyoming Water Development Office, the Wyoming Business Council and the Office of State Lands and Investments, shall provide a report to the Select Committee on Capital Finance & Investments on all state funds invested for the specific public purpose authorized or directed by the Legislature. The report shall include: i) A list of all investment or loan requests made in the previous year, the amount loaned or invested and the status of all investments and loans, including those which are delinquent as to the payment of any installment of principal or interest due; ii) Recommendations for future legislation, including recommendations for adjustments to the amount allocated by this subsection and recommendations for adjustments to the amounts allocated under applicable state law for individual investments authorized or directed by the Legislature for a specific purpose; and iii) The cost of the investment to the people of Wyoming in terms of (a) forgone earnings that could have been obtained if the funds had been invested by the State Treasurer with the permanent funds of the State and (b) any administrative and other costs associated with each investment. In response to this required report, we have attached the following information:
• The Office of State Lands and Investments has provided information regarding a variety of loans. • The Wyoming Business Council provided a memo with an update on the large project
loan program and the status of all approved large project loans. • The Water Development Office provided a memo regarding water development loans. • The State Treasurer’s Office has attached a memo and spreadsheet which is a summary
of all outstanding public purpose investments. Attachments
57
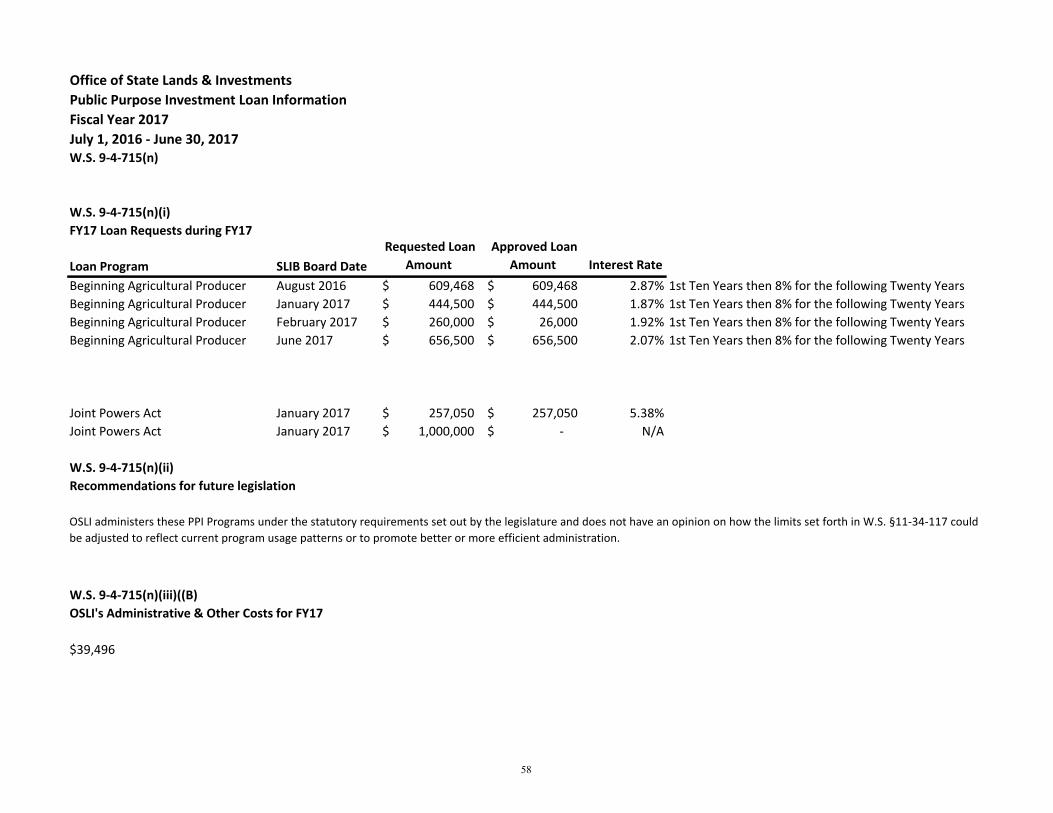
Office of State Lands & InvestmentsPublic Purpose Investment Loan InformationFiscal Year 2017July 1, 2016 - June 30, 2017W.S. 9-4-715(n)
W.S. 9-4-715(n)(i)FY17 Loan Requests during FY17
Loan Program SLIB Board Date Requested Loan
Amount Approved Loan
Amount Interest RateBeginning Agricultural Producer August 2016 609,468$ 609,468$ 2.87% 1st Ten Years then 8% for the following Twenty YearsBeginning Agricultural Producer January 2017 444,500$ 444,500$ 1.87% 1st Ten Years then 8% for the following Twenty YearsBeginning Agricultural Producer February 2017 260,000$ 26,000$ 1.92% 1st Ten Years then 8% for the following Twenty YearsBeginning Agricultural Producer June 2017 656,500$ 656,500$ 2.07% 1st Ten Years then 8% for the following Twenty Years
Joint Powers Act January 2017 257,050$ 257,050$ 5.38%Joint Powers Act January 2017 1,000,000$ -$ N/A
W.S. 9-4-715(n)(ii)Recommendations for future legislation
W.S. 9-4-715(n)(iii)((B)OSLI's Administrative & Other Costs for FY17
$39,496
OSLI administers these PPI Programs under the statutory requirements set out by the legislature and does not have an opinion on how the limits set forth in W.S. §11-34-117 could be adjusted to reflect current program usage patterns or to promote better or more efficient administration.
58

Office of State Lands & InvestmentsStatus of Individual LoansFiscal Year 2017July 1, 2016 - June 30, 2017
Program Loan ID Interest Rate 6/30/2017
Principal Balance Status CommentAeronautics AER1403 5.00% 312,177.59 CurrentAeronautics AER1405 5.00% 289,284.23 CurrentAeronautics AER1406 5.00% 329,616.07 CurrentAeronautics AER1407 5.00% 1,372,958.35 CurrentAeronautics AER1408 5.00% 297,944.25 CurrentAeronautics AER1409 5.00% 305,209.68 CurrentBeginning Agriculture Producer B00001 8.00% 299,199.38 CurrentBeginning Agriculture Producer B00002 8.00% 58,442.70 CurrentBeginning Agriculture Producer B00004 8.00% 50,831.02 CurrentBeginning Agriculture Producer B00007 8.00% 32,808.57 CurrentBeginning Agriculture Producer B00029 8.00% 140,755.46 CurrentBeginning Agriculture Producer B00033 8.00% 496,746.71 CurrentBeginning Agriculture Producer B00045 4.05% 195,540.78 CurrentBeginning Agriculture Producer B00049 3.79% 257,650.35 CurrentBeginning Agriculture Producer B00052 3.41% 148,056.06 CurrentBeginning Agriculture Producer B00054 3.34% 593,661.51 CurrentBeginning Agriculture Producer B00055 3.34% 122,124.92 CurrentBeginning Agriculture Producer B00057 3.35% 676,868.75 CurrentBeginning Agriculture Producer B00061 3.20% 671,570.32 CurrentBeginning Agriculture Producer B00064 3.58% 646,686.35 CurrentBeginning Agriculture Producer B00069 3.52% 347,932.48 CurrentBeginning Agriculture Producer B00071 3.37% 696,639.37 CurrentBeginning Agriculture Producer B00072 3.22% 249,647.06 CurrentBeginning Agriculture Producer B00073 3.45% 44,459.18 CurrentBeginning Agriculture Producer B00077 3.06% 266,723.73 Delinquent Repayment Plan approved 6/1/17Beginning Agriculture Producer B00080 2.63% 48,427.68 CurrentBeginning Agriculture Producer B00084 1.93% 385,475.51 CurrentBeginning Agriculture Producer B00087 1.85% 448,066.81 CurrentBeginning Agriculture Producer B00088 1.81% 470,914.89 CurrentBeginning Agriculture Producer B00095 1.74% 186,795.10 CurrentBeginning Agriculture Producer B00097 1.95% 161,646.90 CurrentBeginning Agriculture Producer B00099 1.90% 320,162.33 CurrentBeginning Agriculture Producer B00100 2.46% 617,957.74 CurrentBeginning Agriculture Producer B00101 2.14% 689,017.50 CurrentBeginning Agriculture Producer B00102 2.14% 269,436.36 CurrentBeginning Agriculture Producer B00103 2.24% 278,154.77 CurrentBeginning Agriculture Producer B00104 1.95% 655,053.55 CurrentBeginning Agriculture Producer B00105 2.19% 739,411.75 CurrentBeginning Agriculture Producer B00106 2.39% 156,036.02 CurrentBeginning Agriculture Producer B00107 2.49% 157,648.73 CurrentBeginning Agriculture Producer B00110 2.60% 445,413.51 CurrentBeginning Agriculture Producer B00111 2.48% 495,479.64 CurrentBeginning Agriculture Producer B00112 2.63% 272,930.29 CurrentBeginning Agriculture Producer B00113 2.68% 127,052.23 CurrentBeginning Agriculture Producer B00114 2.65% 249,688.17 CurrentBeginning Agriculture Producer B00116 2.57% 283,495.62 CurrentBeginning Agriculture Producer B00117 2.57% 667,048.49 CurrentBeginning Agriculture Producer B00118 2.57% 666,952.14 CurrentBeginning Agriculture Producer B00120 2.30% 466,692.57 CurrentBeginning Agriculture Producer B00122 2.14% 624,925.17 CurrentBeginning Agriculture Producer B00123 2.14% 469,166.94 CurrentBeginning Agriculture Producer B00124 2.14% 345,856.74 CurrentBeginning Agriculture Producer B00127 2.14% 521,346.19 CurrentBeginning Agriculture Producer B00129 2.10% 286,459.78 CurrentBeginning Agriculture Producer B00130 2.87% 609,468.00 CurrentBeginning Agriculture Producer B00131 2.04% 603,021.77 CurrentBeginning Agriculture Producer B00132 1.87% 444,500.00 CurrentBeginning Agriculture Producer B00133 1.92% 260,000.00 CurrentFarm Loan F07657 8.00% 7,059.05 CurrentFarm Loan F07996 8.00% 30,002.42 CurrentFarm Loan F08022 8.00% 110,972.59 CurrentFarm Loan F08037 9.00% 18,717.20 CurrentFarm Loan F08081 8.00% 17,857.25 CurrentFarm Loan F08113 8.00% 137,823.79 CurrentFarm Loan F08129 8.00% 23,235.35 CurrentFarm Loan F08201 8.00% 59,785.78 Current Farm Loan F08303 8.00% 17,881.16 Delinquent Repayment Plan approved 6/1/17 Farm Loan F08359 8.00% 94,854.88 CurrentFarm Loan F08398 8.00% 8,444.60 CurrentFarm Loan F08411 8.00% 34,061.15 CurrentFarm Loan F08439 9.00% 65,556.38 Current
59
dsulli
Typewritten Text
dsulli
Typewritten Text
dsulli
Typewritten Text

Program Loan ID Interest Rate 6/30/2017
Principal Balance Status CommentFarm Loan F08486 8.00% 80,103.56 CurrentFarm Loan F08535 8.00% 35,444.92 CurrentFarm Loan F08619 8.00% 22,701.74 CurrentFarm Loan F08663 8.00% 71,169.03 Delinquent Repayment Plan approved 6/2/16 (5 year plan)Farm Loan F08710 8.00% 491,800.29 CurrentFarm Loan F08713 8.00% 453,052.91 CurrentFarm Loan F08722 8.00% 541,429.63 CurrentHot Springs S00006 6.00% 244,124.80 CurrentJoint Powers Act JPA09289 8.50% 18,171.63 CurrentJoint Powers Act JPA09303 8.50% 3,354.18 CurrentJoint Powers Act JPA09320 8.50% 7,372.37 CurrentJoint Powers Act JPA09392 8.50% 42,881.36 CurrentJoint Powers Act JPA09404 7.25% 5,498.87 Delinquent Per District, loan will be paid in full by 12/31/17Joint Powers Act JPA09453 7.25% 134,338.88 CurrentJoint Powers Act JPA09489 7.25% 33,414.24 CurrentJoint Powers Act JPA09504 7.25% 55,608.86 CurrentJoint Powers Act JPA09538 6.00% 93,197.12 CurrentJoint Powers Act JPA09549 6.00% 229,322.38 CurrentJoint Powers Act JPA09550 6.00% 286,463.83 CurrentJoint Powers Act JPA09552 6.00% 278,154.25 CurrentJoint Powers Act JPA09556 6.00% 26,192.02 CurrentJoint Powers Act JPA09563 5.31% 79,391.07 CurrentJoint Powers Act JPA11565 5.06% 102,797.28 CurrentJoint Powers Act JPA11567 5.17% 242,451.95 CurrentJoint Powers Act JPA11570 4.94% 93,918.64 CurrentJoint Powers Act JPA11572 4.94% 145,249.05 CurrentJoint Powers Act JPA11573 4.94% 233,451.02 CurrentJoint Powers Act JPA11574 4.94% 342,740.61 CurrentJoint Powers Act JPA11575 4.94% 91,551.76 CurrentJoint Powers Act JPA13576 4.89% 102,491.85 CurrentJoint Powers Act JPA13577 4.89% 93,174.39 CurrentJoint Powers Act JPA13579 4.89% 35,375.61 CurrentJoint Powers Act JPA13580 4.13% 174,784.91 CurrentJoint Powers Act JPA13581 4.62% 72,566.13 CurrentJoint Powers Act JPA15582 4.62% 435,226.59 CurrentJoint Powers Act JPA15583 4.62% 358,012.95 CurrentJoint Powers Act JPA15584 4.62% 839,271.93 CurrentJoint Powers Act JPA15585 4.96% 42,612.07 CurrentJoint Powers Act JPA17587 5.38% 257,050.00 CurrentSmall Water/Irrigation I00546 4.00% 42,264.11 CurrentSmall Water/Irrigation I00746 4.00% 45,406.89 CurrentSmall Water/Irrigation I00818 5.00% 350,890.48 CurrentSmall Water/Irrigation I00835 6.00% 8,256.66 Current
60

214 W. 15th Street Cheyenne, WY 82002 T: 307.777.2800 F: 307.777.2837 www.wyomingbusiness.org
TO: Erica Legerski, State Treasurer’s Office FROM: Josh Keefe, Economic Development Finance Manager, Wyoming Business Council (WBC) DATE: October 4, 2017 SUBJECT: Current Public Purpose Investments of the WBC In regard to the report referenced in W.S. 9-4-715(n), the Wyoming Business Council assists the State Treasurer’s Office with the Large Project Economic Development Fund. This fund was originated in 2014 with an initial allocation of $25,000,000. There was little to no interest until FY 17, when three applications were received in July and August of 2016 by the WBC from Standard Alcohol Company of America, Inc. (SACA), Atlas Carbon, LLC (Atlas Carbon), and Cody Laboratories, Inc (Cody Labs). All three projects were approved by the WBC at the September 2016 Board of Directors meeting in Worland, WY. All three projects were then presented and approved by the State Lands and Investment Board (SLIB) at the October 2016 meeting. A status update, as of June 30, 2017, for each project is below:
Standard Alcohol Company of America (Cheyenne, WY) – The SLIB approved a loan to SACA for $15M on October 6, 2016. The company then began working with the Treasurer’s office to finalize rate and term(s) of the loan. SACA then formed a new entity (Big Horn Technologies, Inc.), however, the approved loan funds were intended for SACA. A new application was requested from Big Horn Technologies, but has not been received. The original application for SACA was formally denied by the Treasurer’s office on March 6, 2017.
Atlas Carbon, LLC (Gillette, WY) – The SLIB approved a loan to Atlas Carbon for $15M on October 6, 2016. The company began working with the Treasurer’s office to finalize rate and term(s) of the loan. As of June 30, 2017, those terms and conditions are still being negotiated. The project is set to close, but the timeframe for closing is unknown.
Cody Laboratories, Inc. (Cody, WY) – The SLIB approved a loan to Cody Labs for $11M on October 6, 2016. The company began working with the Treasurer’s office to finalize rate and term(s) of the loan. As of June 30, 2017, the project was underway at the site. Cody Labs has requested an amendment to their original application, as construction costs for the project have increased, and are requesting an increased loan amount. This additional request is currently under review at the WBC.
The WBC has received inquiries from two other projects, but these requests are still in the design phase of the project. Once more details are known about the project(s), the WBC will review and advise on next steps for those projects. Please contact me with any questions/concerns.
61

62

Wyoming State Treasurer Mark Gordon
State of Wyoming Treasurer's Office Public Purpose Investments (PPI) Loan Information For Fiscal Year 2017 W.S. 9-4-715 (n) i) Loan Requests: Please see attached spreadsheet. ii) Recommendations: The State Treasurer’s Office does not have any recommendations at this time. iii) Costs: (a) Forgone earnings that the State would have received is difficult to ascertain without knowing the credit quality of each borrower. Earnings in FY 17: Permanent Mineral Trust Fund 8.69% Common School Permanent Land Fund 8.87% State Agency Pool 1.10% For borrowings where the interest rate is below the stated returns above, the State would suffer an opportunity loss. For loans for Wyoming projects, such as the Large Project Loan Program, the Industrial Development Bond Program or the Farm Loan Program, an approximation would be the high yield index. On June 30, 2017, it yielded 5.62%. This is a generic yield and each entity would borrow at different rates. Many high yield credits are currently borrowing at yields well above 8%. (b) Administrative costs associated with PPIs in FY 17 are difficult to estimate. Costs can seriously fluctuate over time depending on the work needed by the PPI program with costs of initiating a PPI significantly greater than on-going maintenance of the loan. Because three large project program loans were approved in FY 17, the Treasurer’s Office and the Attorney General’s Office have spent a significant amount of time on PPIs this fiscal year. As a measure of reference, the amount of the three approved large project loans equals approximately 0.20% of the State’s overall $20 billion portfolio but the time spent on these loans during FY 17, between the Treasurer’s Office and the Attorney General’s Office combined, has exceeded a full time employee position (estimated hours).
63

PPI - LDIBalance Forward
as of June 30, 2016Amount Loaned
In FY 17 Principal Payments Interest Payments
Loan Balanceas of
June 30, 2017 Current Loan StatusPermanment Mineral Trust Fund (PMTF)_Airport Loans $3,084,452.24 $0.00 $177,262.07 $155,762.23 $2,907,190.17 Administered by OSLIBasin Electric $24,593,000.00 $0.00 $2,095,000.00 $1,129,140.95 $22,498,000.00 CurrentFarm Loans $24,634,215.75 $1,937,346.29 $4,829,560.77 $933,705.37 $21,742,001.27 Administered by OSLISpecial Loans - Hot Springs State Park $247,500.00 $0.00 $3,375.20 $10,659.45 $244,124.80 Administered by OSLIGIC (Guaranteed Investment Contract) left over escrow $0.00 $0.00 $0.00 $1,058.85 $0.00 Leftover escrowHydro-Power Development Loans $0.00 $0.00 $0.00 $0.00 $0.00 N/AIndustrial Development Bonds (repealed July 1, 2016) $43,435,038.96 $0.00 $7,608,069.56 $2,291,333.20 $35,826,969.40 CurrentIrrigation Loans $512,103.67 $0.00 $65,285.53 $24,304.21 $446,818.14 Administered by OSLIJPA Loans $5,460,108.75 $257,050.00 $761,070.95 $284,434.78 $4,956,087.80 Administered by OSLIReimbursement to Counties for Deferred Taxes $0.00 $0.00 $0.00 $0.00 $0.00 N/ASmall Business Assistance & FnHA Ag Loans (statute repealed 2008) $45,194.64 $0.00 $16,005.76 $1,907.69 $29,188.88 Current
Water Development - Gillette Madison Pipeline $44,328,358.00 $0.00 $0.00 $0.00 $44,328,358.00
Payments will not start until Water Commission deems project beneficial
Water Development Loans $12,073,147.63 $0.00 $12,073,147.63 $688,548.86 $0.00 Administered by Water DevelopmentTotal PMTF $158,413,119.64 $2,194,396.29 $27,628,777.47 $5,520,855.59 $132,978,738.46Common School Permanent Land Fund (CS)Drainage District $24,000.00 $0.00 $0.00 $0.00 $24,000.00 Delinquent 1974 - Last Payment 2009School Foundation Interfund Borrowing $0.00 $375,000,000.00 $0.00 $15,133,334.00 $375,000,000.00 Paid Off 7-11-17Wyoming Real Estate - Land $18,335,737.79 $0.00 $0.00 $0.00 $18,335,737.79 N/ATotal CS $18,359,737.79 $375,000,000.00 $0.00 $15,133,334.00 $393,359,737.79State Agency Pool (SAP)Large Project Funding $0.00 $0.00 $0.00 $0.00 $0.00 N/ATDOA $191,449,000.00 $48,800,000.00 $101,750,000.00 $896,498.68 $138,499,000.00 CurrentGeneral Fund Borrowing $0.00 $100,000,000.00 $0.00 $0.00 $100,000,000.00 Paid Off 7-31-17Governor Fire Fighting Interfund Borrowing $0.00 $0.00 $0.00 $0.00 $0.00 N/AGroup Health Insurance Borrowing $0.00 $0.00 $0.00 $0.00 $0.00 N/AHathaway Scholarship Borrowing $0.00 $0.00 $0.00 $0.00 $0.00 N/AWYDOT Borrowing ($100M) $0.00 $0.00 $0.00 $0.00 $0.00 N/AWYDOT Borrowing ($82M) $0.00 $82,000,000.00 $35,017,864.00 $0.00 $46,982,136.00 N/ATotal SAP $191,449,000.00 $230,800,000.00 $136,767,864.00 $896,498.68 $285,481,136.00Total PPIs 368,221,857.43 607,994,396.29 164,396,641.47 21,550,688.27 811,819,612.25
STATE OF WYOMING TREASURER'S OFFICEPublic Purpose Investments Loan Information
As of June 30, 2017W.S. 9-4-715 (n)
64

STATUTORY AND LEGISLATIVE AUTHORITY W.S. 8-1-109 Distribution of Fines and Penalties W.S. 9-1-401; 9-1-409 through 9-1-418 State Treasurer - Duties Generally W.S. 9-1-507 Distributions Held for Cities, Towns and Counties Not Complying with Required Reporting W.S. 9-3-303 Agreements with Federal Security Administrator to Extend Benefits to Employees W.S. 9-3-306 Promulgation of Rules and Regulation for Administration of the State Treasurer’s Duties W.S. 9-4-206 Disposition of Revenue-Petty Cash Accounts W.S. 9-4-217 Assist State Auditor with Internal Control Procedures for Assets and Accounting Entries W.S. 9-4-219 Legislative Stabilization Reserve Account W.S. 9-4-220.1 Wyoming State Penitentiary Capital Construction Account W.S. 9-4-305 Distribution-Inflation Proofing-Permanent Land Fund Accounts W.S. 9-4-401 Distribution of Taylor Grazing Funds W.S. 9-4-501 through 9-4-503 Distribution of U.S. Forest Reserve Funds W.S. 9-4-601 through 9-4-607 Distribution of Federal Mineral Royalties W.S. 9-4-605 Bond Issues - Capital Facilities W.S. 9-4-714 through 9-4-719 & 9-4-831 Investment of State Funds W.S. 9-4-720 through 9-4-721 Investment Funds Committee W.S. 9-4-801 through 9-4-829 Deposits in Wyoming Banks & S&L W.S. 9-4-831 Second Local Government Investment Pool; Education for Political Subdivision Treasurers W.S. 9-4-901 through 9-4-904 Refunding Bonds W.S. 9-4-1001 Guarantee Program for School District Bonds W.S. 9-4-1003 Supplemental Coverage Program for University of Wyoming Revenue Bonds W.S. 9-4-1101 through 9-4-1105 Tax & Revenue Anticipation Notes W.S 9-4-1203 Investment of Tobacco Settlement Fund W.S. 9-5-111 through 9-5-112 State Capitol Building Rehabilitation and Restoration Project Oversight Group W.S. 9-15-103 Investment of Wildlife/ Natural Resource Trust Account W.S. 9-17-111 Disposition of Lottery Proceeds W.S. 10-3-403 Wyoming Investment in Airport Loans-Aeronautics Commission W.S. 11-6-210 Distribution of Livestock Predatory Animal Control Fees W.S. 11-34-129 Wyoming Investment in Farm Loans W.S. 11-34-201 Authority to Issue Nonnegotiable Debentures; Acceptance by Treasurer W.S. 11-34-301 Wyoming Investment in Small Water Development Project Loans W.S. 13-4-703 Unclaimed Dividends and Deposits W.S. 16-1-109 Wyoming Investment in Joint Powers Board Loans W.S. 18-7-201 through 18-7-205 County Libraries Endowment Challenge Account/Invest & Distribute Match W.S. 21-13-303 Levy of State Tax; Disposition of Funds; Reduction of Mill Levy W.S. 21-13-304 State Treasurer to Keep Separate Account for School Purposes W.S. 21-13-316 Interfund Borrowing for Common School Account W.S. 21-15-122 Transfer from School Capital Construction Fund to Common School Permanent Land Fund W.S. 21-16-113 Invest in Insured, Guaranteed or Higher Education Loans W.S. 21-16-714 Student Loan Standby Commitment W.S. 21-16-809 through 21-16-818 Family College Savings Program
65

STATUTORY AND LEGISLATIVE AUTHORITY (cont.) W.S. 21-16-901 through 21-16-904 UW Endowment Challenge Account/Invest & Distribute Matching Funds W.S. 21-16-1001 through 21-16-1003 UW Athletic/Academic Challenge Account/Invest & Distribute Matching Funds W.S. 21-16-1101 through 21-16-1104 Community College Endowment Challenge Account/Invest & Distribute Match W.S. 21-16-1201 through 21-16-1204 Investment & Distribution of Higher Education Endowment Fund W.S. 21-16-1301 through 1311 Investment & Distribution of Hathaway Student Scholarship Fund W.S. 21-16-1401 through 21-16-1403 UW Academic Facilities Challenge Account/Invest & Distribute Match W.S. 21-22-101 and 102 Investment of Wyoming Education Trust Fund W.S. 21-23-201 and 202 Wyoming Public Television Endowment/Distribute Match W.S. 24-8-103 Notice of Intention to Issue Bonds; Acceptance/Rejection of Bids W.S. 27-3-201 through 211 Unemployment Compensation Fund Administration W.S. 27-14-701 Investment of Worker's Compensation Funds W.S. 31-3-101 Distribution of Reimbursement for Indian Motor Vehicle Tax Exemptions W.S. 34-24-101 through 140 Unclaimed Property W.S. 36-8-319 Wyoming Investment in Hot Springs State Park Loans W.S. 37-5-206 Investment in Natural Gas Pipeline Authority Bonds W.S. 37-5-406 Investment in Wyoming Infrastructure Authority Bonds W.S. 39-13-104 Distribution of Railroad Car Tax W.S. 39-13-102 and 105 Distribution of Reimbursements for Veteran Tax Exemptions W.S. 39-13-107 Deferred Tax Loans to Counties W.S. 39-14-109, 111, 211, 311, 411, 511, 611, 711 and 801 Distribution of Severance Tax W.S. 39-17-111 Distribution of Gas Tax Refund W.S. 41-2-124 Distribution of Water Development Funds 1987, ch 117 Wyoming Investment-Shoshone Municipal Water Treatment Project Loan 1989, ch 230 Wyoming Investment-Sheridan Area Water Treatment Facility Loan 1989, ch 131 and 285 Wyoming Investment-Laramie Territorial Park Loan 2009, ch 103; 2010, ch 115 Investment in Gillette Madison Pipeline 2014, ch 46; 2016, ch 41 Large Project Loan Program 2017, ch 78 Spending Policy-LSRA redirection 2017, ch 150 Economic and Fiscal Analysis for Economic Development Projects
66

APPENDIX


ASSETS
Treasurer's Cash $48,809,643WYO-STAR Cash $0Cash with Fiscal Agent $71,039,806 $119,849,449
Income Receivable $53,664,946WYO-STAR Income Receivable $53,664,946
State Investments @ Cost $19,823,645,102WYO-STAR Investments @ Cost $662,010,202
Total Investments @ Cost $20,485,655,304
TREASURER'S TOTAL ASSETS $20,659,169,699
LIABILITIES
Due to Local Government Entities (WYO-STAR income) $0
EQUITY
State Investment Equity $19,872,454,745Bond Funds with Fiscal Agent $71,039,806Unapportioned Income $53,664,946
Total State Equity $19,997,159,497
WYO-STAR Participation $662,010,202
TREASURER'S TOTAL LIABILITY & FUND EQUITY $20,659,169,699
BALANCE SHEETAs of June 30, 2017
67
dsulli
Typewritten Text
dsulli
Typewritten Text
dsulli
Typewritten Text

Cash flows from operating activities:
Receipts 1 6,175,683,022 Less return items (3,914,368) Net Cash receipts 6,171,768,653Increase (Decrease) in Petty Cash 2,480Expenses Warrants redeemed 2 (6,348,362,904)
Net Cash provided (used) by operating activities (176,591,771)
Cash flow from investment operations:
Cash Investment income received 3 475,988,685Deferred Income (Gain/Loss) 222,108,278Net increase in investments & loans receivable (718,819,106)
Net Cash provided (used) by investment activities (20,722,143)
Net increase (decrease) in Cash (197,313,914)
Beginning Cash: July 1, 2016 246,123,556
Ending Cash: June 30, 2017 48,809,643
NOTES:
STATEMENT OF CASH FLOWSAs of June 30, 2017
1. Most income to the state is entered as a receipt by the receiving agency and is then processed through the State Treasurer's Office. The exception to this process is investment income, which is entered directly to the investment system and is apportioned later to the receiving agencies. The "receipt" total above represents only non-investment income.2. The "warrants redeemed" total represents the amount paid by the State Treasurer to redeem warrants presented for payment during the fiscal year. Warrants redeemed cannot be equated to total expenditures as warrants may be written in one fiscal year and not presented for payment until the following fiscal year. Internal transfers between agencies, funds or accounts are not included in this total.
3. "Investment income received" represents the investment income actually received by the Treasurer during the fiscal year. Distributions do not normally exactly equal earnings because some income earned and received in one fiscal year may actually be distributed in the following fiscal year. This figure excludes non-cash items, but does include all state trading profits.
68