Wyland Crime Data base management system.
40
Crime Data Visualization and Spatial Database Management System Michael Wyland CS 6604 – Virginia Tech – NVC 24 April 2008
-
Upload
rohit-kumar -
Category
Documents
-
view
223 -
download
0
Transcript of Wyland Crime Data base management system.
7/27/2019 Wyland Crime Data base management system.
http://slidepdf.com/reader/full/wyland-crime-data-base-management-system 1/40
Crime Data Visualizationand Spatial Database
Management SystemMichael Wyland
CS 6604 – Virginia Tech – NVC
24 April 2008
7/27/2019 Wyland Crime Data base management system.
http://slidepdf.com/reader/full/wyland-crime-data-base-management-system 2/40
2
Agenda
Overview Project Context & Objectives Design
– Database design – Data Loading – Optimization – Application Interface
Extensions – Hotspot Detection & DBSCAN
Future Work Demonstration
7/27/2019 Wyland Crime Data base management system.
http://slidepdf.com/reader/full/wyland-crime-data-base-management-system 3/40
3
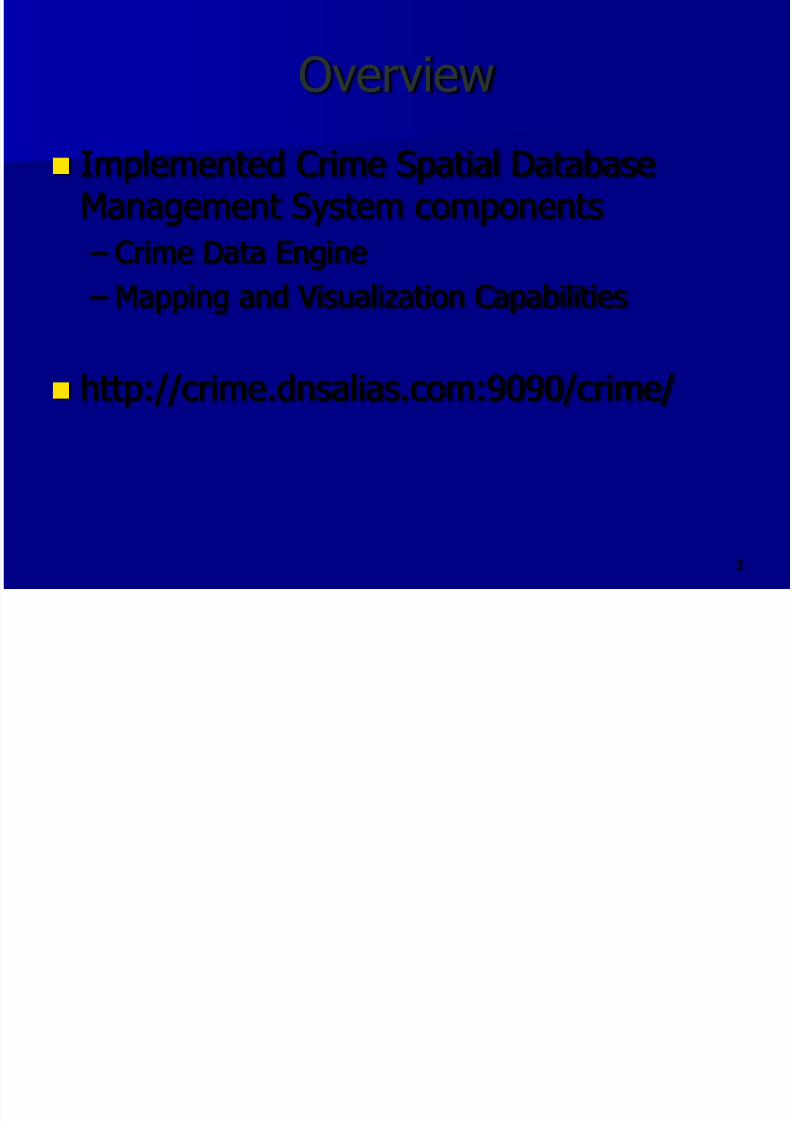
Overview
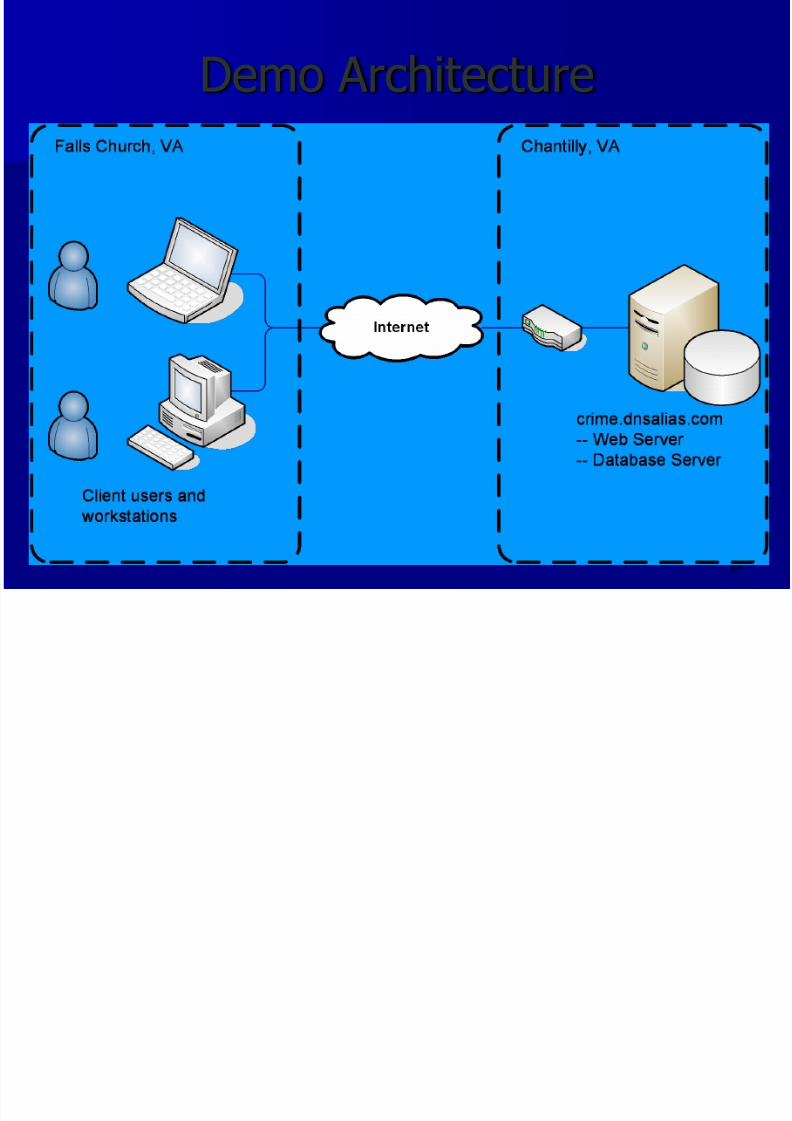
Implemented Crime Spatial DatabaseManagement System components
– Crime Data Engine
– Mapping and Visualization Capabilities
http://crime.dnsalias.com:9090/crime/
7/27/2019 Wyland Crime Data base management system.
http://slidepdf.com/reader/full/wyland-crime-data-base-management-system 4/40
4
Project Context
Design and implement a Crime SpatialDatabase Management System and
Application to support
– General Public (awareness, safety)
– Police officer (optimize resources)
– Crime analyst (trending, patterns)
7/27/2019 Wyland Crime Data base management system.
http://slidepdf.com/reader/full/wyland-crime-data-base-management-system 5/40
5
Project Objectives
Configure project infrastructure includingSpatial DBMS
Implement physical model for crime data
Load Fairfax County Police Departmentdata into the database
Develop required queries (Window and K-Nearest Neighbor)
Optimize query performance
7/27/2019 Wyland Crime Data base management system.
http://slidepdf.com/reader/full/wyland-crime-data-base-management-system 6/40
6
Project Objectives (cont‟d)
Implement Hotspot Identification (Cluster)
Integrate mapping and visualizationinterfaces
Create a publishable quality site
7/27/2019 Wyland Crime Data base management system.
http://slidepdf.com/reader/full/wyland-crime-data-base-management-system 7/40
7
Data Structure
Crime records need to have someconsistent attributes
– Date/time of crime
– Type of crime
– Narrative or description of the crime
– Address of the crime
7/27/2019 Wyland Crime Data base management system.
http://slidepdf.com/reader/full/wyland-crime-data-base-management-system 8/40
8
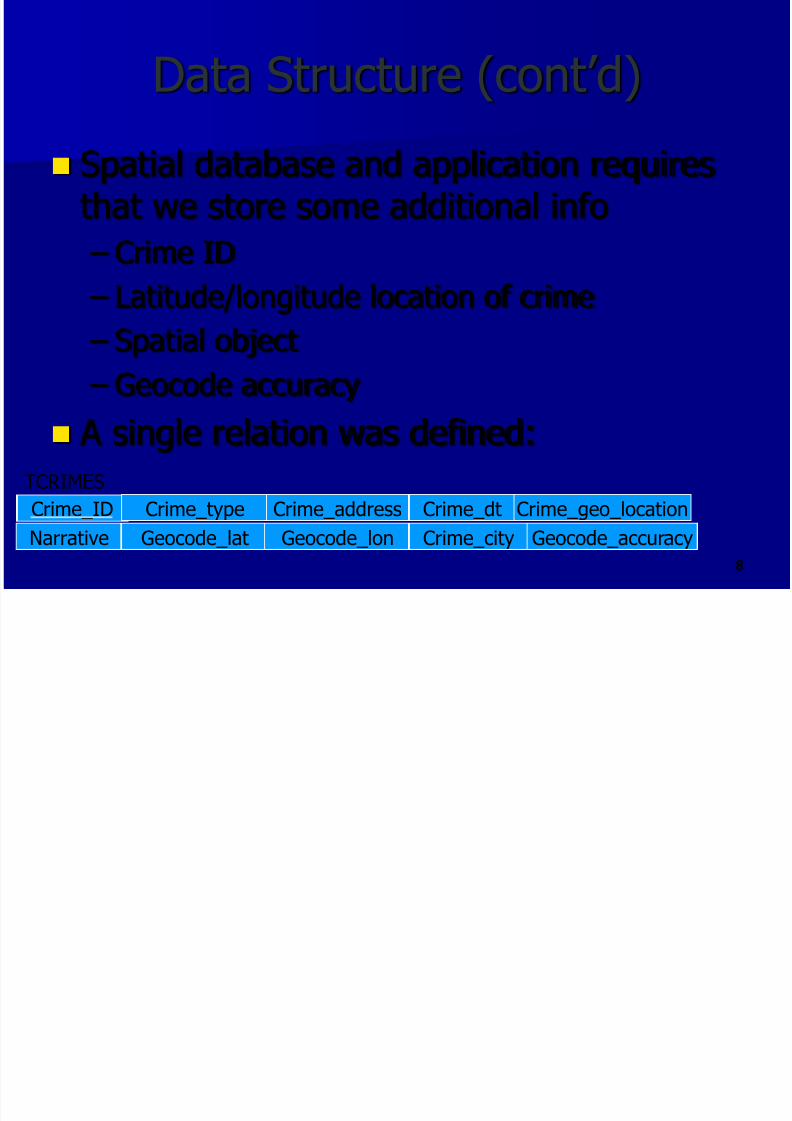
Data Structure (cont‟d)
Spatial database and application requiresthat we store some additional info
– Crime ID
– Latitude/longitude location of crime
– Spatial object
– Geocode accuracy
A single relation was defined:
Crime_ID Crime_type Crime_address
TCRIMES
Crime_dt Crime_geo_location
Narrative Geocode_lat Geocode_lon Crime_city Geocode_accuracy
7/27/2019 Wyland Crime Data base management system.
http://slidepdf.com/reader/full/wyland-crime-data-base-management-system 9/40
9
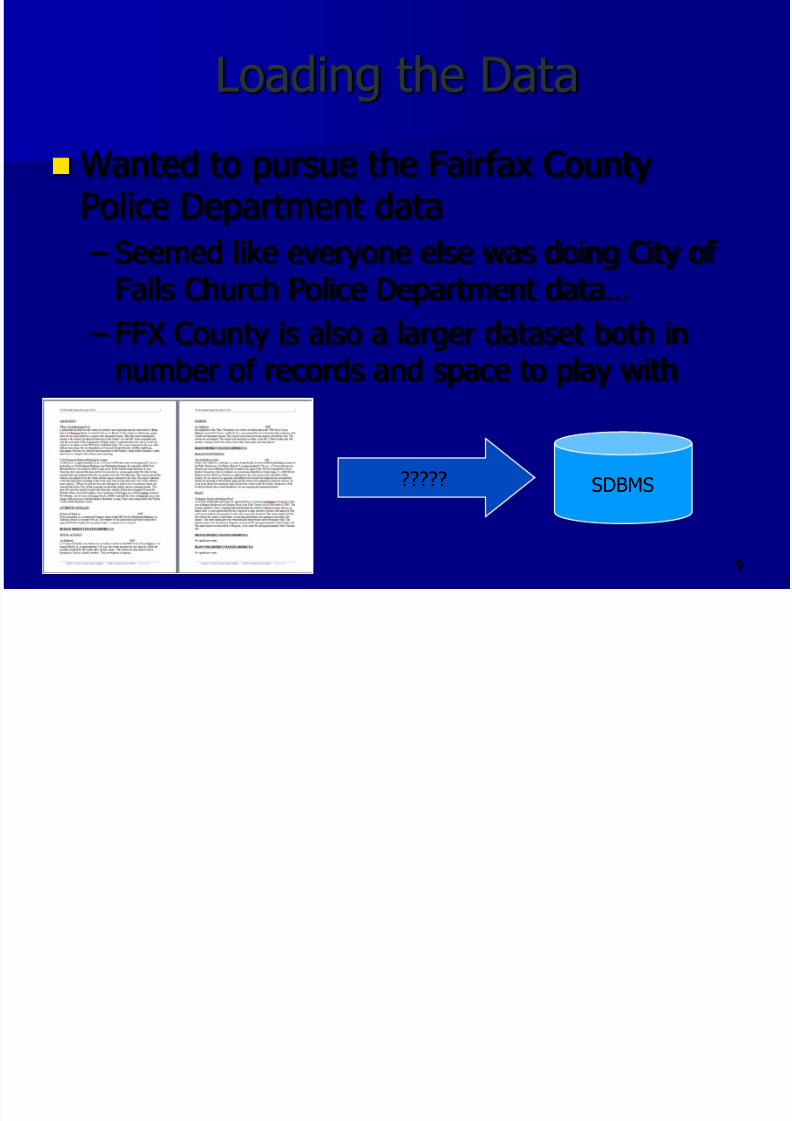
Loading the Data
Wanted to pursue the Fairfax CountyPolice Department data
– Seemed like everyone else was doing City of
Falls Church Police Department data…
– FFX County is also a larger dataset both innumber of records and space to play with
SDBMS?????
7/27/2019 Wyland Crime Data base management system.
http://slidepdf.com/reader/full/wyland-crime-data-base-management-system 10/40
10
Loading the Data (cont‟d)
Several Challenges – All crime reports were in .pdf or .doc format
which are difficult to access without an API
– No standard format/structure exists, so eachcrime record has a slightly different format
– To find date/time attribute requires literallyreading the report text
– Reports actually contain some errors, likeincorrect crime types in some cases
– Non-specific locations and times
7/27/2019 Wyland Crime Data base management system.
http://slidepdf.com/reader/full/wyland-crime-data-base-management-system 11/40
11
Data Loading Strategy
Did not design a parser
– Given the challenges above, short timeline, andpurpose of this class (Not „Parsers 101‟)
Designed web-based data input interface Required human assistance to manually read the
reports and enter the crime info
– My wife entered about 1251 records into my inputinterface
– 8 of 95 .doc files were reviewed and input
– Many assumptions made to correct the data
7/27/2019 Wyland Crime Data base management system.
http://slidepdf.com/reader/full/wyland-crime-data-base-management-system 12/40
12
Data Loading Strategy (cont‟d)
Enter the “block” address
Address is GeoCode‟d using Google Maps API via Geocoding object and JSONresponse object
Enter date/time, crime type, narrative
Record saved in crimes table along withGeoCode results
– No need to GeoCode on-the-fly later
7/27/2019 Wyland Crime Data base management system.
http://slidepdf.com/reader/full/wyland-crime-data-base-management-system 13/40
13
Performance Planning
Indexes
– Normal primary key indexes implemented
– Implemented R-tree index for spatial objects
– Hints for spatial index are used in my queries, basedon Oracle Spatial best practice documentation
Examined Oracle Query Plans
– Confirmed that the required queries are utilizing the
normal and spatial indices and working efficiently
System responds in a timely fashion to multipleconcurrent, large queries
7/27/2019 Wyland Crime Data base management system.
http://slidepdf.com/reader/full/wyland-crime-data-base-management-system 14/40
14
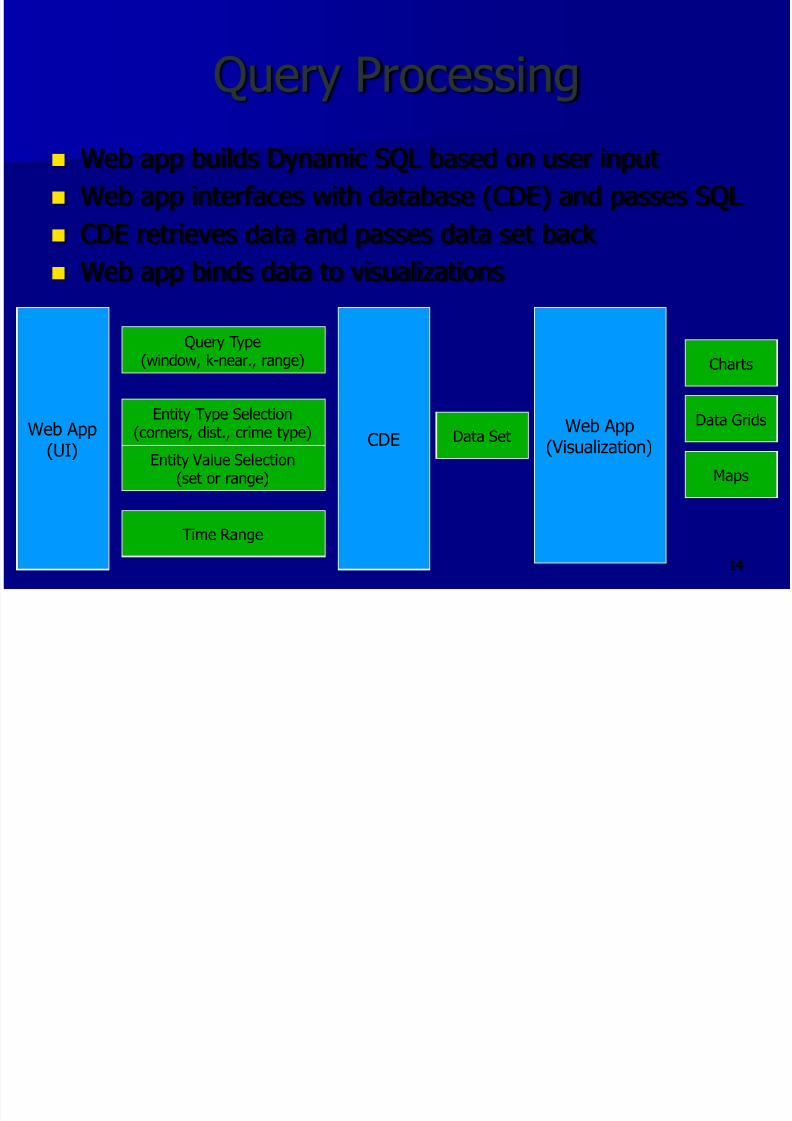
Query Processing
Web app builds Dynamic SQL based on user input
Web app interfaces with database (CDE) and passes SQL
CDE retrieves data and passes data set back
Web app binds data to visualizations
CDEEntity Type Selection
(corners, dist., crime type)
Entity Value Selection(set or range)
Time Range
Web App(UI)
Web App(Visualization)
Query Type(window, k-near., range)
Data Set
Charts
Data Grids
Maps
7/27/2019 Wyland Crime Data base management system.
http://slidepdf.com/reader/full/wyland-crime-data-base-management-system 15/40
15
Query Support
Window Query
– Search inside a dragged box
K-Nearest Neighbor Query
– Click a spot and choose # of results desired
Range Query or “Circle Search”
– Click a spot and choose a distance
All queries can be limited by a date/timerange and crime type
7/27/2019 Wyland Crime Data base management system.
http://slidepdf.com/reader/full/wyland-crime-data-base-management-system 16/40
16
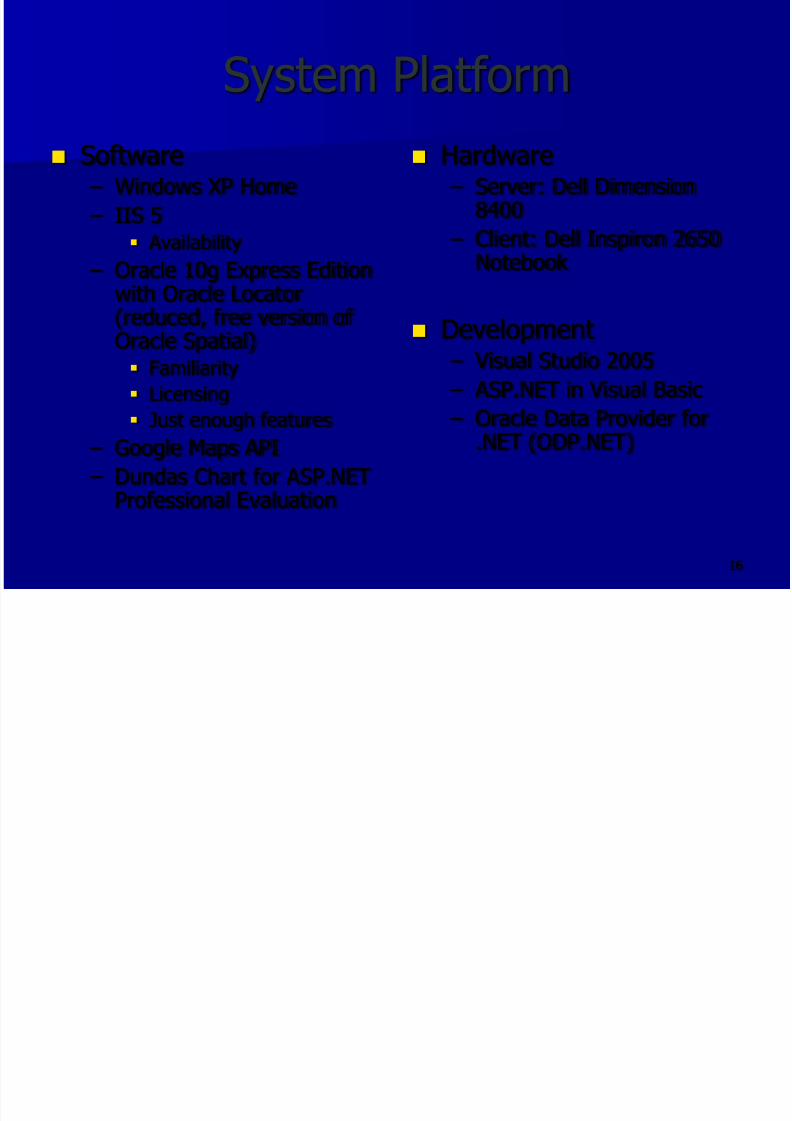
System Platform
Software – Windows XP Home
– IIS 5 Availability
– Oracle 10g Express Editionwith Oracle Locator(reduced, free version of Oracle Spatial) Familiarity
Licensing
Just enough features – Google Maps API
– Dundas Chart for ASP.NETProfessional Evaluation
Hardware – Server: Dell Dimension
8400
– Client: Dell Inspiron 2650Notebook
Development – Visual Studio 2005
– ASP.NET in Visual Basic
– Oracle Data Provider for.NET (ODP.NET)
7/27/2019 Wyland Crime Data base management system.
http://slidepdf.com/reader/full/wyland-crime-data-base-management-system 17/40
17
Demo Architecture
7/27/2019 Wyland Crime Data base management system.
http://slidepdf.com/reader/full/wyland-crime-data-base-management-system 18/40
18
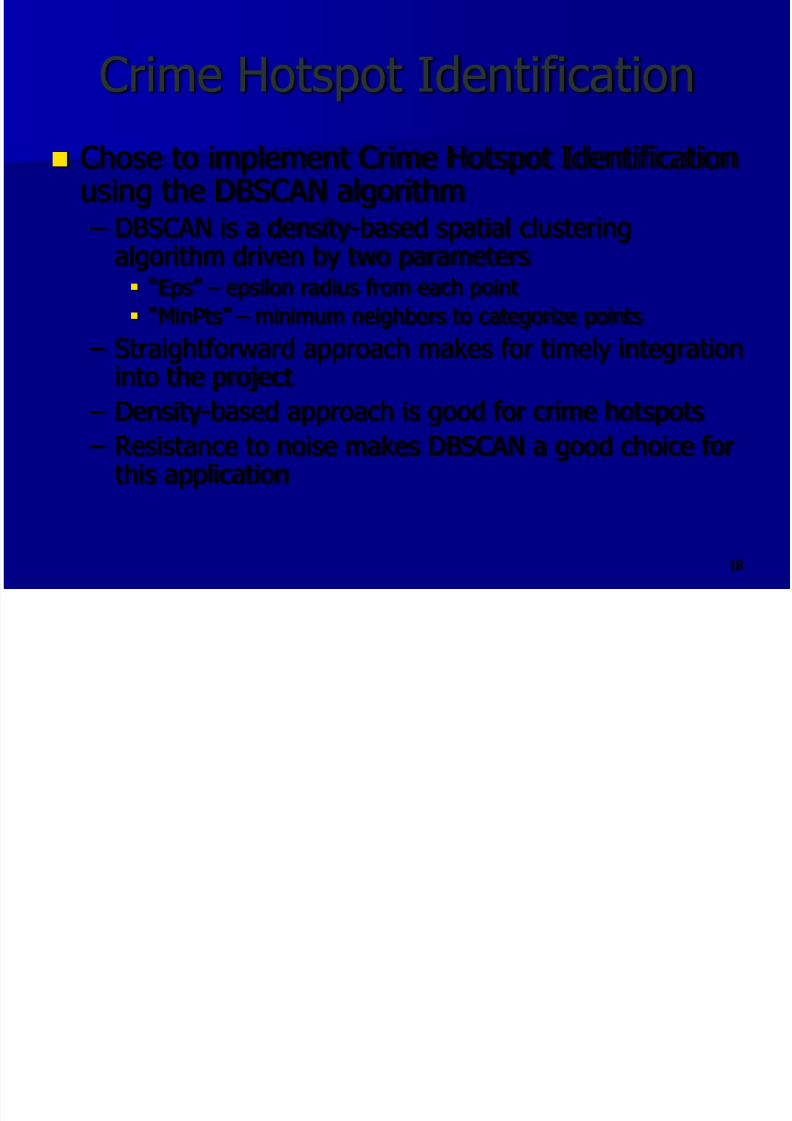
Crime Hotspot Identification
Chose to implement Crime Hotspot Identificationusing the DBSCAN algorithm – DBSCAN is a density-based spatial clustering
algorithm driven by two parameters “Eps” – epsilon radius from each point
“MinPts” – minimum neighbors to categorize points
– Straightforward approach makes for timely integrationinto the project
– Density-based approach is good for crime hotspots – Resistance to noise makes DBSCAN a good choice for
this application
7/27/2019 Wyland Crime Data base management system.
http://slidepdf.com/reader/full/wyland-crime-data-base-management-system 19/40
19
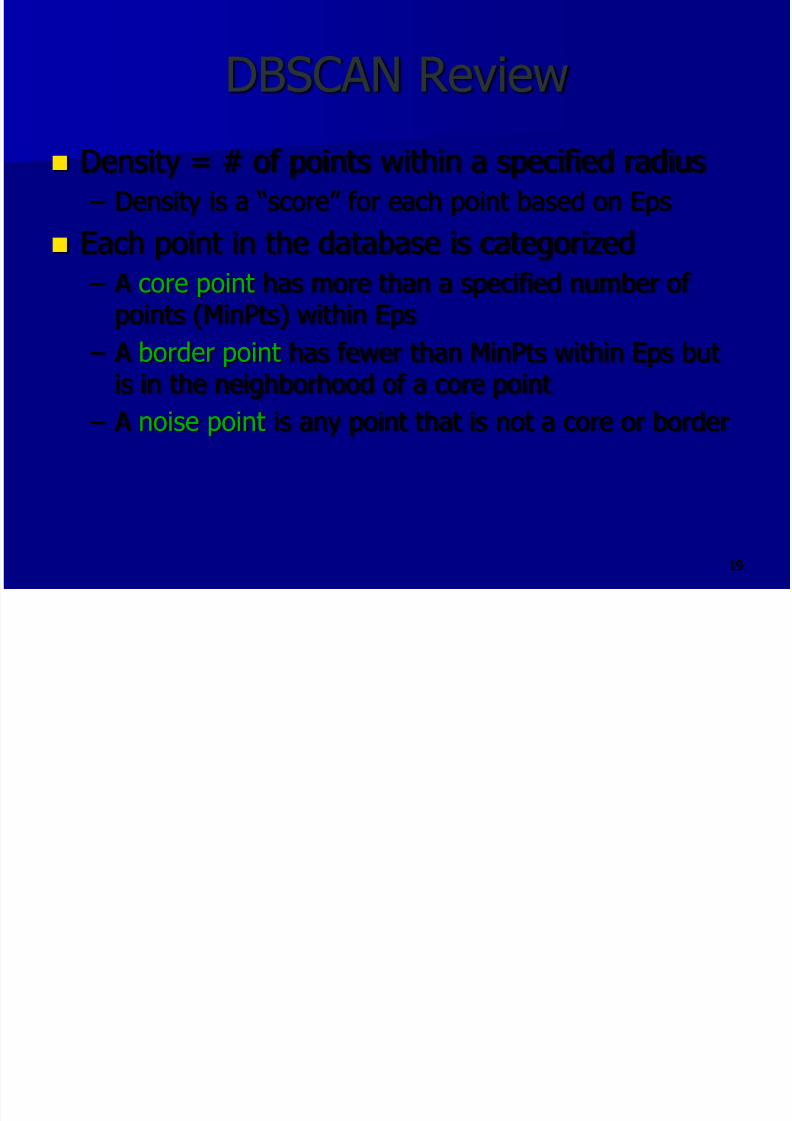
DBSCAN Review
Density = # of points within a specified radius
– Density is a “score” for each point based on Eps
Each point in the database is categorized
– A core point has more than a specified number of points (MinPts) within Eps
– A border point has fewer than MinPts within Eps butis in the neighborhood of a core point
– A noise point is any point that is not a core or border
7/27/2019 Wyland Crime Data base management system.
http://slidepdf.com/reader/full/wyland-crime-data-base-management-system 20/40
20
DBSCAN Implementation
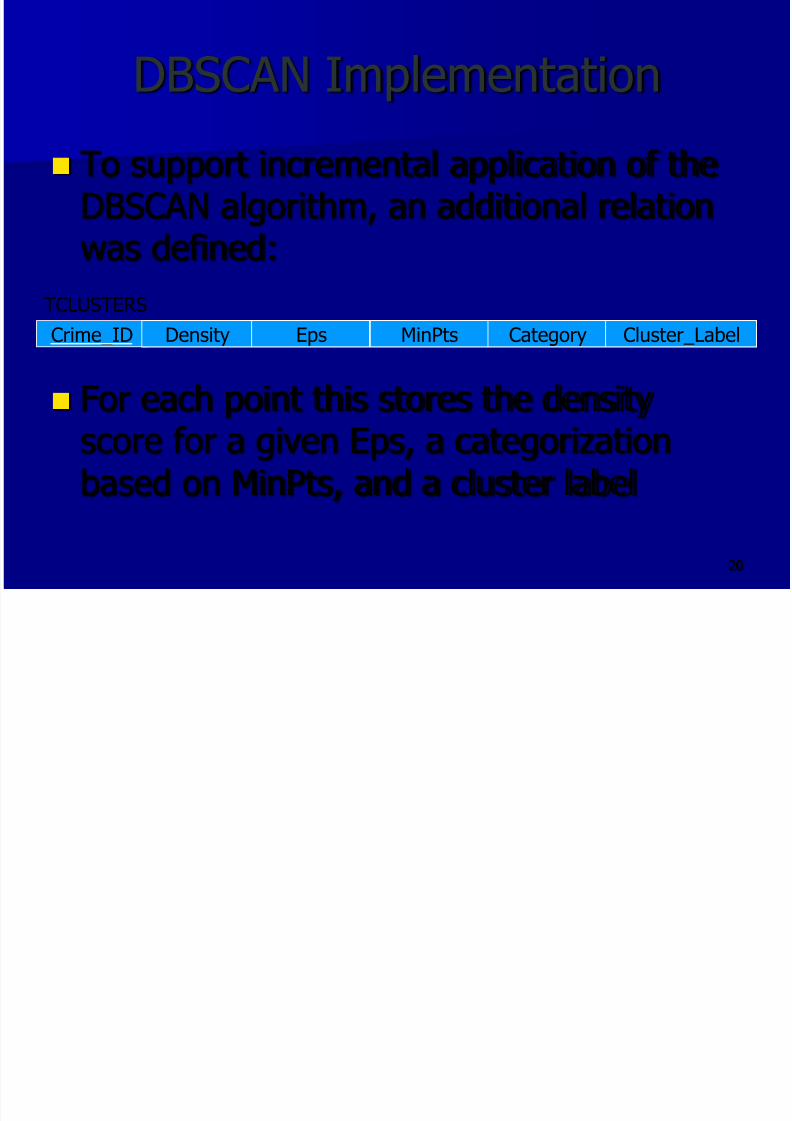
To support incremental application of theDBSCAN algorithm, an additional relationwas defined:
For each point this stores the densityscore for a given Eps, a categorizationbased on MinPts, and a cluster label
Crime_ID Density Eps MinPts Category
TCLUSTERS
Cluster_Label
7/27/2019 Wyland Crime Data base management system.
http://slidepdf.com/reader/full/wyland-crime-data-base-management-system 21/40
21
DBSCAN Implementation
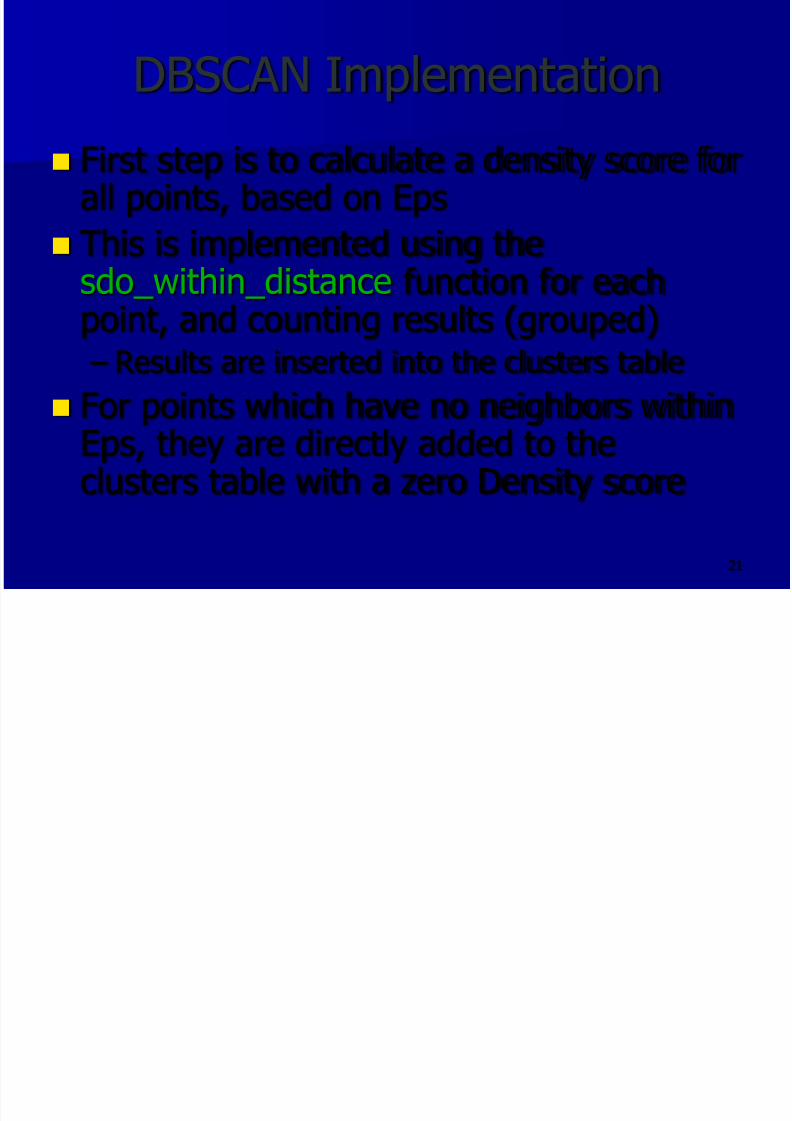
First step is to calculate a density score forall points, based on Eps
This is implemented using the
sdo_within_distance function for eachpoint, and counting results (grouped) – Results are inserted into the clusters table
For points which have no neighbors withinEps, they are directly added to theclusters table with a zero Density score
7/27/2019 Wyland Crime Data base management system.
http://slidepdf.com/reader/full/wyland-crime-data-base-management-system 22/40
22
DBSCAN Implementation
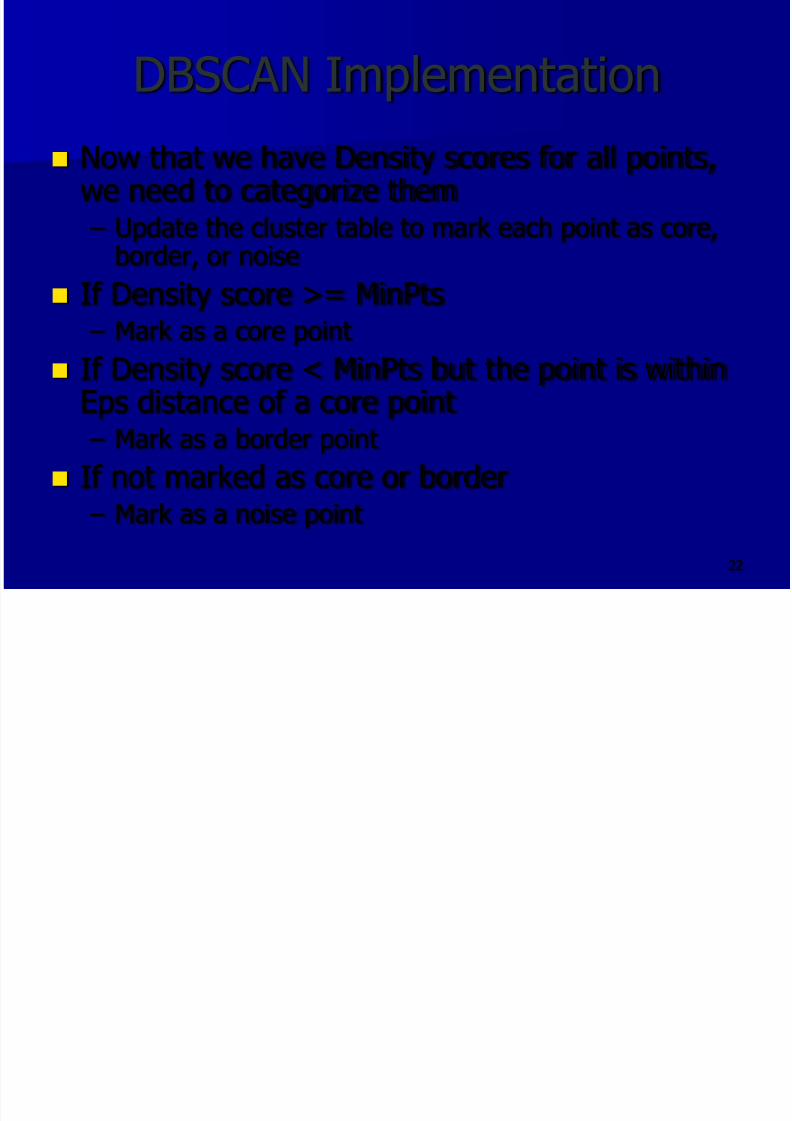
Now that we have Density scores for all points,we need to categorize them – Update the cluster table to mark each point as core,
border, or noise
If Density score >= MinPts – Mark as a core point
If Density score < MinPts but the point is within
Eps distance of a core point – Mark as a border point
If not marked as core or border – Mark as a noise point
7/27/2019 Wyland Crime Data base management system.
http://slidepdf.com/reader/full/wyland-crime-data-base-management-system 23/40
23
DBSCAN Implementation
Now that we have categorized each pointas core, border, or noise we can get ourfirst visual look at the results…
7/27/2019 Wyland Crime Data base management system.
http://slidepdf.com/reader/full/wyland-crime-data-base-management-system 24/40
24
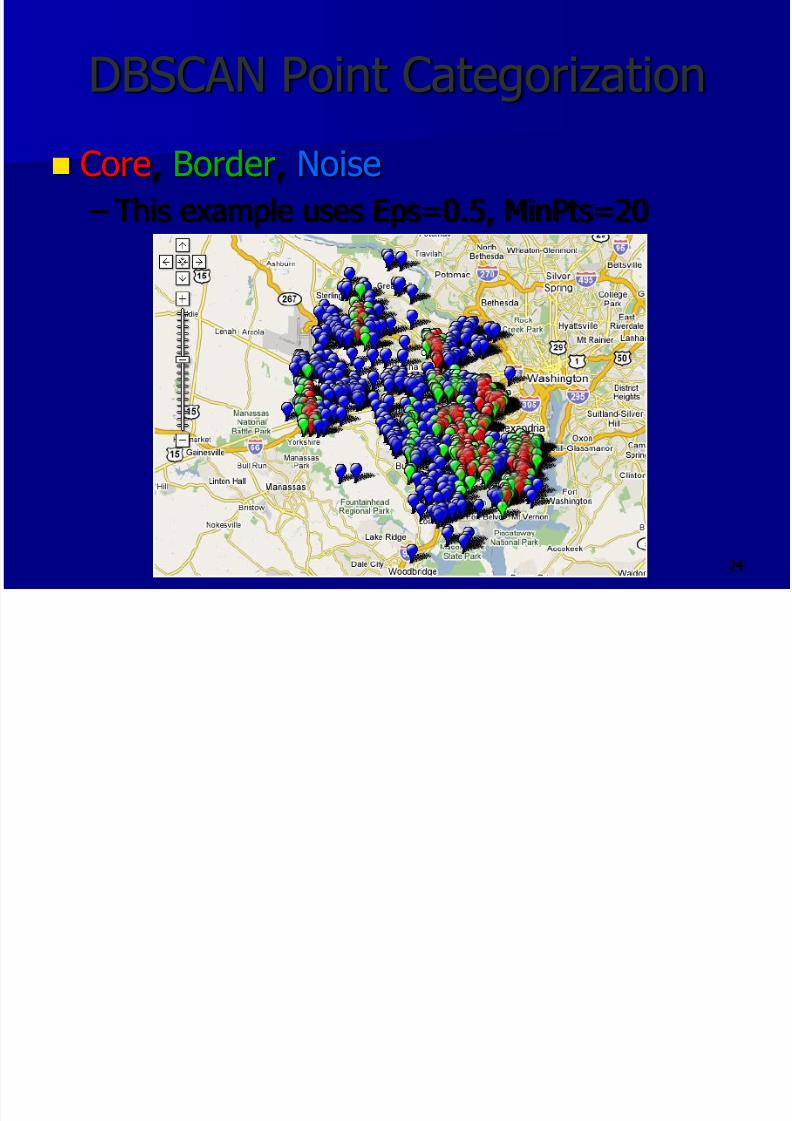
DBSCAN Point Categorization
Core, Border, Noise
– This example uses Eps=0.5, MinPts=20
7/27/2019 Wyland Crime Data base management system.
http://slidepdf.com/reader/full/wyland-crime-data-base-management-system 25/40
25
An Early Insight
This example visually confirms that thereare many noise points, so DBSCAN lookslike a smart choice of clustering algorithm
– DBSCAN is fairly resistant to noise
– Note: level of noise is similar with other Epsand MinPts values
7/27/2019 Wyland Crime Data base management system.
http://slidepdf.com/reader/full/wyland-crime-data-base-management-system 26/40
26
DBSCAN Implementation
Next we need to actually identify and labelthe clusters
But first we eliminate noise points
– Simply delete these from the clusters table
Now let‟s review the labeling algorithm…
7/27/2019 Wyland Crime Data base management system.
http://slidepdf.com/reader/full/wyland-crime-data-base-management-system 27/40
27
DBSCAN Cluster Labeling
7/27/2019 Wyland Crime Data base management system.
http://slidepdf.com/reader/full/wyland-crime-data-base-management-system 28/40
28
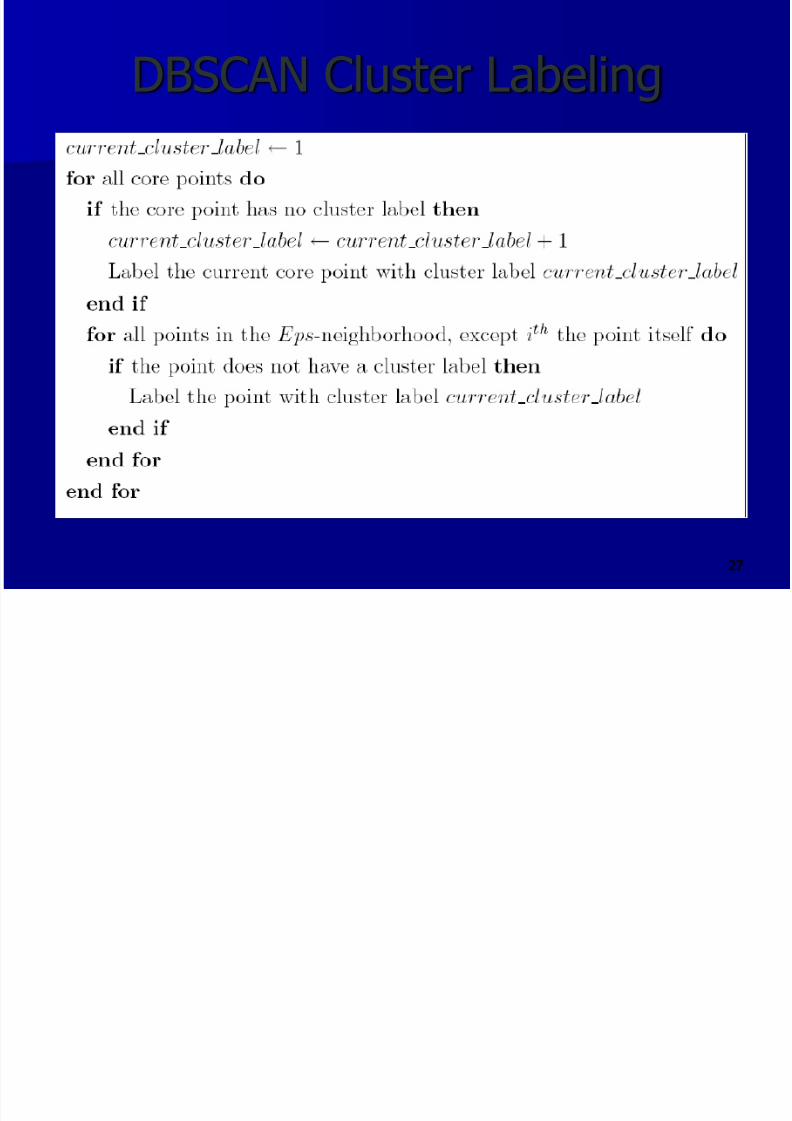
DBSCAN Cluster Labeling
So for each core point…
If the core point is not in a cluster already, labelit as part of a new cluster
Find all of its neighbors within distance Eps, andif they are not in a cluster already, label them aspart of the same cluster too
Then move on to the next unlabeled core point
(start of next cluster) Using sdo_within_distance and loops, these
labels are updated in the clusters table
7/27/2019 Wyland Crime Data base management system.
http://slidepdf.com/reader/full/wyland-crime-data-base-management-system 29/40
29
DBSCAN Implementation
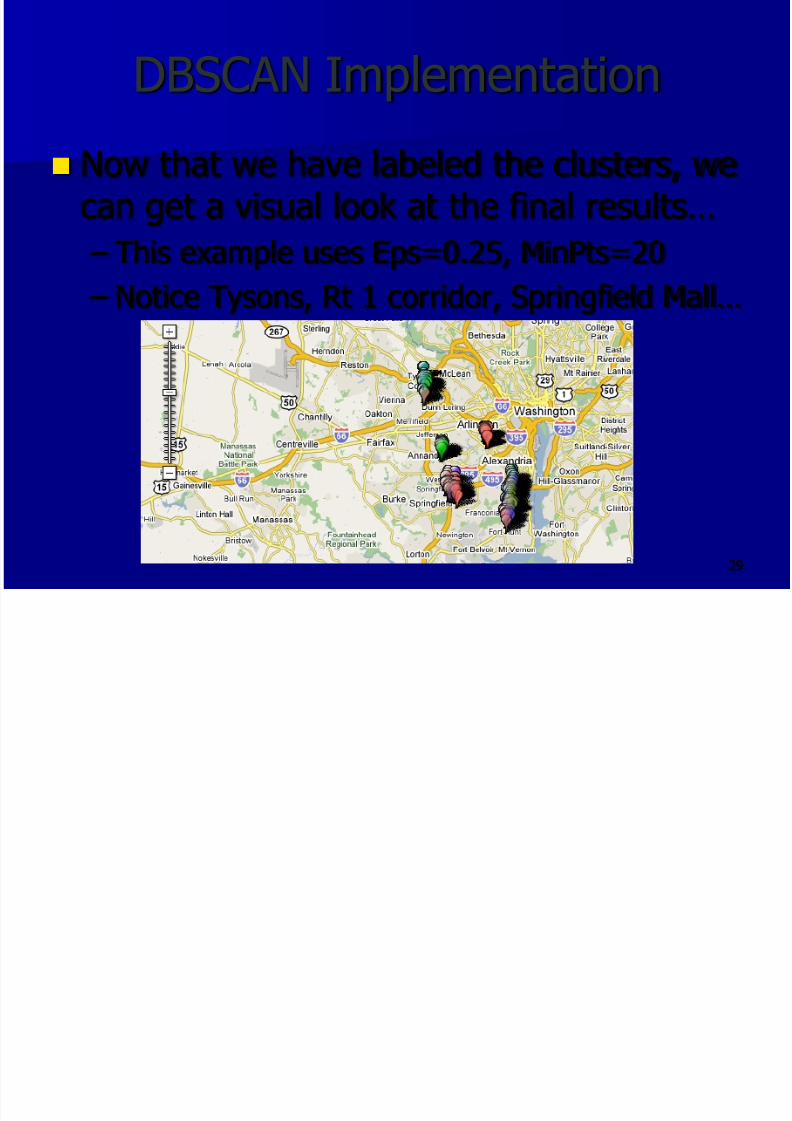
Now that we have labeled the clusters, wecan get a visual look at the final results…
– This example uses Eps=0.25, MinPts=20
– Notice Tysons, Rt 1 corridor, Springfield Mall…
7/27/2019 Wyland Crime Data base management system.
http://slidepdf.com/reader/full/wyland-crime-data-base-management-system 30/40
30
DBSCAN Implementation
Implemented DBSCAN as a storedprocedure to be easily called with varyingEps and MinPts (and time range, crime
types, etc.) – Recalculates all clusters relatively quickly
Let‟s review how we optimize Eps andMinPts…
7/27/2019 Wyland Crime Data base management system.
http://slidepdf.com/reader/full/wyland-crime-data-base-management-system 31/40
31
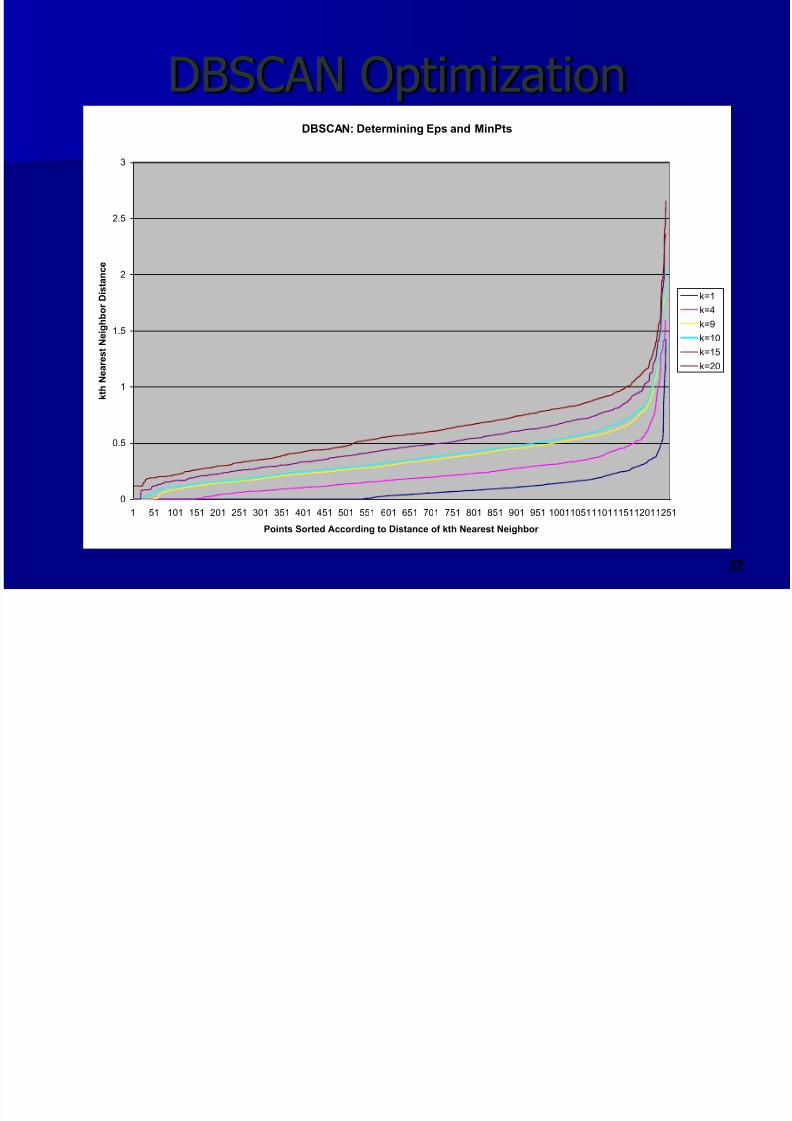
DBSCAN Optimization
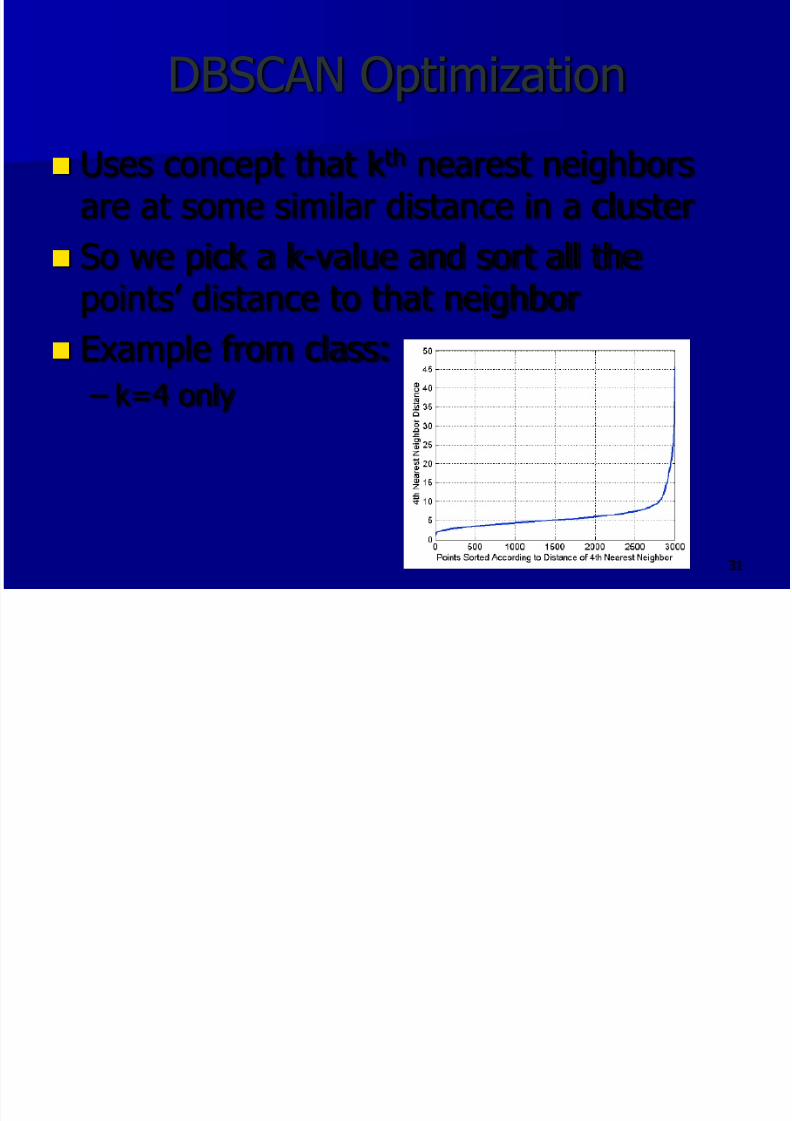
Uses concept that k th nearest neighborsare at some similar distance in a cluster
So we pick a k-value and sort all thepoints‟ distance to that neighbor
Example from class:
– k=4 only
7/27/2019 Wyland Crime Data base management system.
http://slidepdf.com/reader/full/wyland-crime-data-base-management-system 32/40
32
DBSCAN OptimizationDBSCAN: Determining Eps and MinPts
0
0.5
1
1.5
2
2.5
3
1 51 101 151 201 251 301 351 401 451 501 551 601 651 701 751 801 851 901 951 100110511101115112011251
Points Sorted According to Distance of kth Nearest Neighbor
k t h
N e a r e s t N e i g h b o r D i s t a
n c e
k=1
k=4
k=9
k=10
k=15
k=20
7/27/2019 Wyland Crime Data base management system.
http://slidepdf.com/reader/full/wyland-crime-data-base-management-system 33/40
33
DBSCAN Optimization
Not so easy to choose a good point onthat curve…
Original DBSCAN algorithm authorsdiscussed in their paper that we shouldeyeball the plot for the first/last “valley”
7/27/2019 Wyland Crime Data base management system.
http://slidepdf.com/reader/full/wyland-crime-data-base-management-system 34/40
34
DBSCAN Observations
DBSCAN does not work well with varyingdensities… which is also a characteristic of this crime data…
This is observable when we change theorder of the core point cluster labeling
– Ex: Start w/ high vs. low density score cores?
7/27/2019 Wyland Crime Data base management system.
http://slidepdf.com/reader/full/wyland-crime-data-base-management-system 35/40
35
DBSCAN Observations (cont‟d)
The algorithm labels neighbors of thecurrent core point regardless of whetherwe started a new cluster or not…
Initialize the cluster label to zero, not one
Many different “presentations” of theDBSCAN algorithm…
7/27/2019 Wyland Crime Data base management system.
http://slidepdf.com/reader/full/wyland-crime-data-base-management-system 36/40
36
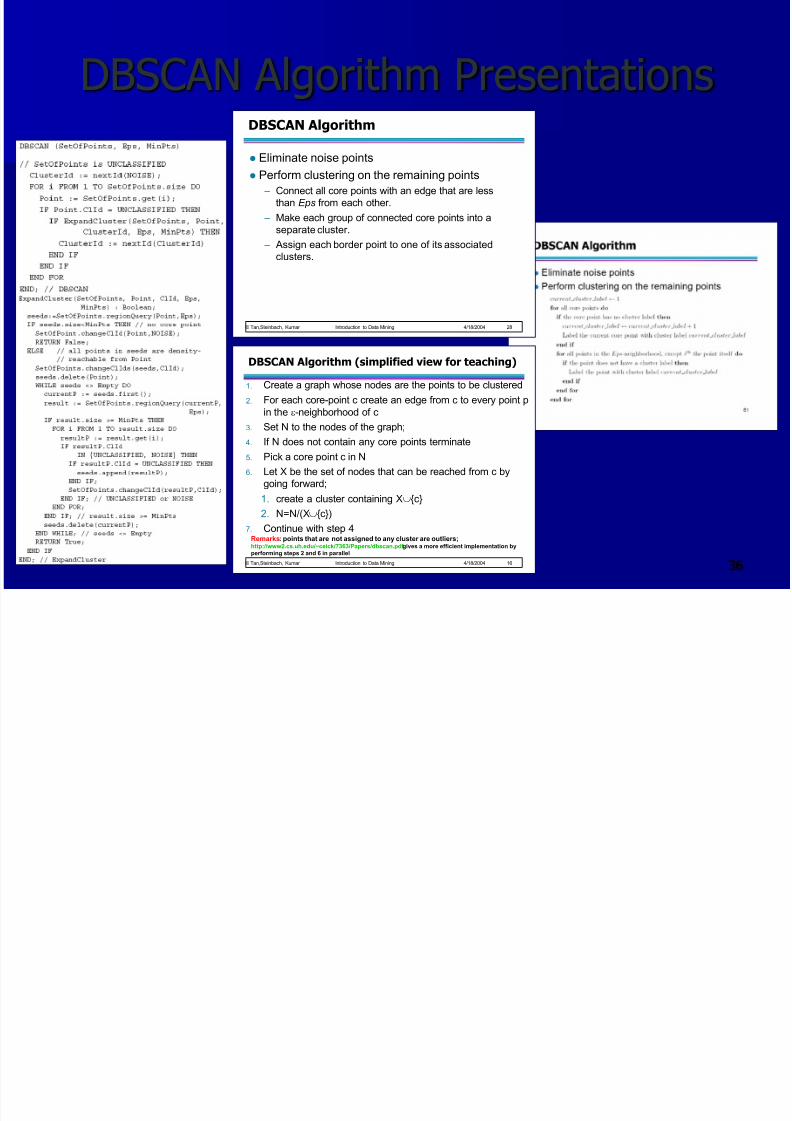
DBSCAN Algorithm Presentations
© Tan,Steinbach, Kumar Introduction to Data Mining 4/18/2004 28
DBSCAN Algorithm
Eliminate noise points
Perform clustering on the remaining points
– Connect all core points with an edge that are less
than Eps from each other.
– Make each group of connected core points into a
separate cluster.
– Assign each border point to one of its associated
clusters.
© Tan,Steinbach, Kumar Introduction to Data Mining 4/18/2004 16
DBSCAN Algorithm (simplified view for teaching)
1. Create a graph whose nodes are the points to be clustered
2. For each core-point c create an edge from c to every point p
in the -neighborhood of c
3. Set N to the nodes of the graph;
4. If N does not contain any core points terminate
5. Pick a core point c in N
6. Let X be the set of nodes that can be reached from c by
going forward;
1. create a cluster containing X{c}
2. N=N/(X{c})
7. Continue with step 4Remarks: points that are not assigned to any cluster are outliers;http://www2.cs.uh.edu/~ceick/7363/Papers/dbscan.pdf gives a more efficient implementation by
performing steps 2 and 6 in parallel
7/27/2019 Wyland Crime Data base management system.
http://slidepdf.com/reader/full/wyland-crime-data-base-management-system 37/40
37
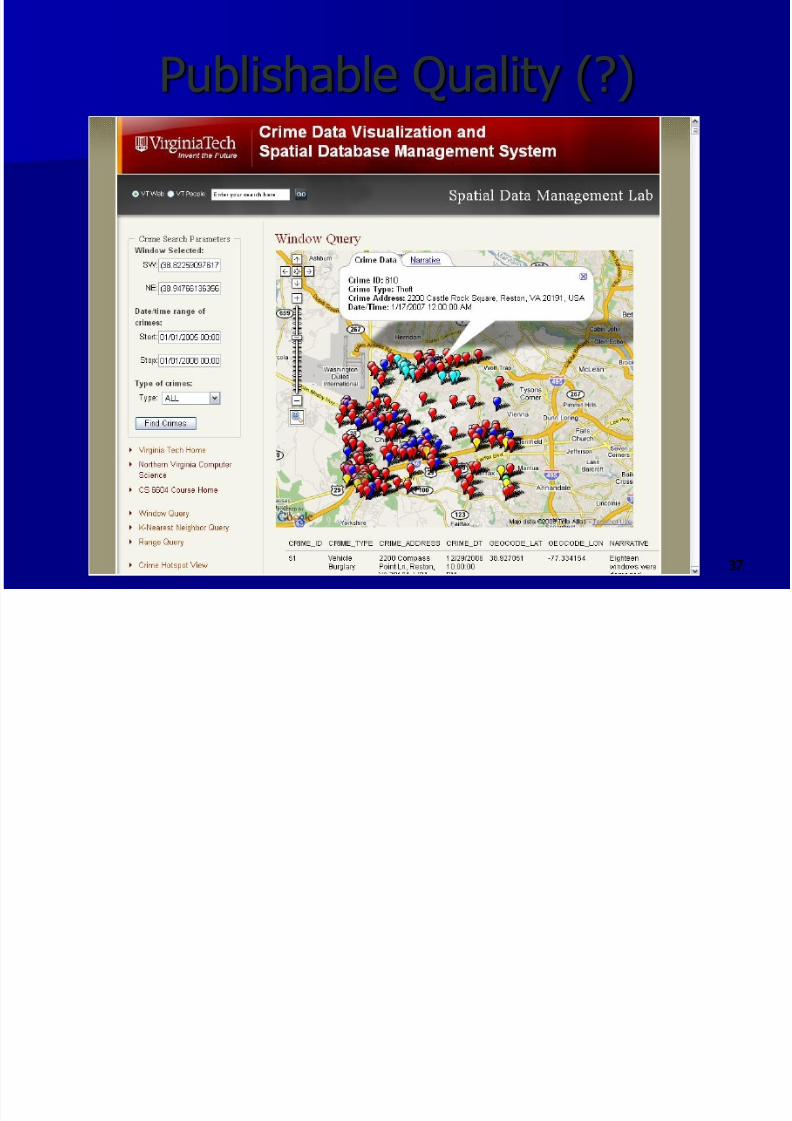
Publishable Quality (?)
7/27/2019 Wyland Crime Data base management system.
http://slidepdf.com/reader/full/wyland-crime-data-base-management-system 38/40
38
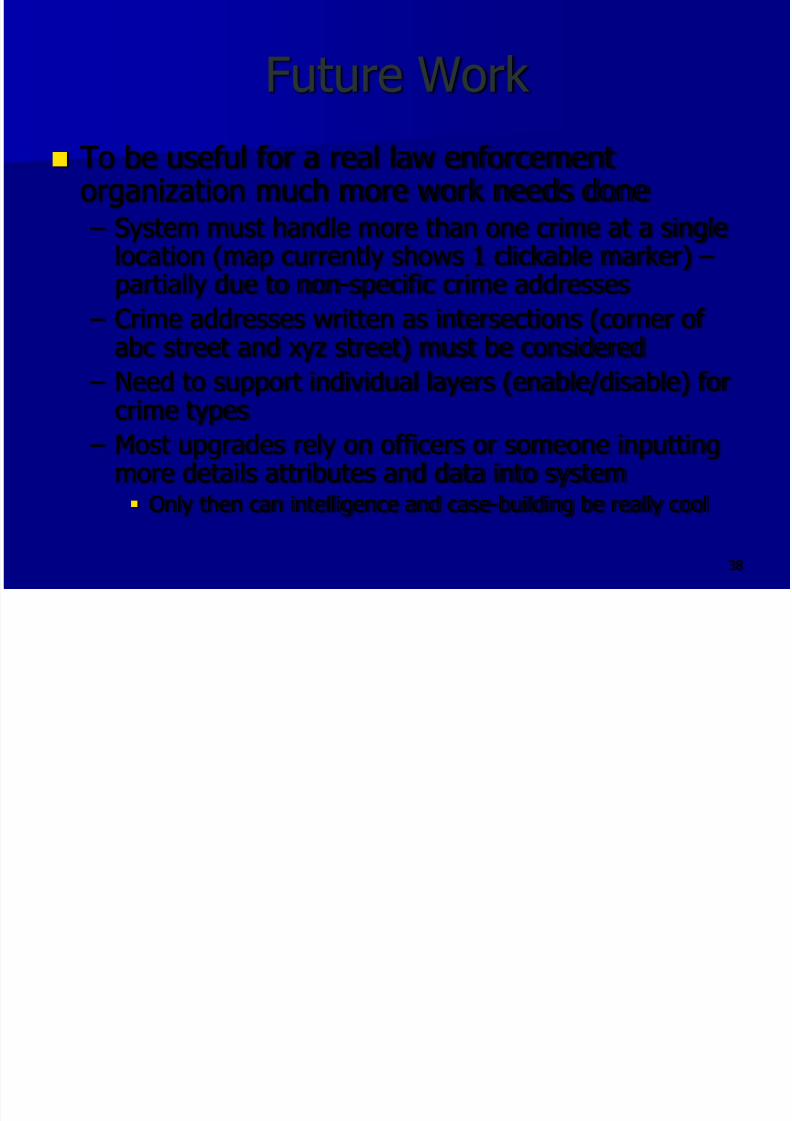
Future Work
To be useful for a real law enforcementorganization much more work needs done – System must handle more than one crime at a single
location (map currently shows 1 clickable marker) –
partially due to non-specific crime addresses – Crime addresses written as intersections (corner of
abc street and xyz street) must be considered
– Need to support individual layers (enable/disable) for
crime types – Most upgrades rely on officers or someone inputting
more details attributes and data into system Only then can intelligence and case-building be really cool
7/27/2019 Wyland Crime Data base management system.
http://slidepdf.com/reader/full/wyland-crime-data-base-management-system 39/40
39
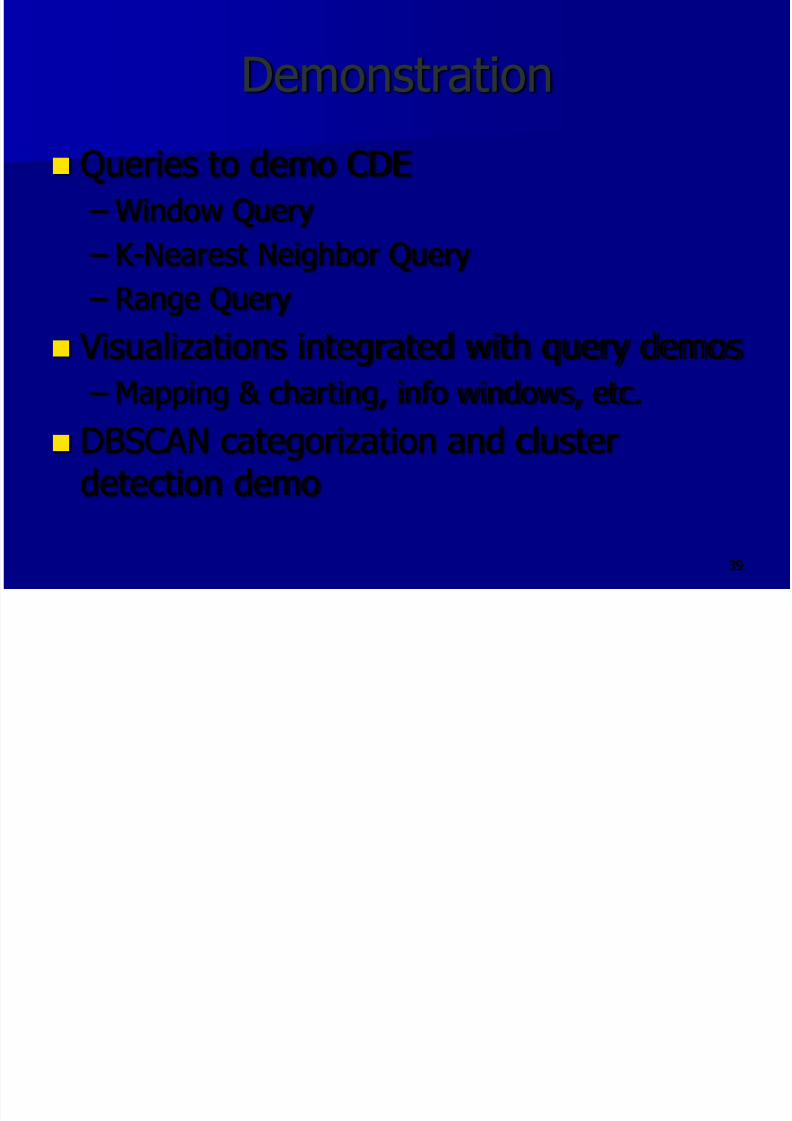
Demonstration
Queries to demo CDE
– Window Query
– K-Nearest Neighbor Query
– Range Query
Visualizations integrated with query demos
– Mapping & charting, info windows, etc.
DBSCAN categorization and clusterdetection demo

7/27/2019 Wyland Crime Data base management system.
http://slidepdf.com/reader/full/wyland-crime-data-base-management-system 40/40
0
Questions?