
Www.tpos2020.org 1 July, 2015 This slide set is provided as a general set of PowerPoint slides, with...
35
www.tpos2020.org 1 July, 2015 This slide set is provided as a general set of PowerPoint slides, with basic TPOS 2020 information, including impetus, project structure, guiding scientific questions and general project management overview. This is a resource for you to present standard information, but is not likely to be in the order in which you would like to present. Please modify, rearrange, and enhance for your own presentation needs. If there are specific areas of information that you think should be added or addressed, please email [email protected].
-
Upload
brianne-jasmin-stanley -
Category
Documents
-
view
213 -
download
0
Transcript of Www.tpos2020.org 1 July, 2015 This slide set is provided as a general set of PowerPoint slides, with...

1www.tpos2020.org
July, 2015
This slide set is provided as a general set of PowerPoint slides, with basic TPOS 2020 information, including impetus, project structure, guiding scientific questions and general project management overview.
This is a resource for you to present standard information, but is not likely to be in the order in which you would like to present. Please modify, rearrange, and enhance for your own presentation needs.
If there are specific areas of information that you think should be added or addressed, please email [email protected].

2www.tpos2020.org
The Tropical Pacific Observing System (TPOS) 2020 Project
* Billy Kessler (Co-Chair)(NOAA/PMEL, USA)* Neville Smith (Co-Chair)(retired, BOM, Australia)
* Ken Ando (JAMSTEC, Japan)* Dake Chen (SIO, China)* Sophie Cravatte (IRD, France)* Tom Farrar (WHOI, USA)* Harry Hendon (BOM, Australia)* Dong-Chull Jeon (KIOST, Korea)* Arun Kumar (NCEP, USA)
* Bill Large (NCAR, USA)* Yukio Masumoto (U. Tokyo, Japan)* Dean Roemmich (Scripps, USA)* Pete Strutton (U. Tasmania, Australia)* Ken Takahashi (IGP, Peru)* Weidong Yu (FIO, China)
Steering Committee Members

3www.tpos2020.org
ENSO Drove the Original Observing System
- El Niño of 1982-83 – and the failure to recognize it until very late – was the impetus for the TOGA observing system.
- Original TAO designed to detect equatorial waves, then the key issue for diagnosis and prediction.
- TOGA observations led to an explosion of ideas in the 80s-90s that established our understanding of ENSO as an intrinsically coupled oscillation.
- Now, those issues are well understood, and we face a different set of problems.

4www.tpos2020.org
ENSO Diversity Presents New Challenges• Today’s observing and forecast systems must adapt to
today’s issues• The lessons of the past 3 decades is ENSO diversity• The potential for future surprises is high
• Our foremost goal remains to improve the ENSO forecasts, and thus increase seasonal prediction skill

5www.tpos2020.org
The Tropical Pacific Observing Systemgrew to include many platforms, and was a template for other basins
TOGA

www.tpos2020.org
The TAO/TRITON System is Vulnerable
Number of buoys reporting data
TPOS 2020 is taking the opening created by the crisis of the TAO/TRITON array as an opportunity to rethink and reframe a better,
more robust TPOS.
6
TRITON stations marked by an ‘X’ have already been removed.
7www.tpos2020.org
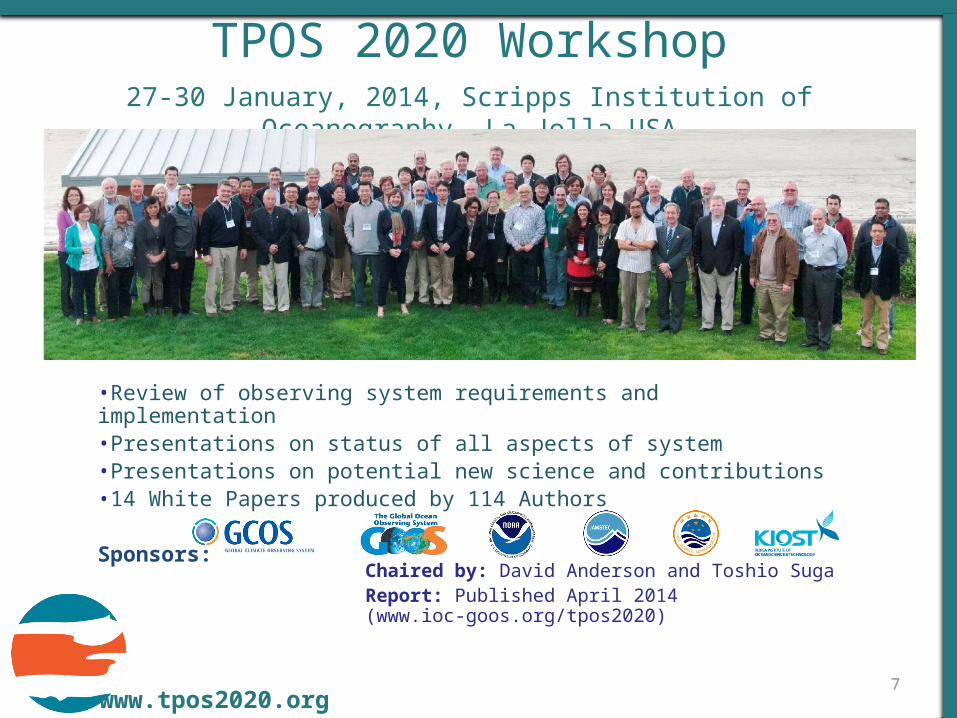
TPOS 2020 Workshop
27-30 January, 2014, Scripps Institution of Oceanography, La Jolla USA
Chaired by: David Anderson and Toshio SugaReport: Published April 2014 (www.ioc-goos.org/tpos2020)
•Review of observing system requirements and implementation•Presentations on status of all aspects of system•Presentations on potential new science and contributions•14 White Papers produced by 114 Authors
Sponsors:

8www.tpos2020.org
The Workshop appointed a Steering Committee
First meeting: 6-9 October 2014, hosted by KIOST in Seoul, Korea Results:
Task Teams and Working Groups appointed, defined:
- Backbone Observing System
- Modeling and Data Assimilation
- Biogeochemistry
- Planetary Boundary Layers
- Eastern Tropical Pacific
- Working Group on the western tropical
Pacific
- Subgroup for Time-Series climate record
The SC at KIOST during the first SC meeting in October, 2014.
SC is composed of 15 members from 6 nations

9www.tpos2020.org
TPOS 2020 Governance and Project Structure

10www.tpos2020.org
Still in the formational process, RF Co-chair remains to be identified
Composed of Steering Committee Co-Chairs, Resource Forum Co-Chairs, and the International
Coordinator
TPOS Executive

11www.tpos2020.org
Backbone Task TeamCo-chaired by Sophie Cravatte (Centre IRD de Noumea)
and Susan Wjiffels (CSIRO)
Project Function:Through an integrated approach the Backbone TPOS will achieve its objectives through a combination of in situ and
remote sensing approaches, augmented as appropriate with advice from models and data assimilation. Sampling
for the Backbone has as its goal to:
(a) Observe and quantify the state of the ocean, on time scales from weekly to interannual/decadal;
(b) Provide data in support of, and to validate and improve, forecasting systems;
(c) Support calibration and validation of satellite measurements;
(d) Advance understanding of the climate system in the tropical Pacific, including through the provision of observing
system infrastructure for process studies; and
(e) Maintenance and, as appropriate, extension of the tropical Pacific climate record.
Plan is due July 2016 based on recommendations from the other Task Teams
Point of Contact:
Associate Project Manager, Ana Lara-Lopez-> [email protected]

12www.tpos2020.org
Planetary Boundary Layer Task TeamCo-chaired by Tom Farrar (WHOI) and Meghan Cronin(NOAA/PMEL)
Project Function:The Planetary Boundary Layer Task Team will tackle their objectives through ocean surface and near-surface
process studies. The role of this task team is to identify which observing system requirements are best met via
a sustained observing effort (>5 years) and which can be addressed with specific short-term process
campaigns.
(a) Formulate strategy and sampling requirements to estimate air-sea fluxes over short (hourly) time scales
across key ocean and climate regimes
(b) Develop recommendations about needed boundary layer measurements including spatial and temporal
sampling requirements, particularly to resolve the diurnal cycle
(c) Consider a subset of regimes where direct eddy-correlation approaches might be used (d) Liaise with
existing and developing ocean satellite and modelling community on efficiently meeting their present and future
requirements for ocean surface data
(e) Engage biogeochemical and ecosystem experts to ensure the needs of key gas exchange calculations are
met.
Point of Contact:
Associate Project Manager, Lucia Upchurch -> [email protected]

13www.tpos2020.org
Biogeochemistry Task TeamCo-chaired by Pete Strutton (Univ. of Tasmania)
and Adrienne Sutton (NOAA/PMEL)
Project Function:The Biogeochemistry task team will evaluate and recommend the most promising foci for observation.
The team will begin with carbon biogeochemistry as its core scientific concern. The team will consider
primary productivity but not higher trophic levels.
(a) Develop strategies and design plans for the biogeochemical contributions
(b) Provide guidance to the Backbone TT for biogeochemical requirements needed in the redesigned
TPOS
(c) Determine the temporal and spatial scales required for the observing system
(d) Provide a prioritized list of variables that will be measured as part of the BGC observing network
(e) Guide the implementation of BGC observations and evaluate new technologies and required
process studies
Point of Contact:
Associate Project Manager, Ana Lara-Lopez -> [email protected]

14www.tpos2020.org
Eastern Pacific Task TeamCo-chaired by Ken Takahashi (Instituto Geofisico del Perú) and Billy Kessler (interim co-chair)(NOAA/PMEL)
Project Function:The Eastern Pacific Task Team will define observations necessary to the backbone observing system, as well as facilitate capacity building for
improved sustained observing capability and facilitate the development of a regional research project that guides the sustained observing system.
(a) Determine the observational requirements, including time and space scales that should be resolved.
(b) Develop observational strategies and design plans for the region.
(c) Provide guidance as required to the Backbone Observing System Task Team and, as required, other Task Teams on strategies and plans
for the region.
(d) Foster interaction and collaboration between the TPOS and other international programs that have an observational focus in the tropical
eastern Pacific boundary region.
(e) Provide guidance on implementation and explore potential opportunities to collaborate with regional institutions for the implementation and
maintenance of TPOS and its national components, and to evolve process-oriented boundary measurements towards a sustained system.
Point of Contact:
Associate Project Manager, not yet identified, email

15www.tpos2020.org
Modelling and Data Assimilation Task TeamCo-chaired by Arun Kumar (NOAA/NCEP)
Project Function:The Modelling and Data Assimilation task team will evaluate the bias and errors in current
models to develop a strategy to assimilate key observations to improve models and forecast
capabilities.
(a) Evaluate key observations needed, time-scale and spatial coverage needed
Opportunities identified:
(a) A workshop on systematic errors in tropical models and prediction systems
(b) OSE workshop for improved understanding of sensitivity
Point of Contact:
Associate Project Manager, Hannah Dean-> [email protected]

16www.tpos2020.org
Sub-Projects and Working GroupsSub-Project:
Western Boundary Region
Writing team to develop regional project plan (drawing on national/regional activities/plans). Potential future task
team.
Working Group:
Time-Series Contributions to the Climate Record in TPOS
In TPOS 2020, we are considering fixed-point measurements that are contributions within an integrated system,
including the tropical moored buoy array system.
There will be a criteria test at 110W, the group will interact with OOPC/OceanSITE, and will work to identify
highest ranking sites and further locations.
Point of Contact:

17www.tpos2020.org
TPOS 2020 Goals
• To redesign and refine the T.P.O.S. to observe ENSO and advance understanding of its causes,
• To determine the most efficient and effective observational solutions to support prediction systems for ocean, weather and climate services,
• To advance understanding of the tropical Pacific physical and biogeochemical variability and predictability.
TPOS 2020 will provide evidence-based, vetted advice pointing to an intelligent evolution of the observing system.

18www.tpos2020.org
Guiding Principles
• Do not repeat the mistake of changing observing systems without adequate overlap and evaluation.
• Advance by observing the mechanisms connecting the equatorial thermocline and the free atmosphere. Challenge and guid model improvement.
• Foster a diverse-platform observing system to adequately sample ENSO’s rich multi-scale variability. Integrate tools that did not exist when TAO was designed: Satellites, Argo, new autonomous samplers…
• Beyond its monitoring capability, TPOS should serve as the backbone for essential ancillary and process studies (allowing others to propose and participate).

19www.tpos2020.org
Follow the Project
• Email: [email protected]
• Website: www.tpos2020.org
• Twitter: @tpos2020
• Monthly Status Report: Mail list and Website Accessible

20www.tpos2020.org
Additional Science Slides

21www.tpos2020.org
Niño 3.4 SST
Quasi-regular oscillations of the 1960s-70s
El Niño dominance and 2 very strong events of the 1980s-90s
“Central Pacific” or “Modoki” El Niños (and large mean changes)
TPOS Robustness has a physical component: Diversity of ENSO
The overall story is surprises. Expect more …
Lessons:1. Do not focus only on thechallenges of today; tomorrow’s will be different.
Focus on observing thephysical processes that drivethe tropical climate.
Integrate this understanding into models.
2. Build a robust TPOS.Multiple missions, multiple platforms, multiple sources of support. (ENSO is multi-scale)
3. Maintain and build long time series to detect and describe surprises, and climate trends.

22www.tpos2020.org
It’s not just El Niño
The atmosphere is sensitive to changes in tropical heating, creating many kinds of tropical disturbances that radiate to North America.
One example is the Madden-Julian Oscillation, which powers heavy rain events on the west coast (“Pineapple Express”).
Radiating phenomena like this are common to all the tropical oceans.
Typical winter tropical Pacific anomalies preceding heavy West Coast precipitation events
→ 7-10 days before event
→ 3-5 days before event
→ Precipitation event

23www.tpos2020.org
The Bjerknes feedback: Fundamental Coupling

24www.tpos2020.org
How does the thermocline communicate with the atmosphere?

25www.tpos2020.org
Boundary regions (western and eastern) will require specific attention: Examples of issues in the Eastern Pacific (1/2)
Additionally, substantial data exists from western South America but is not available in a timely fashion (in contrast to TAO/TRITON, Argo, etc.).
It is highly desirable to operationally include these observations into TPOS.
Moorings in the Eastern Pacific are important for monitoring and
provide continuous climate records in the most dynamic
region in the Pacific and are of particular interest to western
South America, but are the most vulnerable to vandalism.
2010-2011
2012-2013
TAO/TRITON: % of daily 100 m temperature

26www.tpos2020.org
SST (°C) bias in CFSv2 January forecasts initiated in September (1999-2009)
Kumar et al 2012
Niño 1+2 SSTA (°C): Observed (red) and NOAA CFS2 6.5-lead forecast (black)
ObservedEnsemble mean
2×ensemble std. dev.
• Predictive skill beyond 3 months continues to be low in the Eastern Pacific.
• Model biases are likely a dominant factor, but need data and process understanding to improve them.
Boundary regions (western and eastern) will require specific attention: Examples of issues in the Eastern Pacific (2/2)
Obs
East Pacific rainfall* in the CMIP5 models
* 120E-80W, normalized by tropical means
Li and Xie 2014
Long-standing and generalized biases in the eastern Pacific are the warm SST bias and the double ITCZ syndrome.

27www.tpos2020.org
The need for multiple platformsArgo can be used to detect Kelvin waves and their impact on ocean temperature at the Peruvian coast – particularly valuable as the TAO array has been subject to high levels of vandalism in critical regions.
(figure from K. Takahashi)

28www.tpos2020.org
Models remain a weakness of ENSO predictionTPOS 2020 will not itself build models, but much of the impact of TPOS data is through models:
Analyses and reanalyses that synthesize diverse data sources, in situ and satellite.
Bad (biased) models can degrade TPOS data products.
One example where models need observational guidance:The diurnal cycle is surprisingly important for the transmission of surface fluxes to the subsurface ocean.Heat and momentum are communicated downwards via mixing produced by afternoon heating/stratification.Models without these processes have cooler SST and weaker thermoclines (persistent biases).
TPOS 2020 will support limited-term process studies to support model development
Nighttimeconvection
29www.tpos2020.org
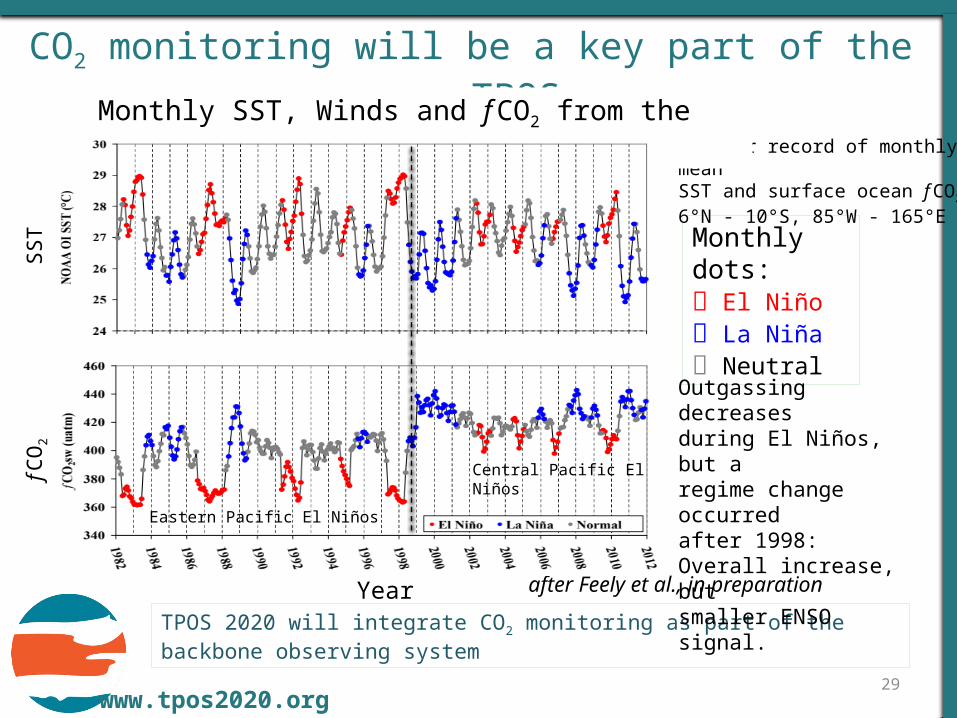
after Feely et al., in preparation
30-year record of monthly mean SST and surface ocean f CO2 6°N - 10°S, 85°W - 165°E
CO2 monitoring will be a key part of the new TPOS
TPOS 2020 will integrate CO2 monitoring as part of the backbone observing system
Monthly SST, Winds and f CO2 from the Equatorial Pacific
Monthly dots: El Niño La Niña Neutral
Year
Central Pacific El Niños
SST
f CO
2
Eastern Pacific El Niños
Outgassing decreasesduring El Niños, but aregime change occurredafter 1998:Overall increase, butsmaller ENSO signal.
30www.tpos2020.org
How can we best use evidence-based system design, and how can we measure our success?
OSEs: “Many lives of an observation”– Calibration of Satellite retrievals– Model development, tuning, initialization, verification– Trend detection– Underpin evolving climatologies– Process diagnosis
A typical OSE that tests only the initialization step is not a full evaluation, and the results depend on the particular model and its biases.
How can TPOS use OSEs to assess array configurations?
Data-based objective techniques to integrate global high-horizontal-resolution satellite data (SST, SSH) with sparse in situ profiles?
“Armor3D”: Satellites provide mesoscale, in situ tunes for vertical structure and large-scale.
31www.tpos2020.org
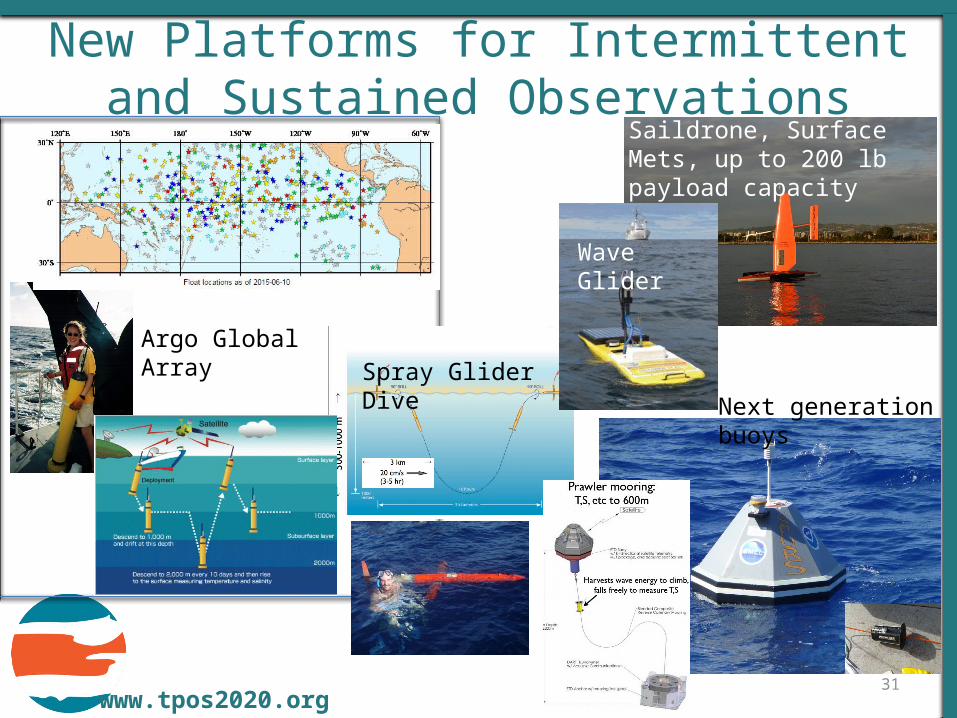
New Platforms for Intermittent and Sustained Observations
Spray Glider Dive
Saildrone, Surface Mets, up to 200 lb payload capacity
Argo Global Array
Wave Glider
Next generation buoys

32www.tpos2020.org
Additional Project Mgmt Slides

33www.tpos2020.org
Project Management “Lite”
• “Lite” Project Management• Enough documentation to properly manage, but not too much• Highlight:
• Objectives and breakdown of work• Schedules and deliverable• Cross-dependencies and risks
• Distributed project management support• Washington, D.C. (USA)• Seattle, Washington (USA)• Hobart, Tasmania (Australia)

34www.tpos2020.org
Distributed Project OfficeProject Execution
• Scope Management • Resource Management
Project Management• Schedule Management• Change Control Management• Risk and Opportunity Management • Effort and resource Tracking• Engagement Action Plan Management• Communication Management
• Work Breakdown Structure (WBS)• Integrated Master Schedule (IMS)• Monthly Status Report (MSR)• Annual Work Plan (AWP)

35www.tpos2020.org
Project Workflow
This workflow will be modified in project year 2: Oct. 2015-Sept. 2016

![CM [004] Buridan's Impetus](https://static.fdocuments.net/doc/165x107/58d08cd71a28ab012d8b68d7/cm-004-buridans-impetus.jpg)


![CM [003] Philoponus' Impetus](https://static.fdocuments.net/doc/165x107/5889235e1a28ab77528b5a67/cm-003-philoponus-impetus.jpg)


