Www.iss.k12.nc.us Measurement, Analysis, and Knowledge Management Dr. Terry Holliday -...
20
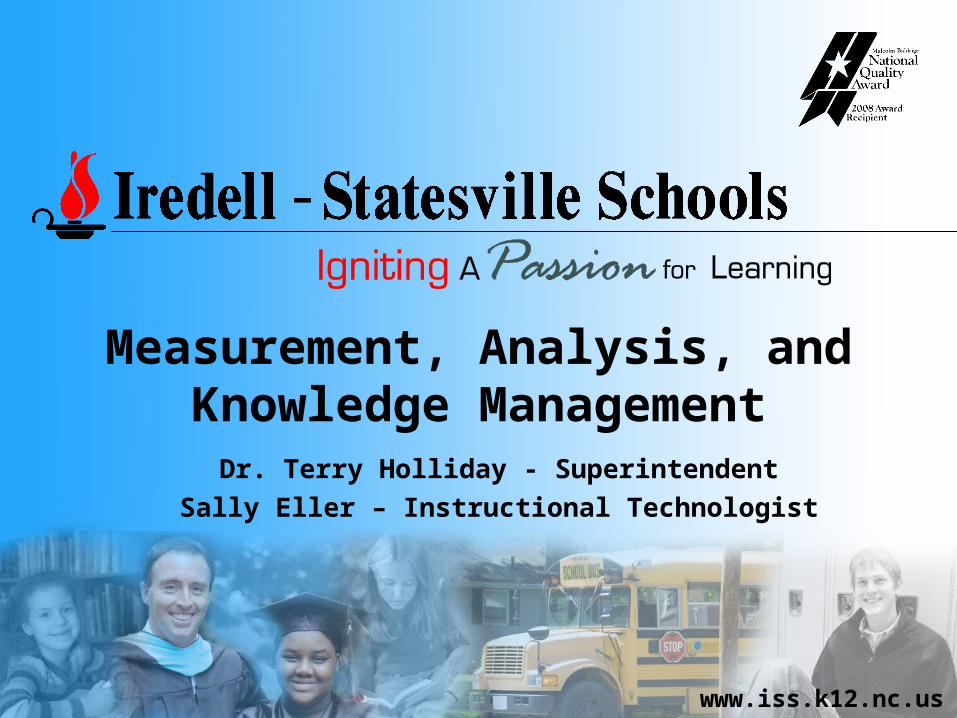
www.iss.k12.nc.us Measurement, Analysis, and Knowledge Management Dr. Terry Holliday - Superintendent Sally Eller – Instructional Technologist
Transcript of Www.iss.k12.nc.us Measurement, Analysis, and Knowledge Management Dr. Terry Holliday -...
www.iss.k12.nc.us
Measurement, Analysis, and Knowledge Management
Dr. Terry Holliday - SuperintendentSally Eller – Instructional Technologist
www.iss.k12.nc.us
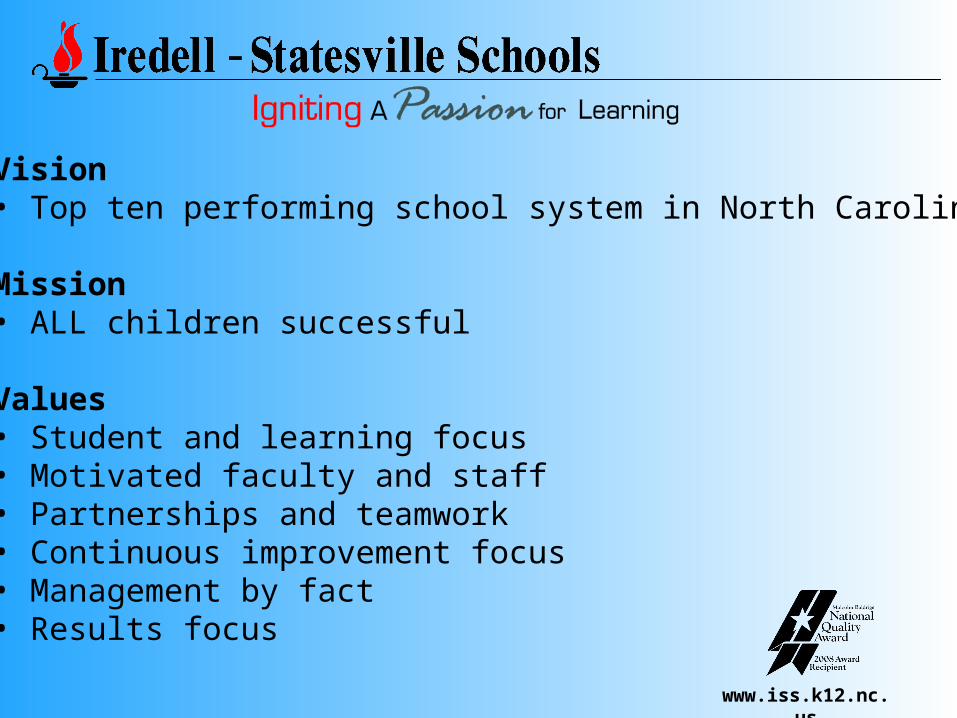
Vision• Top ten performing school system in North Carolina
Mission• ALL children successful
Values• Student and learning focus• Motivated faculty and staff• Partnerships and teamwork• Continuous improvement focus• Management by fact• Results focus
www.iss.k12.nc.us
05
1015202530354045505560
01-02 02-03 03-04 04-05 05-06 06-07 07-08
Aca
dem
ic R
ankin
g
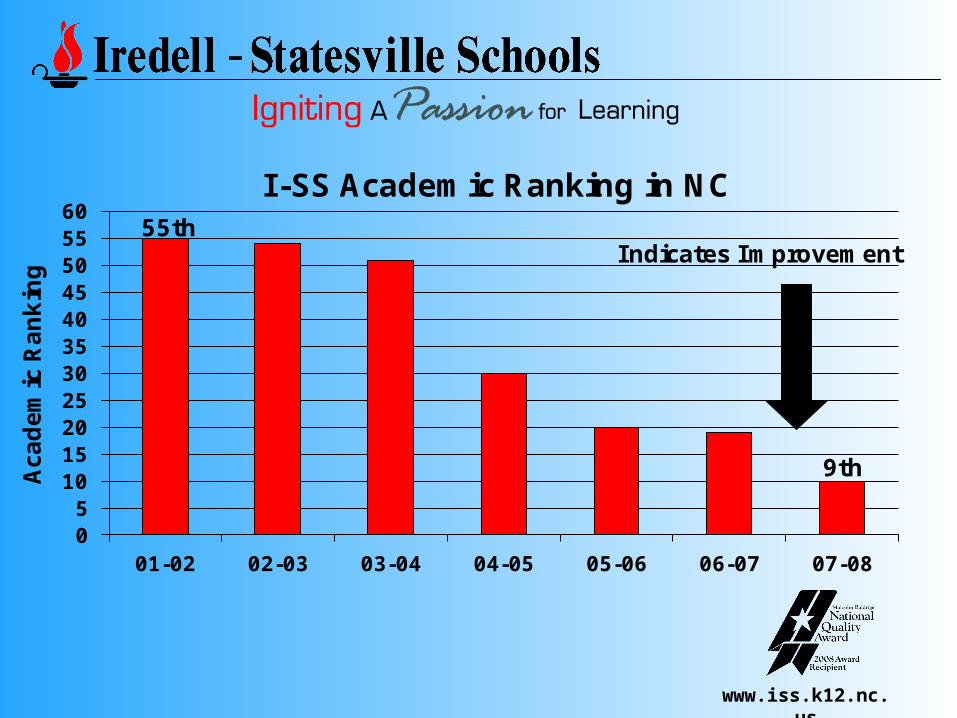
I-SS Academic Ranking in NC
Indicates Improvement
9th
55th
www.iss.k12.nc.us
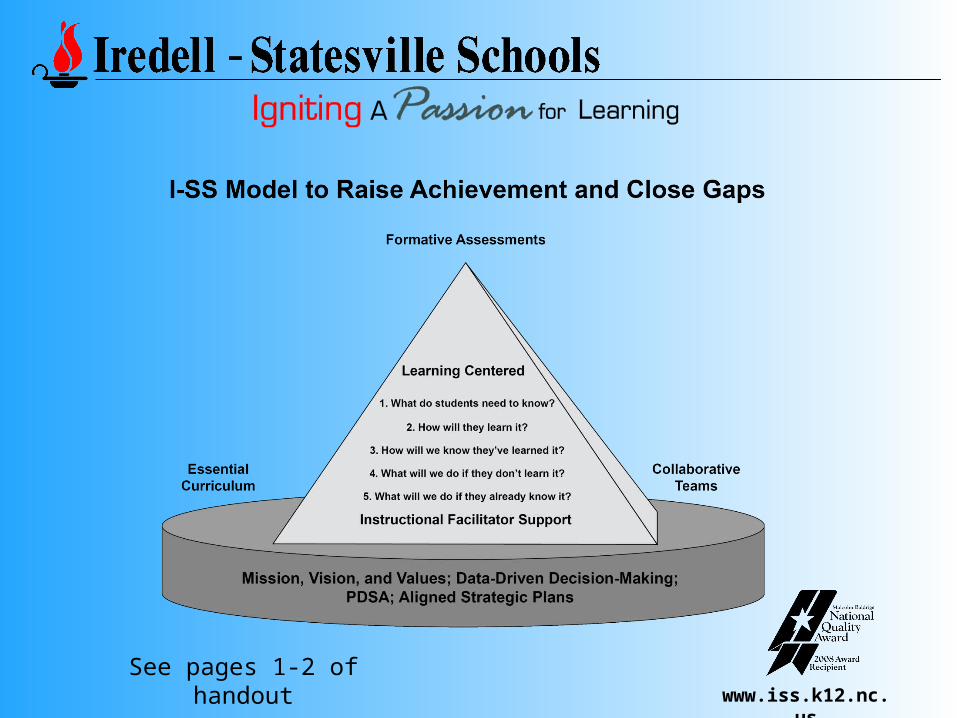
See pages 1-2 of handout
www.iss.k12.nc.us
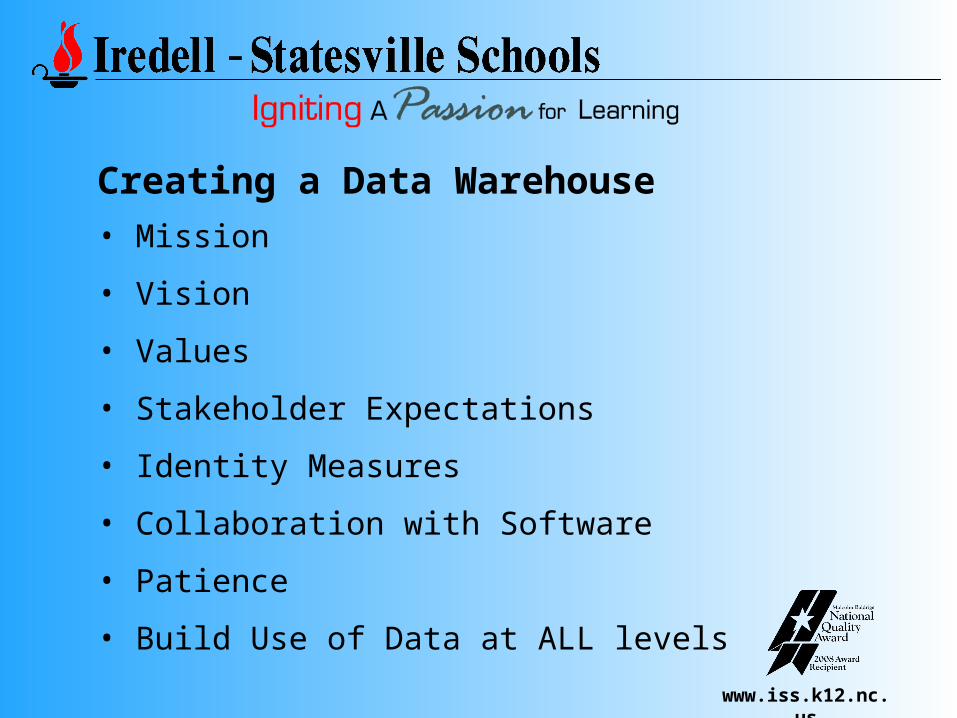
Creating a Data Warehouse• Mission
• Vision
• Values
• Stakeholder Expectations
• Identity Measures
• Collaboration with Software
• Patience
• Build Use of Data at ALL levels
www.iss.k12.nc.us
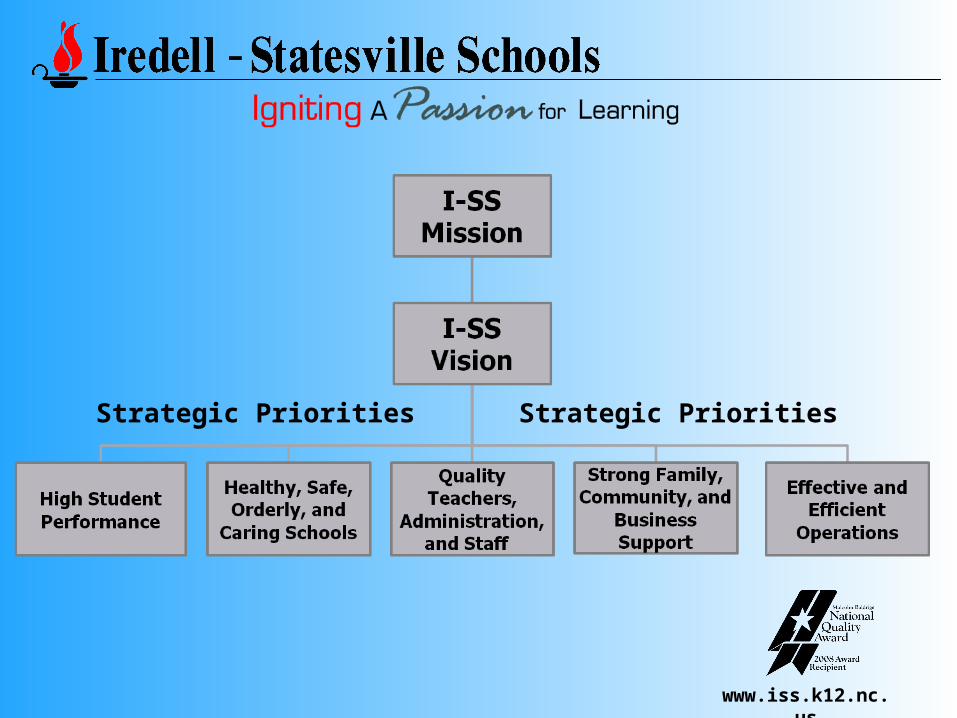
Strategic Priorities Strategic Priorities
www.iss.k12.nc.us
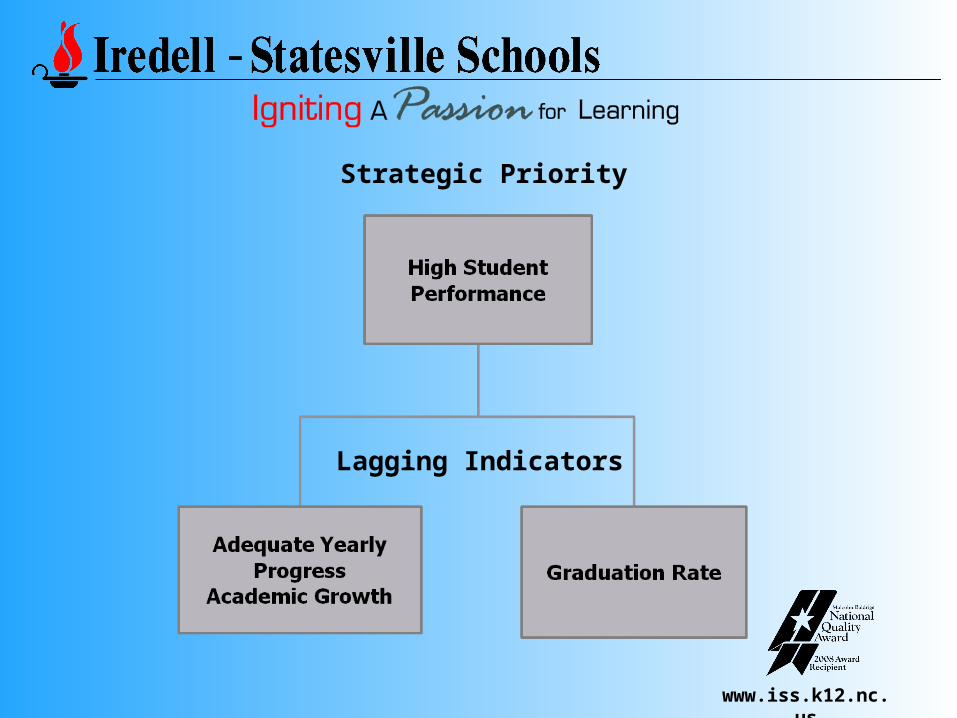
Strategic Priority
Lagging Indicators
www.iss.k12.nc.us
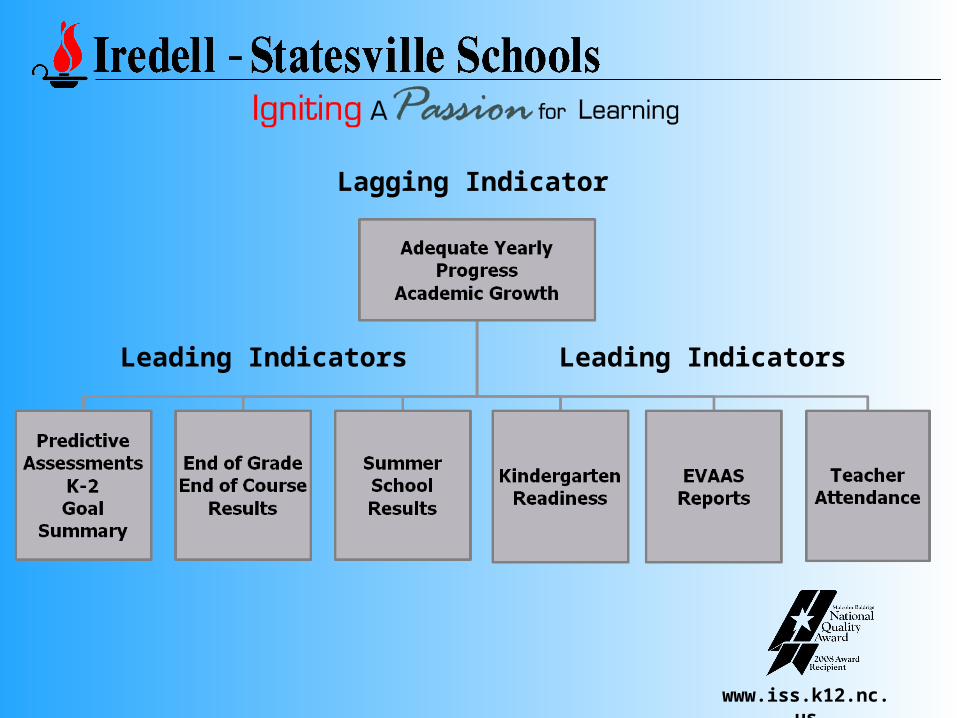
Lagging Indicator
Leading IndicatorsLeading Indicators
www.iss.k12.nc.us
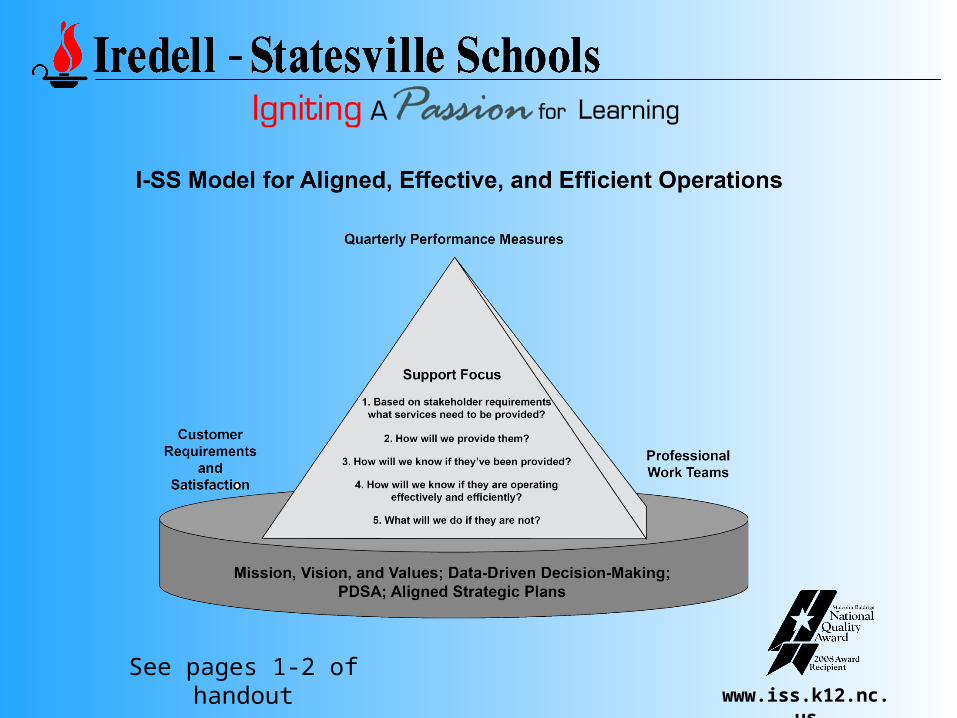
See pages 1-2 of handout
www.iss.k12.nc.us
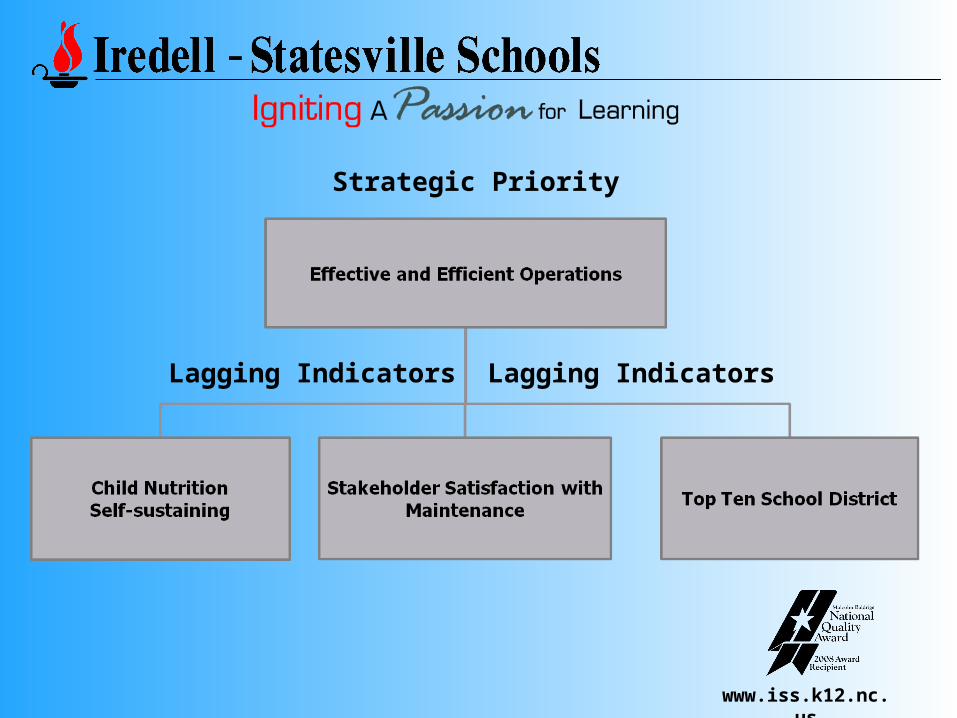
Strategic Priority
Lagging Indicators Lagging Indicators
www.iss.k12.nc.us
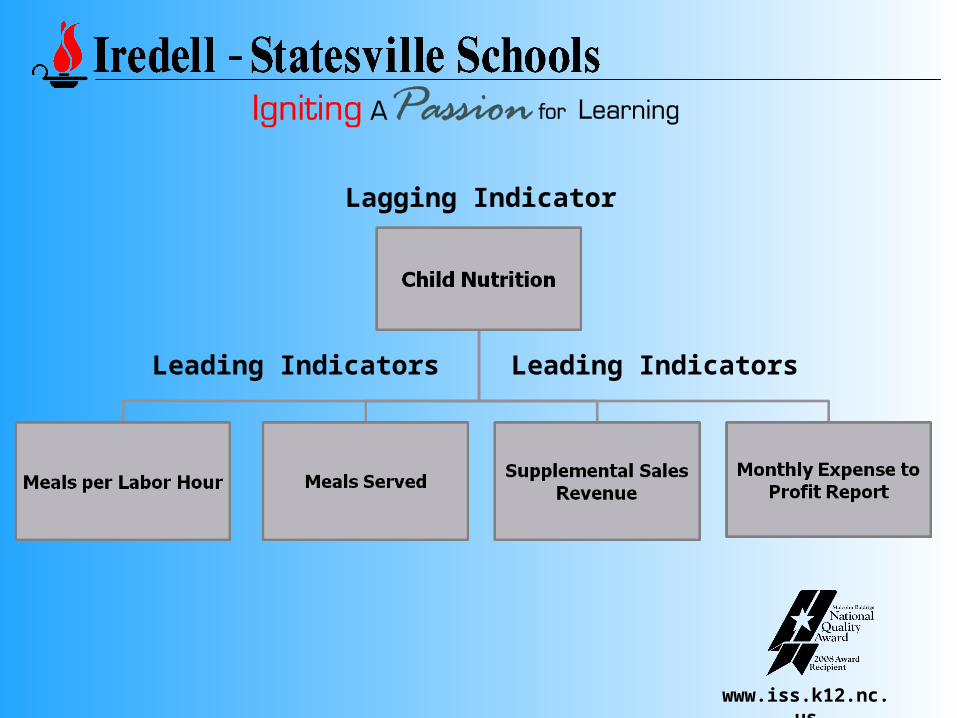
Lagging Indicator
Leading Indicators Leading Indicators
www.iss.k12.nc.us
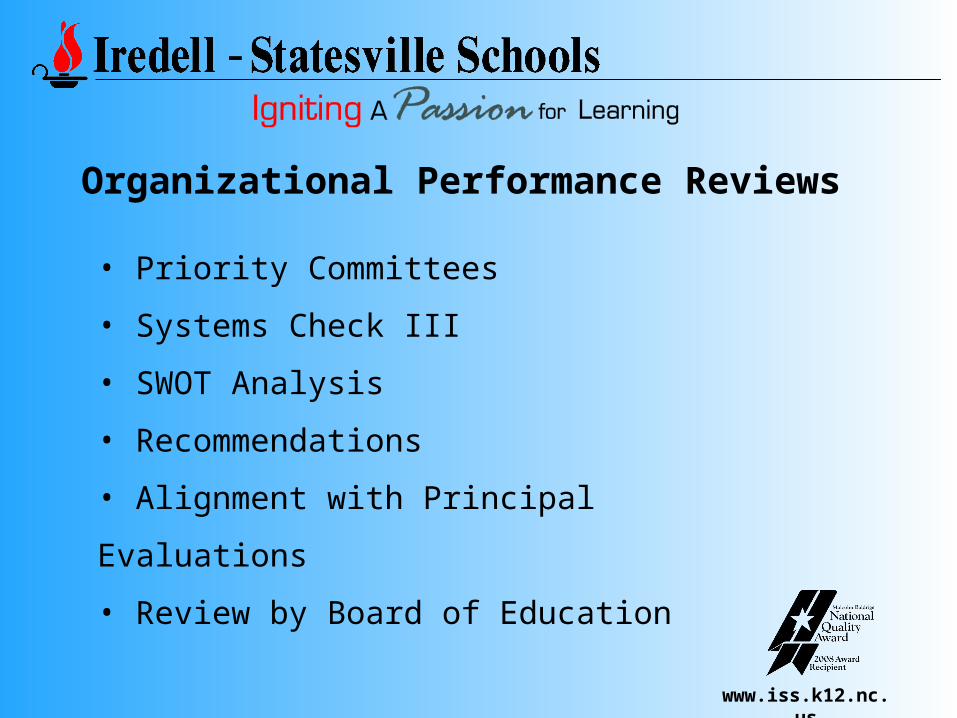
Organizational Performance Reviews
• Priority Committees
• Systems Check III
• SWOT Analysis
• Recommendations
• Alignment with Principal Evaluations
• Review by Board of Education
www.iss.k12.nc.us
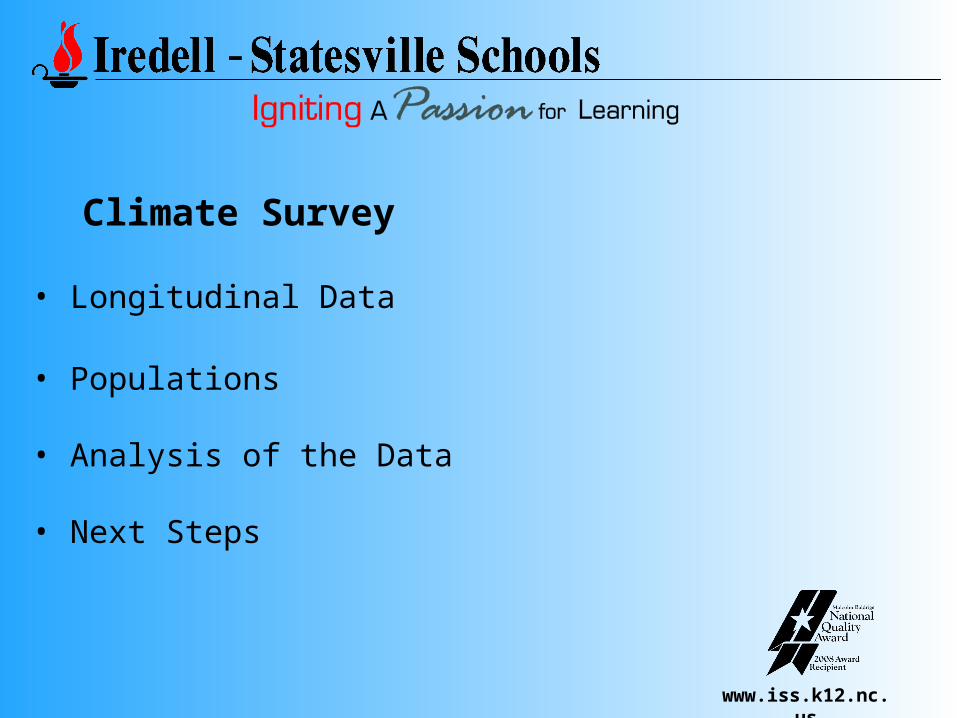
Climate Survey
• Longitudinal Data
• Populations
• Analysis of the Data
• Next Steps
www.iss.k12.nc.us
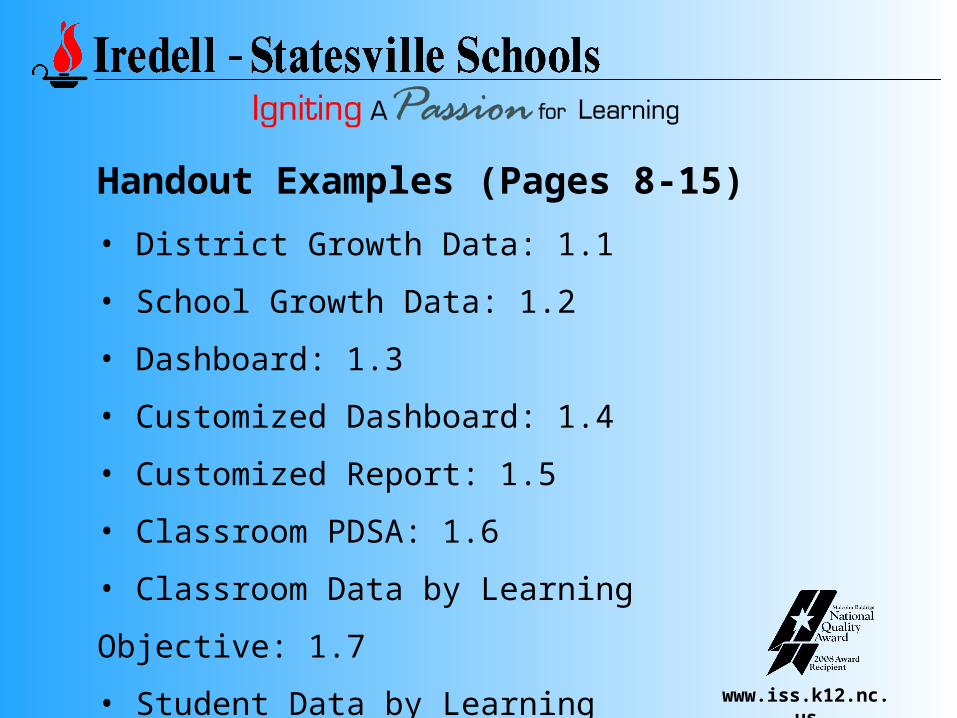
Handout Examples (Pages 8-15)
• District Growth Data: 1.1
• School Growth Data: 1.2
• Dashboard: 1.3
• Customized Dashboard: 1.4
• Customized Report: 1.5
• Classroom PDSA: 1.6
• Classroom Data by Learning Objective:
1.7
• Student Data by Learning Objective:
1.8
www.iss.k12.nc.us
www.iss.k12.nc.us
www.iss.k12.nc.us
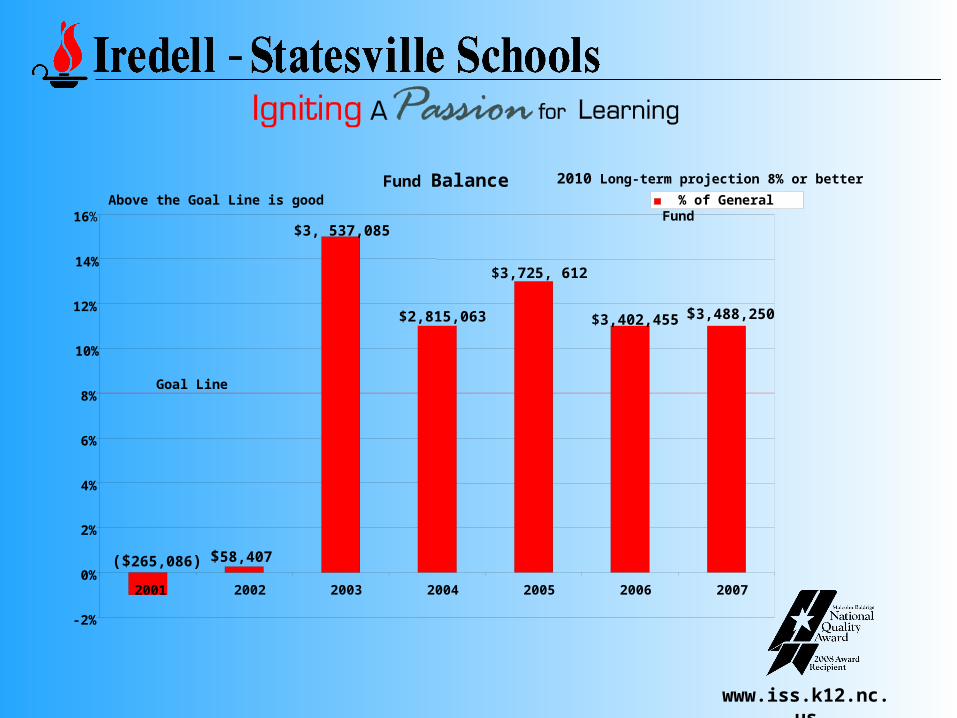
Fund Balance
-2%
0%
2%
4%
6%
8%
10%
12%
14%
16%
2001 2002 2003 2004 2005 2006 2007
Goal Line
Above the Goal Line is good
$3,488,250$3,402,455
$3,725, 612
$2,815,063
$3, 537,085
$58,407($265,086)
2010 Long-term projection 8% or better
% of General Fund
www.iss.k12.nc.us
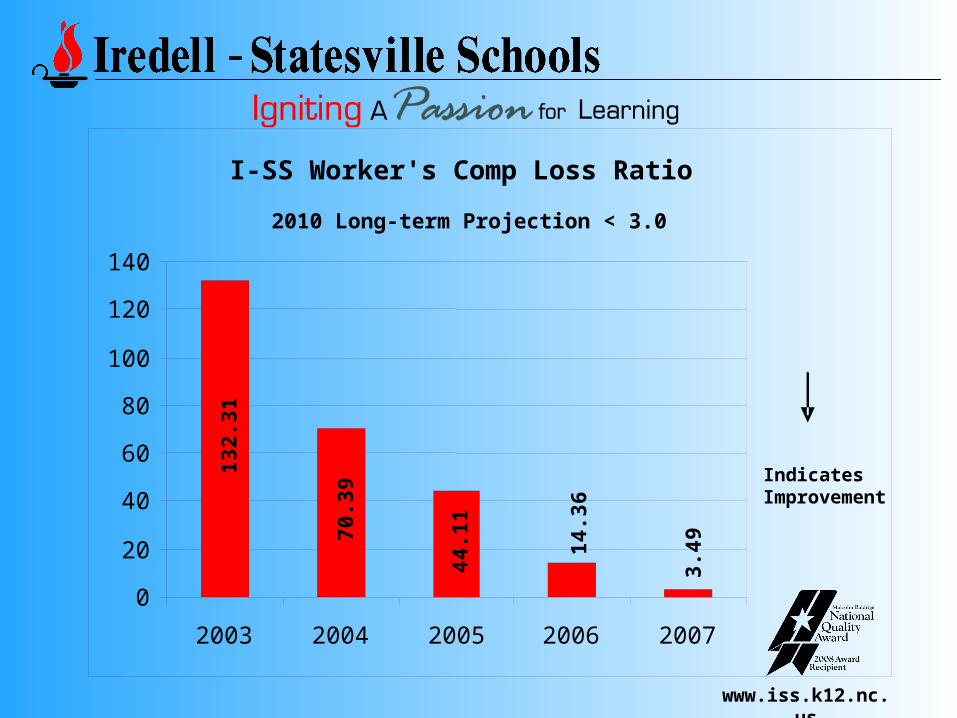
I-SS Worker's Comp Loss Ratio
13
2.3
1
70
.39
44
.11
14
.36
3.4
9
0
20
40
60
80
100
120
140
2003 2004 2005 2006 2007
IndicatesImprovement
2010 Long-term Projection < 3.0
www.iss.k12.nc.us
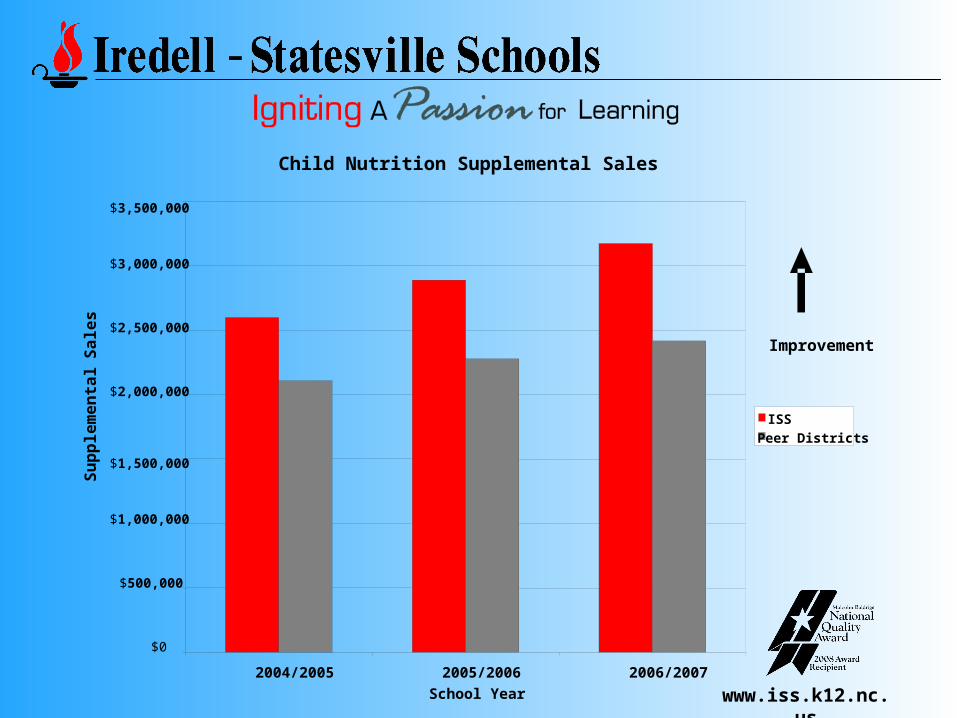
Child Nutrition Supplemental Sales
$0
$500,000
$1,000,000
$1,500,000
$2,000,000
$2,500,000
$3,000,000
$3,500,000
2004/2005 2005/2006 2006/2007
School Year
Su
pp
lem
en
tal S
ale
s
ISSPeer Districts
Improvement
www.iss.k12.nc.us
Dr. Terry Holliday – [email protected]
Sally Eller – Instructional [email protected]
Pam Schiffman – Chief Accountability andTechnology [email protected]