Www.coventry.gov.uk kk The Coventry Economy Key Information Tom Evans Corporate Research January...
33
www.coventry.gov.uk k The Coventry Economy Key Information Tom Evans Corporate Research January 2012 www.facts-about-coventry.com
-
date post
19-Dec-2015 -
Category
Documents
-
view
214 -
download
0
Transcript of Www.coventry.gov.uk kk The Coventry Economy Key Information Tom Evans Corporate Research January...

www.coventry.gov.uk k
The Coventry Economy Key Information
Tom EvansCorporate Research
January 2012
www.facts-about-coventry.com
www.coventry.gov.uk k
ContentsContext • Demographics• Deprivation in CoventryCurrent economic picture in Coventry• Productivity and growth – Gross Value Added Updated (December 2011)• Earnings of people in work New (January 2012)• Structure of the Coventry economy Updated (December 2011)• Enterprise – new business formation Updated (December 2011)• Coventry City Centre – footfall & void units New (January 2012)• Labour Market – Employment, Jobseekers, out-of-work benefits and
Job Vacancies – Updated (January 2012)• Skills• Public sector job losses – Is the private sector absorbing the losses? - BBC
research Updated (November 2011) Click on an item to go directly to that content, alternatively scroll through the
slides All data is current and up to date as of January 2012

www.coventry.gov.uk k
▼ indicates Coventry rate lower than comparator
▲ indicates Coventry rate higher than comparator
● indicates Coventry rate no different to comparator
BME = Black Minority Ethnic (non White British)*General Fertility Rate = number of live births per 1,000 women aged 15–44
The next update of this information is due in July 2012
DemographicsCoventry West Midlands
RegionEngland Period
Population and Age
Total population 315,700 5,455,200 51,809,700 2010
Average age (all residents) 34.9 39.9 ▼ 39.5 ▼ 2010
% aged 0 -15 19.2% 19.3% ▼ 18.7% ▲ 2010
% aged 16 - 64 (working age) 66.1% 63.5% ▲ 64.8% ▲ 2010
% aged 65+ 14.7% 17.2% ▼ 16.5% ▼ 2010
Birth rates
Number of births 4,726 72,090 687,007 2010
Birth rate increase over five years 16% 6% ▲ 8% ▲ 2005-10
Fertility rate* (15-44) 67.5 67.5 65.5 ▲ 2010
Ethnicity
Ethnicity (% BME) 25.9% 17.6% ▲ 17.2% ▲ 2009
― % White British 74.1% 82.4% ▼ 82.8% ▼ 2009
― % Other White 5.1% 3.2% ▲ 4.7% ▲ 2009
― % Mixed 2.4% 1.9% ▲ 1.8% ▲ 2009
― % Asian / Asian British 12.3% 8.5% ▲ 6.1% ▲ 2009
― % Black / Black British 3.1% 2.7% ▲ 2.9% ▲ 2009
― % Chinese / other 3.0% 1.3% ▲ 1.6% ▲ 2009
Back to Contents page

www.coventry.gov.uk k
Deprivation in CoventrySee map on Facts about CoventrySee report on Facts about Coventry
• Index of Multiple Deprivation 2010. This uses data from 2008 so measures deprivation just before the recession hit
• Coventry became slightly more deprived between 2005 and 2008 relative to other local authorities
• 50th most deprived local authority (56th in 2005)• Income and employment deprivation most stark in Coventry, no
change in this type of deprivation• Deprivation pattern within Coventry is broadly the same. Familiar
picture, concentrated in the North East• Canley in particular became relatively more deprived, as did Tile Hill
North and Radford • Stoke Aldermoor and North Holbrooks became less deprived, as did
NDC area, modestly
Source: Indices of Deprivation 2010, Department for Communities and Local Government
The next update of this information is due in 2013/2014
Back to Contents page

www.coventry.gov.uk k
Gross Value Added• Gross Value Added (GVA) is a high level indicator of the general
heath of the local economy. It measures the amount Coventry contributes to the UK economy
• GVA per head is used as an approximate measure of productivity, total output per job in the area
• GVA per head in Coventry in 2009 was £18,032, about 12% lower than the national average
• Unsurprisingly given the national economy was still in recession during the first two quarters of 2009, GVA per head in Coventry fell by 5% between 2008 and 2009 from £18,988
• GVA per head in Coventry fell by more than the national average; a 2.5% drop on average across England
• In 1995 GVA per head was higher than the national average but has grown since then by only 41% compared to 82% nationally
• GVA per head is higher in Coventry than in areas considered appropriate to compare with (CIPFA statistical neighbours), see the charts below
Source: Office for National Statistics Back to Contents page

www.coventry.gov.uk k
Gross Value Added per head
The next update of this information is due end of December 2012
Gross Value Added per head1995-2009
£10,000
£12,000
£14,000
£16,000
£18,000
£20,000
£22,0001
99
7
19
98
19
99
20
00
20
01
20
02
20
03
20
04
20
05
20
06
20
07
20
08
20
09
GV
A p
er
res
ide
nt
in t
he
are
a (
£ p
er
ye
ar)
£20,498 England up 60% from 1997
£19,387Warwickshire up 53% from 1997
£18,032 CoventryUp 30% from 1997
£16,183 Coventry Comparator Areasup 43% from 1997
Back to Contents page

www.coventry.gov.uk k
Gross Value Added per head
The next update of this information is due end of December 2012
Coventry comparator areas: GVA per head 2009
£12,562
£13,631
£14,622
£14,808
£14,833
£14,958
£15,072
£15,537
£16,183
£18,032
£22,413
£23,394
£19,387
£20,498
0 5 000 10 000 15 000 20 000 25 000
Greater Manchester North
Medway
Dudley and Sandwell
Stoke-on-Trent
Calderdale, Kirklees and Wakefield
Bradford
Walsall and Wolverhampton
Hartlepool and Stockton-on-Tees
Comparator average
Coventry
Warwickshire
England
Derby
Peterborough
GVA per resident (£ per annum)
Blue = Coventry comparator areas (best fit)
SOURCE: ONS December 2011 Back to Contents page

www.coventry.gov.uk k
Earnings of people in work
• The average (median) annual wage in 2011 (before tax) of all people who work in Coventry is estimated to be £23,549; higher than the average for all Coventry residents, £21,439
• Those who work in Coventry, on average, earn 9% more than the England average of £21,650
• People who work in Coventry earn on average 10% more than Coventry residents; many people commute into Coventry to work
• The average annual growth in earnings between 2008 and 2011 for residents of Coventry and for those who work in Coventry has been just under 3% compared to an England average of just under 1%
• Earnings growth in Coventry in the last year was the highest for the last 3 years
Back to Contents page

www.coventry.gov.uk k
Earnings of people in workAverage (median) annual earnings of all in employment 2008 - 2011
source: Annual Survey of Hours and Earnings, ONS
£0
£5,000
£10,000
£15,000
£20,000
£25,000
2008 2009 2010 2011
Med
ian
gro
ss a
nn
ual
ear
nin
gs
People who live in Coventry England People who work in Coventry
The next update of this information is due: 12 th December 2012
Source: Annual Survey of Hours and Earnings, Office for National Statistics Back to Contents page

www.coventry.gov.uk k
Employment by industry• The largest broad sector of the Coventry economy is public administration,
education and health which employs approximately 45,750 people in Coventry, almost a third (32%) of all employment
• Manufacturing has become an increasingly smaller part of the economy in recent years and now makes up about 11% of employment, about 15,000 people
• ‘Business services’ (banking, finance and insurance etc.) has employed an increasing number of people in the city since 1998, increasing from 14% to 23% of all employment in 2008 (England 23%)
• 58% of employees work for SMEs (business with less than 200 employees) compared to an England average of 69% (2008)
• Between 2008 and 2010 the estimated number of employees at Coventry workplaces fell from about 147,000 to 143,000 with notable falls in business services, manufacturing and ‘other services’ jobs and a notable increase in public administration, education and health jobs
Back to Contents page

www.coventry.gov.uk k
Employment by industry – Coventry workplaces
Source: ONS business register and employment survey 2010, NOMIS
The next update of this information is due: September 2012
Employment by industry 2010
0% 10% 20% 30% 40% 50%
Energy and water
Manufacturing
Construction
Distribution, hotels andrestaurants
Transport and comms.
Banking, finance andinsurance
Public admin., education andhealth
Other Services
Coventry
England
Back to Contents page

www.coventry.gov.uk k
Employment by industry
Source: Annual Business Inquiry 1998-2008, NOMIS
Coventry workplace employment by industry 1998-2008
0
20,000
40,000
60,000
80,000
100,000
120,000
140,000
160,000
1998 1999 2000 2001 2002 2003 2004 2005 2006 2007 2008
Estimated no. of employees
Manufacturing
Construction
Distribution, hotels and restaurants
Transport and comms.
Banking, finance and insurance
Public admin., education and health
Other Services
Other
source: Annual Business Enquiry, ONS
Back to Contents page

www.coventry.gov.uk k
Employment by industry
Source: ONS business register and employment survey 2010, NOMIS
This data must not be compared to the 1998-2008 data on the previous slide, they are from different sources
The next update of this information is due: September 2012
Coventry workplace employment by industry 2008 - 2010
0
20,000
40,000
60,000
80,000
100,000
120,000
140,000
160,000
2008 2009 2010
Estimated no. of employees
Manufacturing
Construction
Distribution, hotels and restaurants
Transport and comms.
Banking, finance and insurance
Public admin., education and health
Other Services
Other
source: Business Register and Employment Survey, ONS
Back to Contents page
www.coventry.gov.uk k
New business formation• 965 new business registered in Coventry in 2010, an increase on
855 in 2009. The rate of business formation is however lower than it was in 2008 and in previous years. The rate is 38 per 10,000 adults compared to the England average of 49, about 25% lower than the national average
• Due to the recession there has been a 14% fall nationally and a 16% fall amongst similar metropolitan areas between 2008 and 2010
• Fall of 18% in business formation in Coventry, a greater fall than in the UK overall and other similar areas
• Coventry has relatively more public sector employment, less self employment and relatively fewer SMEs than England
• There was a significant fall between 2008 and 2009 before a recovery in 2010; this suggests that the extent of the drop in 2009 may have been the result a statistical ‘blip’ in the measurement
Back to Contents page

www.coventry.gov.uk k
Business formation
Source: ONS Business Demography data 2010
The next update of this information is due: December 2012
Number of business 'births' per 10,000 people aged 16+
25.0
30.0
35.0
40.0
45.0
50.0
55.0
60.0
65.0
2004 2005 2006 2007 2008 2009 2010
England 48.9
All metropolitan authorities 36.5
Coventry 37.8
source: Office for National Statistics
Back to Contents page

www.coventry.gov.uk k
City Centre Footfall
• Following a positive 2010, Coventry City Centre footfall returned to a year-on-year decline, with fewer visitors to the city centre being a result of the recession and slow growth in the economy
City Centre Footfall (year-on-year)
2.2%
-0.2
%
-5.3
%
-2.2
%
1.9%
-2.5
%
-4.8
%
-0.6
%
-1.0
%
-2.0
%
-0.2
%
-1.2
%
-7%-6%-5%-4%-3%-2%-1%0%1%2%3%
2006 2007 2008 2009 2010 2011
CityCentre
UK Index
Footfall collected from the following sites; Smithford Way, Market Way, Upper Precinct, Hertford Street, City Arcade, Priory Place, Lower Precinct and West Orchards Back to Contents page

www.coventry.gov.uk k
City Centre Void Units
• After a positive reduction in the number of empty units in the city centre since 2009, figures have slightly risen over the past year to 44 void units in the city centre at the end of 2011
City Centre Retail Voids
17
22 19
13
21
26 24 22 24
36
41 41 42
47 46 45
67 69 68
59 59
50 48
38 39 42 44 44
0
10
20
30
40
50
60
70
80
2005
Q1
2005
Q2
2005
Q3
2005
Q4
2006
Q1
2006
Q2
2006
Q3
2006
Q4
2007
Q1
2007
Q2
2007
Q3
2007
Q4
2008
Q1
2008
Q2
2008
Q3
2008
Q4
2009
Q1
2009
Q2
2009
Q3
2009
Q4
2010
Q1
2010
Q2
2010
Q3
2010
Q4
2011
Q1
2011
Q2
2011
Q3
2011
Q4
Ret
ail v
oids
Back to Contents page

www.coventry.gov.uk k
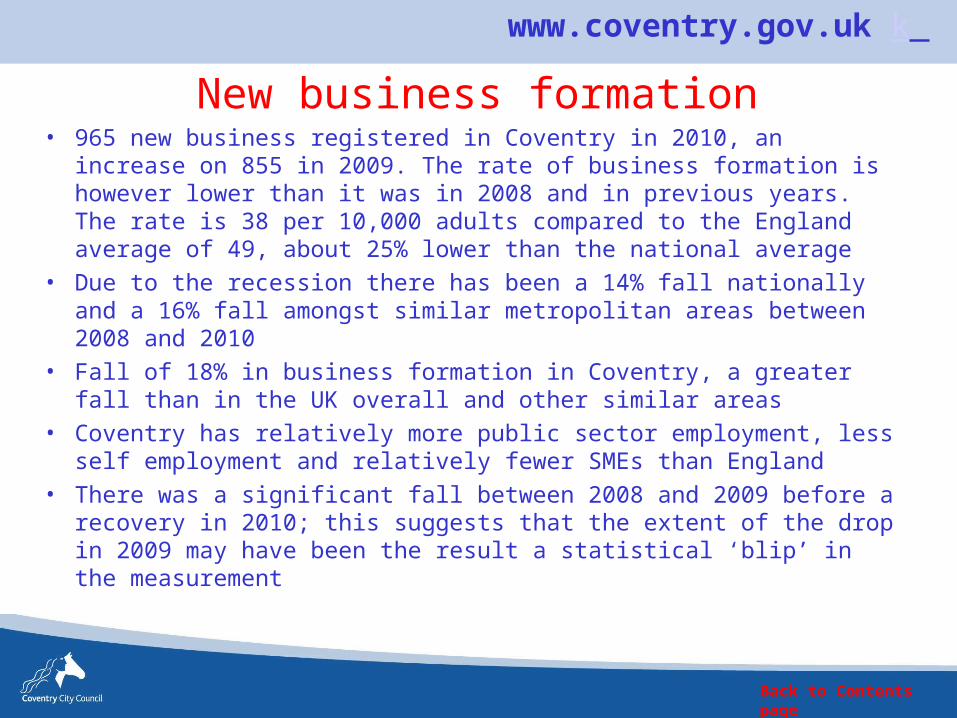
Labour MarketJuly 2010 – June 2011 data
• There are an estimated 208,700 people of working age resident in Coventry (aged 16 – 64); about two thirds of the total population
• About two thirds (66%) of working age residents of Coventry are in employment. Lower than the national average employment rate of 70%
• The employment rate of 66% is down from 71% in 2007 before the recession; about 6,000 fewer in employment
• About 138,500 people are in employment, 13,000 are unemployed and 57,300 people are economically inactive (e.g. long term sick, full time student, looking after family / home etc.)
• There was no significant change in the employment rate during the second quarter of 2011 (between Apr 2010-Mar 2011 and Jul 2010–Jun 2011)
• Those claiming Jobseekers’ Allowance make up the majority of those considered unemployed, although some don’t claim JSA
• Many of those claiming other out of work benefits (IB / ESA, lone parents on IS) are considered to be economically inactive
Source: ONS Annual Population Survey July 2010 – June 2011 , NOMIS Back to Contents page
www.coventry.gov.uk k
Labour Market
The next updates of this information are due: 18 th April 2012, 18th July 2012, 17th October 2012
Back to Contents page
Economic status of Coventry's working age population July 2010 - June 2011
4.8%
7.0%
2.2%
18.3%
1.4%
6.5%
59.6%
0.0% 10.0% 20.0% 30.0% 40.0% 50.0% 60.0% 70.0%
Percent of working age population
Coventry
England
Source: Annual Population Survey, ONS - NOMIS January 2012
Includes non- employed students
Employees
Self employed
Jobseekers Allowance
Other unemployed
ESA / Incapacity benefit
Lone parent benefit *
Others
*the main reason why the person is inactive and claiming benefitsPercentages here don't always sum exactly to 100 due to small discrepencies in the estimates taken from the survey
www.coventry.gov.uk k
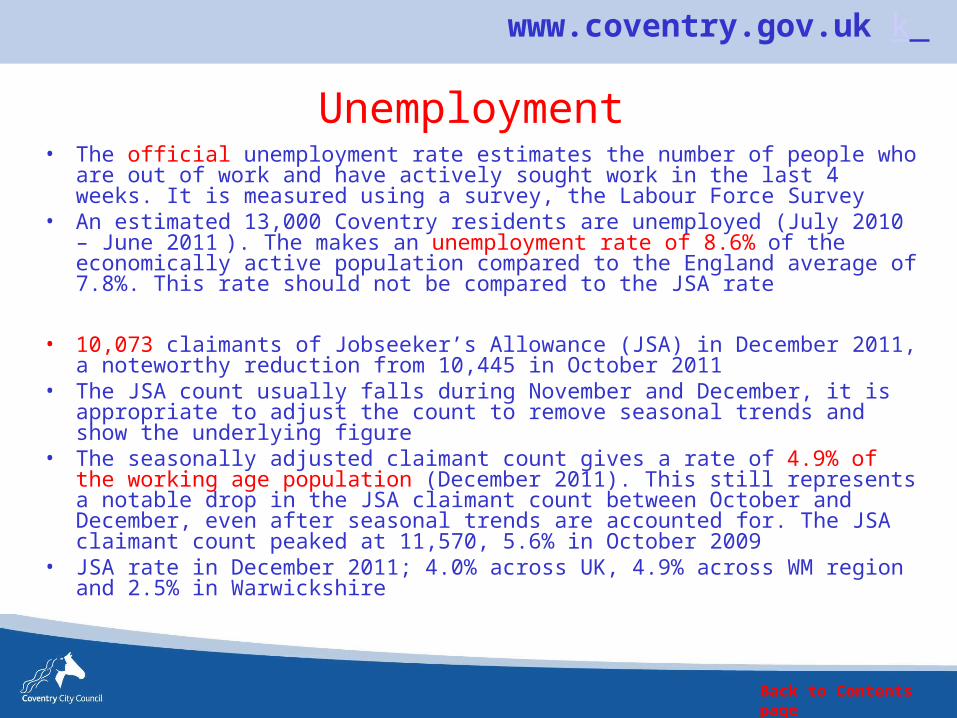
Unemployment• The official unemployment rate estimates the number of people who are out of
work and have actively sought work in the last 4 weeks. It is measured using a survey, the Labour Force Survey
• An estimated 13,000 Coventry residents are unemployed (July 2010 – June 2011 ). The makes an unemployment rate of 8.6% of the economically active population compared to the England average of 7.8%. This rate should not be compared to the JSA rate
• 10,073 claimants of Jobseeker’s Allowance (JSA) in December 2011, a noteworthy reduction from 10,445 in October 2011
• The JSA count usually falls during November and December, it is appropriate to adjust the count to remove seasonal trends and show the underlying figure
• The seasonally adjusted claimant count gives a rate of 4.9% of the working age population (December 2011). This still represents a notable drop in the JSA claimant count between October and December, even after seasonal trends are accounted for. The JSA claimant count peaked at 11,570, 5.6% in October 2009
• JSA rate in December 2011; 4.0% across UK, 4.9% across WM region and 2.5% in Warwickshire
Back to Contents page

www.coventry.gov.uk k
Unemployment (JSA) - trends• While the JSA claimants count is currently on a downward trend it is still 5%
up on the same time last year. Regionally and nationally however the claimant count has been falling more slowly in recent months and the West Midlands is 8% and the UK 10% up on the same time last year. Warwickshire is down by 4% on last year
• Slowly increasing numbers (seasonally adjusted) of claimants between December 2010 and June 2011 in Coventry
• Between June 2011 and July 2011 there was a significant increase in the number of JSA claimants in Coventry from 10,250 to 10,750. This was also the case overall nationally but the scale of the increase was greater in Coventry
• The JSA claimant count (seasonally adjusted) has been on a decreasing trend between August 2011 and December 2011
• The gap between the UK and Coventry has narrowed since the recession; it increased during the recession when the Coventry claimant count increased by more than the national average. The gap between Coventry and Warwickshire has widened
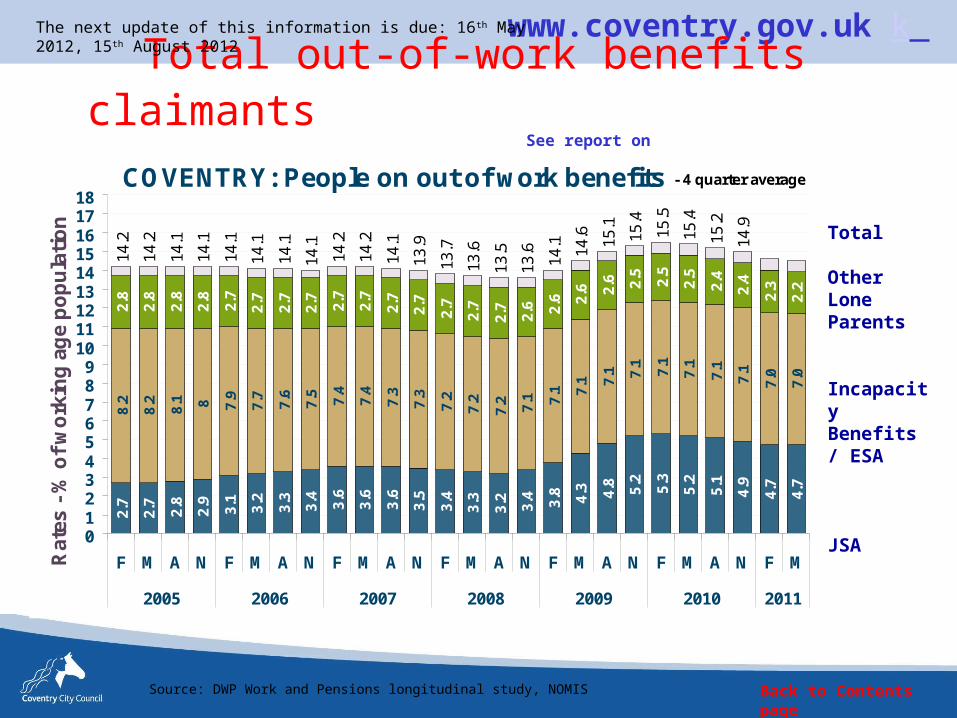
• 30,250 people claiming all out of work benefits, 14.5% of the working age population (q2 2011) (All Metropolitan authorities average 15.7%, England average 11.8%)
Back to Contents page

www.coventry.gov.uk k
Unemployment (JSA) trends
The next updates of this information are due: 15 th February 2012, 14th March 2012, 18th April 2012
JSA Count rates since 2007seasonally adjusted
2.5%
4.0%
4.9%
4.9%
0.0
0.5
1.0
1.5
2.0
2.5
3.0
3.5
4.0
4.5
5.0
5.5
6.0
J FMAM J J A SOND J FMAM J J A SOND J FMAM J J A SOND J FMAM J J A SOND J FMAM J J A SOND
2007 2008 2009 2010 2011
% o
f re
sid
en
t w
ork
ing
ag
e p
op
ula
tio
n p
op
ula
tio
n
Coventry
W Midlands Region
Warwickshire
United Kingdom
Banking crisis
Back to Contents page

www.coventry.gov.uk k
Unemployment - JSA
Source: Jobseeker’s Allowance claimant count, ONS, NOMIS
The next updates of this information are due: 15th February 2012, 14th March 2012, 18th April 2012
See map report on Facts about Coventry
COVENTRY JSA COUNT Seasonally Adjusted
0500
1,0001,5002,0002,5003,0003,5004,0004,5005,0005,5006,0006,5007,0007,5008,0008,5009,0009,500
10,00010,50011,00011,50012,00012,500
J FMAMJ J ASONDJ FMAMJ J ASONDJ FMAMJ J ASONDJ FMAMJ J ASONDJ FMAMJ J ASOND
2007 2008 2009 2010 2011
JS
A C
laim
an
t C
ou
nt
Back to Contents page
www.coventry.gov.uk k
Total out-of-work benefits claimants
Source: DWP Work and Pensions longitudinal study, NOMIS
The next update of this information is due: 16 th May 2012, 15th August 2012
See report on Facts about Coventry
COVENTRY: People on out of work benefits - 4 quarter average
2.7
2.7
2.8
2.9
3.1
3.2
3.3
3.4
3.6
3.6
3.6
3.5
3.4
3.3
3.2
3.4
3.8 4.3 4.8
5.2
5.3
5.2
5.1
4.9
4.7
4.7
8.2
8.2 8.1 8 7.9
7.7 7.6 7.5 7.4
7.4
7.3
7.3
7.2
7.2
7.2 7.1 7.1 7
.1 7.1 7.1
7.1
7.1
7.1
7.0
7.0
2.8
2.8
2.8
2.8
2.7
2.7
2.7
2.7
2.7
2.7
2.7
2.7
2.7
2.7
2.7
2.6 2.6 2.
6 2.6 2.5
2.5
2.5
2.4
2.2
14.2
14.2
14.1
14.1
14.1
14.1
14.1
14.1
14.2
14.2
14.1
13.9
13.7
13.6
13.5
13.6
14.1 14
.6 15.1
15.4
15.5
15.4
15.2
14.9
7.1
2.32.4
0123456789
101112131415161718
F M A N F M A N F M A N F M A N F M A N F M A N F M
2005 2006 2007 2008 2009 2010 2011
Rat
es -
% o
f w
ork
ing
ag
e p
op
ula
tio
n
14.6
14.5 Total
Other Lone Parents
Incapacity Benefits / ESA
JSA
Back to Contents page

www.coventry.gov.uk k
Job Vacancies
• 2,755 vacancies in Coventry reported to Jobcentre Plus during December 2011. This represents only a proportion of all job vacancies
• This means that the annual average number of vacancies in 2011 is 4% higher than in 2010. In Warwickshire it is 2% up
• In December 2011 there were just over 4 Jobseeker’s Allowance claimants chasing every reported vacancy in Coventry, broadly reflecting the national and regional average. In Warwickshire there were just under 2 job seekers per vacancy
• In July 2011 the ratio between job vacancies and job seekers was about the same as in December 2011
Back to Contents page

www.coventry.gov.uk k
Job Vacancies
Source: Jobcentre Plus vacancies, Department for Work and Pensions, NOMIS
The next updates of this information are due: 15th February 2012, 14th March 2012, 18th April 2012
COVENTRY Vacancies reported to Jobcentre Plus
0
500
1,000
1,500
2,000
2,500
3,000
3,500
4,000
J FMAMJ J ASOND JFMAMJ JASONDJFMAMJ J ASONDJ FMAMJ JASOND JFMAMJ JASOND
2007 2008 2009 2010 2011
Back to Contents page
www.coventry.gov.uk k
The labour market mismatch• On average there were 3.7 people on JSA per Jobcentre Plus
vacancy in December 2011• In addition there are generally 2,500 - 5,000 people looking for work
who are not on JSA benefits• Jobseekers looking for work in management or professional roles
appear to face less competition with 2 - 4 claimants looking for such work per vacancy
• Higher skills generally better balanced but many start own business / do not need to sign on
• The biggest mismatch was for work in sales and customer service, 7 claimants per vacancy
• Administrative and secretarial occupations and elementary occupations also had higher than average claimants per vacancy ratios, about 6
Back to Contents page

www.coventry.gov.uk k
The labour market mismatch
The next updates of this information are due: 15th February 2012, 14th March 2012, 18th April 2012
Occupational groupNumber of JSA claimants by sought occupational group December 2011
Number of reported job vacancies by occupational group December 2011
JSA claimants per JCP vacant job
Managers and Senior Officials 245 69 4
Professional Occupations 245 82 3
Associate Professional and Technical Occupations
545 314 2
Administrative and Secretarial Occupations
850 132 6
Skilled Trades Occupations 795 151 5
Personal Service Occupations 635 941 1
Sales and Customer Service occupations 2,255 307 7
Process, Plant and Machine Operatives 840 194 4
Elementary Occupations 3,520 565 6
Back to Contents page

www.coventry.gov.uk k
Skills
• It is estimated that 29% of working age residents of Coventry have higher level qualifications, those equivalent to or higher than a degree. Similar to regional and national average; higher than the West Midlands city region average
• 14% have no qualifications. Higher than the national average, lower than the West Midlands city region average
Back to Contents page

www.coventry.gov.uk k
Skills
*Birmingham, Dudley, Sandwell, Solihull, Telford & Wrekin, Walsall & Wolverhampton
Source: ONS Annual Population Survey Jan 2010 – Dec 2010, NOMIS
Qualification levels 2010
14%
9%
13%
15%
20%
29%
11%15%18%
8%8%
9%
15%15%
13%
17%17%
16%
19%19%
20%
23% 26%31%
0%
10%
20%
30%
40%
50%
60%
70%
80%
90%
100%
Coventry Rest of Cityregion*
West MidlandsRegion
England
NVQ4
NVQ3
NVQ2
NVQ1
Other
None
Highly qualified
The next update of this information is due in July 2012
See report on Facts about Coventry
Back to Contents page
www.coventry.gov.uk k
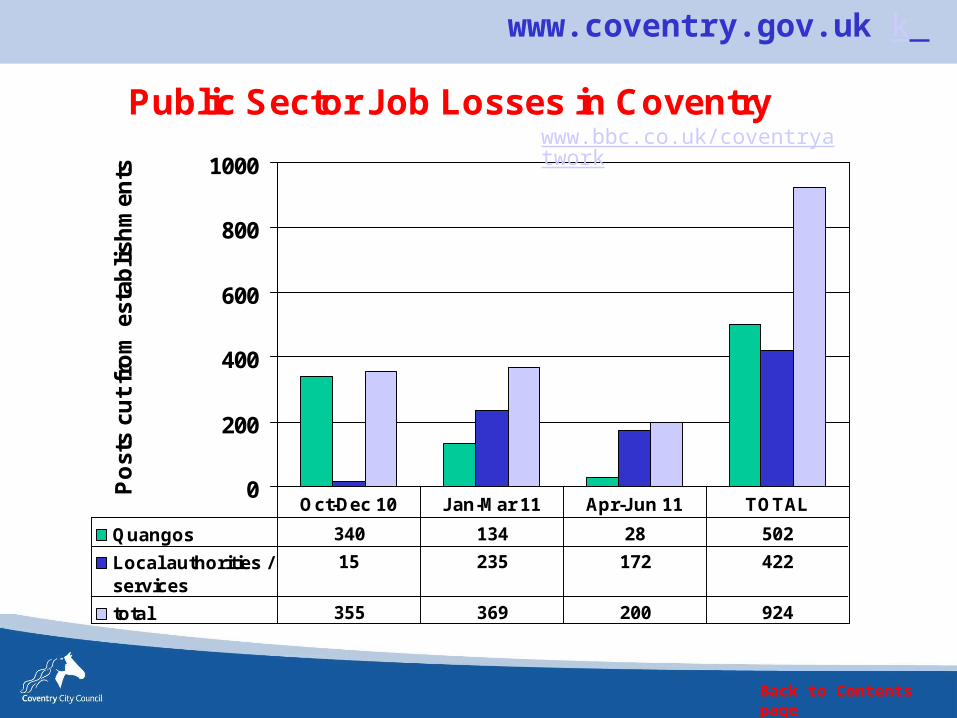
Public Sector Job Losses in Coventry
0
200
400
600
800
1000
Po
sts
cut
fro
m e
stab
lish
men
ts
Quangos 340 134 28 502
Local authorities /services
15 235 172 422
total 355 369 200 924
Oct-Dec 10 Jan-Mar 11 Apr-Jun 11 TOTAL
www.bbc.co.uk/coventryatwork
Back to Contents page

www.coventry.gov.uk k
Is the private sector absorbing public sector job losses?
• The total public sector job cuts in the quarter April to June 2011 was 200, fewer than in the previous two quarters
• It should be noted that the organisations supplying data in response to press enquiries has varied from quarter to quarter therefore the number of jobs cut may be under-reported
• There has been limited in-sourcing or out-sourcing of services, and no evidence of wholesale transfer of jobs to the private sector through contracting
• At the moment it is not possible to say whether or not the private sector is absorbing jobs lost to the public sector
Back to Contents page

www.coventry.gov.uk k
Is the private sector absorbing public sector job losses?
Evidence from October 2010 – March 2010• More jobs in-sourced than out-sourced (39 & 18) Businesses surveyed:
– Fewer worried now about impact of cuts, but still uncertainty for future
– Only 6% (4 orgs) considering delivering services traditionally in public sector
– Fewer orgs recruited Jan-Mar, but more had recruited from ex-public sector employees
Back to Contents page


![benrayneyr1.files.wordpress.com€¦ · Web viewLorem Ipsum [Insert Date] Coventry University. Lorem Ipsum. Lorem Ipsum [Insert Date] [Insert Date] Coventry University. Coventry](https://static.fdocuments.net/doc/165x107/60e585d30da98301db053ea8/web-view-lorem-ipsum-insert-date-coventry-university-lorem-ipsum-lorem-ipsum.jpg)