WWF Report 2014 | NSW Native Vegetation Act saves...
28
NSW Native Vegetation Act saves Australian wildlife Martin F J Taylor, WWF-Australia Professor Christopher Dickman, University of Sydney
Transcript of WWF Report 2014 | NSW Native Vegetation Act saves...
NSW Native Vegetation Act saves Australian wildlifeMartin F J Taylor, WWF-AustraliaProfessor Christopher Dickman, University of Sydney

Publication details
ISBN: 978-1-921031-53-3
Authors: Martin F. J. Taylor, Christopher R. Dickman
Publisher: WWF-Australia
www.wwf.org.au
GPO Box 528 Sydney NSW 2001 Tel: +61 (0)2 9281 5515
First published April 2014 by WWF-Australia. Any reproduction in full or part of this publication must mention the title and credit the above mentioned publisher as the copyright owner.
Suggested citation: Taylor, M.F.J., Dickman, C.R. 2014. NSW Native Vegetation Act saves Australian wildlife. WWF-Australia, Sydney.
Design: Mary Clare Design
Printed on FSC certified paper (Monza Satin Recycled) by Platypus Graphics.
Cover: Koala © Martin Harvey / WWF-Canon.
Acknowledgements
We would like to thank the NSW Government for the provision of data and advice, Amanda Burdon for copy-writing services.
Indemnity
Statistics and maps in this report are produced in accordance with the terms of non-commercial licenses for the use of underlying NSW and Australian government spatial or non-spatial databases. Any errors in map production or statistical analysis are WWF’s alone.
SUMMAry 2
INTroDUCTIoN 4
KEy FINDINGS 12
rEASoNS For oNGoING ClEArING 14
CoNClUSIoNS AND rECoMMENDATIoNS 18
METhoDoloGy 20
ENDNoTES 23
TAblES
Table 1. Areas of remnant bushland actually cleared for agriculture 9 and development, and estimates of native mammals killed annually, before and after 2005, but excluding small areas of clearing approved and offset after 2005.
Table 2. Estimates of annual mammal deaths due to clearing of remnant 11 bushland for agriculture or development, before and after 2005.
Table 3. Areas approved for clearing and offsets under PVPs since the 11 introduction of the Native Vegetation Act in 2005, not included in clearing figures in Table 1.
Table 4. Recategorisation of NSW Government SLATS clearing data for 22 this analysis.
FIGUrES
Figure 1. All clearing approved under the previous legislation and under 7 the Native Vegetation Act 2003 after 2005, as well as areas of offsets for clearing approved after 2005, up to November 2013.
Figure 2. Areas of remnant bushland cleared annually for agriculture 8 or development since 1988 in three regions of NSW. Areas after 2005 exclude the small areas cleared under the new approvals regime.
CoNTENTS
2
Summary
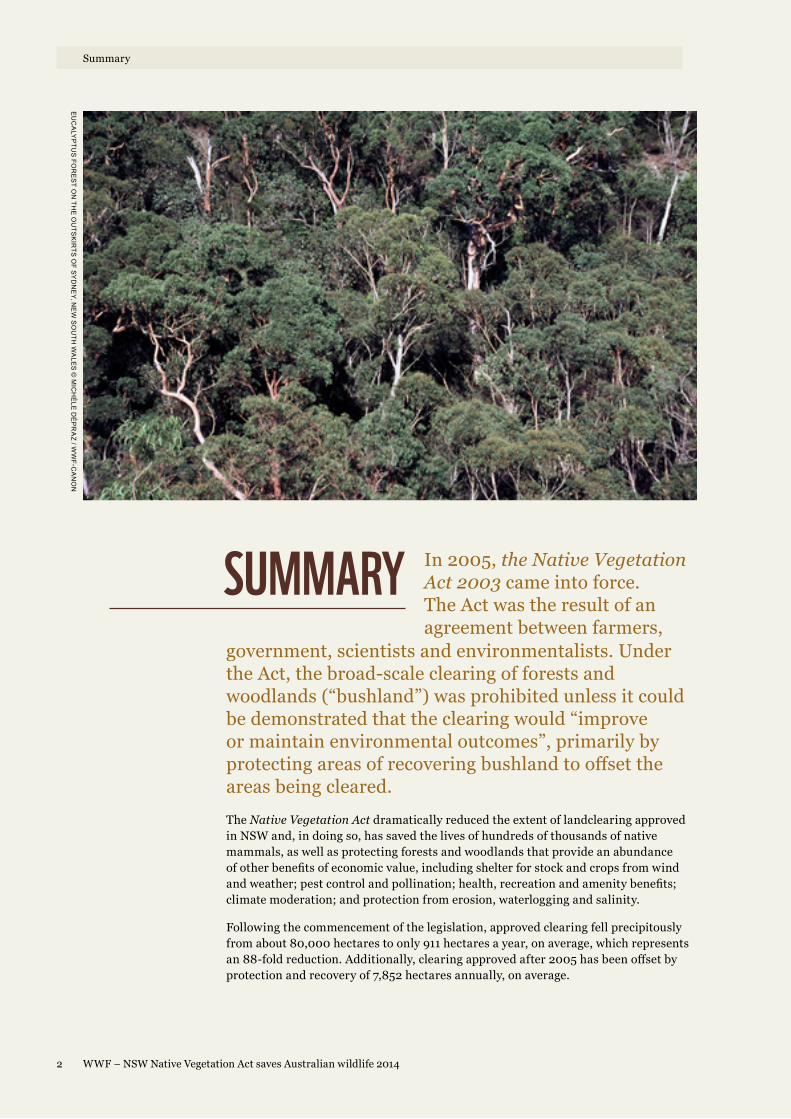
SUMMAry In 2005, the Native Vegetation Act 2003 came into force. The Act was the result of an agreement between farmers,
government, scientists and environmentalists. Under the Act, the broad-scale clearing of forests and woodlands (“bushland”) was prohibited unless it could be demonstrated that the clearing would “improve or maintain environmental outcomes”, primarily by protecting areas of recovering bushland to offset the areas being cleared. The Native Vegetation Act dramatically reduced the extent of landclearing approved in NSW and, in doing so, has saved the lives of hundreds of thousands of native mammals, as well as protecting forests and woodlands that provide an abundance of other benefits of economic value, including shelter for stock and crops from wind and weather; pest control and pollination; health, recreation and amenity benefits; climate moderation; and protection from erosion, waterlogging and salinity.
Following the commencement of the legislation, approved clearing fell precipitously from about 80,000 hectares to only 911 hectares a year, on average, which represents an 88-fold reduction. Additionally, clearing approved after 2005 has been offset by protection and recovery of 7,852 hectares annually, on average.
Eu
ca
lyp
tus
for
Es
t on
thE
ou
tsk
irts
of s
yd
nE
y, nE
w s
ou
th w
alE
s ©
Mic
hè
lE d
ép
ra
z / ww
f-ca
no
n
WWF – NSW Native Vegetation Act saves Australian wildlife 2014

3
Summary
The Native Vegetation Act along with other initiatives to expand protected areas, puts NSW in the forefront of protection of natural landscapes and the unique plant and animal species they support.
Despite the dramatic reduction in clearing approvals, however, the area of remnant bushland actually cleared for agriculture or development has fallen by a lesser amount. About 15,730 hectares were still cleared for these purposes annually in the period 2006-2010 (exclusive of the area cleared under approvals over the same period), compared to 19,681 hectares cleared annually from 1998-2005, on average.
This 20 per cent fall in actual remnant bushland clearing has meant that some 53,000 fewer native mammals have been killed each year since the law changed – a reduction of 14 per cent. However, about 320,000 mammals continue to be killed each year as a result of the ongoing clearing of remnant bushland other than clearing under approvals.
We were not able to determine how much of this ongoing remnant clearing is legal by virtue of exemptions under the present legislation or approvals under other legislation, or is illegal. The NSW Government does not publicly report these data. The authors recommend that such data should be made publicly available.
We only had access to data up to 2010, and more recent clearing data are likely to show more substantial declines in clearing rates than those reported here.
WWF recommends the NSW Government:
1. Maintain the Native Vegetation Act 2003 in its existing form;
2. Quantify and report on the scale of ongoing illegal clearing;
3. Boost compliance capacity to reduce illegal clearing;
4. Continue the strategic growth of national parks and other protected areas; and
5. Ensure that voluntary private land conservation targets under NSW 2021 are met.
wa
llab
ia b
ico
lor
sw
aM
p w
alla
by
Ma
rs
up
ial a
us
tra
lia ©
Ma
rtin
ha
rv
Ey
/ ww
f-ca
no
n
WWF – NSW Native Vegetation Act saves Australian wildlife 2014

4
Introduction
INTroDUCTIoN Although NSW began regulating the clearing of native bushland in the late 1990s, a 2002 government audit found that
the regulatory regime needed strengthening. 1 This partly reflected deficiencies in the legislation itself, and partly the way it was implemented. The audit was repeated in 2005, finding that compliance was not working and that about 44,000 hectares of clearing was approved in 2005, in addition to an estimated 30,000 hectares of illegal clearing. 2
Destruction of wildlife habitat by landclearing does not simply move animals along to other locations. Landclearing inevitably results in the deaths of animals whose habitat is destroyed (see Box 1). On the basis of the estimates of areas cleared provided by the NSW Auditor General’s office, WWF published a report in 2007 showing that millions of native animals were being killed or condemned by approved landclearing. In particular, over 780,000 individual native mammals were estimated to have been condemned, on average, due to approved and illegal clearing each year, albeit with wide error margins above and below this average. 3
In 2005, the new Native Vegetation Act 2003 came into force. Broad-scale clearing of remnant bushland was prohibited unless it could be demonstrated that the clearing would “improve or maintain environmental outcomes”, primarily by protecting areas of recovering bushland to offset the areas being cleared. This important legislation represented a major breakthrough in natural resource management negotiations between the government, scientists, farmers and environmentalists.
sq
uir
rE
l glid
Er
© w
wf / a
nd
rE
w c
oc
hr
an
WWF – NSW Native Vegetation Act saves Australian wildlife 2014

5
Introduction
Box 1: Landclearing – a devastating chain reactionWhen an area of native bushland is lost, the resident wildlife does not simply move elsewhere. Landclearing starts a devastating ecological chain reaction.
Many animals die immediately from injury or trauma associated with the clearing. Others survive for a time before succumbing to starvation, predation, accidents or disease as a result of losing their home and struggling to find a new one.
There is rarely “empty” habitat for displaced animals to move into. Those mammals and birds that survive and can migrate, typically experience competition from residents of the same species. The resulting conflict creates stress that, in turn, can lead to disease.
“Refugee” populations of native animals are generally isolated, vulnerable and unsustainable. They have to make do with poorer habitat (less food and shelter) and this hampers their breeding success and leaves them susceptible to predation. Fragmented forest habitat is also more prone to invasions by exotic pests like feral cats and weeds and, because it dries out faster, it is more likely to catch fire.
Over time, cycles of local impacts and habitat fragmentation generally spell terminal decline for local and regional populations. As a result, species first decline, then become endangered and eventually extinct.
Any bushland that regrows or replaces cleared bushland, whether natural regeneration or planted trees, does not usually replace the communities that have been lost. Even if the original plant community is restored, it often starts as an unnaturally dense monoculture and takes many decades to develop the same community of mixed-age plants. This is especially true of tree hollows, a critical resource for tree-dwelling animals, which are only found naturally in old trees that have lost limbs. 4
lANDClEArING STArTS A
DEVASTATING EColoGICAl
ChAIN rEACTIoN
clE
ar
ing
bu
lldo
zEr
kn
oc
kin
g d
ow
n s
ing
lE tr
EE
© E
llEn
wE
bE
r, c
afn
Ec
WWF – NSW Native Vegetation Act saves Australian wildlife 2014
6
Introduction
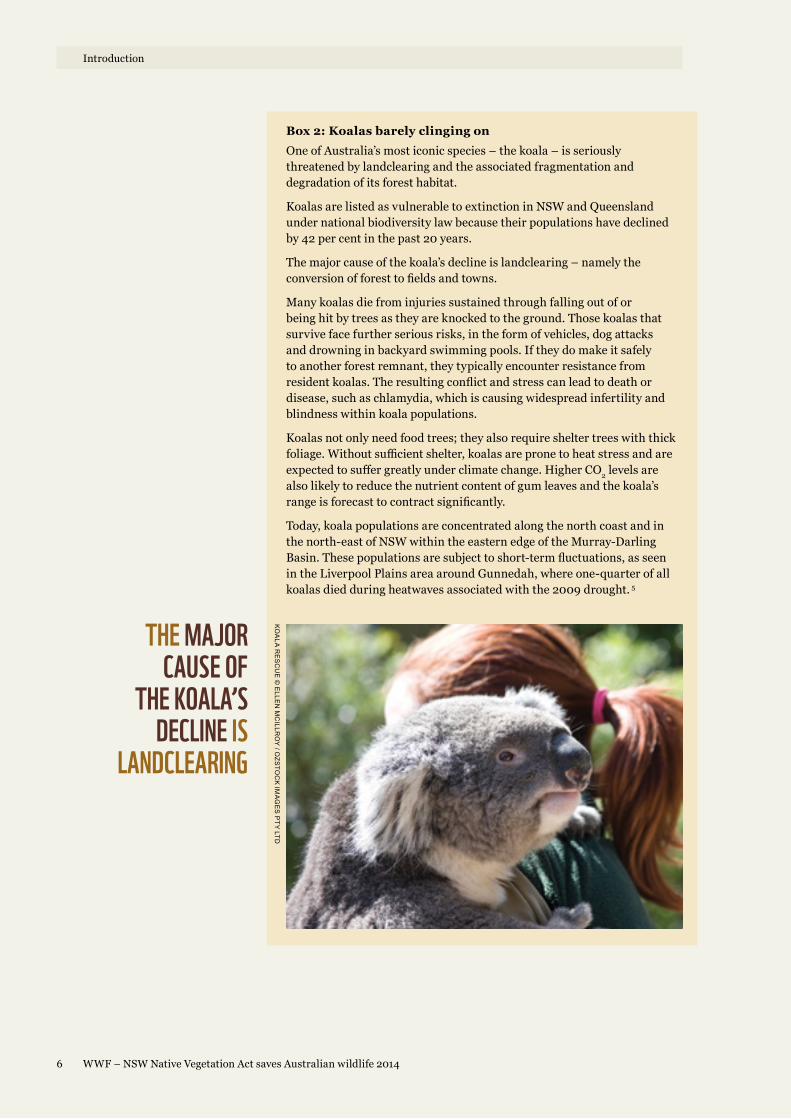
Box 2: Koalas barely clinging onOne of Australia’s most iconic species – the koala – is seriously threatened by landclearing and the associated fragmentation and degradation of its forest habitat.
Koalas are listed as vulnerable to extinction in NSW and Queensland under national biodiversity law because their populations have declined by 42 per cent in the past 20 years.
The major cause of the koala’s decline is landclearing – namely the conversion of forest to fields and towns.
Many koalas die from injuries sustained through falling out of or being hit by trees as they are knocked to the ground. Those koalas that survive face further serious risks, in the form of vehicles, dog attacks and drowning in backyard swimming pools. If they do make it safely to another forest remnant, they typically encounter resistance from resident koalas. The resulting conflict and stress can lead to death or disease, such as chlamydia, which is causing widespread infertility and blindness within koala populations.
Koalas not only need food trees; they also require shelter trees with thick foliage. Without sufficient shelter, koalas are prone to heat stress and are expected to suffer greatly under climate change. Higher CO2 levels are also likely to reduce the nutrient content of gum leaves and the koala’s range is forecast to contract significantly.
Today, koala populations are concentrated along the north coast and in the north-east of NSW within the eastern edge of the Murray-Darling Basin. These populations are subject to short-term fluctuations, as seen in the Liverpool Plains area around Gunnedah, where one-quarter of all koalas died during heatwaves associated with the 2009 drought. 5
ko
ala
rE
sc
uE
© E
llEn
Mc
illro
y / o
zsto
ck
iMa
gE
s p
ty
ltd
ThE MAJor CAUSE oF
ThE KoAlA’S DEClINE IS
lANDClEArING
WWF – NSW Native Vegetation Act saves Australian wildlife 2014

7
Introduction
FIGUrE 1All clearing approved under the previous legislation and
under the Native Vegetation Act 2003 after 2005, as
well as areas of offsets for clearing approved after 2005,
up to November 2013. 6
Approved
Offset
40
0
-40
-80
-120
20
-20
-60
-100
-140
-160
1998 2002 2006 20102000 2004 2008 2012
Are
a (1
,00
0 h
a)
an
Ec
hid
na
on
thE
for
Es
t floo
r o
f thE
Ma
cq
ua
riE
pas
s n
ation
al pa
rk
, nE
w
so
uth
wa
lEs
, au
str
alia
. © g
lob
al w
ar
Min
g iM
ag
Es
/ ww
f-ca
no
n
WWF – NSW Native Vegetation Act saves Australian wildlife 2014

8
Introduction
FIGUrE 2Areas of remnant bushland
cleared annually for agriculture or development since 1988 in three regions
of NSW. Areas after 2005 exclude the small areas
cleared under the new approvals regime.
Are
a (1
,00
0 h
a)
30,000
20,000
10,000
25,000
15,000
5,000
1988
–199
0
1992
–199
4
1996
–199
8
2000
–200
2
2004
–200
6
2007
–200
8
1990
–199
2
1994
–199
6
1998
–200
0
2002
–200
4
2006
–200
7
2008
–200
9
2009
–201
0
WESTErN DIVISIoN
CENTrAl CMAS
CoASTAl
CMAS
Western Development
Western Agriculture
Central Development
Central Agriculture
Coastal Development
Coastal Agriculture
WWF – NSW Native Vegetation Act saves Australian wildlife 2014

9
Introduction
Table 1. Areas of remnant bushland actually cleared for agriculture and development, and estimates of native mammals killed annually, before and after 2005, but excluding small areas of clearing approved and offset after 2005.
Coastal Central Western
Period Agriculture Development Agriculture Development Agriculture Development TOTAL
Areas cleared annually (hectares)
1988-1990 3,800 412 16,762 572 4,554 451 26,552
1990-1992 4,479 897 10,087 644 3,073 242 19,423
1992-1994 5,341 1,202 9,086 507 804 66 17,006
1994-1996 2,864 451 11,072 499 3,317 231 18,434
1996-1998 5,866 1,641 7,241 901 3,523 286 19,458
1998-2000 2,286 796 5,693 1,039 3,779 534 14,125
2000-2002 4,820 1,707 8,879 1,031 6,480 767 23,684
2002-2004 1,738 454 4,742 474 8,028 543 15,978
2004-2006 5,164 538 12,303 145 4,032 374 22,556
2006-2007 5,163 1,288 6,209 1,226 2,329 299 16,514
2007-2008 3,314 950 5,022 769 3,701 795 14,552
2008-2009 3,073 1,188 4,988 2,037 2,293 1,183 14,761
2009-2010 5,249 1,855 4,465 1,669 2,952 908 17,098
Average annual clearing rate (hectares)
1988-2006 4,040 900 9,541 646 4,177 388 19,691
2006-2010 4,200 1,320 5,171 1,426 2,819 796 15,731
Difference 160 420 -4,370 780 -1,358 408 -3,959
Native mammals killed annually (1000s)
Density (no/ha)
31.4 31.4 17.5 17.5 8.75 8.75
1988-2006 127 28 167 11 37 3 373
2006-2010 132 41 90 25 25 7 320
Difference 5 13 -76 14 -12 4 -53
WWF – NSW Native Vegetation Act saves Australian wildlife 2014
sy
dn
Ey
blu
E g
uM
, Eu
ca
lyp
tus
sa
lign
a. b
luE
gu
M g
allE
y u
nd
Er
pr
otE
ctio
n, r
Efo
rE
statio
n p
ro
gr
aM
. ca
rlin
gfo
rd
, nE
w s
ou
th w
alE
s. a
us
tra
lia ©
Mic
hè
lE d
ép
ra
z / ww
f-ca
no
n

11
Introduction
Table 2. Estimates of annual mammal deaths due to clearing of remnant bushland for agriculture or development, before and after 2005.
Table 3. Areas approved for clearing and offsets under PVPs since the introduction of the Native Vegetation Act in 2005, not included in clearing figures in Table 1.
Mammal group
Animal densities Annual deaths due to remnant clearing (1000s)
Coast, eastern ranges
Tablelands, western slopes and plains
Agriculture Development
average range average range 1988-2006
2006-2010
1988-2006
2006-2010
Echidna 0.01 n.d. 0.02 n.d. 0.3 0.2 0.0 0.0
Koala 0.05 (<0.01 – 4.4) 0.08 (<0.01 – 2.1) 1.1 0.7 0.1 0.2
Common wombat
0.5 (0.01 – 1.9) 0.1 (<0.1 – 0.4) 3.2 2.8 0.5 0.8
Possums and gliders
15.5 (0.5 – 34.0) 7 (0.5 – 26.5) 144.0 111.2 19.8 33.2
Kangaroos, wallabies
0.8 (0.1 – 2.6) 0.5 (<0.1 – 1.0) 9.0 6.6 1.1 2.0
Bandicoots 2.1 (0.1 – 2.7) 1.7 n.d. 28.3 20.0 3.3 5.9
Carnivorous marsupials
9.5 (1.5 – 24.9) 3.8 (0.5 – 52.0) 82.6 64.9 11.7 19.5
Native mice and rats
2.9 (0.5 – 20.0) 4.3 (0 – 44.0) 61.7 40.5 6.2 11.7
All 31.36 17.5 330.2 246.9 42.9 73.3
Coastal Central Western Total
PVPs 2006-2010
Clearing 183 1,378 4,638 6,199
Offset 1,181 12,908 12,896 26,985
Invasive Native Shrub – 63,384 2,109,357 2,172,740
PVPs 2010-2013
Clearing 75 71 1,862 2,008
Offset 432 9,217 24,488 34,137
Invasive Native Shrub – 67,262 1,506,029 1,573,291
WWF – NSW Native Vegetation Act saves Australian wildlife 2014

12
Key Findings
KEy FINDINGS 1. 88-fold reduction in areas approved for clearing
From 1998 to 2005, 639,930 hectares of clearing for all purposes was approved under the previous Native Vegetation Conservation Act 1997 – an annual rate of about 80,000
hectares (Figure 1). Since 2005, approved clearing in NSW under the current legislation has fallen precipitously to 8,200 hectares in total from 2005 to 2013 (911 hectares per annum) – an 88-fold reduction (Figure 1). Additionally, clearing approved after 2005 has been offset by protection and restoration of 61,000 hectares (Figure 1). Regardless of other drivers of remnant bushland loss, the current legislation has achieved an equally dramatic decline in the number of native mammals condemned to death by approved clearing.
2. 20 per cent reduction in actual remnant clearing rates
Annual rates of actual clearing of remnant bushland for agriculture and development since 2005 have averaged 20 per cent lower, declining from 19,691 hectares per annum in the years up to 2005 to 15,731 hectares per annum after 2005, on average (Figure 2, Table 1). However, most of this reduction is in central and western regions for agricultural clearing only. Annual remnant bushland clearing for development and in coastal catchments has actually increased since 2005 (Figure 2, Table 1). Annual areas cleared have also been highly variable year to year, and peaked in the period 2004-2006, around the time the Native Vegetation Act came into force (Figure 2).
sp
ot
tEd
tail q
uo
ll © w
wf-c
an
on
/ fEd
y M
Er
cay
WWF – NSW Native Vegetation Act saves Australian wildlife 2014

13
Key Findings
3. 14 per cent reduction in annual native mammal deaths
Using densities of animals from Table 3 of WWF’s 2007 report, 7 it is estimated that the annual loss of mammals up to 2005 due to the clearing of remnant bushland for agriculture and development was 373,000 up to 2005, and approximately 320,000—about 53,000 less per annum—after 2005. This represents a 14 per cent reduction (Tables 1, 2). The gross reduction in agricultural clearing accounts for a reduced annual death rate of about 83,000. However, this was offset by an increase in the death rate due to clearing for development in the order of 30,000 per annum (Table 2).
Smaller mammals like possums, gliders, carnivorous marsupials and native rodents dominate the mammal death estimates. It is estimated that about 300 fewer koalas and 100 fewer wombats are killed per annum due primarily to reduced agricultural clearing rates in the central and western regions (Table 2, Box 2).
It is also important to note that these estimates of mammal losses from landclearing are conservative, because they are based only on species for which abundance has been measured. True mortality rates are likely to be substantially higher. Moreover, the full impact of landclearing on native populations may not become apparent for 20-50 years. 8
4. High levels of ongoing remnant bushland clearing and associated mammal deaths
About 15,730 hectares of remnant bushland was still being cleared annually in NSW from 2006-2010 for agriculture or development, over and above relatively small areas of approved (and offset) clearing. This is not much less than the approximately 24,000 hectares of remnant bushland cleared in Queensland in 2009-10. 9 Ongoing clearing is resulting in estimated mammal deaths in the order of 320,000 per annum (Tables 1, 2).
These figures exclude clearing approved under a Property Vegetation Plan (PVP) under the new legislation. PVP-approved clearing has two dominant forms: broad-scale clearing of regulated bushland (along with offsets for this clearing) and clearing for Invasive Native Scrub (INS) thinning.
• Broad-scale clearing must be accompanied by an offset typically several times larger than the area cleared. The offset ratios depend on the condition of the remnant being cleared, threatened species habitat values, and the extent of increase in condition in the area offset. On average, the offset ratio observed was over seven to one for the period 2006-2013 (Table 3).
• Invasive Native Scrub (INS) thinning is intended to have a net ecological benefit by returning natural western woodlands to their presumptive natural state, if native bushland occurs at unnaturally high densities as a result of genuine invasion or due to dense regeneration following clearing. 10 No offsets are required. Moreover, the areas approved for INS treatments are never totally cleared. Native plants may be removed from a variable fraction of the area within which INS thinning is approved. Clearing due to INS thinning is excluded from this analysis (Table 3).
glid
Er
© v
iEw
find
Er
aus
tra
lia ph
oto
libr
ar
y
WWF – NSW Native Vegetation Act saves Australian wildlife 2014

14
Reasons for ongoing clearing
rEASoNS For oNGoING
ClEArING
Despite the dramatic decline in clearing approvals (Figure 1), ongoing remnant clearing levels are high and have only declined by 20 per cent (Figure 2). The ongoing remnant bushland clearing estimated here (Table 1) does not include that which
is approved under the current legislation, and so is either exempt under current legislation (including if approved under other legislation) or illegal. We only had access to data up to 2010, and more recent data are likely to show more substantial declines in clearing rates than those reported here.
Eu
ca
lyp
tus
for
Es
t on
thE
slo
pE
s o
f thE
sn
ow
y M
ou
nta
ins
, nE
w s
ou
th w
alE
s, a
us
tra
lia
© g
lob
al w
ar
Min
g iM
ag
Es
/ ww
f-ca
no
n
WWF – NSW Native Vegetation Act saves Australian wildlife 2014

15WWF – NSW Native Vegetation Act saves Australian wildlife 2014
WWF – NSW Clearing Ban Saves Native Mammals
Eu
ca
lyp
tus
for
Es
t, nE
w s
ou
th w
alE
s ©
Mic
hè
lE d
ép
ra
z / ww
f-ca
no
n
16
Reasons for ongoing clearing
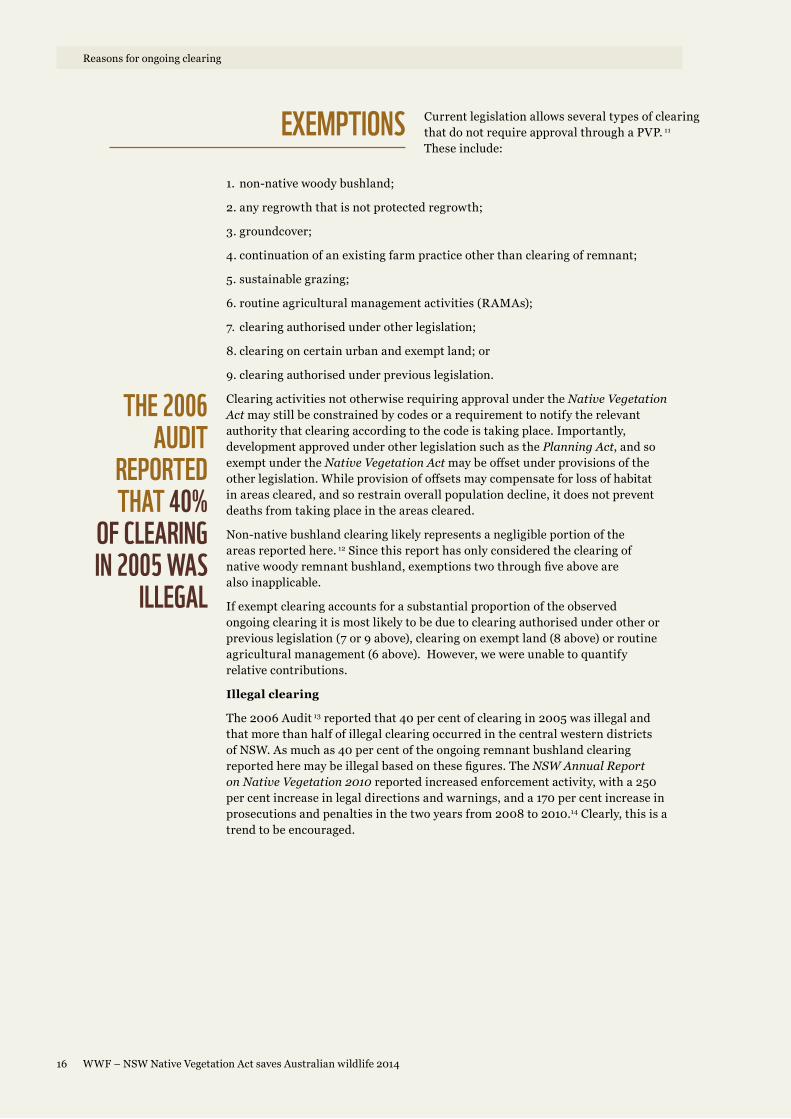
Current legislation allows several types of clearing that do not require approval through a PVP. 11 These include:
ExEMPTIoNS1. non-native woody bushland;
2. any regrowth that is not protected regrowth;
3. groundcover;
4. continuation of an existing farm practice other than clearing of remnant;
5. sustainable grazing;
6. routine agricultural management activities (RAMAs);
7. clearing authorised under other legislation;
8. clearing on certain urban and exempt land; or
9. clearing authorised under previous legislation.
Clearing activities not otherwise requiring approval under the Native Vegetation Act may still be constrained by codes or a requirement to notify the relevant authority that clearing according to the code is taking place. Importantly, development approved under other legislation such as the Planning Act, and so exempt under the Native Vegetation Act may be offset under provisions of the other legislation. While provision of offsets may compensate for loss of habitat in areas cleared, and so restrain overall population decline, it does not prevent deaths from taking place in the areas cleared.
Non-native bushland clearing likely represents a negligible portion of the areas reported here. 12 Since this report has only considered the clearing of native woody remnant bushland, exemptions two through five above are also inapplicable.
If exempt clearing accounts for a substantial proportion of the observed ongoing clearing it is most likely to be due to clearing authorised under other or previous legislation (7 or 9 above), clearing on exempt land (8 above) or routine agricultural management (6 above). However, we were unable to quantify relative contributions.
Illegal clearing
The 2006 Audit 13 reported that 40 per cent of clearing in 2005 was illegal and that more than half of illegal clearing occurred in the central western districts of NSW. As much as 40 per cent of the ongoing remnant bushland clearing reported here may be illegal based on these figures. The NSW Annual Report on Native Vegetation 2010 reported increased enforcement activity, with a 250 per cent increase in legal directions and warnings, and a 170 per cent increase in prosecutions and penalties in the two years from 2008 to 2010.14 Clearly, this is a trend to be encouraged.
ThE 2006 AUDIT
rEPorTED ThAT 40%
oF ClEArING IN 2005 WAS
IllEGAl
WWF – NSW Native Vegetation Act saves Australian wildlife 2014

17
Reasons for ongoing clearing
Box 3: Benefits to landowners of conserving bushlandNative bushland retention carries real economic benefits for rural communities in addition to conserving wildlife by:
• Attracting financial support for biobanking, environmental stewardship and carbon farming;
• Improving crop and pasture yields;
• Providing shelter for stock and crops from wind and weather;
• Harbouring beneficial wild plants and animals, such as pollinators and predators of crop pests;
• Controlling erosion through protecting soils and riverbanks;
• Reducing land degradation and salinity;
• Improving water quality and retention within catchments; and
• Moderating the global and regional climate .
cat
tlE o
n w
Ell M
ain
tain
Ed
pas
tur
E in
so
uth
Ea
st q
uE
En
sla
nd
© ia
n M
cc
on
nE
l
WWF – NSW Native Vegetation Act saves Australian wildlife 2014

18
Conclusions and recommendations
Landclearing represents one of the greatest threats to terrestrial biodiversity. The NSW Government’s Native Vegetation Act 2003 ended broad-scale landclearing in 2005, resulting in
CoNClUSIoNS AND rECoMMENDATIoNS
a dramatic 88-fold decline in approved clearing rates from tens of thousands of hectares a year down to about 911 hectares a year, all of which is offset.About 15,730 hectares of remnant bushland was still being be cleared for agriculture and development annually in the period 2006-2010 (exclusive of the area cleared under approvals over the same period), compared to 19,681 hectares cleared annually, on average, from 1998-2005.
This 20 per cent fall in remnant clearing rates has meant that some 53,000 (14 per cent) fewer native mammals have been killed each year since the law changed. About 320,000 mammals continue to be killed each year as a result of clearing of remnant bushland other than clearing under approvals. We were unable to determine how much of the ongoing clearing of remnant bushland is exempt under existing legislation, approved under other legislation, or illegal. Also, despite these losses, there was considerable bushland restoration activity over 1.5 million hectares in NSW for the same period 2006-2010. 16
We only had access to data up to 2010, and more recent data are likely to show more substantial declines in clearing rates than those reported here.
In March 2014, the NSW Government released for public comment three self-assessable codes of practice for thinning native vegetation, clearing of isolated paddock trees in a cultivated area and clearing invasive native species (INS). The NSW Government also announced an ongoing process to reform the rules governing native vegetation including changes to the Threatened Species Conservation Act and the Native Vegetation Act. As this report shows, the Native Vegetation Act has delivered clear benefits to biodiversity, and forthcoming reports will demonstrate other benefits of the Act. While this report does not specifically address these draft self-assessable codes of practice, it is difficult to envisage how relaxing the existing regulations could protect the environment. On the other hand, there are ample opportunities to improve the efficiency of agricultural management and the protection of the environment by providing more resources to NSW Government Local Land Services (LLS), Agriculture NSW and the Office of Environment and Heritage so that they can provide improved services and advice to landowners.
In addition to the legislated protection of bushland, NSW is a national leader in the expansion of protected areas, with about 680,000 hectares of new protected areas added in just the four years 2006-2009 permanently preventing forest and wildlife loss. 17 However, effective conservation depends greatly on engaging private landholders. Under NSW 2021: A plan to make NSW number one, 18 the government is committed to establishing voluntary arrangements with landowners over the next decade to bring an average of 20,000 hectares per year of private land under conservation management and an average of 300,000 hectares per year of private land under more sustainable management. These valuable initiatives complement the regulation of native bushland in conserving biodiversity and the ecosystem services that benefit agricultural productivity.
lANDClEArING rEPrESENTS oNE
oF ThE GrEATEST ThrEATS To
TErrESTrIAl bIoDIVErSITy
WWF – NSW Native Vegetation Act saves Australian wildlife 2014

19
Conclusions and recommendations
wo
Mb
atus
ur
sin
us
co
MM
on
wo
Mb
at a n
oc
tur
na
l Ma
rs
up
ial a
us
tra
lia:©
Ma
rtin
ha
rv
Ey
/ ww
f-ca
no
n
WWF recommends the NSW Government:
1. Maintain the Native Vegetation Act 2003 in its existing form;
2. Quantify and report on the scale of ongoing illegal clearing;
3. Boost compliance capacity to reduce illegal clearing;
4. Continue the strategic growth of national parks and other protected areas; and
5. Ensure that voluntary private land conservation targets under NSW 2021 are met.
WWF – NSW Native Vegetation Act saves Australian wildlife 2014

20
Methodology
Statistics on approved clearing were taken from the earlier WWF report (based on NSW government provided
METhoDoloGyinformation) 19 and from the public register of approvals under property Vegetation Plans under the present legislation. 20
For actual clearing, the authors used official landclearing spatial data from the NSW Office of Environment and Heritage State-wide Landcover and Trees Study (SLATS), which includes the locations, extent and type of woody vegetation loss for two-year periods beginning in 1988 and running until 2006, and thereafter annually until the end of 2010. 21 No more recent data were available.
Of the different classes of change, only those that were clearly converted from remnant bushland to a non-forest use by the removal of trees (Table 4) were treated as conversion-cleared areas. Clearing of regrowth bushland, clearing for forestry (unless it was to replace native forest with a plantation or for infrastructure), thinning and clearing approved under Property Vegetation Plans (PVPs) according to the Native Vegetation Act 2003, including Invasive Native Shrub (INS) treatments, were all excluded. Forestry was excluded primarily because it is either plantation forestry and likely to be of low value as wildlife habitat, or because it encourages the return of native forest after harvest, not permanent conversion to non-forest bushland, except in the case of conversion to plantations.
Clearing statistics were divided into two major purposes – development and agriculture – and into three major regions: coastal Catchment Management Authorities (CMAs), central CMAs, and the Western Division of NSW (Figure 2). The former two regions are not the same as the eastern and central divisions of NSW for land administration purposes and were used instead of these divisions because their boundaries break around the Great Dividing Range. 22 The Western Division was used rather than CMA boundaries because of the very different rule for what constitutes regrowth exempt from clearing in that division.
All observation epochs were merged into a composite layer of polygons cleared across the entire 1988-2010 record. Any re-clearing in later time periods was ignored by assigning any overlapping clearing polygons to the earliest clearing epoch. Hence the estimates of areas cleared after 2005 conservatively exclude any areas already cleared and regrown in the period 1988-2005, which means that any areas cleared must have been remnant bushland that had been regrowing since 1989 or earlier, other than in the Western Division, where areas cleared and regrown after 1982 are considered exempt regrowth.
WWF – NSW Native Vegetation Act saves Australian wildlife 2014

21
Methodology
To exclude regrowth from clearing maps in the Western Division, forest maps provided by the National Carbon Accounting System were used. 23 These maps show forest versus non-forest (using the Kyoto Protocol definition, also used by SLATS) at approximately 25 metre grid scale, for a number of years between 1972 and 2010. In the 1980s, forest extent is available only for 1980, 1985 and 1988. Only pixels that were forest in both 1980 and 1985 and later cleared at any date in the SLATS detection period of 1988-2010 were counted as cleared remnants. This represented 44-82 per cent of all observed clearing, depending on the time period of SLATS clearing.
Using these methods, we could be reasonably confident that nearly all the clearing mapped was clearing of remnant, but it still remains possible that some regrowth clearing could be included in final area estimates.
Any clearing approved in PVPs either as clearing per se or INS treatments was excluded as follows. The former were excluded because areas were small and clearing was offset. The latter (INS) were excluded because they have an ecologically beneficial intent. The public register of PVPs was downloaded. 24 Latitude and longitude coordinates provided in the register were used to map PVPs to respective regions and the areas under different categories of PVPs in different regions (Figure 1) were totalled. These data were then used to exclude PVP clearing from the estimates of remnant clearing as follows. The XY coordinates of the register were matched to property polygons by intersection with the CADLITE lot boundaries provided by PSMA for NSW (November 2013 release). 25 Intersections were only retained where the date of the clearing was after or in the same year as the PVP approval date, and so could reasonably be concluded to result from the approval. Only intersections with agricultural clearing for the INS approvals were retained. All areas approved for clearing under a PVP that overlapped a clearing polygon were then conservatively subtracted from estimates of areas cleared. The intersection areas with approved INS treatments were also subtracted from estimates of areas cleared. This approach had to assume, in the absence of better information, that one PVP corresponded to just one lot. The approach was not able to exclude clearing occurring under a PVP over multiple lots.
Having obtained estimates of areas of remnant bushland cleared exclusive of areas approved under PVPs, these areas were then multiplied by the density estimates for native mammals from Table 3 of the WWF 2007 land-clearing report. Density estimates assigned to “Coast and eastern ranges” were taken to refer to coastal catchments only, and “Tablelands, western slopes and plains” were taken to refer to central catchments. For the drier Western Division woodlands, the “Tablelands, western slopes and plains” density estimates were arbitrarily but conservatively halved. The average densities were then multiplied by the areas cleared per annum in the respective regions to arrive at estimates of total numbers of native mammals killed by clearing per annum. 26
WWF – NSW Native Vegetation Act saves Australian wildlife 2014

22
Methodology
Table 4. Recategorisation of NSW Government SLATS clearing data for this analysis.
From 1988 to mid 2008 From mid 2008 to 2010
Code Attribution Reclassify as Code Attribution Reclassify as
40 Possible agriculture Agriculture 70 Agriculture unclassified Agriculture
41 Pasture Agriculture 71 Pasture Agriculture
42 Crops Agriculture 72 Cropping Agriculture
53 New plantation Agriculture 73 Horticulture Agriculture
79 Possible agriculture Agriculture
93 New plantation Agriculture
46 Settlements Development 74 Farm infrastructure Development
48 Mining Development 80 Urban/industrial unclassified
Development
51 Infrastructure unclassified
Development 81 Residential Development
82 Commercial/Industrial Development
83 Mining Development
84 General infrastructure Development
89 Possible industrial clearing
Development
94 Forestry infrastructure* Development
11 Fire Exclude 11 Fire Exclude
12 Fire Exclude 12 Fire Exclude
55 Thinning Exclude 75 Thinning Exclude
60 Possible Forestry Exclude 77 Second-stage clearing Exclude
61 Forestry Exclude 85 Thinning Exclude
62 Plantation harvest Exclude 87 Second-stage clearing Exclude
58 Missed earlier clearing
Exclude 90+ Forestry (except *) Exclude
100+ Unclassified, bad data Exclude
WWF – NSW Native Vegetation Act saves Australian wildlife 2014

23
Endnotes
1 NSW Auditor General (2002) Performance audit report: Department of Land and Water Conservation: Regulating the clearing of native vegetation. (http://www.audit.nsw.gov.au/ArticleDocuments/134/101_Land_Water_Conservation.pdf.aspx)
2 NSW Auditor General (2006) Regulating the Clearing of Native Vegetation: Follow-up of 2002 Performance Audit. (http://www.audit.nsw.gov.au/ArticleDocuments/138/155_Regulating_Clearing.pdf.aspx)
3 Johnson, C., Cogger, H., Dickman, C. and Ford, H. (2007) Impacts of landclearing: The impacts of approved clearing of native vegetation on Australian wildlife in New South Wales. WWF-Australia Report, WWF-Australia, Sydney. (http://www.wwf.org.au/news_resources/resource_library/?1482/Impacts-of-landclearing)
4 Johnson et al. (2007), cited above.
5 Australian Government Department of Environment (2013) Phascolarctos cinereus (combined populations of Qld, NSW and the ACT) – Koala (combined populations of Queensland, New South Wales and the Australian Capital Territory) (http://www.environment.gov.au/cgi-bin/sprat/public/publicspecies.pl?taxon_id=85104)
6 Table 1 in Johnson et al. (2007), cited above, for figures before 2006 and thereafter from NSW Government Office of Environment and Heritage (2014) Public register. (http://www.environment.nsw.gov.au/vegetation/publicregister.htm)
7 Table 3 in Johnson et al. (2007), cited above.
8 Johnson et al. (2007), cited above.
9 Queensland Government Department of Science, Information Technology, Innovation and the Arts (2012) Land cover change in Queensland 2009-10: State-wide Landcover and Trees Study Report.
10 NSW Government (2006) Managing invasive native scrub: Infosheet 9 (http://www.environment.nsw.gov.au/resources/Vegetation/nvinfosheet9.pdf)
11 NSW Government Office of Environment and Heritage (2014) What clearing can I do without approval? (http://www.environment.nsw.gov.au/Vegetation/noapproval.htm)
12 NSW Auditor General (2006), cited above, states: “Approved landclearing in 2005 was 44,000 hectares (including forestry activity of 20,942 hectares and exotic Vegetation of 669 hectares)”. Hence clearing of non-native Vegetation represented less than 2% of clearing.
13 NSW Auditor General (2006), cited above.
14 NSW Government Office of Environment and Heritage (2010) Annual Report on Native Vegetation 2010. (http://www.environment.nsw.gov.au/resources/Vegetation/110685NVAR2010.pdf)
15 NSW Government Office of Environment and Heritage (2014) Why is native Vegetation important? (http://www.environment.nsw.gov.au/Vegetation/importance.htm)
16 NSW Government Office of Environment and Heritage (2010) Annual Report on Native Vegetation 2010 (cited above).
17 Taylor, M F J., et al. (2011) Building Nature’s Safety Net 2011. The state of protected areas for Australia’s ecosystems and wildlife. WWF-Australia, Sydney. (http://www.wwf.org.au/news_resources/?2750/Building-Natures-Safety-Net-2011-The-State-of-Protected-Areas-for-Australias-Ecosystems-and-Wildlife); and NSW Government Office of Environment and Heritage (2010), cited above.
18 NSW Government (2013) NSW 2021: A plan to make NSW number one. (http://www.2021.nsw.gov.au/)
19 Table 1 in Johnson et al. (2007), cited above.
ENDNoTES
WWF – NSW Native Vegetation Act saves Australian wildlife 2014

24
Endnotes
20 NSW Government Office of Environment and Heritage (2014) Public register. (http://www.environment.nsw.gov.au/vegetation/publicregister.htm)
21 NSW Government Office of Environment and Heritage (2014) Woody Change data (25m) for 1988-2010. (http://www.environment.nsw.gov.au/research/AncillaryVegetationProductsDataInventory.htm)
22 As of 1st January 2014 Catchment Management Authorities (CMA) joined with the Livestock Health and Pest Authorities and Department of Primary Industries agriculture extension to form Local Land Services. However, for purposes of mapping this administrative change is irrelevant.
23 Australian Government Department of Climate Change and Energy Efficiency (2011) Forest Extent and Change version 7.
24 NSW Government Office of Environment and Heritage (2014) Public register, cited above.
25 PSMA Australia Ltd (2013) CADLITE (http://www.psma.com.au/?product=cadlite).
26 Johnson et al. (2007), cited above.
WWF – NSW Native Vegetation Act saves Australian wildlife 2014


26 WWF – NSW Native Vegetation Act saves Australian wildlife 2014
WWF – NSW Clearing Ban Saves Native Mammals
WWF.orG.AUNSW NATIVE VEGETATIoN ACT SAVES AUSTrAlIAN WIlDlIFE 2014
GrEAT bArrIEr rEEFWWF has helped secure new highly protected
areas that help recovery of fish populations and which build the resilience of the reef system.
EArTh hoUrEarth Hour was co-founded by WWF-Australia and has evolved into one of the most recognised campaigns in history.
NINGAlooWWF has played a pivotal
role in securing sanctuaries within Ningaloo waters.
ANTArCTICA & ThE SoUThErN oCEAN
WWF continues to promote sustainable fisheries and to protect seabirds from
fishing and pest animals.
lANDClEArINGWWF has campaigned alongside farmers, industry, Indigenous communities and local and state governments to help see broadscale clearing of remnant bushland in Queensland significantly reduced.
SoUThWEST AUSTrAlIA ECorEGIoNWWF helped to ensure that some 5,000 hectares of globally important, privately-owned bushland in WA’s wheatbelt is protected.
Why we are here
wwf.org.au
To stop the degradation of the planet’s natural environment andto build a future in which humans live in harmony with nature.
©1986 Panda symbol WWF ® WWF is a registered trademark
WWF 35 years of advancing environmental protection in Australia
© n
as
a
WWF-Australia National Office
Level 1/1 Smail Street,Ultimo NSW 2007GPO Box 528 Sydney NSW 2001
Tel:+1800 032 [email protected]@WWF_Australiawwf.org.au