![De] zaibatsu al keiretsu. Organización y eficiencia productiva en la ...](https://static.fdocuments.net/doc/165x107/586eb5ce1a28ab9e228baab3/de-zaibatsu-al-keiretsu-organizacion-y-eciencia-productiva-en-la-.jpg)
De] zaibatsu al keiretsu. Organización y eficiencia productiva en la ...

Q2 2015 Presents the
Special Edition: Geography Report

Highlights
For the first time ever, we are able to report on the geographic differences over the last several years for the key metrics we’ve been reporting in the HALO Report™. Below are some of the highlights. Seed stage valuations have risen steadily over the last five years to an all time high of 3.95M (Median), a 30% increase over 2014. Round sizes in deals with only angel investors have grown from $800K in 2014 to over $1M year to date in 2015. All regions across the U.S. have seen increases in round size in the last 6 quarters. The largest increases in round sizes were in the Great Plains ($0.2 to $1.1M), Mid-Atlantic ($0.3M to $1.5M), and Northwest ($0.3M to $1.5M) regions. Over the last 5 years, California consistently completed the most investments, at 19.6% of the total, with New England (12.7%), and the Great Lakes (12.2%) following closely behind. Angel investing activity is equally distributed across the country when parsed either East and West or North and South at approximately 50% / 50%. Each region has different industry concentrations. California and New York have tended toward Mobile and Internet, while Texas has completed more investments in Food & Beverage than any other region. The Great Lakes tended toward Industrial and Healthcare, while New England and the Southeast maintain a relatively balanced “portfolio” across sectors.

Median and Mean Round Sizes – rounds with only Angels Round Size increase 25% 2015 YTD over 2014, but the mean has leveled off.
0.00
0.20
0.40
0.60
0.80
1.00
1.20
1.40
1.60
1.80
2010 2011 2012 2013 2014 2015 YTD
Mill
ions
USD
Median
Mean
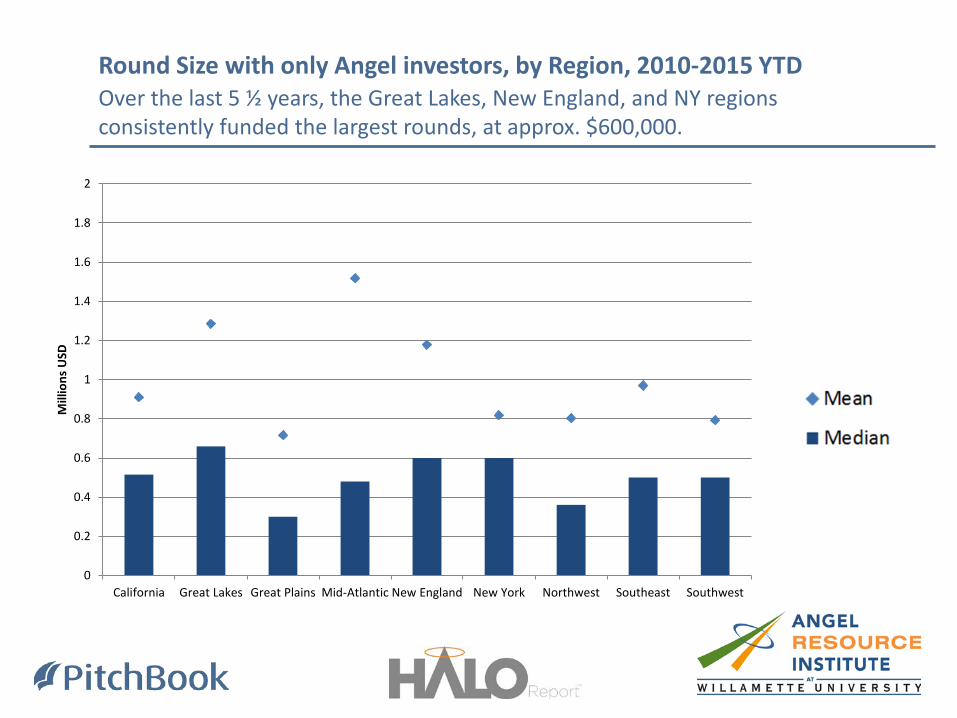
Round Size with only Angel investors, by Region, 2010-2015 YTD Over the last 5 ½ years, the Great Lakes, New England, and NY regions consistently funded the largest rounds, at approx. $600,000.
0
0.2
0.4
0.6
0.8
1
1.2
1.4
1.6
1.8
2
California Great Lakes Great Plains Mid-Atlantic New England New York Northwest Southeast Southwest
Mill
ions
USD

Round Size, with only Angels, 2010 - 2013 vs. 2014 - 2015 YTD Every region is doing larger angel only rounds in the most recent 6 quarters, particular growth in the Great Plains, Mid-Atlantic, and Northwest regions.
0
0.5
1
1.5
2
2.5
3
Mill
ions
USD

Round Size, Angels with Non-Angel Investors, 2010-2015 YTD Over the last 5 ½ years CA has done the largest rounds when VC’s were involved, with the Great Plains and Mid-Atlantic regions closely following.
0
0.5
1
1.5
2
2.5
3
3.5
4
Mill
ions
USD

Round Size, Angels with Non-Angel Investors, 2010-2013 vs. 2014-2015 YTD Great Lakes, New England, Southwest up significantly over the last 6 qtrs.
0
0.5
1
1.5
2
2.5
3
3.5
4
4.5
5
Mill
ions
USD

Median Seed Stage Pre-Money Valuation Pre-Money valuation continues to climb; has climbed consistently for the last 6 qtrs.
$0.30M
$10M
MEDIAN :
$3.95M
3rd Quartile:
$5.0M
1st Quartile:
$2.5M
$13.5M
3rd Quartile:
$4.4M
$3.0M MEDIAN :
1st Quartile:
$2.0M
$0.30M
2014 2015 YTD

0
1
2
3
4
5
6
7
8
9
10M
illio
ns U
SD
Median
Mean
Minimum $0.04M
1st Quartile $1.5M
Median $3M
’10-’15 YTD Overall Valuations
3rd Quartile $4.5M
Pre-Money Valuation by Region, Angels Only, 2010 - 2015 YTD Over the last 5 ½ years, the East Coast and SW have given the highest valuations

0
1
2
3
4
5
6
7
8
9
10M
illio
ns U
SD
Median
Mean
Pre-Money Valuation, Angels with Non-angel Co-Investors, 2010-2015 YTD Overall valuations in angel/VC rounds has a median of $3.9M over the last 5 ½ years.
Median $3.9M
Minimum $0.2M
1st Quartile $2.5M
3rd Quartile $6M
’10-’15 YTD Overall Valuations

Top 3 Angel Groups by Region, cumulative deals 2010-2015 YTD
California
Northwest
Southwest
Great Plains
New York New York Angels
Golden Seeds Clarion Capital
Northwest Alliance of Angels
Element 8 Oregon Angel Fund
California Tech Coast Angels Sand Hill Angels Keiretsu Forum
Great Plains St. Louis Arch Angels
Seed Step Angels Billiken Angel Network Southwest
Desert Angels AZ Tech Investor Forum
New Mexico Angels
Great Lakes WI Investment Partners
Hyde Park Angel Network Grand Angels
Northeast LaunchPad Venture Grp Cherrystone Angel Grp
Maine Angels
Mid-Atlantic Blue Tree Allied Angels Robin Hood Ventures
Dingman Center Angels
Southeast North KY Angel Inv Network
Investors' Circle Blu Venture Investors Texas
Central Texas Angel Network Houston Angel Network Baylor Angel Network

Cumulative Share of Angel Group deals by Region, 2010-2015 YTD CA is consistently the leader in deals in the U.S.; TX, the SW, and Great Lakes have seen increased activity in the first half of 2015.
California
19.6%
Northwest
7.1%
Southwest
6.1%
Great Plains
5.0%
Great Lakes
12.2%
Southeast
11.2%
Mid-Atlantic
7.7%
New England
12.7%
Texas
8.7%
New York
9.1%

Northwest
8.4%
Southwest
7.4%
Great Plains
3.8%
Great Lakes
15.9%
Southeast
13.5%
Mid-Atlantic
8.1%
New England
10.0%
Texas
9.9%
New York
4.9%
California
18.2%
Cumulative Angel Investment dollars by Region, 2010-2015 YTD While CA and New England have a consistent 28% of the dollars over the last 5 years, Great Lakes has been increasing significantly.

Share of Sector by Region, 2010-2015 YTD
0%
10%
20%
30%
40%
50%
60%
70%
80%
90%
100%
Food &Beverage
Software Industrial Mobile &Telecom
Healthcare Internet Other
Texas
Southwest
Southeast
Northwest
New York
New England
Mid-Atlantic
Great Plains
Great Lakes
California

About the HALO Report™

Understanding the Data: Special Round Types and Industry Sectors
The HALO Report™ provides analysis and trends on US angel and angel group activity.
Angels and angel groups invest alone, together, and with many other types of investors. Unless otherwise noted the HALO Report™ data includes all rounds that have at least one angel group participating and may include other types of investors in those rounds.
A few charts report on an “Angel Round,” a special classification of investment when angel groups invest alone or only with other angels and angel groups.
Unless otherwise noted, values of less than 1% in the industry sectors are included, but are not labeled directly.
Internet Mobile & Telecom Software Energy & Utilities Computer Hardware & Services Healthcare
Industrial Automotive & Transportation Business Products & Services Consumer Products & Services Electronics Environmental Services & Equipment
Financial Services Food & Beverages Leisure Media Metals & Mining Retail Risk & Security
HALO Report™ Industry Sectors

Angel Resource Institute at Willamette University Katie Hamburg, [email protected] The Angel Resource Institute (ARI) is a 501(c)(3)charitable organization devoted to education, mentoring and research in the field of angel investing, housed at Willamette University. ARI was founded by the Ewing Marion Kauffman Foundation, and is a sister organization of the Angel Capital Association, the professional association of angel groups in North America. The programs of ARI include educational workshops and seminars, research projects and reports, and information about angel investing for the general public. More information is available at: www.angelresourceinstitute.org PitchBook PitchBook is an impartial private equity and venture capital research firm that provides premium data, news and analysis. Through a combination of publicly available sources and rigorous firsthand research with industry professionals, PitchBook has developed an extensive database with in-depth information and statistics on hundreds of thousands of companies, deals, investors, service providers and limited partners. Willamette University MBA Willamette University MBA is a leader in early stage investment research and entrepreneurship. In addition to being the home of the Angel Resource Institute, Willamette launched the world’s first student run angel investment fund in 2008. Willamette faculty and researchers published the world’s largest and most cited study on angel investor returns, Returns to Angel Investors in Groups (2007), and one of the most widely used textbooks on entrepreneurship, Effectual Entrepreneurship (2011). They also preform data analysis for the HALO Report.
HALO Report™ Contact