WV WATERSHED ASSESSMENT PILOT PROJECT...December 2013 – Final reports & interactive web tool...
59
WV WATERSHED ASSESSMENT PILOT PROJECT Stakeholder & Partner Workshop, Nov. 13 th , 2013 Flatwoods Days Inn, WV Gauley River ©Kent Mason
Transcript of WV WATERSHED ASSESSMENT PILOT PROJECT...December 2013 – Final reports & interactive web tool...

WV WATERSHED ASSESSMENT PILOT PROJECT
Stakeholder & Partner Workshop, Nov. 13th, 2013 Flatwoods Days Inn, WV
Gauley River ©Kent Mason

Workshop Outline
Project Background Results presentations Web Tool demonstration

Project Background & Methodology

Project Objectives
Design and test a watershed assessment process that can be replicated in WV’s remaining watersheds
Find datasets & develop metrics to measure Current Condition/Function & Future Threats
Rank planning units in terms of Restoration & Protection Priorities
Provide a decision support tool to assist partners, stakeholders, and regulatory staff with decisions affecting aquatic resources
Identify data gaps & data needs

Project Study Area
5 HUC8 Watersheds: YEAR 1:
Monongahela Elk
YEAR 2: Gauley Little Kanawha Upper Guyandotte

Expanded Study Area

Project Process & Timeline
First 2 Watersheds: April 2011 – Project Start: Data Compilation June 2011 – Technical Advisory Team Meeting October 2011 – Expert Workshop #1 January 2012 – Expert Workshop #2 April 2012 – Stakeholder/Partner Workshop June 2012 – Draft Watershed Reports completed
Next 3 Watersheds: June 2012 – Start Data Compilation October 2012 - Expert Workshop #1 January 2013 – Expert Workshop #2 May 2013 - Stakeholder/Partner Workshop June 2013 – Draft Watershed Reports completed
Final 2 Watersheds (extended timeline) November 2013 – Stakeholder/Partner Workshop December 2013 – Final reports & interactive web tool completed

Watershed Characterization
Two Scales of Planning Units: HUC-12 watersheds Catchments

Planning Units 1: HUC12s

Planning Units 2: Catchments

NHDPlus Catchments (modified)

3 Models: Landscape Types
Stream/Riparian
Areas Wetlands Uplands

Wetland Buffer vs. Catchment
Wetland buffer (50 m) Wetland catchments (delineated using contributing NHDPlus catchments)

Model Structure
Hierarchical Structure: 3 Categories:
Current Condition/Function Streams Wetlands Uplands
Future Threats Opportunities
Several Indices per Category Multiple Metrics to define each index

STREAMS/RIPARIANPRIORITY MODEL
CURRENT CONDITION/ FUNCTION
Water Quality
Impaired streams (303d, AMD, TMDL)
Water quality parameters (pH,
sulfate, GLIMPSS, etc)
Land Use in riparian area (ag, graze,
developed, natural cover)
Percent imperviousness
Roads & Rail in riparian area
Surface Mining
Underground Mining
Wells
Water Quantity
Public Water Supply
Large Quantity Users
Wastewater Treatment Plants
Percent Imperviousness
Dam Drainage Area
Surface Mining
Underground Mining
Hydrologic connectivity
HeadwaterStreams
Local Integrity score
Wetland Area
Power Plants
Forested riparian area
Dams
Roads & Rail
Biodiversity
Rare Species in riparian area
Taxa Richness
Mussels
Habitat Types in riparian area
Calcareous Bedrock in riparian area
Non-Native Invasive Species in riparian
area
RiparianHabitat
Riparian land use (ag, graze, developed,
natural)
RBP Scores
Active Surface Mining in riparian area
Legacy Surface Mining in riparian
area
Wells in riparian area
Roads & Rail in riparian area
Metrics
Category Index
1 of 3 Models

Redundant Metrics
Perform Correlation Analysis to find highly correlated metrics
Performed on HUC12 analysis PCA: to find metrics with greatest impact on water
quality Eliminated several metrics

Metrics in Multiple Indices
Some metrics appropriate in multiple indices: Percent impervious cover Surface mining Oil and Gas wells Road/railroad density Landcover
Indices are rated independently of each other

Weighting
Some metrics influence condition more than others – need to weight accordingly
Weighting based on literature review, expert opinion, workshop discussions, and “best professional judgment”
Weighted both individual metrics and individual indices

Critical Metrics
Several metrics were identified that should “cap” the ranking for the entire index: Streams Water Quality Imperviousness, pH, Specific Conductance, Surface Mining
Streams Water Quantity Imperviousness
Streams Riparian Habitat Developed Area, Surface Mining
Wetlands Habitat Developed Area, Surface Mining
Uplands Habitat Connectivity Developed Area, Surface Mining
Uplands Habitat Quality Developed Area, Surface Mining

1. Streams & Riparian Areas 2. Wetlands 3. Uplands
Metrics: Condition/Function

Indices: Streams
CONDITION/ FUNCTION
Water quality Water quantity Hydrologic Connectivity Biodiversity Riparian Habitat

Water Quality Metrics
Impaired Streams (303(d), TMDL, AMD) DEP’s Water Quality Data (pH, sulfate, specific conductivity,
sedimentation & embeddedness scores) GLIMPSS Surface & Underground Mining Impervious Surface Landuse/Landcover:
Agricultural Grazed Natural Developed
Oil and Gas Wells Road/railroad density

Water Quantity/Flow Alteration Metrics
No good direct measurements for most streams, especially headwaters, had to find surrogates: Dam drainage area Impervious surface Large Quantity Users Public water supply intakes Mining: Surface & Underground

Hydrologic Connectivity Metrics
Percent riparian area with forested cover Power plants Roads/railroads in Riparian Area Percent of stream miles that are headwaters Wetland area

Biodiversity Metrics
Rare and threatened species (includes DNR’s SGNC species), including mussels, fish, crayfish, odonates
Maximum number of benthic macroinvertebrate taxa
Number of Habitat Types Non-native invasive species Mussel streams Calcareous bedrock

Riparian Habitat Metrics
Riparian land use Active & legacy surface mining Oil and gas wells Road/railroad density Pipelines, transmission lines, buildings RBP score

Indices: Wetlands
CONDITION/ FUNCTION
Water quality: Pollutant filtration/sediment retention
Hydrology: Flood storage/connectivity Biodiversity Wetland Habitat

Planning Units without Wetlands
Several planning units did not have mapped NWI wetlands
Null values for metrics dependent on presence of wetlands
Only 1 index had values for all planning units: Wetland Hydrology (presence of hydric soils)
Any planning units without hydric soils or mapped NWI wetlands were taken out of wetlands analysis

Water Quality Metrics (by catchment)
Forested headwater wetlands Landcover in wetland catchments (% ag, grazing,
urban, forested, natural) % imperviousness Roads/railroads Surface mining Oil & gas wells

Wetland Hydrology Metrics (by buffer)
Wetland area Hydric soils (potential for wetland restoration) Forested headwater wetlands Forested wetlands in floodplain Floodplain area

Indices: Uplands
CONDITION/ FUNCTION
Habitat Connectivity Upland Habitat Biodiversity

Habitat Connectivity metrics
Forest Block Sizes Local integrity score Active surface mining Oil & gas wells Road/railroad density Development Transmission lines, pipelines, wind turbines Timber harvests

Biodiversity Metrics
Rare and threatened species (includes DNR’s SGNC species)
Non-native invasive species Number of habitat types Calcareous bedrock Pests and Pathogens: Percent loss (basal area)

Energy Population/Development Climate Change
Metrics: Future Threats

Energy Metrics
Oil and Gas wells: well potential, proposed wells, Marcellus Shale thickness
Coal: unmined coal, unmined coal under permit Modeled wind potential Geothermal potential Proposed transmission lines, pipelines, power
plants, wind turbines

Population/Development Metrics
Future growth areas Development potential Proposed dams Future roads Population projections Proposed wastewater treatment plants

Climate Change Metrics
Resiliency and Current Density: TNC-generated datasets
Projected Temperature Change Projected Precipitation Change

1. Protected Lands 2. Priority Interest Areas
Metrics: Opportunities
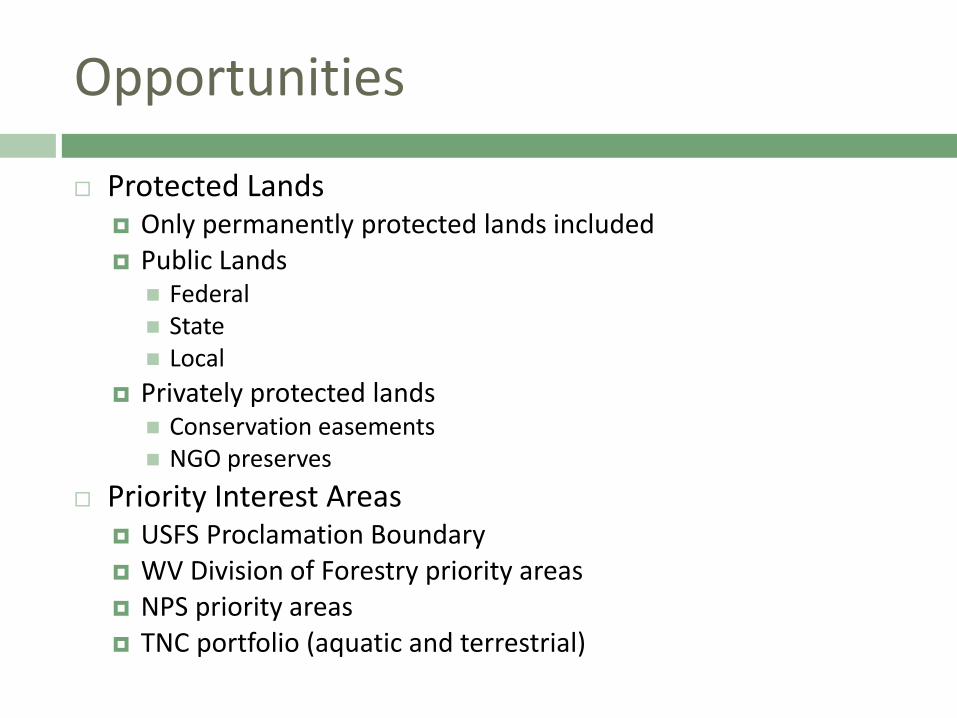
Opportunities
Protected Lands Only permanently protected lands included Public Lands Federal State Local
Privately protected lands Conservation easements NGO preserves
Priority Interest Areas USFS Proclamation Boundary WV Division of Forestry priority areas NPS priority areas TNC portfolio (aquatic and terrestrial)

Objective Analysis

Objective Analysis Categories
Very Good: Ecologically desirable status; requires
little intervention for maintenance Good: Indicator within acceptable range of variation;
some intervention required for maintenance Fair: Outside acceptable range of variation; requires
human intervention Poor: Restoration increasingly difficult; may result in
extirpation of target
Restoration Threshold

Objective Classification
Defined thresholds for each metric and assigned each planning unit to one of four categories: Very good Good Fair Poor
Used the DEP’s reference streams and stressed points to define thresholds – represent the “best” and “worst” catchments

Catchments with Reference and
Stressed Streams

Objective Ranking Methodology
Calculated metrics for stressed and reference catchments separately Reference catchments defined thresholds for very
good/good categories Stressed catchments defined thresholds for fair/poor
categories
Each metric received an objective score Averaged metric scores (by weight) for index
scores

Objective Ranking Methodology
Reference Catchments
Stressed Catchments
All Catchments
Higher Quality
POOR FAIR GOOD VERY GOOD

Index and Model Results

Stream Index Rollup to Model
Ranking
Water Quality Biodiversity Water Quantity
Riparian Habitat Hydrologic Connectivity

STREAMS/RIPARIANPRIORITY MODEL
CURRENT CONDITION/ FUNCTION
Water Quality
Impaired streams (303d, AMD, TMDL)
Water quality parameters (pH,
sulfate, GLIMPSS, etc)
Land Use in riparian area (ag, graze,
developed, natural cover)
Percent imperviousness
Roads & Rail in riparian area
Surface Mining
Underground Mining
Wells
Water Quantity
Public Water Supply
Large Quantity Users
Wastewater Treatment Plants
Percent Imperviousness
Dam Drainage Area
Surface Mining
Underground Mining
Hydrologic connectivity
HeadwaterStreams
Local Integrity score
Wetland Area
Power Plants
Forested riparian area
Dams
Roads & Rail
Biodiversity
Rare Species in riparian area
Taxa Richness
Mussels
Habitat Types in riparian area
Calcareous Bedrock in riparian area
Non-Native Invasive Species in riparian
area
RiparianHabitat
Riparian land use (ag, graze, developed,
natural)
RBP Scores
Active Surface Mining in riparian area
Legacy Surface Mining in riparian
area
Wells in riparian area
Roads & Rail in riparian area
Metrics
Category Index
1 of 3 Models


Wetlands Index Results
White hatched: no NWI wetlands but wetland hydrology present: candidates for restoration White: No wetlands or wetland hydrology present: not considered in wetland model

Wetlands Overall Model Results
Hatched: no NWI wetlands but wetland hydrology present: candidates for restoration Gray: No wetlands or wetland hydrology present: not considered in wetland model

Consolidated Analysis Results

Project Outputs
Watershed assessment reports
Will include specific priorities and strategies, as well as detailed methodology, references and lessons learned
Interactive web mapping application
A spatial decision support tool to assist stakeholders in identifying target areas, strategies and actions

Word of Caution for Users
This is purely a GIS-based analysis with no field verification
Suggested Strategy for selecting potential protection/restoration sites: Select several candidate planning units using the GIS
tool Conduct site visits to evaluate current conditions on
the ground Make final decision based on results from GIS analysis
and site visits

Interactive Web Mapping Application
Desktop tool that will allow users to: View the various datasets in one application View results of all scores and rankings Develop customized scenarios to rank target
areas for restoration and/or protection projects according to users’ priorities
Anticipated audience: regulatory agencies, watershed associations, non-profit organizations

Documents on Conservation Gateway

Partners US Environmental Protection Agency WV Department of Environmental Protection Many individuals from several agencies, organizations, watershed associations:
US Geological Survey US Army Corps of Engineers US Office of Surface Mining US Department of Agriculture - NRCS WV Division of Natural Resources WV Geological and Economic Survey Region 3 Intergovernmental Council The Conservation Agency Trout Unlimited West Virginia University Marshall University WV Rivers Coalition WV Land Trust Canaan Valley Institute Potesta & Associates Triad Engineering Morgantown Utility Board Several Watershed Organizations

THOUGHTS/SUGGESTIONS?
Elk River at Birch Run, WV ©www.over-land.com