WRT CaBA/CRF Conference 02/12/14 - Peter Downs
18
Addressing habitat failures through gravel augmentation: assessment for adaptive management Peter W. Downs & thanks to John Hickey, Matt Healey Alastair Morriss, John Jepps Claire Bithell, Nick Jackson, Josh Moore, Sarah Mortimore, Greg Rushby, Sarah Twohig AERIP SHRIMP
-
Upload
westcountry-rivers-trust -
Category
Environment
-
view
39 -
download
0
Transcript of WRT CaBA/CRF Conference 02/12/14 - Peter Downs

Addressing habitat failures through
gravel augmentation: assessment for adaptive management
Peter W. Downs
& thanks to John Hickey, Matt Healey
Alastair Morriss, John Jepps Claire Bithell, Nick Jackson, Josh Moore,
Sarah Mortimore, Greg Rushby, Sarah Twohig
AERIP SHRIMP

NRC 1992
1. Problems of water quantity and flow-mistiming
2. Morphological modifications of the channel and riparian zone
3. Excessive erosion and sedimentation 4. Deterioration of sediment quality
5. Deterioration of water quality (chemical and physical)
6. Introduction and invasive spread of alien species

1. Water quantity & flow mis-timing
2. Morphological modifications channel / riparian zone (3. Excessive erosion/ sedimentation)
4. Sediment quality deterioration
5. Water quality deterioration

•gravel quality (permeability) •gravel mobility (redd scour) •redd dewatering
•spawning habitat availability •spawning habitat quality
•in migration flows
•physical migration barriers
•migration hazards
•juvenile habitat availability
•proximity of fry rearing habitat to spawning areas
•flows: stranding or displacement
•food availability •water quality
•out migration flows •predation •diversion hazards
•loss of estuarine rearing habitat
•water quality •harvest •ocean conditions
The salmonid challenge: Limiting factors are often linked to bed sediment

Non-structural preservation and natural recovery
Improving network connectivity: restore flow and sediment processes
Improve habitat diversity by prompted recovery
Improve habitat diversity by reconstructing channel & floodplain
Sustainable?
Less Sustainable?

The Aim: Prompt river towards ecological integrity
The Goal: Add a supply that is mobile (but not too mobile) to achieve spawning / rearing parameters
Severity of issue – balance between: lifecycle requirements of valued species (‘known’) magnitude of habitat alteration (‘unknown’)
Magnitude of alteration - reach-scale changes: in channel morphology in sediment supply and transport dynamics
Facilitates understanding of specific requirements need for complementary measures evaluation and learning
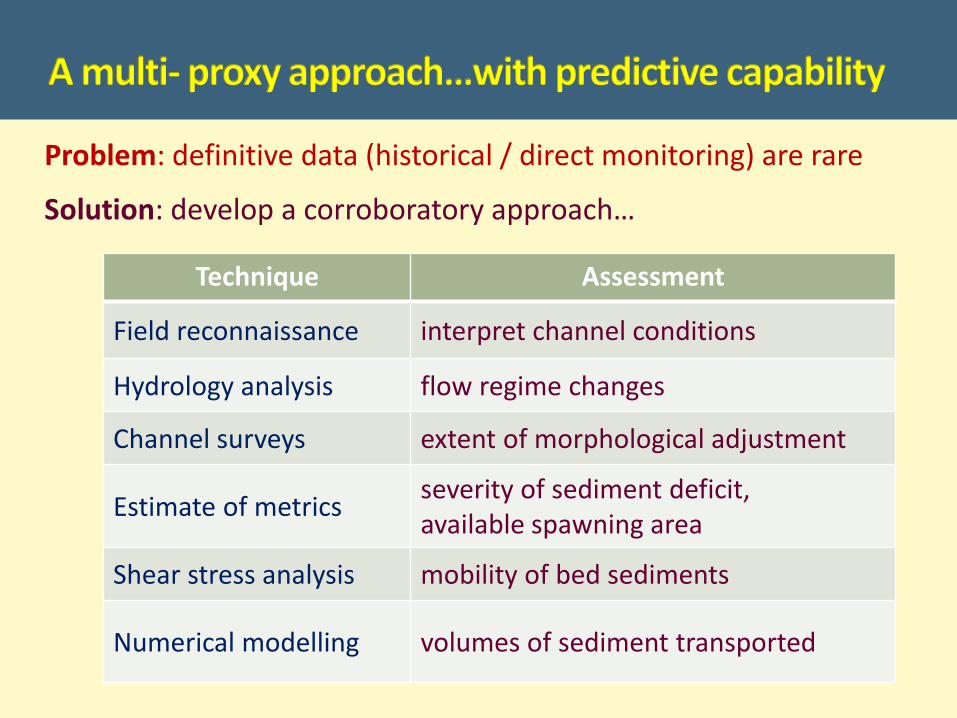
Problem: definitive data (historical / direct monitoring) are rare
Solution: develop a corroboratory approach…
Technique Assessment
Field reconnaissance interpret channel conditions
Hydrology analysis flow regime changes
Channel surveys extent of morphological adjustment
Estimate of metrics severity of sediment deficit, available spawning area
Shear stress analysis mobility of bed sediments
Numerical modelling volumes of sediment transported

Upton
Pulham Withiel Florey

Paucity of alluvial material, subtle morphological response, shallow depth to bedrock, very coarse sediments, reduced discharges, greatly reduced sediment supply
Brandt 2000

The current Q1.5 peak discharge is ~50–65% of pre-dam magnitude using FEH area-based methods; flow duration statistics depend on position within the catchment…
Just below dam
Below unregulated tributary
Reservoir only holds 75% of average annual runoff – spills frequently in wet years…

Reach Area
regulated Pre-dam Q1.5-Q2
Post-dam Q1.5-2
Overtopping flood
Post-dam flow
contained % m3s-1 m3s-1 m3s-1 RI
Just below dam 98.1 9.0 – 11.3 5.0 – 5.7 6.3 – 6.8 2.5 – 3.0
In mid-catchment 57.5 14.7 – 18.4 8.7 – 10.9 21.6 – 26.9 40 – 100+
Lower catchment 49.7 16.6 – 20.7 10.6 – 13.2 11.5 – 16.3 1.75 – 4
Morphological response is reach-differentiated, but indicates significant enlargement of mid-valley cross-sections

Wolman bed surface samples: Bed is coarser below the dam,
suggests loss of finer material
Shear stress estimates : Sediment was more mobile, pre-
dam, but Current Q1.5 capable of moving
D50 in all reaches Suggests selective winnowing of
finer material, esp. below dam

Present potential for morphological adjustment (Schmidt & Wilcock 2008)
Sediment Deficit
Potential Incision
Potential Narrowing
Threshold <1 >0.4 <0.4
Below dam 0.27 0.16 0.50
Mid-valley 0.72 0.12 0.59
Lower valley 0.58 0.08 0.64
Empirical studies (Atlantic salmon and brown trout) - preferred D50 = 30 mm
Haddeo D50 = 57-68 mm ~50% bed in excess of preferred size
Spawning area impact (Riebe et al 2014)…
Below dam reach
Useable Area
Fish size 400 mm 600 mm
Pre-dam 74 86
Post-dam 48 69

BAGS software: Pitlick et al. 2009: potential transport rates 5–8–times higher than present day. Below dam and lowest reaches the volumetric potential is negligible, except during peak flows of moderate floods and larger
446
3
5
193
133
150 31
1
Wilcock-Crowe equations
Pre-dam
Post-dam

Impacts are very different to dammed alluvial systems with finer sediments…
Below dam: mild erosion of bed and banks, loss of bedforms, spills permit bed mobility, coarsening bed increases roughness, loss of alluvial material, significant impact for smaller spawners, slow rate of further change
Mid-valley: significant channel capacity increases, mostly by width, adjusting to new sediment regime, possible loss of alluvial material, stabilisation of deposits as islands, future coarsening during contained large floods
Lower valley: channel may be adjusting to changed conditions due to material supply from upstream and alluvial floodplain

Transport simulation allows optimization of (S, D50, n): 1. Salmonid spawning preferences (16-64 mm) 2. Offset sediment loss since dam closure (finer than required) 3. Feasible volumes of annual augmentation (50-100 t a-1) 4. Relatively stable during incubation (barely mobile)
Reach Sediment mix Roughness Transport
D50 D84 ‘n’ t a-1
Below dam 1 36 (68) 62 (112) 0.060 (0.051) 30-94
Below dam 2 48 (68) 81 (112) 0.051 23-57
Mid-valley 36 (59) 62 (107) 0.060 (0.043) 45-137
Lower valley 29 (57) 56 (96) 0.041 19-75
Challenge is often flushing flows; here is to retain sediment, use logs / boulders wet years capable of moving hundreds of tonnes of sediment
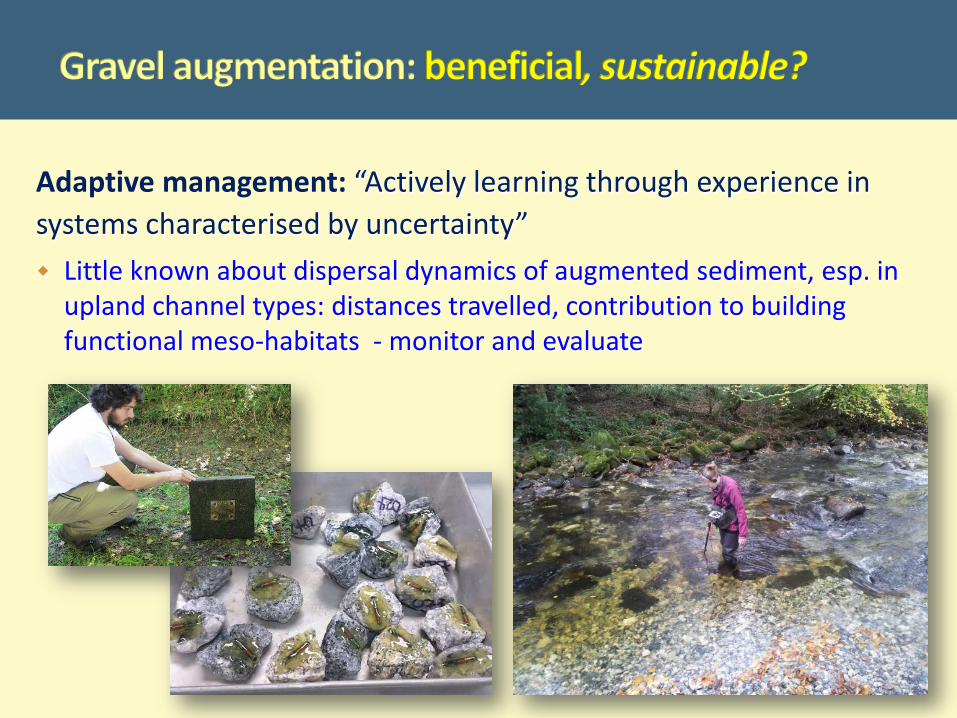
Adaptive management: “Actively learning through experience in systems characterised by uncertainty” Little known about dispersal dynamics of augmented sediment, esp. in
upland channel types: distances travelled, contribution to building functional meso-habitats - monitor and evaluate

Analysis of contemporary sediment supply and transport dynamics in a historical context and future projections
Multiple lines of evidence offset common data deficiencies Allows WHAT IF scenario setting
Amenable to integrated monitoring and evaluation as basis for improving future practice…a contribution to sustainable practices
Allows ‘complexity’: a strategy of bravery lying on the boundary between order (cowardice) and chaos (recklessness) (Geldof, 1995)
A rapid, robust approach to augmentation planning: