Writing and Reviewing Abstracts Society for Epidemiologic Research – Student Caucus.
34
Writing and Reviewing Abstracts Society for Epidemiologic Research – Student Caucus
-
Upload
juniper-knight -
Category
Documents
-
view
235 -
download
3
Transcript of Writing and Reviewing Abstracts Society for Epidemiologic Research – Student Caucus.

Writing and Reviewing Abstracts
Society for Epidemiologic Research – Student Caucus

What is an abstract?
Concise summary of a full scientific research project describing the study and its results
Abstracts generally include the most important aspects of the study’s purpose, design, findings, and implications
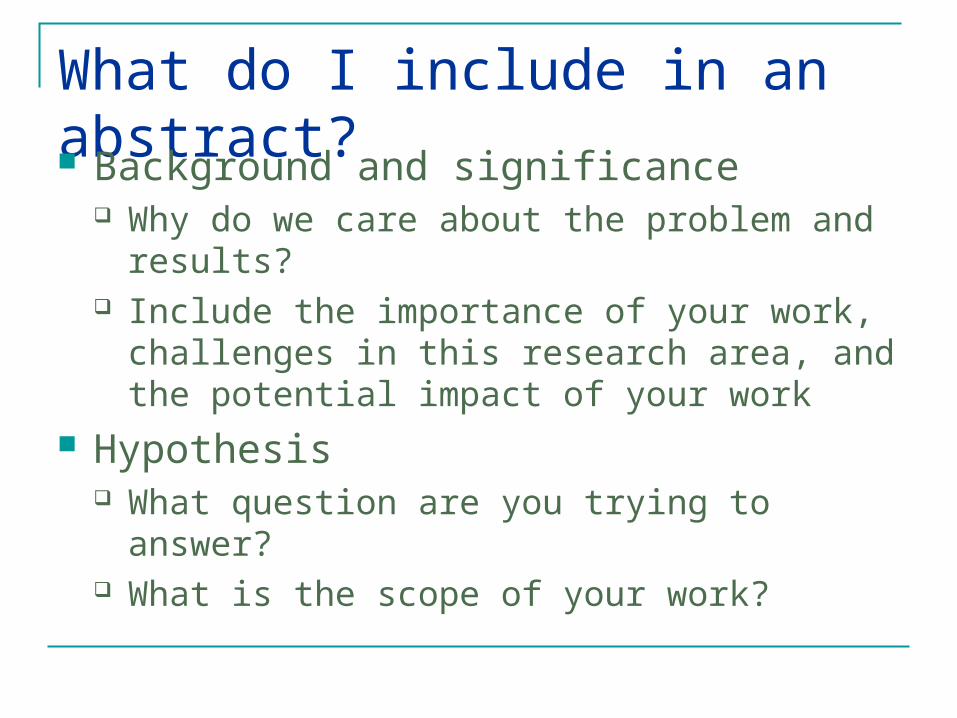
What do I include in an abstract? Background and significance
Why do we care about the problem and results? Include the importance of your work, challenges in
this research area, and the potential impact of your work
Hypothesis What question are you trying to answer? What is the scope of your work?
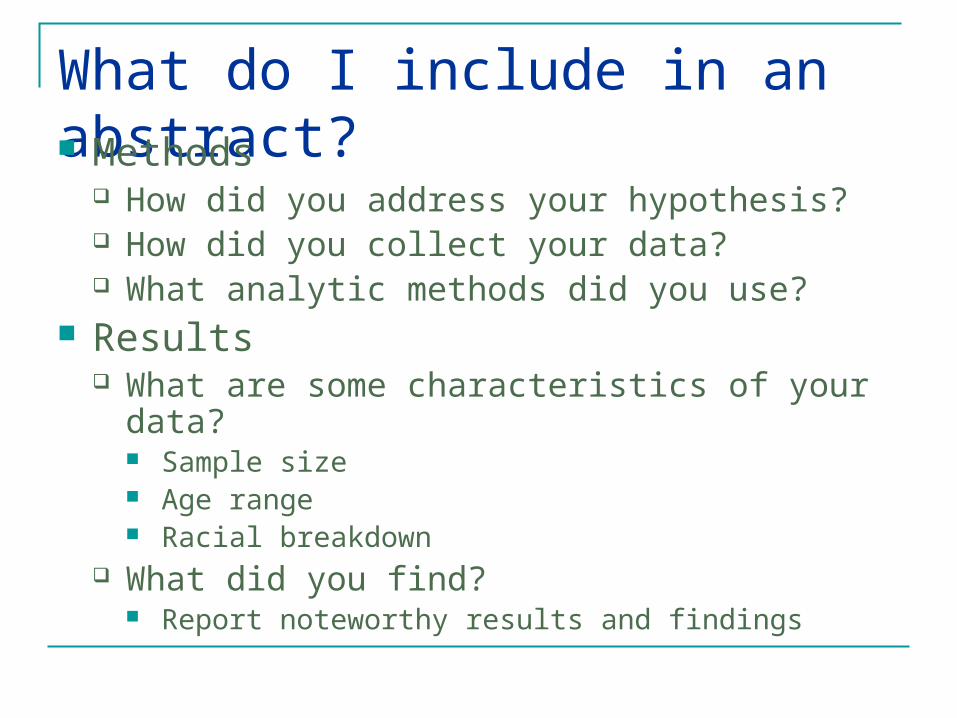
What do I include in an abstract? Methods
How did you address your hypothesis? How did you collect your data? What analytic methods did you use?
Results What are some characteristics of your data?
Sample size Age range Racial breakdown
What did you find? Report noteworthy results and findings
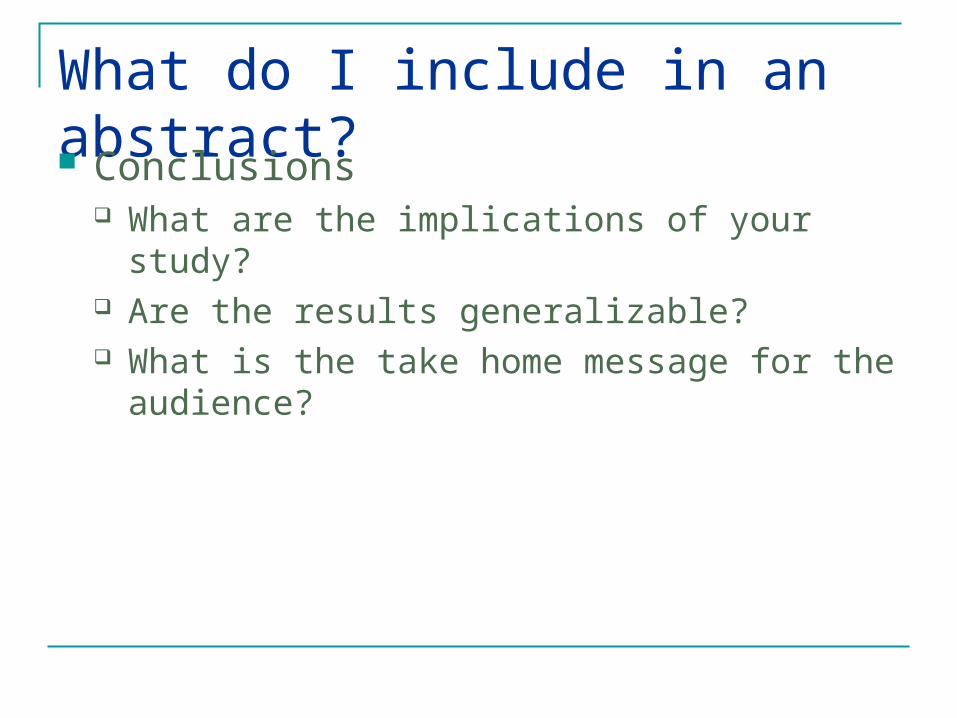
What do I include in an abstract? Conclusions
What are the implications of your study? Are the results generalizable? What is the take home message for the
audience?
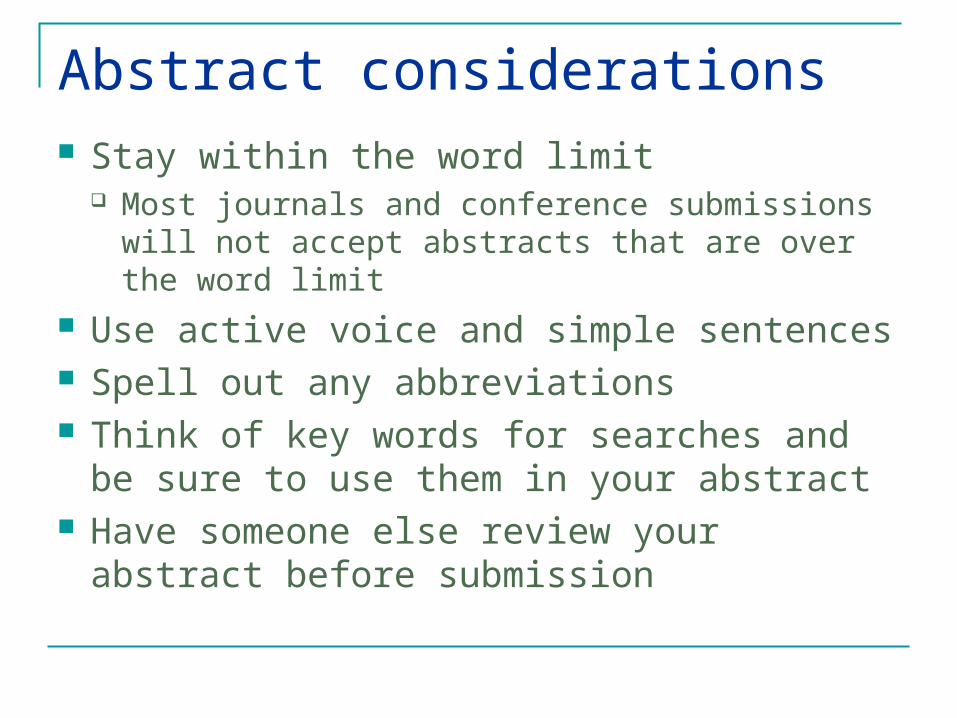
Abstract considerations Stay within the word limit
Most journals and conference submissions will not accept abstracts that are over the word limit
Use active voice and simple sentences Spell out any abbreviations Think of key words for searches and be sure
to use them in your abstract Have someone else review your abstract
before submission

Example Abstracts
Disclaimer: Abstract reviews are the opinions of the SER-SC Executive Board
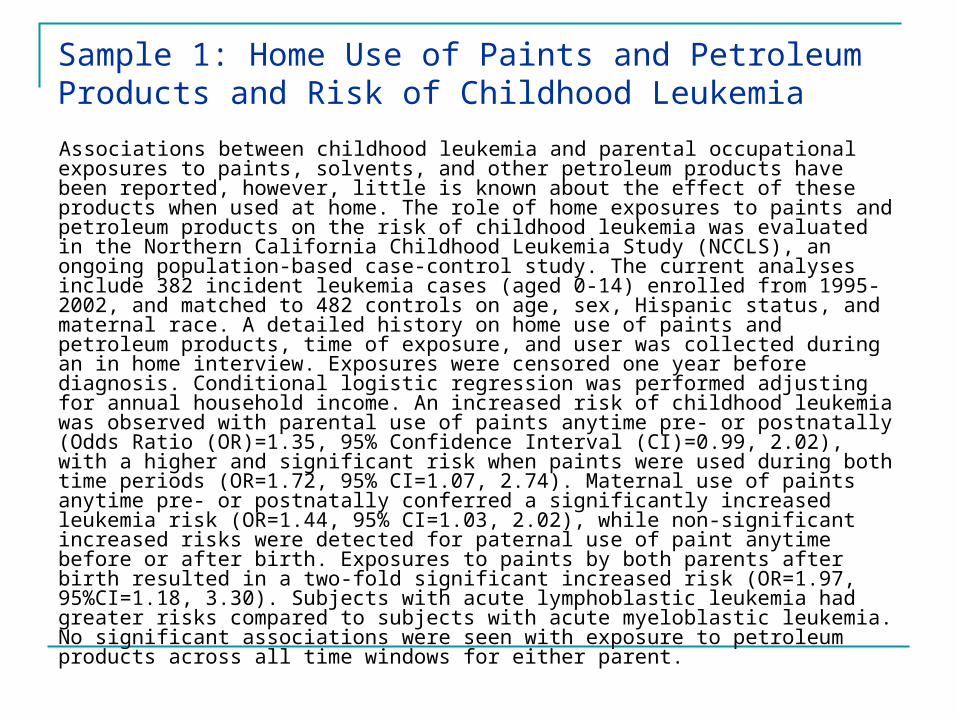
Sample 1: Home Use of Paints and Petroleum Products and Risk of Childhood Leukemia
Associations between childhood leukemia and parental occupational exposures to paints, solvents, and other petroleum products have been reported, however, little is known about the effect of these products when used at home. The role of home exposures to paints and petroleum products on the risk of childhood leukemia was evaluated in the Northern California Childhood Leukemia Study (NCCLS), an ongoing population-based case-control study. The current analyses include 382 incident leukemia cases (aged 0-14) enrolled from 1995-2002, and matched to 482 controls on age, sex, Hispanic status, and maternal race. A detailed history on home use of paints and petroleum products, time of exposure, and user was collected during an in home interview. Exposures were censored one year before diagnosis. Conditional logistic regression was performed adjusting for annual household income. An increased risk of childhood leukemia was observed with parental use of paints anytime pre- or postnatally (Odds Ratio (OR)=1.35, 95% Confidence Interval (CI)=0.99, 2.02), with a higher and significant risk when paints were used during both time periods (OR=1.72, 95% CI=1.07, 2.74). Maternal use of paints anytime pre- or postnatally conferred a significantly increased leukemia risk (OR=1.44, 95% CI=1.03, 2.02), while non-significant increased risks were detected for paternal use of paint anytime before or after birth. Exposures to paints by both parents after birth resulted in a two-fold significant increased risk (OR=1.97, 95%CI=1.18, 3.30). Subjects with acute lymphoblastic leukemia had greater risks compared to subjects with acute myeloblastic leukemia. No significant associations were seen with exposure to petroleum products across all time windows for either parent.
Why is sample 1 a good abstract? Used active voice Indicated the importance of their study Described the larger study, years of use, and sample
size Included information on study design and matching
variables Provided statistical methods and used appropriate
methods to analyze matched data Described results and appropriate conclusions
What could have improved this abstract? Including summary conclusions
Sample 2: Association between body composition and blood pressure in a contemporary cohort of 9-year old childrenBackground: Elevated blood pressure in children is an early risk factor for cardiovascular disease and is associated with body mass index (BMI). However as BMI does not distinguish between fat and lean, little is known about the relationship of blood pressure in children to different elements of body composition. Objective: This study aimed to investigate the association of blood pressure with total body fat, lean mass and trunk fat in a cohort of 9-year-old children. Design: Blood pressure, BMI and body composition were measured in 6, 863 children enrolled in the Avon Longitudinal Study of Parents and Children (ALSPAC). Fat mass, lean mass and trunk fat were assessed using dual-energy X-ray absorptiometry (DXA). Results: Total body fat and BMI were strongly associated with systolic blood pressure (SBP) [β=3.50, 95%CI 3.27 to 3.74 mmHg/standard deviation (SD) and β=3.96, 95%CI 3.76 to 4.16 mmHg/SD, respectively] and weakly associated with diastolic blood pressure (DBP) (β=1.39, 95% CI 1.22 to 1.57 mmHg/SD and β=1.37, 95% CI 1.22 to 1.52 mmHg/SD, respectively). SBP was also positively associated with lean mass (β=3.60, 95% CI 3.22 to 3.97 mmHg/SD) and trunk fat (β=2.14, 95% CI 0.82 to 3.46 mmHg/SD, independent of total fat mass). Conclusion: Blood pressure in 9-year-old children is independently associated with fat mass and lean mass and, to a lesser extent, trunk fat. In this analysis, because both fat and lean mass are associated with blood pressure, BMI predicts blood pressure at least as well as these components of body composition.
Why is sample 2 a good abstract? Authors Used active voice and divided the abstract by section Indicated the importance of their study Included their study objective Described the study sample and measurements Described results Provided appropriate conclusions
What could have improved this abstract? Description of the analytical methods Inclusion of methods for measure and control of
potential confounding factors
Sample 3: A Major Determinant of Recent Increases in HIV Incidence Among Men who Have Sex with Men (MSM) in British Columbia (BC): Deferred Initiation of Antiretroviral Therapy
Background: Recent clinical guidelines endorse deferral of highly active antiretroviral therapy (HAART) until later in the course of HIV infection. The effect of this change on population levels of high viremia, infectivity and, in turn, sexual transmission of HIV is unknown. Objectives: Describe populational trends in HIV viremia among MSM in BC in relation to a 1999 change that deferred HAART from CD4 <500 to CD4 <200 cells/mL. Estimate relative increases in annual HIV diagnoses among MSM attributable to this change. Methods: Linked provincial registries provided records of all HAART, CD4 counts, and plasma HIV RNA viral load (pVL) determinations from 1997-2003. We assessed trends in MSM with high viremia (pVL >10 000 copies/mL) across 6-month intervals. Mathematical models predicted relative changes in infections among MSM following introduction and deferral of HAART. Results: The number and proportion of highly viremic MSM declined steadily [from 443 (27.6%)] for two years following introduction of HAART. This trend has reverted, increasing from 358 viremic MSM (17.8%) in the second half of 1999 to 713 (26.7%) at the end of 2003; the increase occurred among men with CD4 >200. Models predicted a 50% reduction in HIV diagnoses among MSM from 1997-1999 but rapid 83% increase following deferral of HAART. Conclusion: Deferral of therapy appears to be a major determinant of the 75% increase in annual HIV diagnoses among MSM in BC from 1999-2004. Substantial increases in HIV prevention among MSM seem warranted.
Why is sample 3 a good abstract? Authors Used active voice and defined acronyms Divided the abstract by section Indicated the importance of their study Described their objective Included information on their sample and study period Described results and methods
What could have improved this abstract? Sample size information More detailed data collection methods
Overall Summary of Sample Abstracts All abstracts were under the 250 word limit All authors used active voice Defined any acronyms used All abstracts included background and
importance information Described their study population, methods,
and results Provided appropriate conclusions for their
results

Reviewing an Abstract

How to Review an Abstract? Questions to consider when reviewing an
abstract Is the work appropriate for the journal or
conference? At conferences, there is usually a theme or multiple
areas of science that are sought Journals have specific aims and goals
Is the work original? Is the work complete?
Is the work ready to publish or present at a conference? Are the results complete?
How to Review an Abstract? Did the authors describe the important
features of an abstract? Background and significance Hypothesis Methods
Data collection methods Sample size and population information Analytic techniques
Results Demographic characteristics of sample Significant results
Conclusions
Deciding Between a Poster or Oral Presentation If you are asked to determine what type of
acceptance an abstract should receive Ask for guidelines from the conference organizers Other considerations
What is the conference theme? If so, does the abstract address the theme?
Are there special topic areas for the conference? If so, does the abstract address any of these
Is the quality of the abstract above others reviewed?

Practice Abstract Review
Abstract Evaluation Guidelines Assumptions:
Reviewing for Society for Epidemiologic Research (SER) Conference
Areas of interest epidemiology, biostatistics, and public health
Did the author include the important components of an abstract
Follow the review outline provided in slides 19 and 20
Review Sample 1: Bayesian propensity score analysis for observational data
Propensity scores analysis (PSA) involves regression adjustment for the estimated propensity scores, and the method can be used for estimating causal effects from observational data. However, confidence intervals may be falsely precise because PSA ignores uncertainty in the estimated propensity scores. We propose Bayesian propensity score analysis (BPSA) for observational studies which involve a binary exposure, binary outcome and measured confounders. The method uses hierarchical modelling with the propensity score as a latent variable. The first level models the relationship between the outcome, exposure and propensity score, while the second level models the relationship between the propensity score and measured confounders. Markov chain Monte Carlo is used to study the posterior distribution of the exposure effect. Our objective is to implement BPSA using computer programs and investigate the performance of BPSA compared to PSA using Monte Carlo simulations. Synthetic datasets, of sample size n=250, 1000, 4000, were simulated by computer for various realistic parameter values. The datasets were analyzed using BPSA and PSA, and we estimated the coverage probability of 80% credible intervals. The estimated coverage probabilities ranged from 78% to 84% for BPSA, and from 42% to 82% for PSA, with simulation standard errors less than 2%. The simulation results indicate that BPSA provides improved inferences for exposure effects compared to PSA, in the sense that interval estimators have the correct frequentist coverage levels under repeated sampling of the data. We demonstrate BPSA in an observational study of the effect of statin therapy on all-cause mortality in patients discharged from hospital following acute myocardial infarction.
Abstract Evaluation: Review Sample 1 Is the work appropriate for the SER
conference? Yes – this describes analytic methods that can be
used for epidemiology studies Is the work original?
Yes - the authors developed a more appropriate method to calculate confidence intervals
Is the work complete? Yes – the authors simulated data to test their
hypothesis
Abstract Evaluation: Review Sample 1 Are the major components included? Background and significance?
Yes – the authors described the need for their work and why it is important
Hypothesis? Yes – they proposed the use of Bayesian propensity score
analysis (BPSA) for observational studies which involve a binary exposure, binary outcome and measured confounders
Methods? Yes – they described how they were going to address the
hypothesis above
Abstract Evaluation: Review Sample 1 Results?
Yes – the authors described their results and the accuracy of their measures
Conclusions? Slightly unclear – “We demonstrate BPSA in an
observational study of the effect of statin therapy on all-cause mortality in patients discharged from hospital following acute myocardial infarction. “
No where else in the abstract do they mention the use of these methods for the effect of statin therapy
Thus, the conclusions may not be appropriate
Overall: Good abstract and would accept it and point out concern about conclusions to authors
Review Sample 2: Exposure to H. pylori-positive siblings and persistence of H. pylori infection in early childhood H.pylori infection is a common chronic infection, yet transmission pathways are
unclear; evidence suggests that siblings play a role in transmission. Transient H.pylori infection is observed in children, but determinants of persistence are unknown. We examine the effect of exposure to H.pylori-positive siblings on the establishment of persistent H.pylori infection using data from the Pasitos Cohort Study, which recruited pregnant women from maternal-child clinics in El Paso, Texas, and Juarez, Mexico during 1998-2000 and followed 472 children after birth to identify predictors of H.pylori infection. Infection was detected at target intervals of 6 months in index children and younger siblings born during follow-up, using the 13C-urea breath test (UBT) corrected for variation in CO2 production. We used proportional hazards regression to estimate hazard ratios for the effect of having H.pylori-positive younger siblings on the rate of developing a persistent H.pylori infection in index children with 1+ younger siblings. Persistent infection was defined as 3 consecutive positive UBT results. We modeled two exposure definitions: infected younger sibling (1+ younger siblings with 1+ positive UBT results); persistently infected younger sibling (1+ younger siblings with a persistent infection). Adjusting for mom's education (the strongest H.pylori risk factor in this cohort), the hazard ratio was 4.0 (95% CI=1.8,8.2) for infected younger sibling and 9.3 (95% CI=3.2,26) for persistently infected younger sibling. Having H.pylori-positive younger siblings, particularly with persistent infection, was strongly associated with developing persistent H.pylori infection in this cohort.
Abstract Evaluation: Review Sample 1 Is the work appropriate for the SER
conference? Yes – study describes an important infectious
disease Is the work original?
Yes – the authors are looking at an area of this infection that is not well understood
Is the work complete? Yes – the authors analyzed existing data to address
their question
Abstract Evaluation: Review Sample 1 Are the major components included? Background and significance?
Yes – the authors described the need for their work and why it is important
Hypothesis? Yes – the authors examined the effect of exposure to
H.pylori-positive siblings on the establishment of persistent H.pylori infection
Methods? Yes – authors described their study population, defined their
study variables, and included the analytical methods used to address the hypothesis
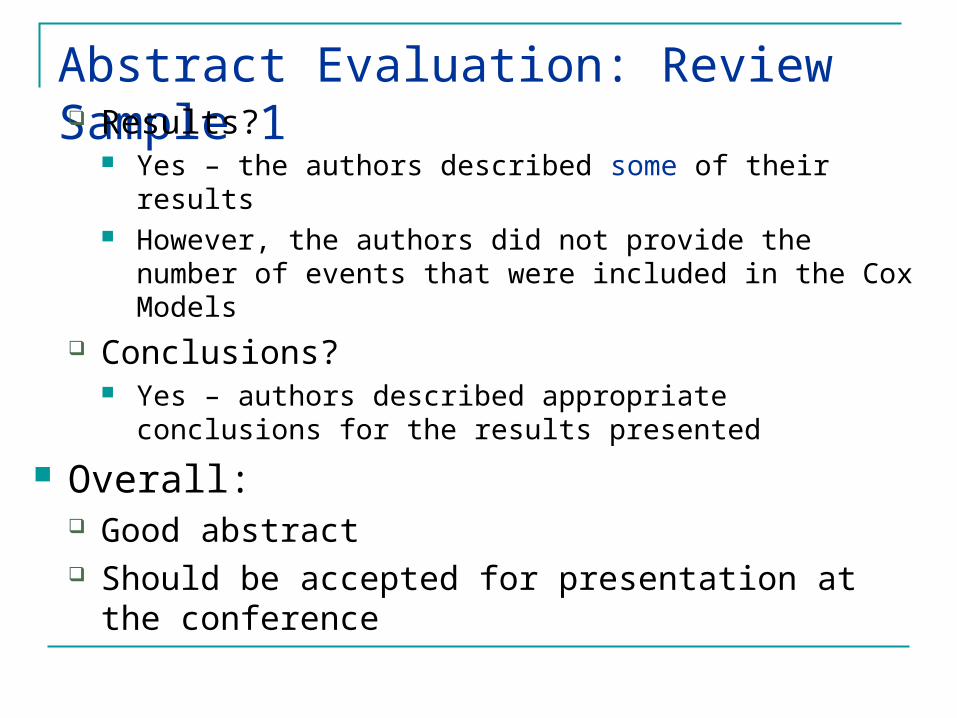
Abstract Evaluation: Review Sample 1 Results?
Yes – the authors described some of their results However, the authors did not provide the number of events
that were included in the Cox Models Conclusions?
Yes – authors described appropriate conclusions for the results presented
Overall: Good abstract Should be accepted for presentation at the
conference
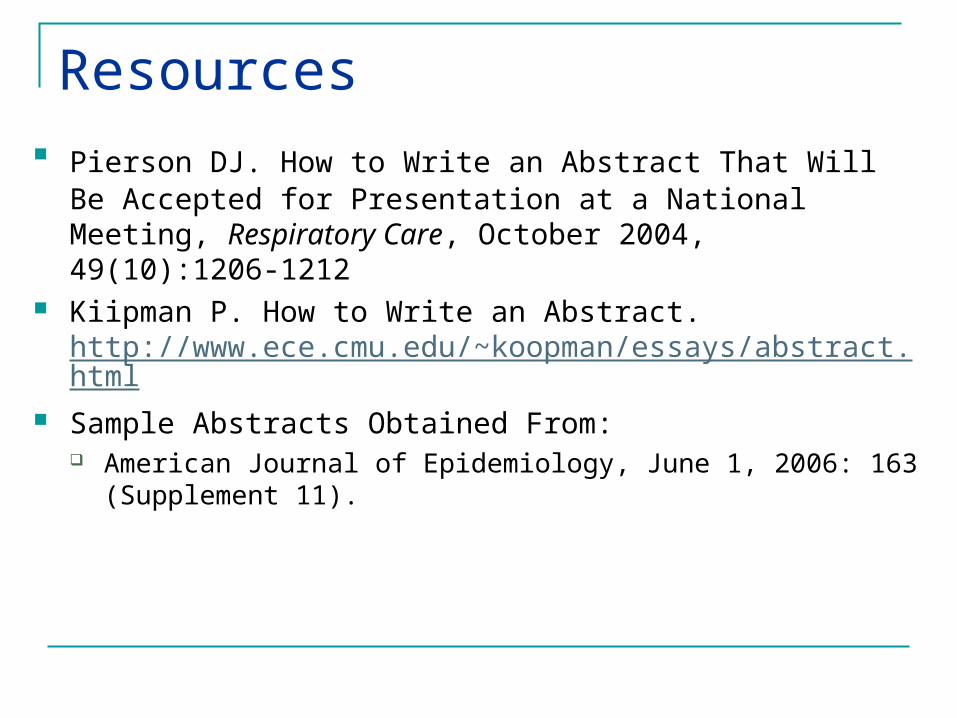
Resources Pierson DJ. How to Write an Abstract That Will Be Accepted for
Presentation at a National Meeting, Respiratory Care, October 2004, 49(10):1206-1212
Kiipman P. How to Write an Abstract. http://www.ece.cmu.edu/~koopman/essays/abstract.html
Sample Abstracts Obtained From: American Journal of Epidemiology, June 1, 2006: 163 (Supplement
11).

Appendix:Additional Abstracts
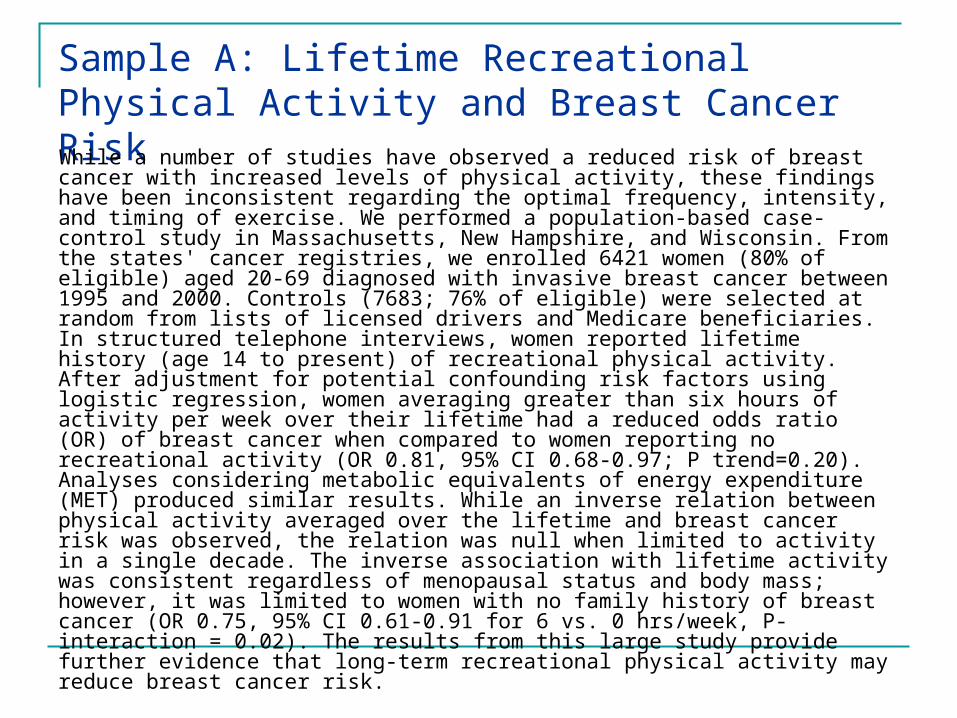
Sample A: Lifetime Recreational Physical Activity and Breast Cancer RiskWhile a number of studies have observed a reduced risk of breast cancer with increased levels of physical activity, these findings have been inconsistent regarding the optimal frequency, intensity, and timing of exercise. We performed a population-based case-control study in Massachusetts, New Hampshire, and Wisconsin. From the states' cancer registries, we enrolled 6421 women (80% of eligible) aged 20-69 diagnosed with invasive breast cancer between 1995 and 2000. Controls (7683; 76% of eligible) were selected at random from lists of licensed drivers and Medicare beneficiaries. In structured telephone interviews, women reported lifetime history (age 14 to present) of recreational physical activity. After adjustment for potential confounding risk factors using logistic regression, women averaging greater than six hours of activity per week over their lifetime had a reduced odds ratio (OR) of breast cancer when compared to women reporting no recreational activity (OR 0.81, 95% CI 0.68-0.97; P trend=0.20). Analyses considering metabolic equivalents of energy expenditure (MET) produced similar results. While an inverse relation between physical activity averaged over the lifetime and breast cancer risk was observed, the relation was null when limited to activity in a single decade. The inverse association with lifetime activity was consistent regardless of menopausal status and body mass; however, it was limited to women with no family history of breast cancer (OR 0.75, 95% CI 0.61-0.91 for 6 vs. 0 hrs/week, P-interaction = 0.02). The results from this large study provide further evidence that long-term recreational physical activity may reduce breast cancer risk.
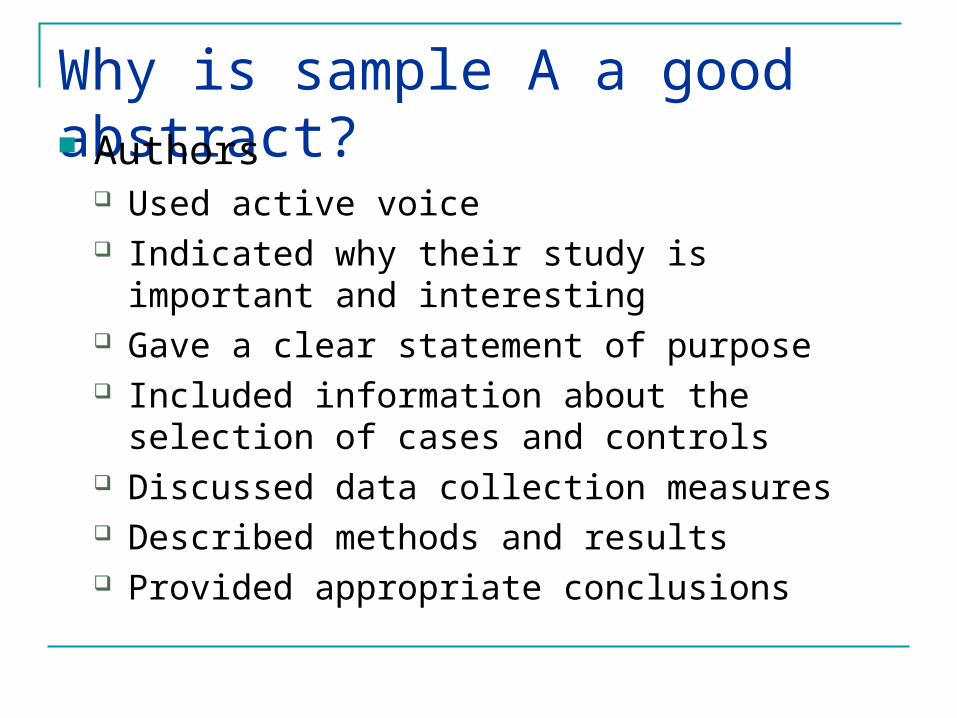
Why is sample A a good abstract? Authors
Used active voice Indicated why their study is important and
interesting Gave a clear statement of purpose Included information about the selection of cases
and controls Discussed data collection measures Described methods and results Provided appropriate conclusions
Sample B: Mapping and measuring social disparities in premature mortality: the impact of census tract poverty within and across Boston Neighborhoods, 1999-2001The documentation of health disparities is an important function of public health
surveillance. These disparities, typically falling along lines defined by gender, race/ethnicity, and social class, are often visible in urban settings as geographic disparities in health between neighborhoods. Recognizing that premature mortality is a powerful indicator of social disparities in health, we undertook an analysis of spatial variation in premature mortality in Boston (1999-2001) across neighborhoods and sub-neighborhoods in relation to census tract (CT) poverty. Using a multilevel model based framework, we estimated that the incidence of premature mortality was 1.39 times higher (95% confidence interval 1.09-1.78) among persons living in the most economically deprived CTs (>=20% below poverty) compared to those in the least impoverished tracts (<5% below poverty). We present maps of model-based standardized mortality ratios that show substantial within-neighborhood variation in premature mortality and a sizeable decrease in spatial variation after adjustment for CT poverty. To aid interpretation, we also map smoothed age-standardized rates that can be compared to externally published rates. Additionally, we present maps of the model-based population attributable fraction that show that in some of Boston's poorest neighborhoods, the proportion of excess deaths associated with CT poverty reaches 25-30%. We recommend that these methods be incorporated into routine analyses of public health surveillance data to highlight continuing social disparities in premature mortality.
Why is sample B a good abstract? Authors Used active voice and defined acronyms Indicated the importance of their study Described their objective and their analytic strategy
(spatial mapping) Included the geographic area Described the maps generated
What could have improved this abstract? Explanation of their results and how to interpret the
maps