
Writing A+ Prac Reports (Chemistry) - TSFX - The School For · PDF file ·...
35
Writing A+ Prac Reports (Chemistry)
Transcript of Writing A+ Prac Reports (Chemistry) - TSFX - The School For · PDF file ·...
Writing A+ Prac Reports (Chemistry)
succeeding in the vce, 2017
important notes Our policy at TSFX is to provide students with the most detailed and comprehensive set of notes that will maximise student performance and reduce study time. These materials, therefore, include a wide range of questions and applications, all of which cannot be addressed within the available lecture time. Where applicable, fully worked solutions to the questions in this booklet will be handed to students on the last day of each subject lecture. Although great care is taken to ensure that these materials are mistake free, an error may appear from time to time. If you believe that there is an error in these notes or solutions, please let us know asap ([email protected]). Errors, as well as additional advice, clarifications and important updates, will be posted at www.tsfx.com.au/vce-updates. The views and opinions expressed in this booklet and corresponding lecture are those of the authors/lecturers and do not necessarily reflect the official policy or position of TSFX.
These materials are the copyright property of The School For Excellence and have been produced for the exclusive use of students attending this program. Reproduction of the whole or part of this document constitutes an infringement in copyright and can result in legal action. No part of this publication can be reproduced, copied, scanned, stored in a retrieval system, communicated, transmitted or disseminated, in any form or by any means, without the prior written consent of The School For Excellence (TSFX). The use of recording devices is STRICTLY PROHIBITED. Recording devices interfere with the microphones and send loud, high-pitched sounds throughout the theatre. Furthermore, recording without the lecturer’s permission is ILLEGAL. Students caught recording will be asked to leave the theatre, and will have all lecture materials confiscated.
it is illegal to use any kind of recording device during this lecture
author(s)
These materials represent the collective effort of many teachers across the state. The principal author of this booklet is:
Ms Elizabeth Williamson (Senior VCE Teacher – TSFX)
lecturer(s) To ensure that students are afforded every possible advantage in their examinations, our lectures are prepared and delivered by qualified, currently practising VCE teachers and official VCE exam markers who possess the knowledge and experience to demonstrate the means by which students can achieve the higher ATAR scores. Further details regarding our teachers (including qualifications and experience) may be obtained at http://www.tsfx.com.au/what-is-tsfx/ourteachers/.
copyright notice
TSFX - voted number one for excellence and quality in VCE programs.

© The School For Excellence 2017 Succeeding in the VCE – Writing A+ Prac Reports Page 1
A GUIDE TO WRITING PRACTICAL REPORTS The main purpose of scientific report writing is to communicate the results of your experiment so that other people can reproduce your results if necessary. The process of writing a scientific report gives you valuable practice in clearly explaining the theoretical concepts and interpreting and manipulating data. Since these skills are also vital for performing well in the written examination, mastering the art of writing practical reports is essential! This document gives a general description of the sections of a scientific report; however, you should check with your teacher about their specific requirements as there may be differences in approach, style and presentation.
WRITING STYLE A scientific report should be written in a straight forward and precise manner so that it is easy for other people to read and understand. You should write in complete, grammatically correct sentences.
Avoid elaborate vocabulary.
Use chemical terms and conventions correctly, including chemical equation and units of
measurement.
Be concise. If you can use one word instead of a phrase with two or more words, then choose the one word (get around = avoid).
Avoid long sentences. If most of your sentences are long (4 or more 'clauses' or parts) you will confuse the reader.
Write in the third person (‘it’ rather than I or we).
Write in past tense.
Avoid definitive words (proves, definitely, will cause).
Useful words to use are: Possibly, inference, presumably, probably, apparently, not likely, seemingly, appear, suggest, seem, maybe.
Write objectively: present facts and figures only, do not include your beliefs or feelings. Avoid colloquialisms such as ‘the results dramatically showed...”.
Avoid Instead use
I observed the angle to be
I suggest
I found
In this report I will show
The loss in mass was due to
The results prove that
© The School For Excellence 2017 Succeeding in the VCE – Writing A+ Prac Reports Page 2
GENERAL FORMAT OF PRACTICAL REPORTS While different schools will vary in the sections required in a practical report, generally all reports follow a similar format as follows. Experimental details: Practical title
Your name
Laboratory partners
Date Introduction
Some teachers may like you to include relevant background information. For example:
Colorimetry is an analytical chemistry technique used to determine the concentration of coloured solutions. A white light source is passed through a colour filter or alternative wavelength selection device. The coloured light then passes through a cuvette containing a chemical compound in solution. The intensity of the light leaving the sample will be less than the light entering the cuvette. The loss of light or absorption is proportional to the concentration of the compound. To quantitatively analyse a sample, the absorbance of standard solutions containing the substance being analysed are measured. This data is converted into a calibration curve so that the concentration of the unknown sample can be determined.
Aim: Writing an aim involves concisely describing the purpose of the experiment. There may be one aim or several. For instrumentation-based practicals it is customary to mention the apparatus to be used. The aim for a chemistry practical which uses a colorimeter to determine the concentration of iron in spinach might be written as:
To use a colorimeter to measure the absorbance of five standard solutions containing iron and use the data to construct a calibration curve. Transfer the iron from spinach into solution and measure its absorbance under identical conditions. Use the calibration curve to determine the iron content of the spinach and compare this to the manufacturer’s value.

© The School For Excellence 2017 Succeeding in the VCE – Writing A+ Prac Reports Page 3
Equipment: Provide a list of the equipment that was used. Be specific. Clearly indicate the size of the glassware needed (50 mL beaker) and the concentrations of any solutions used. A list of equipment is usually included on the practical sheet and you may not be required to rewrite it. If this is the case, reference the practical sheet in this section and make sure you include it with your report. Any changes to the equipment used must be annotated on the practical sheet. Method: Provide progressive, step by step instructions of how to conduct the experiment from beginning to end so that it can be easily and accurately duplicated by others. Be explicit and accurate and quantify the steps as much as possible. This section should start with a list of safety precautions. Safety information may be found on the practical sheet or your teacher may provide you with MSDS (Material Safety Data Sheets) information. You may be required to find this information yourself and in this case you will probably need to do an internet search. Normally, the method is given out as part of the practical notes and very rarely would you be required to rewrite it. Some teachers will be happy with a reference to the method. If any changes have been made, ensure that they are clearly annotated on the sheet. Example: Refer to attached sheet titled “Determination of HCl concentration in brick cleaner”. If you have taken a photograph of your experimental set up, you would include it here. Make sure it is given a descriptive heading. Results: Any data collected or observations made during the experiment should be accurately recorded in this section. Your teacher may require you to include the rough copy of your results from the experiment in order to verify your work. The results section is divided into sub sections as described below. Observations (qualitative results): Observations include things like colour changes, the appearance of a gas, sounds that were made (popping, hissing) and also anything that could influence the outcome of the experiment. Do not analyse or comment on the relevance of the observations. This will be done in the discussion section. Examples Some of the precipitate stuck to the bottom of the flask and could not be removed.
Even after thorough mixing, some of the fertiliser did not dissolve.
The red solution became darker as time passed.

© The School For Excellence 2017 Succeeding in the VCE – Writing A+ Prac Reports Page 4
Numerical Data Numerical data should be presented in tables, figures or graphs. Tables
Require a descriptive title.
Each column of data should be clearly labelled. Units should be included with the title
of the column NOT in the body of the table where the numerical data is recorded. The associated uncertainty should also be stated.
The number of significant digits should reflect the precision of the measurements.
There should be no variation in the precision of raw data. For example, the same number of decimal places should be used if the measuring device is consistent.
Example:
Table 1: Change in temperature of water when heated.
Time (sec) ±1 sec
Temperature (°C) ± 0.5°C
Temperature (°C) ± 0.5°C
Trial 1 Trial 2
0 21.0 21.5
30 23.5 22.5
60 26.5 26.0
90 30.0 30.5
Subsequent calculations are usually clearer if data is arranged in columns instead of rows (as above). The table below is harder to interpret for most people.
Time (sec) ±1 sec 0 30 60 90
Temperature (°C) ± 0.5°C Trial 1 21.0 23.5 26.5 30.0
Temperature (°C) ± 0.5°C Trial 2 21.5 22.5 26.0 30.5
© The School For Excellence 2017 Succeeding in the VCE – Writing A+ Prac Reports Page 5
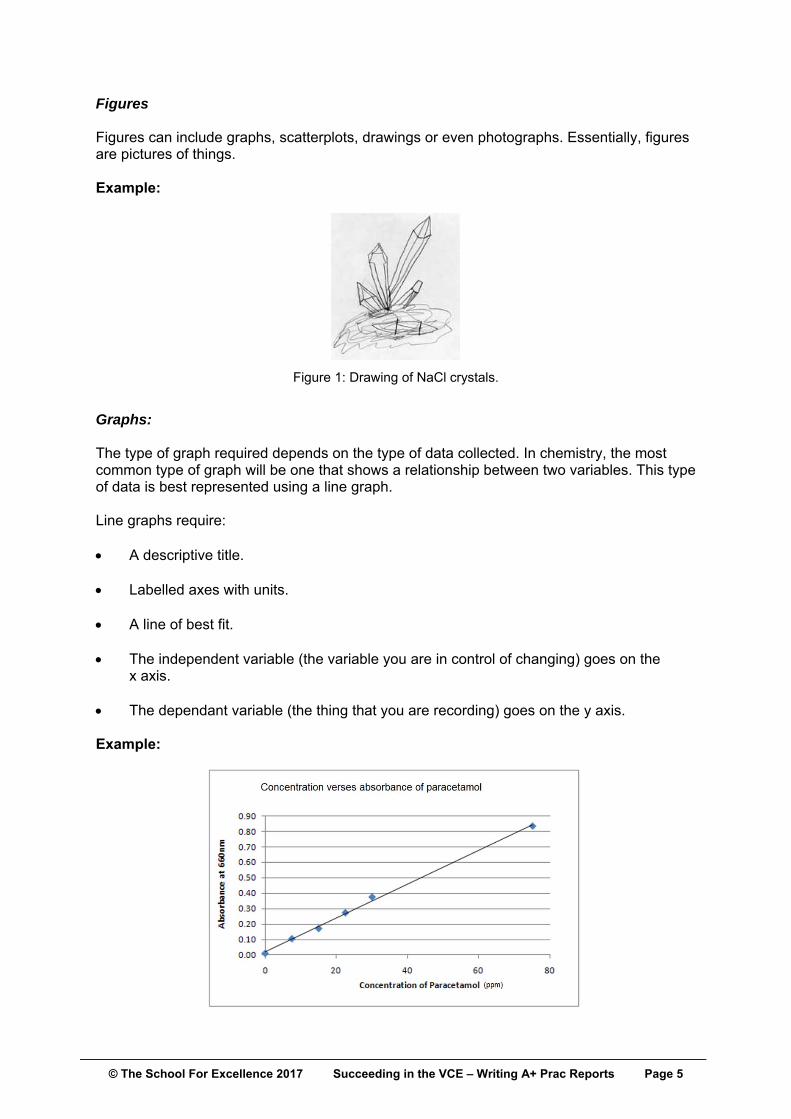
Figures Figures can include graphs, scatterplots, drawings or even photographs. Essentially, figures are pictures of things. Example:
Figure 1: Drawing of NaCl crystals.
Graphs: The type of graph required depends on the type of data collected. In chemistry, the most common type of graph will be one that shows a relationship between two variables. This type of data is best represented using a line graph. Line graphs require: A descriptive title.
Labelled axes with units.
A line of best fit.
The independent variable (the variable you are in control of changing) goes on the
x axis.
The dependant variable (the thing that you are recording) goes on the y axis. Example:
© The School For Excellence 2017 Succeeding in the VCE – Writing A+ Prac Reports Page 6
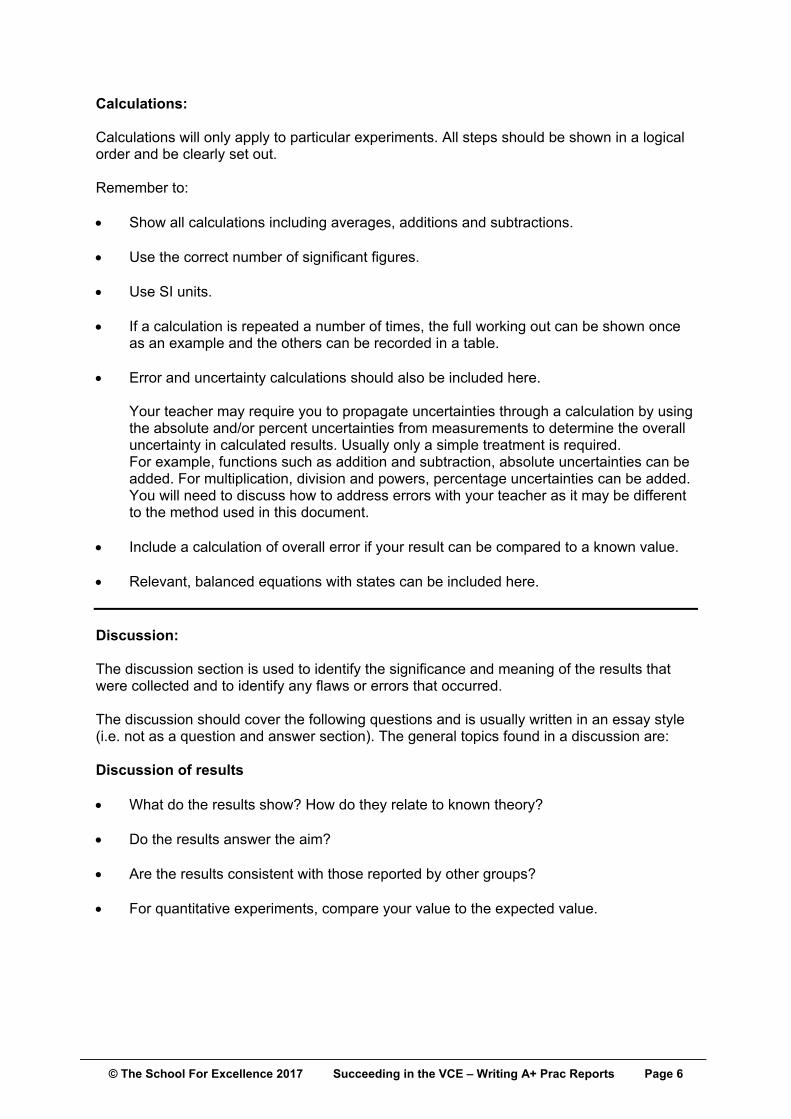
Calculations: Calculations will only apply to particular experiments. All steps should be shown in a logical order and be clearly set out. Remember to:
Show all calculations including averages, additions and subtractions.
Use the correct number of significant figures.
Use SI units.
If a calculation is repeated a number of times, the full working out can be shown once
as an example and the others can be recorded in a table.
Error and uncertainty calculations should also be included here.
Your teacher may require you to propagate uncertainties through a calculation by using the absolute and/or percent uncertainties from measurements to determine the overall uncertainty in calculated results. Usually only a simple treatment is required. For example, functions such as addition and subtraction, absolute uncertainties can be added. For multiplication, division and powers, percentage uncertainties can be added. You will need to discuss how to address errors with your teacher as it may be different to the method used in this document.
Include a calculation of overall error if your result can be compared to a known value.
Relevant, balanced equations with states can be included here. Discussion: The discussion section is used to identify the significance and meaning of the results that were collected and to identify any flaws or errors that occurred. The discussion should cover the following questions and is usually written in an essay style (i.e. not as a question and answer section). The general topics found in a discussion are: Discussion of results
What do the results show? How do they relate to known theory?
Do the results answer the aim?
Are the results consistent with those reported by other groups?
For quantitative experiments, compare your value to the expected value.
© The School For Excellence 2017 Succeeding in the VCE – Writing A+ Prac Reports Page 7
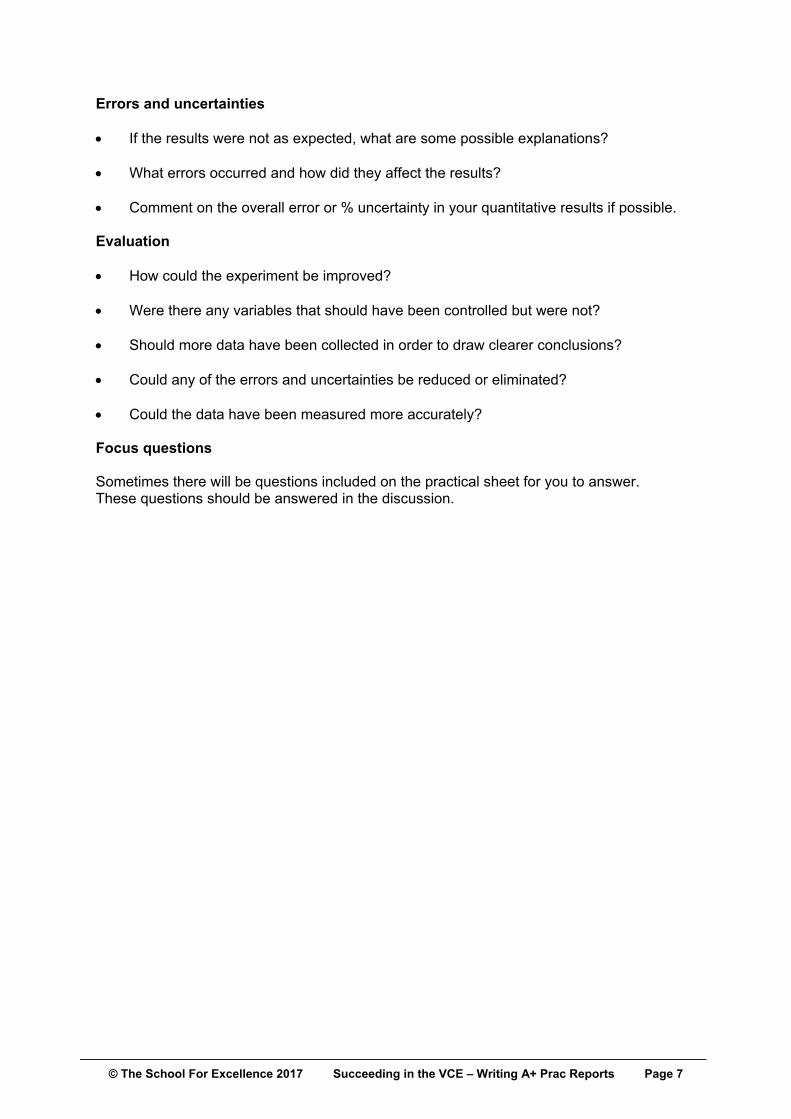
Errors and uncertainties If the results were not as expected, what are some possible explanations?
What errors occurred and how did they affect the results?
Comment on the overall error or % uncertainty in your quantitative results if possible. Evaluation
How could the experiment be improved?
Were there any variables that should have been controlled but were not?
Should more data have been collected in order to draw clearer conclusions?
Could any of the errors and uncertainties be reduced or eliminated?
Could the data have been measured more accurately?
Focus questions Sometimes there will be questions included on the practical sheet for you to answer. These questions should be answered in the discussion.
© The School For Excellence 2017 Succeeding in the VCE – Writing A+ Prac Reports Page 8
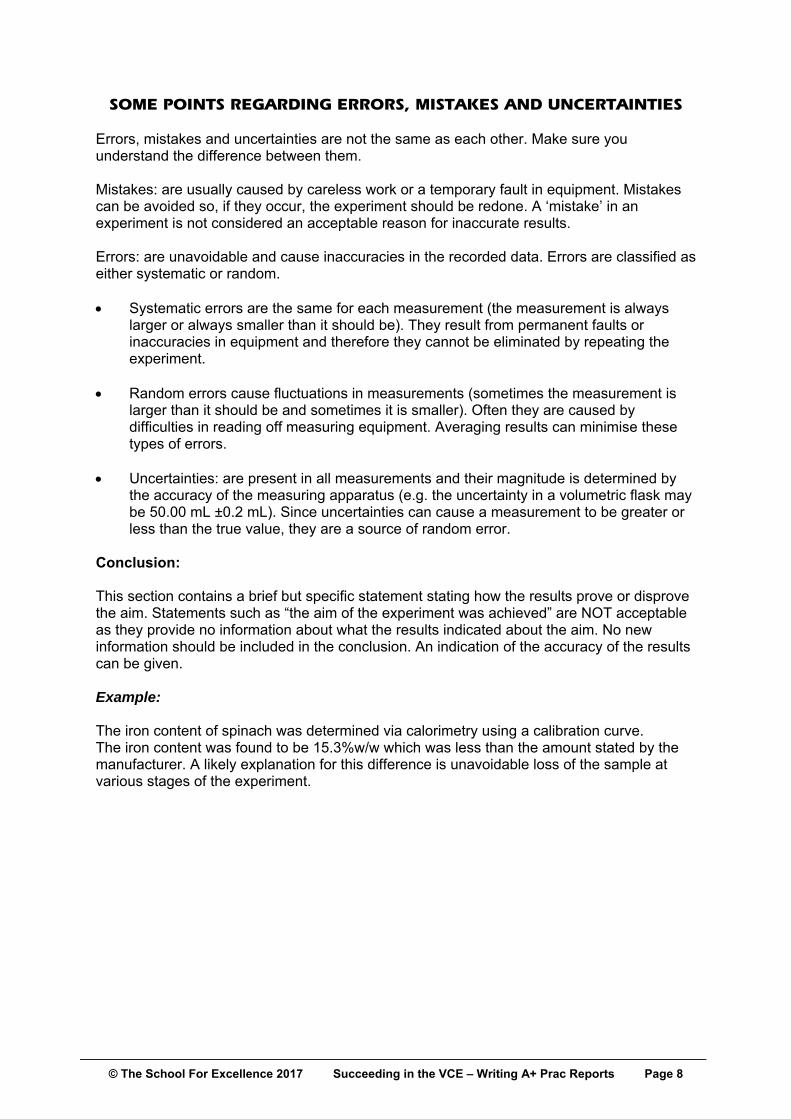
SOME POINTS REGARDING ERRORS, MISTAKES AND UNCERTAINTIES Errors, mistakes and uncertainties are not the same as each other. Make sure you understand the difference between them.
Mistakes: are usually caused by careless work or a temporary fault in equipment. Mistakes can be avoided so, if they occur, the experiment should be redone. A ‘mistake’ in an experiment is not considered an acceptable reason for inaccurate results. Errors: are unavoidable and cause inaccuracies in the recorded data. Errors are classified as either systematic or random. Systematic errors are the same for each measurement (the measurement is always
larger or always smaller than it should be). They result from permanent faults or inaccuracies in equipment and therefore they cannot be eliminated by repeating the experiment.
Random errors cause fluctuations in measurements (sometimes the measurement is larger than it should be and sometimes it is smaller). Often they are caused by difficulties in reading off measuring equipment. Averaging results can minimise these types of errors.
Uncertainties: are present in all measurements and their magnitude is determined by
the accuracy of the measuring apparatus (e.g. the uncertainty in a volumetric flask may be 50.00 mL ±0.2 mL). Since uncertainties can cause a measurement to be greater or less than the true value, they are a source of random error.
Conclusion: This section contains a brief but specific statement stating how the results prove or disprove the aim. Statements such as “the aim of the experiment was achieved” are NOT acceptable as they provide no information about what the results indicated about the aim. No new information should be included in the conclusion. An indication of the accuracy of the results can be given. Example: The iron content of spinach was determined via calorimetry using a calibration curve. The iron content was found to be 15.3%w/w which was less than the amount stated by the manufacturer. A likely explanation for this difference is unavoidable loss of the sample at various stages of the experiment.
© The School For Excellence 2017 Succeeding in the VCE – Writing A+ Prac Reports Page 9
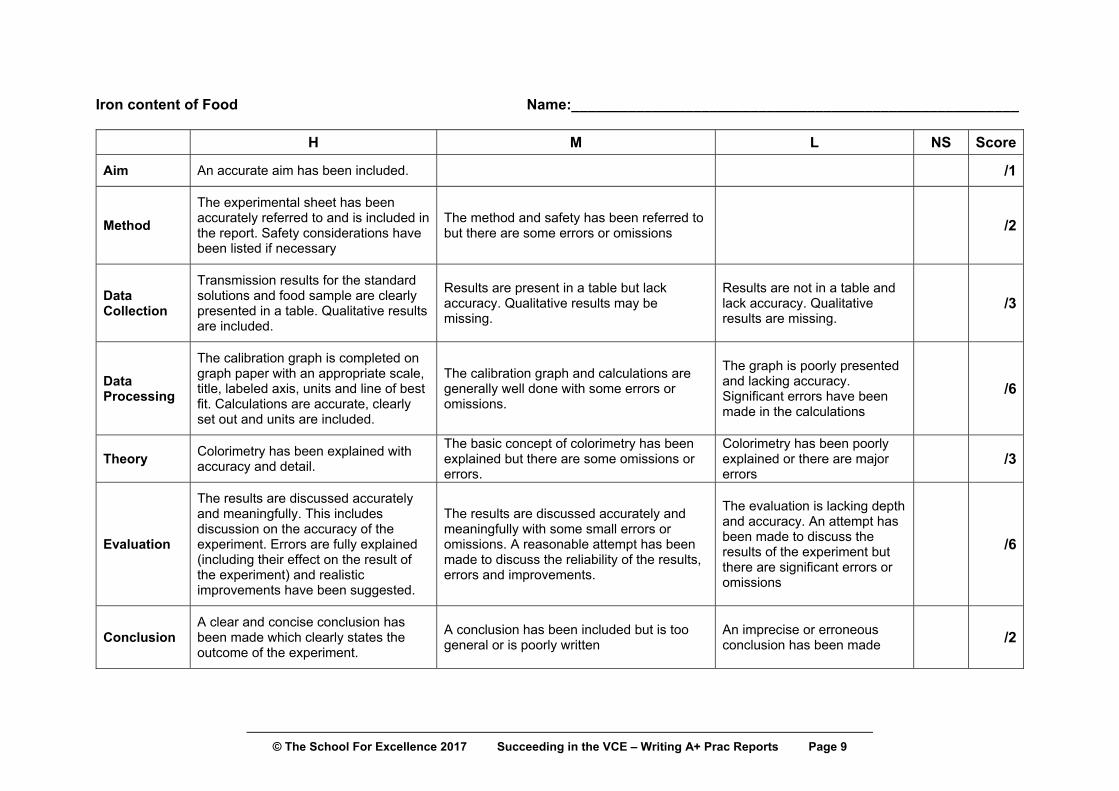
Iron content of Food Name:_______________________________________________________
H M L NS Score
Aim An accurate aim has been included. /1
Method
The experimental sheet has been accurately referred to and is included in the report. Safety considerations have been listed if necessary
The method and safety has been referred to but there are some errors or omissions
/2
Data Collection
Transmission results for the standard solutions and food sample are clearly presented in a table. Qualitative results are included.
Results are present in a table but lack accuracy. Qualitative results may be missing.
Results are not in a table and lack accuracy. Qualitative results are missing.
/3
Data Processing
The calibration graph is completed on graph paper with an appropriate scale, title, labeled axis, units and line of best fit. Calculations are accurate, clearly set out and units are included.
The calibration graph and calculations are generally well done with some errors or omissions.
The graph is poorly presented and lacking accuracy. Significant errors have been made in the calculations
/6
Theory Colorimetry has been explained with accuracy and detail.
The basic concept of colorimetry has been explained but there are some omissions or errors.
Colorimetry has been poorly explained or there are major errors
/3
Evaluation
The results are discussed accurately and meaningfully. This includes discussion on the accuracy of the experiment. Errors are fully explained (including their effect on the result of the experiment) and realistic improvements have been suggested.
The results are discussed accurately and meaningfully with some small errors or omissions. A reasonable attempt has been made to discuss the reliability of the results, errors and improvements.
The evaluation is lacking depth and accuracy. An attempt has been made to discuss the results of the experiment but there are significant errors or omissions
/6
Conclusion A clear and concise conclusion has been made which clearly states the outcome of the experiment.
A conclusion has been included but is too general or is poorly written
An imprecise or erroneous conclusion has been made
/2
© The School For Excellence 2017 Succeeding in the VCE – Writing A+ Prac Reports Page 10
EXTENDED PRACTICAL RESPONSE The following report is an example of the type of report that can be produced if time is not limited. Each section is completed in precise detail. It is unlikely that you will be able to reproduce a report of this depth and length in a limited time period (e.g. if given a period to write a SAC report). Use this example to guide you in:
Presenting result clearly.
Presenting calculations clearly including propagation of errors if necessary.
The requirements of each section of the report.
Discussing the accuracy and reliability of results.
Discussing errors in detail.
Discussing practical and relevant improvements.
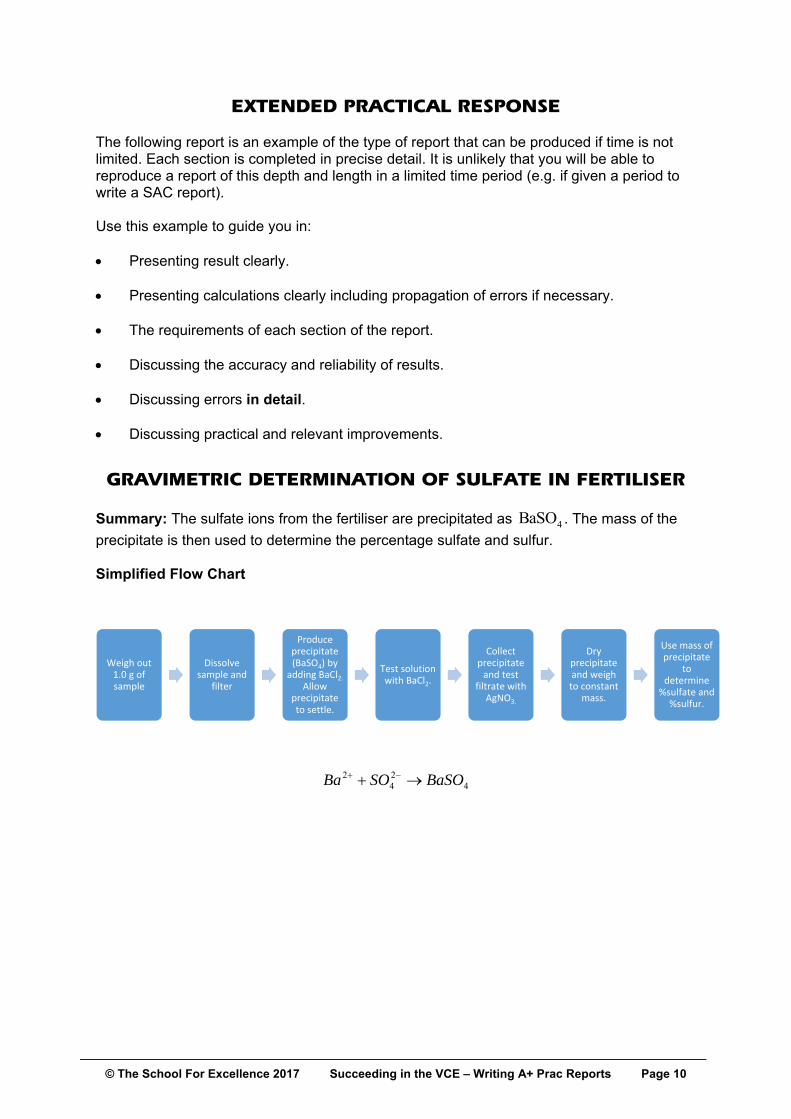
GRAVIMETRIC DETERMINATION OF SULFATE IN FERTILISER Summary: The sulfate ions from the fertiliser are precipitated as 4BaSO . The mass of the
precipitate is then used to determine the percentage sulfate and sulfur. Simplified Flow Chart
424
2 BaSOSOBa
Weigh out 1.0 g of sample
Dissolve sample and
filter
Produce precipitate (BaSO4) by
adding BaCl2. Allow
precipitate to settle.
Test solution with BaCl2.
Collect precipitate and test
filtrate with AgNO3.
Dry precipitate and weigh to constant
mass.
Use mass of precipitate
to determine
%sulfate and %sulfur.
© The School For Excellence 2017 Succeeding in the VCE – Writing A+ Prac Reports Page 11
EXTENDED EXPERIMENTAL REPORT
GRAVIMETRIC DETERMINATION OF SULFATE IN FERTILISER Experimental details: Name: Student A
Laboratory partner: Student B
4th February 2017 Introduction Gravimetric analysis involves analysing a sample using masses. The analyte is dissolved and reacted with a precipitating reagent. This precipitate is collected via filtration, washed and weighed to constant mass. The mass of the precipitate is used in conjunction with the original mass of the sample to find the percent composition of the substance being analysed. This experiment involves analysing the percent sulfur and sulfate in a commercial brand of fertiliser. The sulfate in the fertiliser will be dissolved into solution and then precipitated out as barium sulfate by using barium chloride as a precipitating reagent. The amount of sulfur and sulfate in fertilisers is of considerable concern because they are indirectly responsible for two serious problems associated with the handling and treatment of water. That is, the odour and sewer corrosion problems that result from the reduction of sulfate to hydrogen sulphide under anaerobic conditions. Aim To use gravimetric analysis to determine the % sulfur and % sulfate in Quickgrow
fertiliser.
To compare the experimental values to those quoted by the manufacturer. Equipment and Method See attached sheet “Experiment 7 – Gravimetric determination of sulfate in fertiliser”. Safety Wear safety goggles and lab coat.
Soluble barium compounds are toxic.
Silver nitrate stains skin and clothes.
Hydrochloric acid is corrosive.
© The School For Excellence 2017 Succeeding in the VCE – Writing A+ Prac Reports Page 12
Results Quantitative Results
Precipitation reaction: )(42
)(42
)( saqaq BaSOSOBa
Table 1: Masses recorded during the gravimetric analysis of Quickgrow fertiliser.
Mass of Fertiliser Sample (g) ± 0.005 g
Mass of Filter Paper (g) ± 0.005 g
1.000 2.080
Table 2: Masses recording during the drying of 4BaSO .
Mass of Filter Paper + BaSO4 (g) ± 0.005 g
1st drying 2.095
2nd drying 2.441
3rd drying 2.441
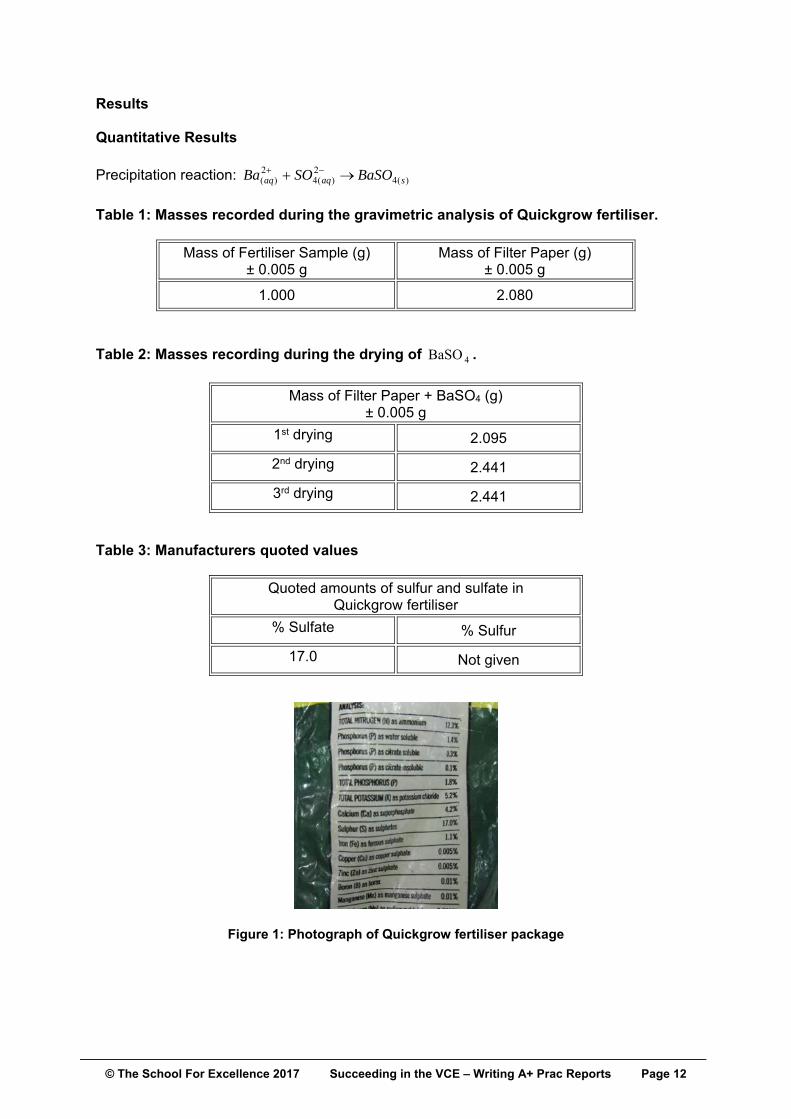
Table 3: Manufacturers quoted values
Quoted amounts of sulfur and sulfate in Quickgrow fertiliser
% Sulfate % Sulfur
17.0 Not given
Figure 1: Photograph of Quickgrow fertiliser package
© The School For Excellence 2017 Succeeding in the VCE – Writing A+ Prac Reports Page 13
Table 4: Class results for the % sulfate and % sulfur in Quickgrow fertiliser
% w/w sulfate and sulfur in Quickgrow fertiliser
% sulfate % sulfur
Group 1 15.8 ± 3.2% 5.26 % ±3.2%
Group 2 14.5 ±3.3% 4.83 % ± 3.3%
Group 3 19.4 ±3.0% 6.46 % ± 3.0%
Group 4 16.1 ±3.2% 5.36 % + 3.2%
Our result 14.9 ±3.3% 4.96 % ± 3.3%
Qualitative Results It was difficult to grind all of the fertiliser into a fine powder. The resulting powder had
some small lumps in it.
When barium chloride was added to the fertilizer solution, a white precipitate formed.
When the solution in Step 5 was tested with barium chloride, it went slightly cloudy. After the addition of an extra 3 mL of barium chloride, this test produced no further precipitate.
When the filtrate was tested with silver nitrate, no precipitate formed. Calculations Mass of precipitate
0.010g0.361
0.0052.0800.0052.441
paper)m(filter )BaSOpaperm(filter )m(BaSO 44
% 2.8
100 x 0.361
0.010)m(BaSOin error % 4
Error is additive
© The School For Excellence 2017 Succeeding in the VCE – Writing A+ Prac Reports Page 14
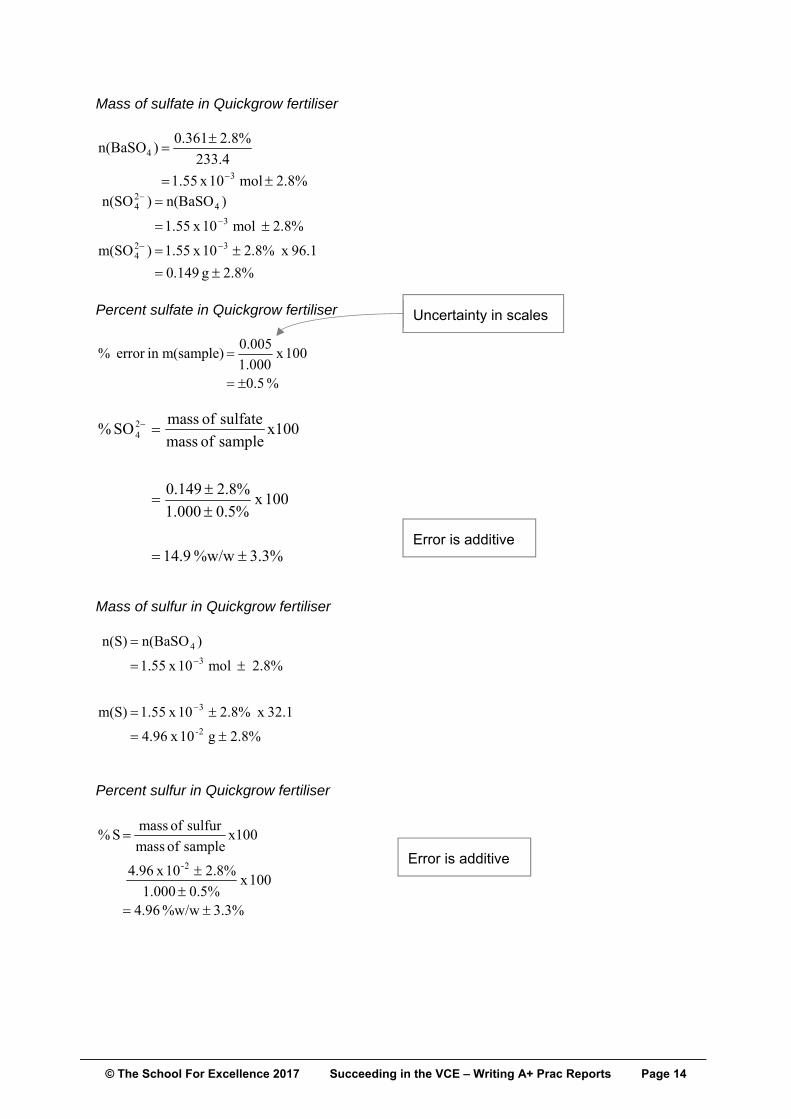
Mass of sulfate in Quickgrow fertiliser
2.8% mol 10 x 1.55
233.4
2.8% 0.361)n(BaSO
3
4
2.8% g 0.149
96.1 x 2.8% 10 x 1.55)m(SO
2.8% mol 10 x 1.55
)n(BaSO)n(SO
324
3
424
Percent sulfate in Quickgrow fertiliser
% 0.5
100 x 1.000
0.005m(sample)in error %
3.3% %w/w 14.9
100 x 0.5% 1.000
2.8% 0.149
x100sample of mass
sulfate of massSO % 2
4
Mass of sulfur in Quickgrow fertiliser
2.8% g 10 x 4.96
32.1 x 2.8% 10 x 1.55m(S)
2.8% mol 10 x 1.55
)n(BaSOn(S)
2-
3
3
4
Percent sulfur in Quickgrow fertiliser
3.3% %w/w 4.96
100 x 0.5% 1.000
2.8% 10 x 4.96
x100sample of mass
sulfur of massS %
2-
Error is additive
Uncertainty in scales
Error is additive
© The School For Excellence 2017 Succeeding in the VCE – Writing A+ Prac Reports Page 15
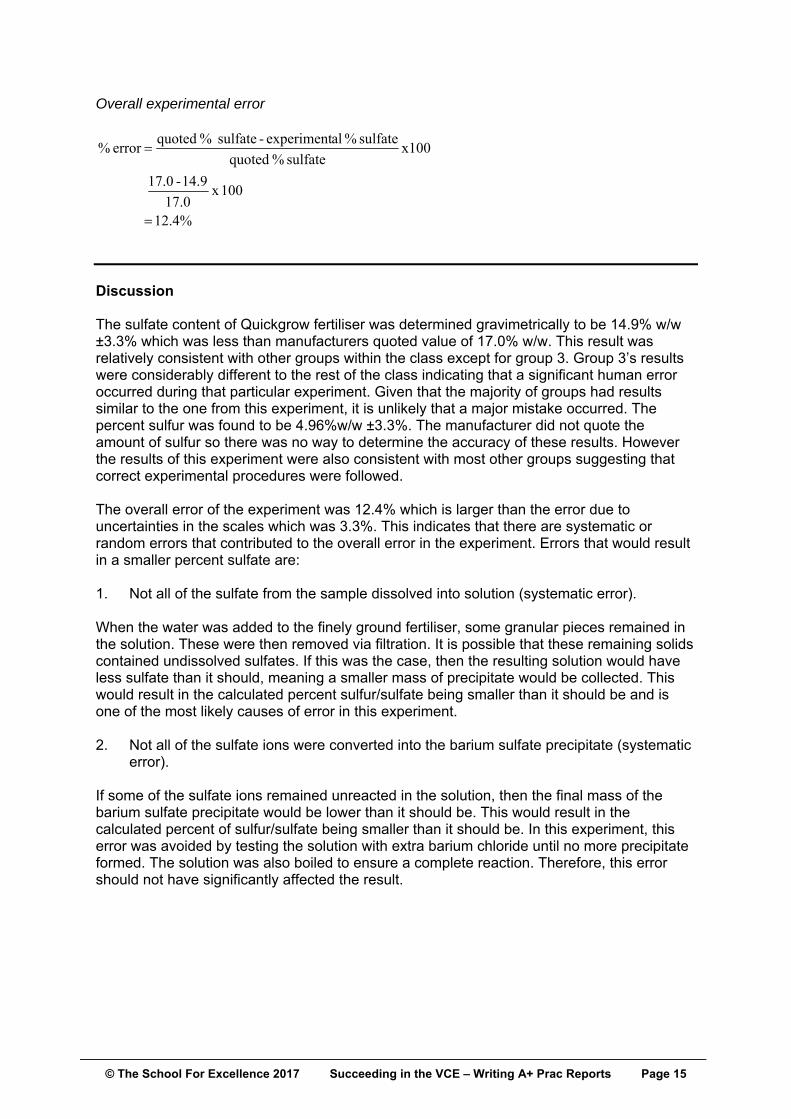
Overall experimental error
12.4%
100 x 17.0
14.9 - 17.0
x100sulfate % quoted
sulfate % alexperiment - sulfate % quotederror %
Discussion The sulfate content of Quickgrow fertiliser was determined gravimetrically to be 14.9% w/w ±3.3% which was less than manufacturers quoted value of 17.0% w/w. This result was relatively consistent with other groups within the class except for group 3. Group 3’s results were considerably different to the rest of the class indicating that a significant human error occurred during that particular experiment. Given that the majority of groups had results similar to the one from this experiment, it is unlikely that a major mistake occurred. The percent sulfur was found to be 4.96%w/w ±3.3%. The manufacturer did not quote the amount of sulfur so there was no way to determine the accuracy of these results. However the results of this experiment were also consistent with most other groups suggesting that correct experimental procedures were followed. The overall error of the experiment was 12.4% which is larger than the error due to uncertainties in the scales which was 3.3%. This indicates that there are systematic or random errors that contributed to the overall error in the experiment. Errors that would result in a smaller percent sulfate are: 1. Not all of the sulfate from the sample dissolved into solution (systematic error). When the water was added to the finely ground fertiliser, some granular pieces remained in the solution. These were then removed via filtration. It is possible that these remaining solids contained undissolved sulfates. If this was the case, then the resulting solution would have less sulfate than it should, meaning a smaller mass of precipitate would be collected. This would result in the calculated percent sulfur/sulfate being smaller than it should be and is one of the most likely causes of error in this experiment. 2. Not all of the sulfate ions were converted into the barium sulfate precipitate (systematic
error). If some of the sulfate ions remained unreacted in the solution, then the final mass of the barium sulfate precipitate would be lower than it should be. This would result in the calculated percent of sulfur/sulfate being smaller than it should be. In this experiment, this error was avoided by testing the solution with extra barium chloride until no more precipitate formed. The solution was also boiled to ensure a complete reaction. Therefore, this error should not have significantly affected the result.

© The School For Excellence 2017 Succeeding in the VCE – Writing A+ Prac Reports Page 16
3. Precipitate residue left in the gooch crucible (systematic error). Once the precipitate had been collected in the gooch crucible, the filter paper and precipitate were removed and weighed. It is possible that a small amount of the precipitate was left behind in the crucible. This would result in calculated of mass of precipitate and percent sulfate being smaller than it should be. Since there was no observable precipitate left in the crucible, it is unlikely that this error had a large effect on the results. There are also errors that could result in a higher percentage of sulfate in the fertiliser. It is unlikely that these types of errors occurred to any significant extent in this experiment since the percent sulfate was lower than the expected value. 1. Co-precipitation (systematic error) Barium chloride was added to precipitate out the sulfate ion as barium sulfate. However, it is possible that the barium ions also formed a precipitate with other ions in the fertiliser. For example if any phosphates or carbonates are present, then the barium could precipitate these ions out as well. The barium chloride is also a source of chloride ions. These ions could combine with lead or copper (I) to form a precipitate. Any extra precipitates which form during the experiment will add to the final mass of barium sulfate. This would result in a higher calculated percentage of sulfate in the fertiliser. 2. Insufficient washing of the precipitate (mistake). If the precipitate was not washed properly, it is possible that other ions from the solution would adhere it and cause the mass of the precipitate to be higher than it should be. This would make the calculated value of percent sulfate/sulfur higher as well. If this occurred in this experiment, it would be considered as a mistake as the filtrate can and was tested for chloride ions using silver nitrate hence avoiding this source of inaccuracy. Hence this error should not have occurred in this experiment unless there were other ions present that could not be tested with silver nitrate. 3. Precipitate not dried properly (mistake). Incomplete drying of the precipitate would cause the mass of the precipitate to be higher than it should be. This would make the calculated value of percent sulfate/sulfur higher as well. This would technically be a mistake since the precipitate can be weighed to constant mass, hence avoiding this source of inaccuracy. The correct experimental procedure was followed in this experiment so no water should have been present in the final mass of the precipitate. The experiment determined the sulfate/sulfur content of Quickgrow fertiliser in the same order of magnitude as the manufacturer but with an overall error of 12.4%. To reduce this error and improve the accuracy of the experiment, the following improvements could be made.
© The School For Excellence 2017 Succeeding in the VCE – Writing A+ Prac Reports Page 17
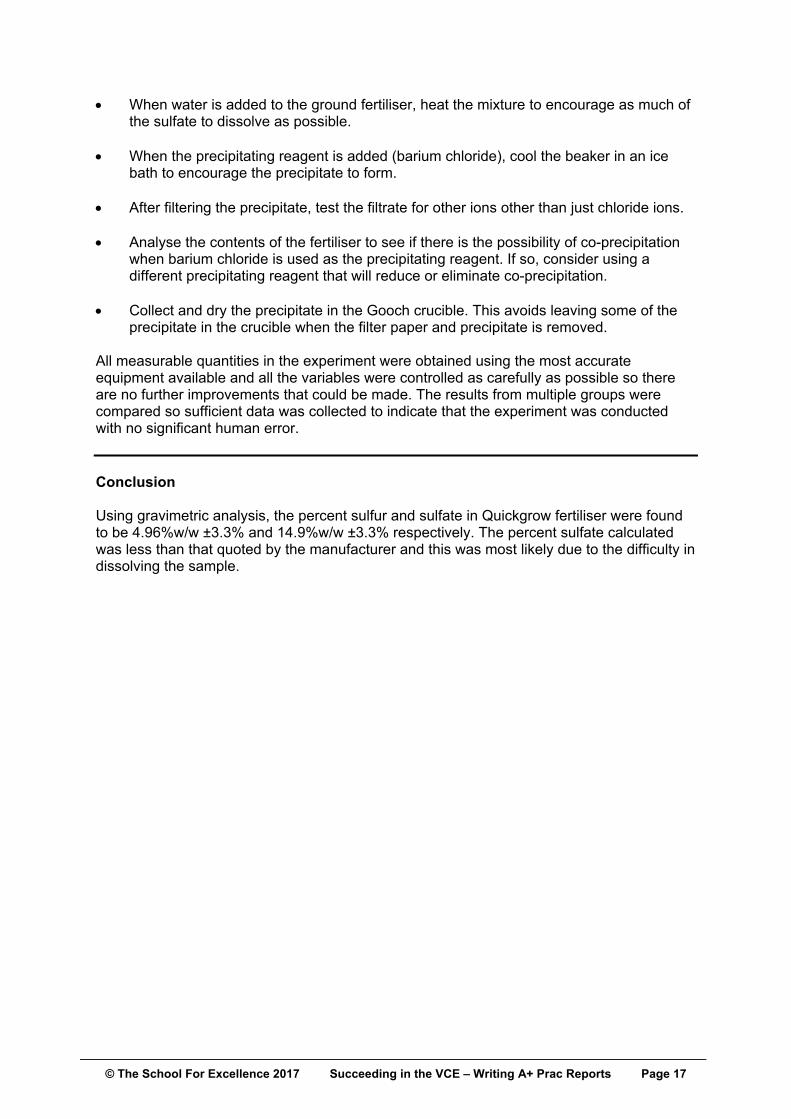
When water is added to the ground fertiliser, heat the mixture to encourage as much of the sulfate to dissolve as possible.
When the precipitating reagent is added (barium chloride), cool the beaker in an ice
bath to encourage the precipitate to form.
After filtering the precipitate, test the filtrate for other ions other than just chloride ions. Analyse the contents of the fertiliser to see if there is the possibility of co-precipitation
when barium chloride is used as the precipitating reagent. If so, consider using a different precipitating reagent that will reduce or eliminate co-precipitation.
Collect and dry the precipitate in the Gooch crucible. This avoids leaving some of the
precipitate in the crucible when the filter paper and precipitate is removed. All measurable quantities in the experiment were obtained using the most accurate equipment available and all the variables were controlled as carefully as possible so there are no further improvements that could be made. The results from multiple groups were compared so sufficient data was collected to indicate that the experiment was conducted with no significant human error. Conclusion Using gravimetric analysis, the percent sulfur and sulfate in Quickgrow fertiliser were found to be 4.96%w/w ±3.3% and 14.9%w/w ±3.3% respectively. The percent sulfate calculated was less than that quoted by the manufacturer and this was most likely due to the difficulty in dissolving the sample.
© The School For Excellence 2017 Succeeding in the VCE – Writing A+ Prac Reports Page 18
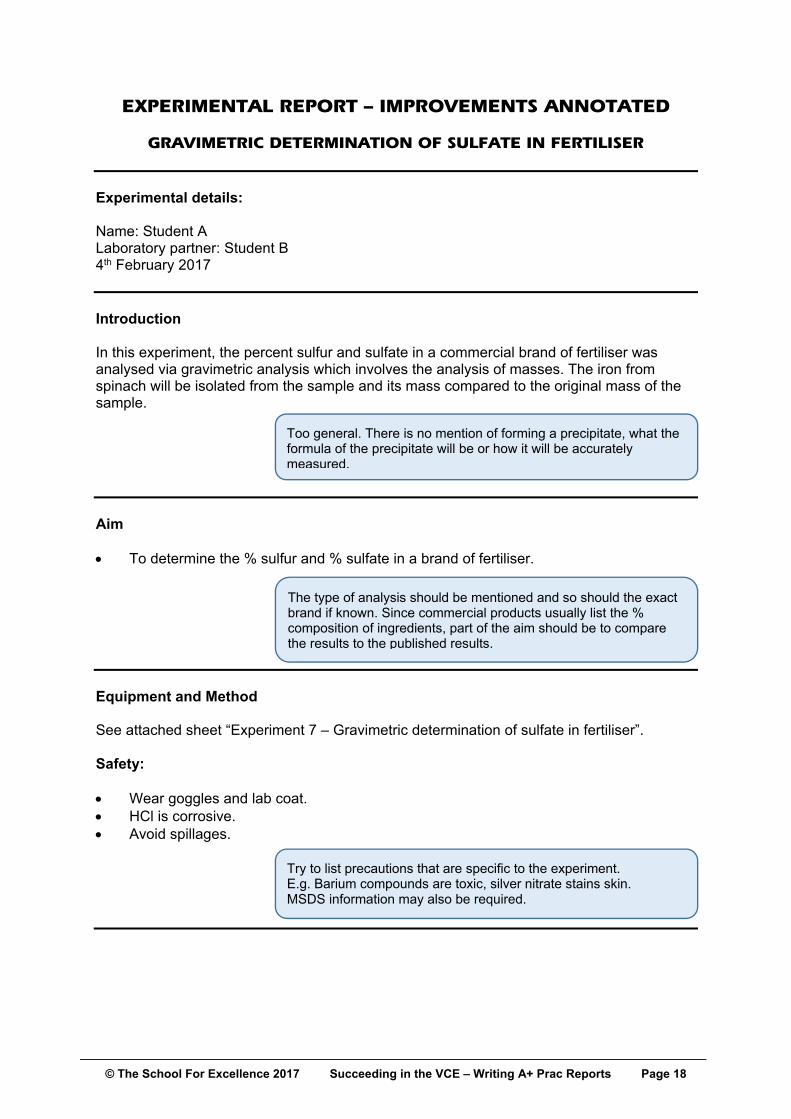
EXPERIMENTAL REPORT — IMPROVEMENTS ANNOTATED
GRAVIMETRIC DETERMINATION OF SULFATE IN FERTILISER Experimental details: Name: Student A Laboratory partner: Student B 4th February 2017 Introduction In this experiment, the percent sulfur and sulfate in a commercial brand of fertiliser was analysed via gravimetric analysis which involves the analysis of masses. The iron from spinach will be isolated from the sample and its mass compared to the original mass of the sample. Aim To determine the % sulfur and % sulfate in a brand of fertiliser. Equipment and Method See attached sheet “Experiment 7 – Gravimetric determination of sulfate in fertiliser”. Safety: Wear goggles and lab coat. HCl is corrosive. Avoid spillages.
Too general. There is no mention of forming a precipitate, what the formula of the precipitate will be or how it will be accurately measured.
The type of analysis should be mentioned and so should the exact brand if known. Since commercial products usually list the % composition of ingredients, part of the aim should be to compare the results to the published results.
Try to list precautions that are specific to the experiment. E.g. Barium compounds are toxic, silver nitrate stains skin. MSDS information may also be required.

© The School For Excellence 2017 Succeeding in the VCE – Writing A+ Prac Reports Page 19
Results Quantitative Results Table 1: Masses
Mass of Fertiliser Sample (g) Mass of Filter Paper (g)
1.000 2.08
Table 2: Masses recorded during drying
Mass of Filter Paper + BaSO4 (g) ±0.005 g
1st drying 2.095
2nd drying 2.441
3rd drying 2.441
Table 3: Class results
% w/w sulfate and sulfur in Quickgrow fertiliser
% sulfate % sulfur
Group 1 15.8 ± 3.2% 5.26 % ±3.2%
Group 2 14.5 ±3.3% 4.83 % ± 3.3%
Group 3 19.4 ±3.0% 6.46 % ± 3.0%
Group 4 16.1 ±3.2% 5.36 % + 3.2%
Our result 14.9 ±3.3% 4.96 % ± 3.3%
Uncertainties are missing. Data is not presented with the same precision. If the same scale was used for both measurements, both pieces of data should have three decimal places.
Personal language. Could be “This experiment”
© The School For Excellence 2017 Succeeding in the VCE – Writing A+ Prac Reports Page 20
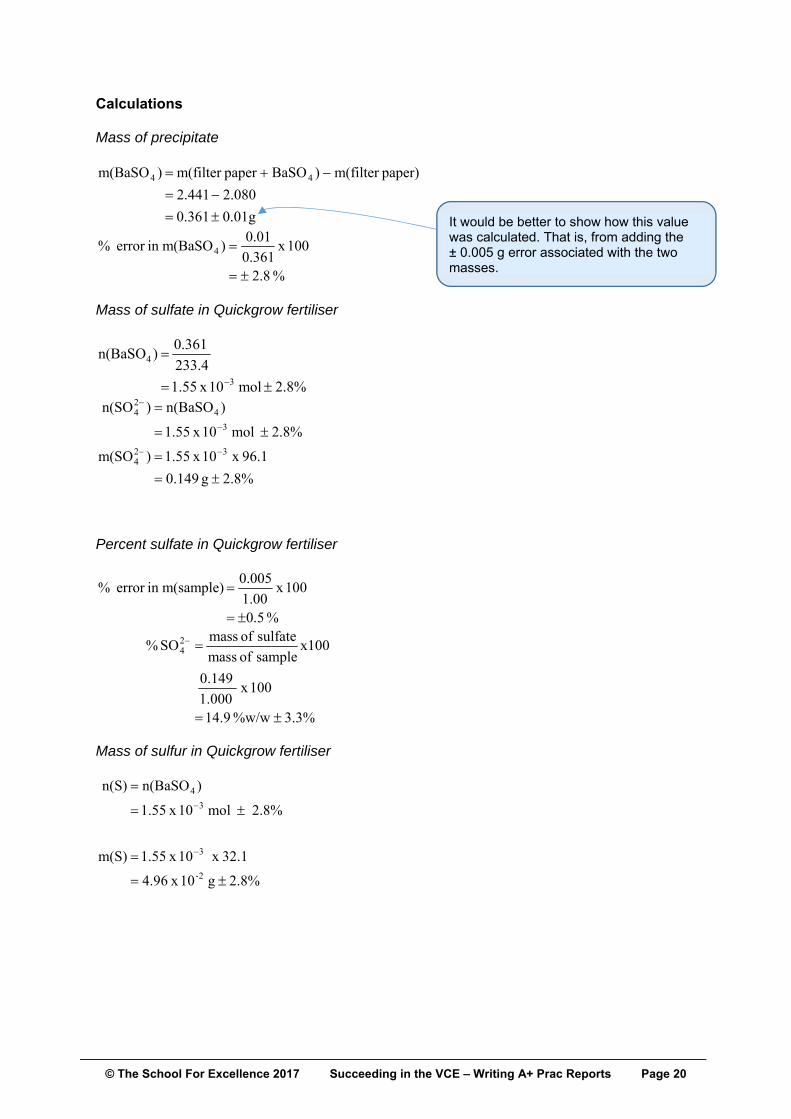
Calculations Mass of precipitate
0.01g0.361
2.0802.441
paper)m(filter )BaSOpaperm(filter )m(BaSO 44
% 2.8
100 x 0.361
0.01)m(BaSOin error % 4
Mass of sulfate in Quickgrow fertiliser
2.8% mol 10 x 1.55
233.4
0.361)n(BaSO
3
4
2.8% g 0.149
96.1 x 10 x 1.55)m(SO
2.8% mol 10 x 1.55
)n(BaSO)n(SO
324
3
424
Percent sulfate in Quickgrow fertiliser
% 0.5
100 x 1.00
0.005m(sample)in error %
3.3% %w/w 14.9
100 x 1.000
0.149
x100sample of mass
sulfate of massSO % 2
4
Mass of sulfur in Quickgrow fertiliser
2.8% g 10 x 4.96
32.1 x 10 x 1.55m(S)
2.8% mol 10 x 1.55
)n(BaSOn(S)
2-
3
3
4
It would be better to show how this value was calculated. That is, from adding the ± 0.005 g error associated with the two masses.
© The School For Excellence 2017 Succeeding in the VCE – Writing A+ Prac Reports Page 21
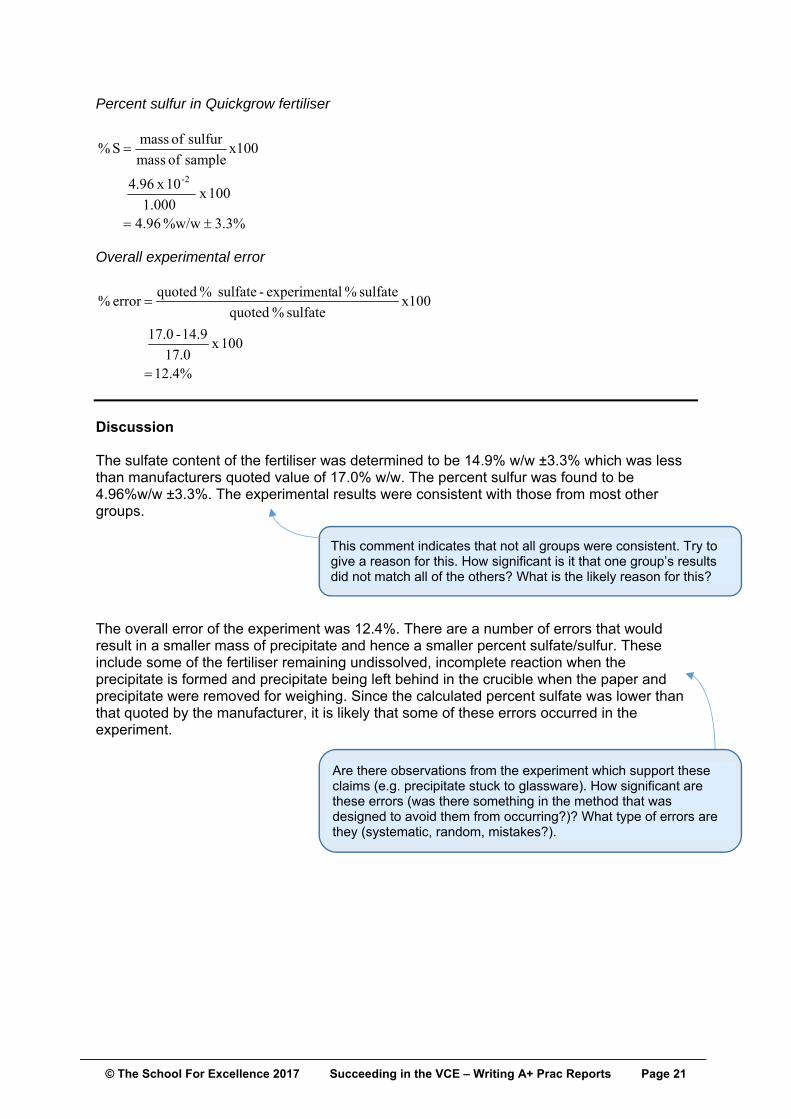
Percent sulfur in Quickgrow fertiliser
3.3% %w/w 4.96
100 x 1.000
10 x 4.96
x100sample of mass
sulfur of massS %
2-
Overall experimental error
12.4%
100 x 17.0
14.9 - 17.0
x100sulfate % quoted
sulfate % alexperiment - sulfate % quotederror %
Discussion The sulfate content of the fertiliser was determined to be 14.9% w/w ±3.3% which was less than manufacturers quoted value of 17.0% w/w. The percent sulfur was found to be 4.96%w/w ±3.3%. The experimental results were consistent with those from most other groups. The overall error of the experiment was 12.4%. There are a number of errors that would result in a smaller mass of precipitate and hence a smaller percent sulfate/sulfur. These include some of the fertiliser remaining undissolved, incomplete reaction when the precipitate is formed and precipitate being left behind in the crucible when the paper and precipitate were removed for weighing. Since the calculated percent sulfate was lower than that quoted by the manufacturer, it is likely that some of these errors occurred in the experiment.
This comment indicates that not all groups were consistent. Try to give a reason for this. How significant is it that one group’s results did not match all of the others? What is the likely reason for this?
Are there observations from the experiment which support these claims (e.g. precipitate stuck to glassware). How significant are these errors (was there something in the method that was designed to avoid them from occurring?)? What type of errors are they (systematic, random, mistakes?).

© The School For Excellence 2017 Succeeding in the VCE – Writing A+ Prac Reports Page 22
There are also errors that could increase the mass of the precipitate and hence increase the calculated percent sulfate/sulfur. For example, there could have been co-precipitation by other ions and the precipitate may not have been washed or dried properly. There were procedures put in place to avoid these errors so they should not have had a significant effect on the mass of precipitate collected. There are a number of improvements which could be made to the experiment. Heating and cooling could be used at various stages to ensure each process goes to completion. Instead of pre-weighing just the filter paper, the crucible could be pre-weighed too. In the drying step, the crucible, paper and precipitate could be weighed and this would avoid transfer errors. Overall, however, the experiment seemed to go well and the percentage sulfate/sulfur was determined. Conclusion The percent sulfur in the fertiliser was 4.96%w/w ±3.3% and the percent sulfate was 14.9%w/w ±3.3%.
With what? Try to be specific. Look at what else is in the fertiliser that could form a precipitate.
Like what? Try to be specific.
Which stages?
These two sentences could be better phrased: “… the crucible could be pre-weighed too. Then, in the drying step….”
Arrgh! A meaningless comment. What evidence is there that it ‘went well’? Give an indication of how accurate the result was!
Comment on the accuracy of the experiment and how the results compared to the manufacturer’s claims.

© The School For Excellence 2017 Succeeding in the VCE – Writing A+ Prac Reports Page 23
OBSERVATION SKILLS Making and recognising the significance of observations during experiments is an essential skill. You will rely on your observations to make meaningful comments about the success or failure of your experiment. They will also allow you to identify sources of error.
Observation Implication
The indicator changed slowly from yellow to pink
The HCl acid solution was slightly opaque.
The breeze in the room was causing fluctuating readings on the scales.
The sample was difficult to dissolve.
Unexpected bubbles were observed during the reaction.
The temperature of the beaker increased then the reactants were mixed.
A fruity smell was apparent during the reaction
Two groups making the same concentration of copper sulfate solution end up with solutions that differ in the intensity of the ‘blue’ colour.
The Mg ribbon is dull and black
There was precipitate stuck to the crucible.
© The School For Excellence 2017 Succeeding in the VCE – Writing A+ Prac Reports Page 24
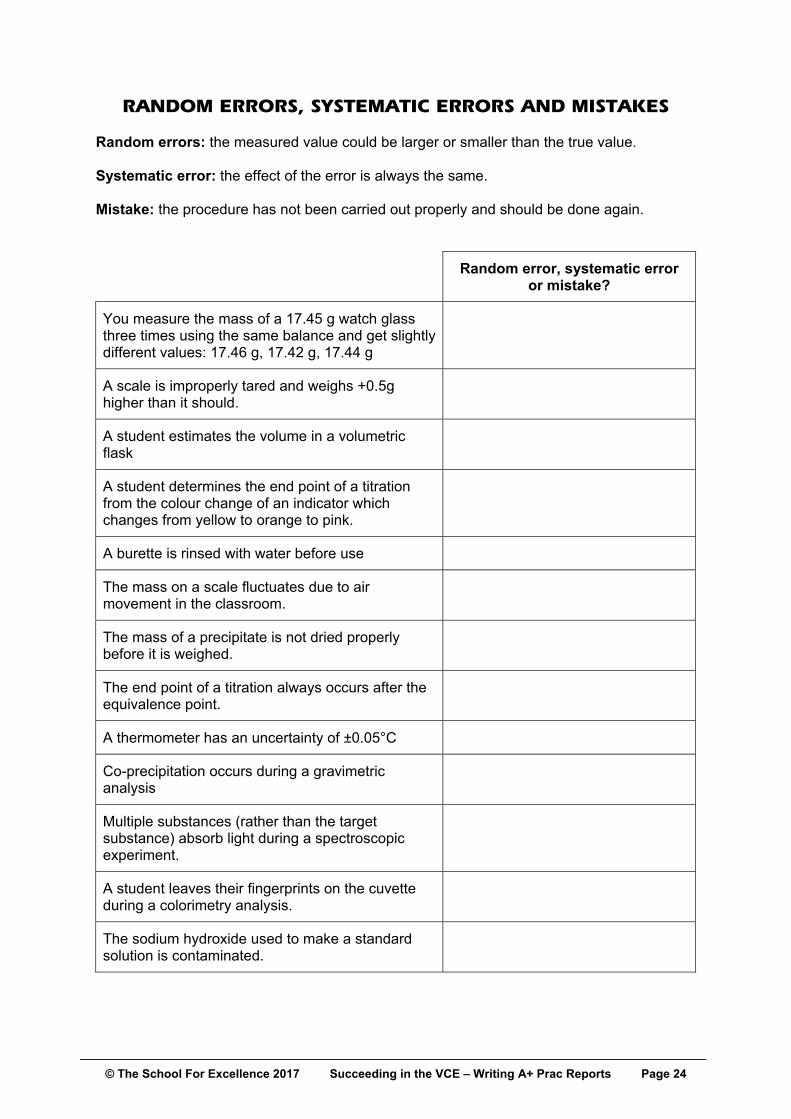
RANDOM ERRORS, SYSTEMATIC ERRORS AND MISTAKES Random errors: the measured value could be larger or smaller than the true value. Systematic error: the effect of the error is always the same. Mistake: the procedure has not been carried out properly and should be done again.
Random error, systematic error
or mistake?
You measure the mass of a 17.45 g watch glass three times using the same balance and get slightly different values: 17.46 g, 17.42 g, 17.44 g
A scale is improperly tared and weighs +0.5g higher than it should.
A student estimates the volume in a volumetric flask
A student determines the end point of a titration from the colour change of an indicator which changes from yellow to orange to pink.
A burette is rinsed with water before use
The mass on a scale fluctuates due to air movement in the classroom.
The mass of a precipitate is not dried properly before it is weighed.
The end point of a titration always occurs after the equivalence point.
A thermometer has an uncertainty of ±0.05°C
Co-precipitation occurs during a gravimetric analysis
Multiple substances (rather than the target substance) absorb light during a spectroscopic experiment.
A student leaves their fingerprints on the cuvette during a colorimetry analysis.
The sodium hydroxide used to make a standard solution is contaminated.
© The School For Excellence 2017 Succeeding in the VCE – Writing A+ Prac Reports Page 25
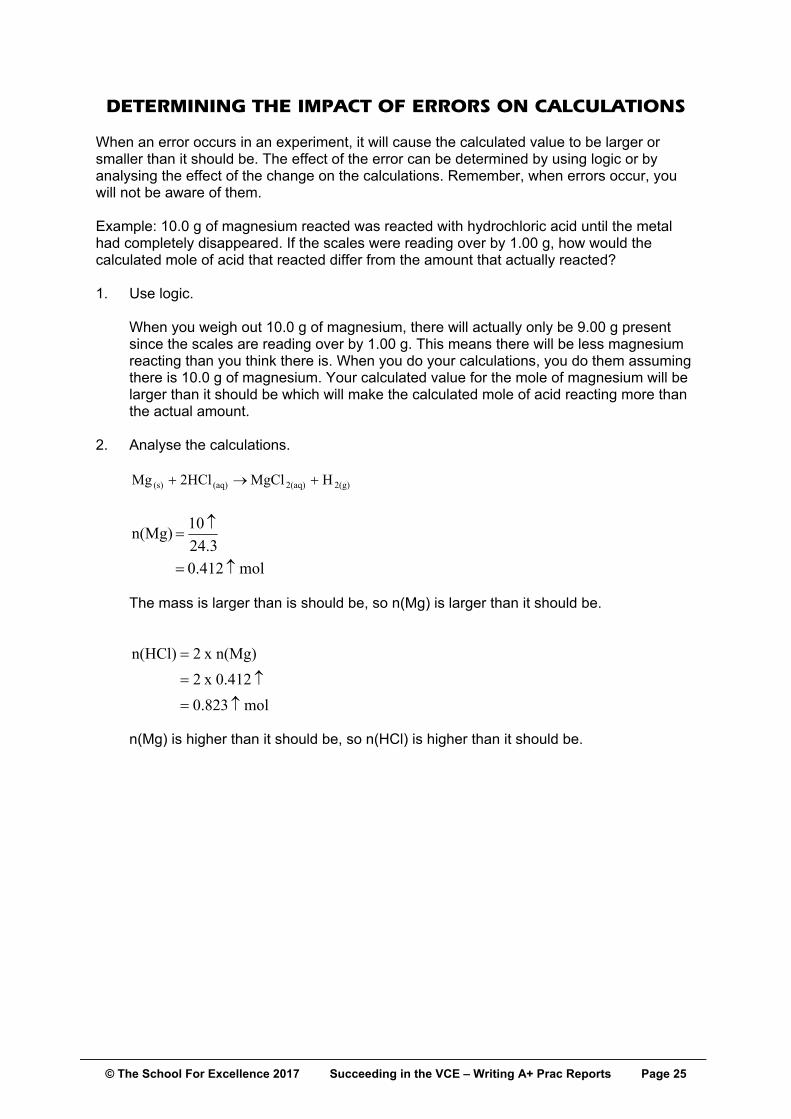
DETERMINING THE IMPACT OF ERRORS ON CALCULATIONS When an error occurs in an experiment, it will cause the calculated value to be larger or smaller than it should be. The effect of the error can be determined by using logic or by analysing the effect of the change on the calculations. Remember, when errors occur, you will not be aware of them. Example: 10.0 g of magnesium reacted was reacted with hydrochloric acid until the metal had completely disappeared. If the scales were reading over by 1.00 g, how would the calculated mole of acid that reacted differ from the amount that actually reacted? 1. Use logic.
When you weigh out 10.0 g of magnesium, there will actually only be 9.00 g present since the scales are reading over by 1.00 g. This means there will be less magnesium reacting than you think there is. When you do your calculations, you do them assuming there is 10.0 g of magnesium. Your calculated value for the mole of magnesium will be larger than it should be which will make the calculated mole of acid reacting more than the actual amount.
2. Analyse the calculations.
2(g)2(aq)(aq)(s) HMgCl2HClMg
mol 0.412
24.3
10 n(Mg)
The mass is larger than is should be, so n(Mg) is larger than it should be.
mol 0.823
0.412 x 2
n(Mg) x 2n(HCl)
n(Mg) is higher than it should be, so n(HCl) is higher than it should be.
© The School For Excellence 2017 Succeeding in the VCE – Writing A+ Prac Reports Page 26
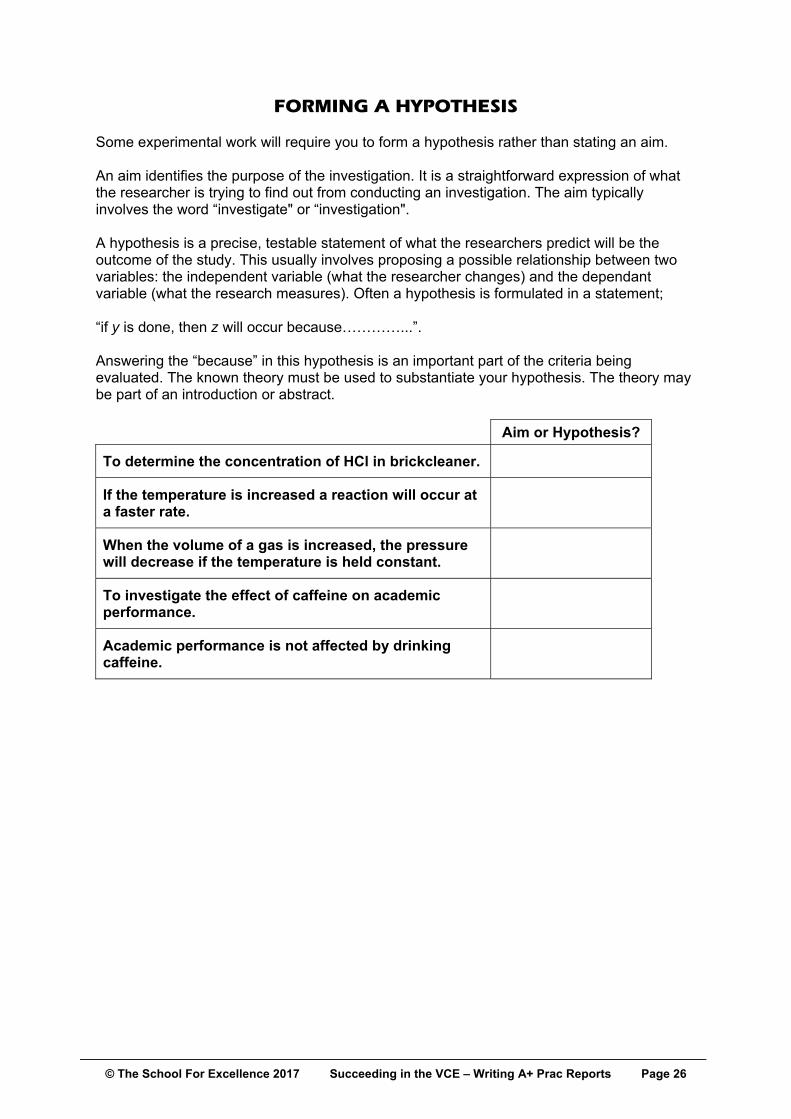
FORMING A HYPOTHESIS Some experimental work will require you to form a hypothesis rather than stating an aim. An aim identifies the purpose of the investigation. It is a straightforward expression of what the researcher is trying to find out from conducting an investigation. The aim typically involves the word “investigate" or “investigation". A hypothesis is a precise, testable statement of what the researchers predict will be the outcome of the study. This usually involves proposing a possible relationship between two variables: the independent variable (what the researcher changes) and the dependant variable (what the research measures). Often a hypothesis is formulated in a statement; “if y is done, then z will occur because…………...”. Answering the “because” in this hypothesis is an important part of the criteria being evaluated. The known theory must be used to substantiate your hypothesis. The theory may be part of an introduction or abstract. Aim or Hypothesis?
To determine the concentration of HCl in brickcleaner.
If the temperature is increased a reaction will occur at a faster rate.
When the volume of a gas is increased, the pressure will decrease if the temperature is held constant.
To investigate the effect of caffeine on academic performance.
Academic performance is not affected by drinking caffeine.
© The School For Excellence 2017 Succeeding in the VCE – Writing A+ Prac Reports Page 27
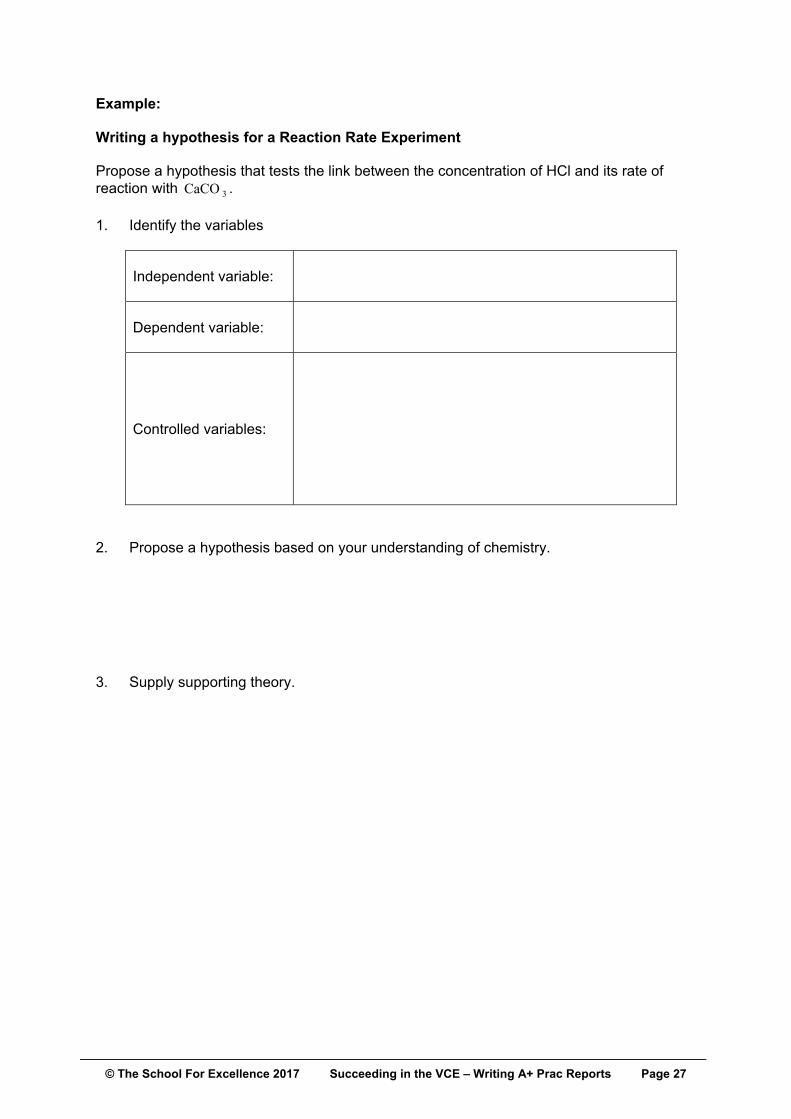
Example: Writing a hypothesis for a Reaction Rate Experiment Propose a hypothesis that tests the link between the concentration of HCl and its rate of reaction with 3CaCO . 1. Identify the variables
Independent variable:
Dependent variable:
Controlled variables:
2. Propose a hypothesis based on your understanding of chemistry.
3. Supply supporting theory.
© The School For Excellence 2017 Succeeding in the VCE – Writing A+ Prac Reports Page 28
HOW TO PROPOSE A TESTABLE HYPOTHESIS Tips for writing a hypothesis.
Try to write the hypothesis as an if-then statement. IF an action is taken, then a certain
outcome is expected.
Identify the independent and dependent variable in the hypothesis. The independent variable is the one that is being changed in a controlled manner. The dependent variable is the one that changes because of this.
Write the hypothesis in such a way that it can be proven or disproven. For example, a
person has skin cancer, it can't be proven they got it from being out in the sun. However, it can demonstrated that there is a relationship between exposure to ultraviolet light and increased risk of skin cancer.
Make sure the hypothesis can be tested with reproducible results. If your face breaks
out, it can't be proven that it was caused by the french fries you had for dinner last night. However, the effect of eating french fries on skin conditions can be measured. It's a matter of gathering enough data to be able to reproduce results and draw a conclusion.
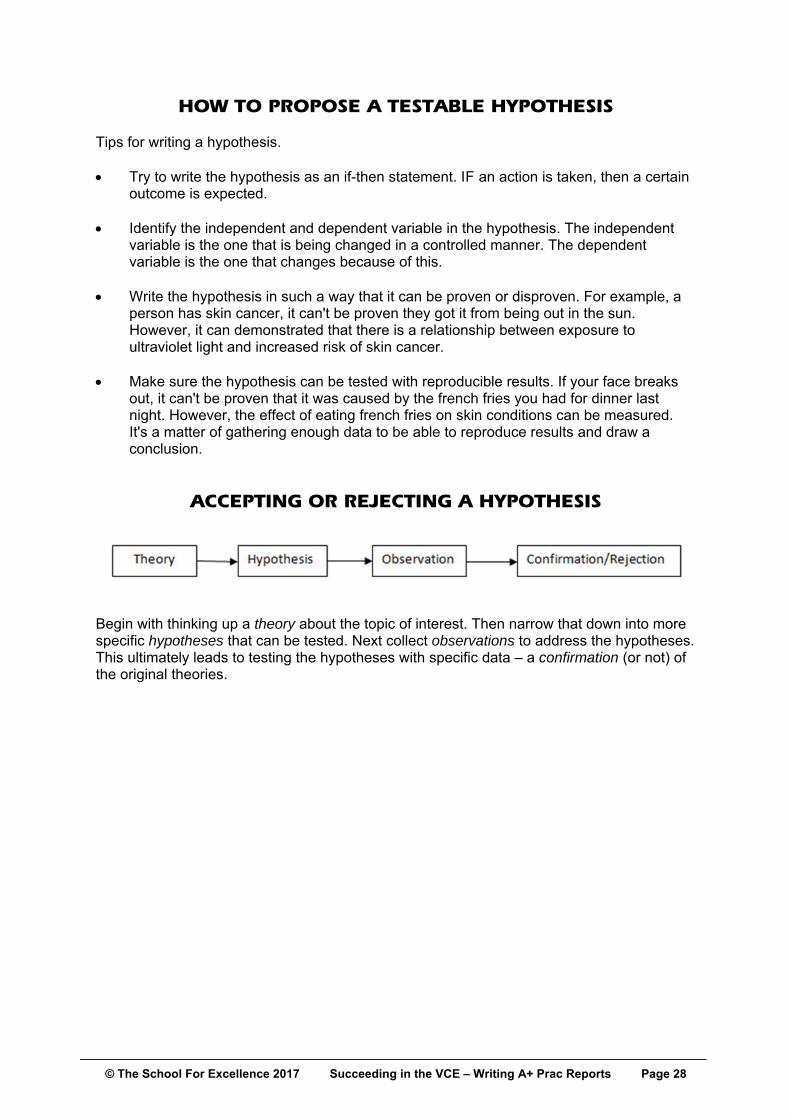
ACCEPTING OR REJECTING A HYPOTHESIS
Begin with thinking up a theory about the topic of interest. Then narrow that down into more specific hypotheses that can be tested. Next collect observations to address the hypotheses. This ultimately leads to testing the hypotheses with specific data – a confirmation (or not) of the original theories.

© The School For Excellence 2017 Succeeding in the VCE – Writing A+ Prac Reports Page 29
THE IMPORTANCE OF UNDERSTANDING PRACTICAL WORK Competent practical writing skills are not only required for success in SACs, but also for success in certain exam situations. For the last three years in a row, the final exam has included at least one question which focusses on experimental procedure. Therefore, it is imperative that a good understanding of experimental procedure is part of your exam preparation.
Year of Exam Marks based on
experimental procedure % of total marks
2016 7 5.8
2015 6 5.0
2014 6 5.0
Past exam questions have focussed on critically reviewing the design and results of the given experiment. Students are typically asked to: Identify and explain improvements to the method.
Identify the strengths of the given method. Discuss the expected outcomes and justify them with the relevant chemical theory.
Identify safety measures.
Identify errors or omissions and predict their effect on the final result. Predictions also
need to be justified.
Comment on the validity of the results.
The best place to practise discussing these types of issues is in your practical reports!
© The School For Excellence 2017 Succeeding in the VCE – Writing A+ Prac Reports Page 30
SAFETY ISSUES It is common to be asked for a relevant safety precaution for the experiment described in the question. To successfully answer this question your answer should be specific and relevant to the experiment described in the question. Answers such as: Wear a lab coat
Wear goggles
Wear mask
are generally not specific enough! If a chemical is corrosive then full body protection must be worn, a lab coat is not
adequate.
If a reaction is explosive, full protective head gear would be required.
If a chemical is volatile and poisonous, full breathing apparatus is required.
EVALUATING EXPERIMENTAL PROCEDURE Things to look out for: Were the relevant variables controlled?
Were there variables that couldn’t be controlled?
Was the method successful in testing the aim?
Does the given conclusion match the results?
What errors occurred? Could they have been avoided? How?
What was the effect of the errors?
Were enough trials completed?
Were the results accurate and precise?
What further testing should be done? Comment from chief examiner 2015: “…more practice is needed in the analysis of experimental techniques, recorded data and associated calculations. Students’ ability to discuss the appropriateness of practical procedures and associated calculations is related to their practical experience throughout VCE Chemistry. Responses to this question suggested that further discussion of procedures and associated calculations when considering experimental work is needed.”
Excerpt from: VCE Chemistry examination report 2015
© The School For Excellence 2017 Succeeding in the VCE – Writing A+ Prac Reports Page 31
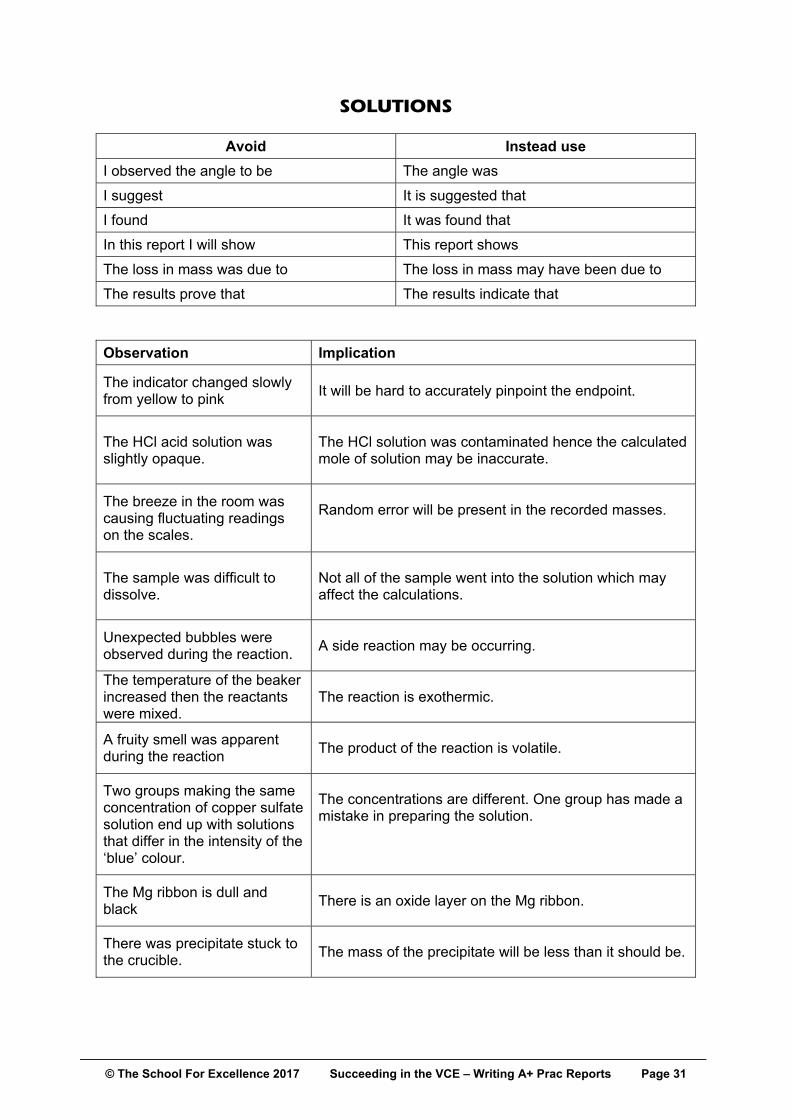
SOLUTIONS
Avoid Instead use
I observed the angle to be The angle was
I suggest It is suggested that
I found It was found that
In this report I will show This report shows
The loss in mass was due to The loss in mass may have been due to
The results prove that The results indicate that
Observation Implication
The indicator changed slowly from yellow to pink
It will be hard to accurately pinpoint the endpoint.
The HCl acid solution was slightly opaque.
The HCl solution was contaminated hence the calculated mole of solution may be inaccurate.
The breeze in the room was causing fluctuating readings on the scales.
Random error will be present in the recorded masses.
The sample was difficult to dissolve.
Not all of the sample went into the solution which may affect the calculations.
Unexpected bubbles were observed during the reaction.
A side reaction may be occurring.
The temperature of the beaker increased then the reactants were mixed.
The reaction is exothermic.
A fruity smell was apparent during the reaction
The product of the reaction is volatile.
Two groups making the same concentration of copper sulfate solution end up with solutions that differ in the intensity of the ‘blue’ colour.
The concentrations are different. One group has made a mistake in preparing the solution.
The Mg ribbon is dull and black
There is an oxide layer on the Mg ribbon.
There was precipitate stuck to the crucible.
The mass of the precipitate will be less than it should be.
© The School For Excellence 2017 Succeeding in the VCE – Writing A+ Prac Reports Page 32
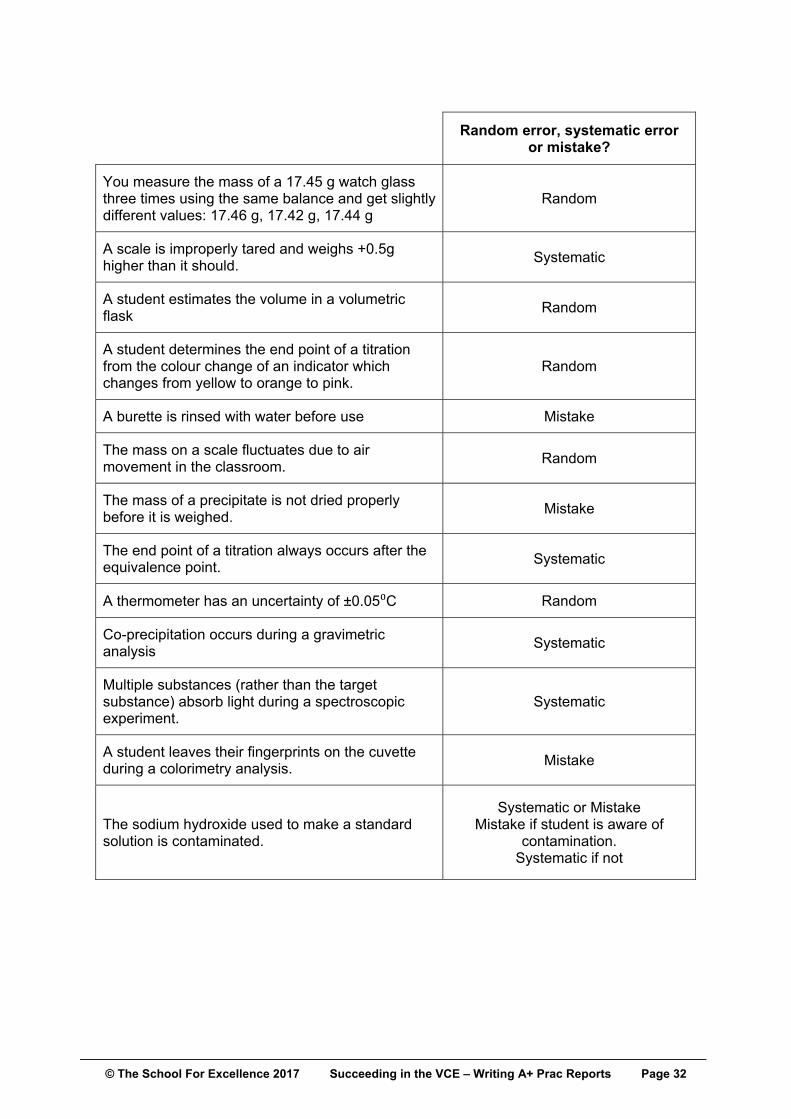
Random error, systematic error or mistake?
You measure the mass of a 17.45 g watch glass three times using the same balance and get slightly different values: 17.46 g, 17.42 g, 17.44 g
Random
A scale is improperly tared and weighs +0.5g higher than it should.
Systematic
A student estimates the volume in a volumetric flask
Random
A student determines the end point of a titration from the colour change of an indicator which changes from yellow to orange to pink.
Random
A burette is rinsed with water before use Mistake
The mass on a scale fluctuates due to air movement in the classroom.
Random
The mass of a precipitate is not dried properly before it is weighed.
Mistake
The end point of a titration always occurs after the equivalence point.
Systematic
A thermometer has an uncertainty of ±0.05⁰C Random
Co-precipitation occurs during a gravimetric analysis
Systematic
Multiple substances (rather than the target substance) absorb light during a spectroscopic experiment.
Systematic
A student leaves their fingerprints on the cuvette during a colorimetry analysis.
Mistake
The sodium hydroxide used to make a standard solution is contaminated.
Systematic or Mistake Mistake if student is aware of
contamination. Systematic if not
© The School For Excellence 2017 Succeeding in the VCE – Writing A+ Prac Reports Page 33
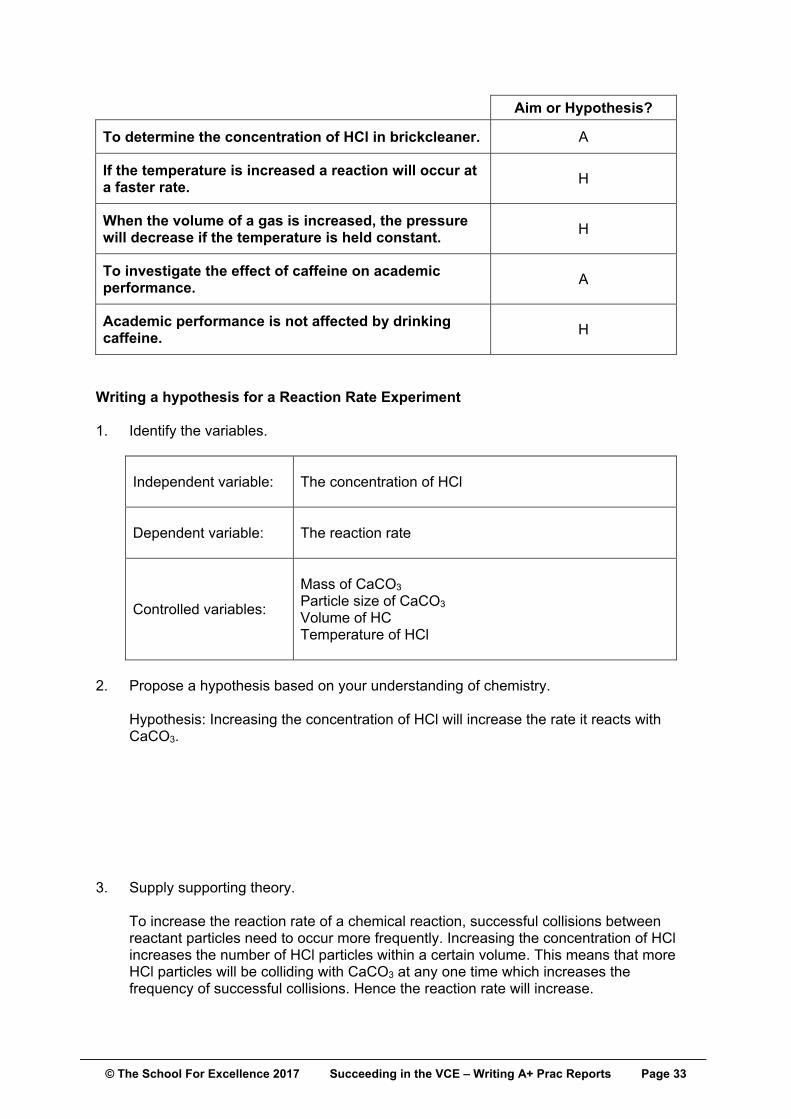
Aim or Hypothesis?
To determine the concentration of HCl in brickcleaner. A
If the temperature is increased a reaction will occur at a faster rate.
H
When the volume of a gas is increased, the pressure will decrease if the temperature is held constant.
H
To investigate the effect of caffeine on academic performance.
A
Academic performance is not affected by drinking caffeine.
H
Writing a hypothesis for a Reaction Rate Experiment 1. Identify the variables.
Independent variable: The concentration of HCl
Dependent variable: The reaction rate
Controlled variables:
Mass of CaCO3 Particle size of CaCO3 Volume of HC Temperature of HCl
2. Propose a hypothesis based on your understanding of chemistry.
Hypothesis: Increasing the concentration of HCl will increase the rate it reacts with CaCO3.
3. Supply supporting theory.
To increase the reaction rate of a chemical reaction, successful collisions between reactant particles need to occur more frequently. Increasing the concentration of HCl increases the number of HCl particles within a certain volume. This means that more HCl particles will be colliding with CaCO3 at any one time which increases the frequency of successful collisions. Hence the reaction rate will increase.


![[Specialist] 2010 TSFX Exam 2](https://static.fdocuments.net/doc/165x107/577c849a1a28abe054b999cf/specialist-2010-tsfx-exam-2.jpg)
