WRAP MDD023 WEEE Separation techniques of... · WRAP MDD023 WEEE Separation Techniques – Dry...
24
WRAP MDD018/23 WEEE separation techniques Dry Jigging (University of Nottingham) trial report Abstract Pneumatic separation techniques (for example air tables) were in fairly widespread use in the coal industry in the early to middle part of the 20 th Century. Since then the techniques have fallen out of use, primarily because the moisture content of the feeds were progressively higher making the technique highly inefficient. From an operational point of view such units had high capacities, of up to about 50-100 tonnes per hour per metre width. However with a drive to explore new methods of dry processing in the minerals industry there is an increasing level of interest on pneumatic separation processes. At the University of Nottingham a re-appraisal of pneumatic jigging has led to the development of an experimental batch-scale jig that was used in this trial work. Trials were performed to assess the potential of pneumatic jigging as a means to generate a metal/copper-rich product from Waste Electrical and Electronic Equipment (WEEE) using a batch-scale experimental jig. The results were promising in that copper-rich products could be generated from the WEEE samples at a copper concentration level of around 44 to 54%. The work contained in this report indicates that pneumatic dry jigging shows potential for recovery of valuable materials from a WEEE stream. However, this is based on a batch based experimental jig and to be of commercial relevance further work would be required to design and develop a continuous pneumatic jig. 1
Transcript of WRAP MDD023 WEEE Separation techniques of... · WRAP MDD023 WEEE Separation Techniques – Dry...
WRAP MDD018/23 WEEE separation techniques
Dry Jigging (University of Nottingham) trial report
Abstract
Pneumatic separation techniques (for example air tables) were in fairly widespread use in
the coal industry in the early to middle part of the 20th Century. Since then the techniques
have fallen out of use, primarily because the moisture content of the feeds were
progressively higher making the technique highly inefficient. From an operational point of
view such units had high capacities, of up to about 50-100 tonnes per hour per metre width.
However with a drive to explore new methods of dry processing in the minerals industry
there is an increasing level of interest on pneumatic separation processes. At the University
of Nottingham a re-appraisal of pneumatic jigging has led to the development of an
experimental batch-scale jig that was used in this trial work.
Trials were performed to assess the potential of pneumatic jigging as a means to generate a
metal/copper-rich product from Waste Electrical and Electronic Equipment (WEEE) using a
batch-scale experimental jig. The results were promising in that copper-rich products could
be generated from the WEEE samples at a copper concentration level of around 44 to 54%.
The work contained in this report indicates that pneumatic dry jigging shows potential for
recovery of valuable materials from a WEEE stream. However, this is based on a batch
based experimental jig and to be of commercial relevance further work would be required to
design and develop a continuous pneumatic jig.
1

WRAP MDD023 WEEE Separation Techniques – Dry Jigging Trial – Nottingham University
Contents Abstract 1
1.0 ...................................................................................... 5 Information from Trial
1.1 .................................................................... 5 Description of Trial Equipment
1.2 ................................................................... 6 Photograph of Trial Equipment
1.3 .............................................................................. 7 Overall Trial Objectives
1.4 ......................................................................................... 8 Sample Material
1.5 ................................................................................................. 9 Procedure
2.0 ................................................................................... 9 Trial 1 (Axion Sample 1)
2.1 ............................................................................... 9 Specific Trial Objective
2.2 ............................................................................................ 9 Feed Material
2.3 .................................................................................. 9 Results and Analysis
2.4 .................................................................. 10 Photograph of Result Samples
2.5 ............................................................................... 13 Discussion of Results
2.6 .............................................................................. 13 Conclusions from Trial
3.0 ................................................................................. 14 Trial 2 (Axion Sample 2)
3.1 ............................................................................. 14 Specific Trial Objective
3.2 .......................................................................................... 14 Feed Material
3.3 ................................................................................ 14 Results and Analysis
3.5 ............................................................................... 18 Discussion of Results
3.6 .............................................................................. 18 Conclusions from Trial
4.0 .................................................................... 20 Trial 3 (Axion Sample 2 –retreat)
4.1 ............................................................................. 20 Specific Trial Objective
4.2 .......................................................................................... 20 Feed Material
4.3 ................................................................................ 20 Results and Analysis
4.5 ............................................................................... 22 Discussion of Results
4.6 .............................................................................. 23 Conclusions from Trial
5.0 ........................................................................................ 23 Overall Conclusions
2
WRAP MDD023 WEEE Separation Techniques – Dry Jigging Trial – Nottingham University
List of Figures
Figure Page
Fig 1: Batch scale experimental pneumatic jig 7
Fig 2: Schematic of the pneumatic dry jig and separation chamber 8
Fig 3: Riffled Samples 9
Fig 4: Sample 1 – side view of jig showing the three layers after separation 11
Fig 5: Sample 1 – top layer 11
Fig 6: Sample 1 – middle layer 11
Fig 7: Sample 1 – bottom layer (copper/metal rich fraction) 12
Fig 8: Sample 1 – top view of jig compartment showing the bottom layer after the upper layers have been
removed
12
Fig 9: Sample 2 – side view of jig showing the three layers after separation 16
Fig 10: Sample 2 – top layer 16
Fig 11: Sample 2 – middle layer 16
Fig 12: Sample 2 – bottom layer 17
Fig 13: Sample 2 – top view of jig compartment showing the bottom layer after the upper layers have
been removed
17
Fig 14: Sample 2 (retreat) – top layer 21
Fig 15: Sample 2 (retreat) – bottom layer 22
3

WRAP MDD023 WEEE Separation Techniques – Dry Jigging Trial – Nottingham University
List of Tables
Table Page
Table 1: Details of WEEE samples 9
Table 2: Sample 1 – mass distribution across product layers 12
Table 3: Sample 1 – % concentration of components in bottom layer 13
Table 4: Sample 1 – % combustibles in bottom layer 13
Table 5: Sample 2 – mass distribution across product layers 18
Table 6: Sample 2 – % concentration of components in bottom layer 18
Table 7: Sample 2 – % combustibles in bottom layer 18
Table 8: Sample 2 (retreat) – mass distribution across product layers 20
Table 9: Sample 2 (retreat) – mass distribution across product layers 21
4
WRAP MDD023 WEEE Separation Techniques – Dry Jigging Trial – Nottingham University
1.0 Information from Trial
Trial host: University of Nottingham, United Kingdom
Trial equipment: Batch scale experimental pneumatic jig
Trial date: 9th March 2009 to 31st March 2009
1.1 Description of trial equipment The experimental pneumatic jig was specially designed for batch scale operation and
consists of four major components:
Separation chamber;
Air supply unit (blower);
Air control units (the inverter and the butterfly valves); and
Programmable Logic Controller (PLC).
The main system component is the jig chamber where the actual separation takes place. It
is a 160mm x 160mm x 500mm square profile column made of perspex to enable
observation of the materials during the separation process. It has an open top which is
often covered with a mesh-like lid that helps to control upward splashing of the materials
during the separation process. The lower part of the separation chamber is fitted with a
removable bottom screen that consists of apertures that will retain the smallest particles of
feed material placed upon it yet will let sufficient airflow through.
During operation, the separation of feed materials is initiated by the flow of air, from an air
supply unit (the blower), that runs into the separation chamber. The blower is a 4.0 kW
centrifugal fan with the capacity to generate a continuous airflow up to a maximum fan
speed of about 3,000 rpm (equivalent to a superficial velocity of 50cm/s on a calibrated
scale). It has a single outlet that is coupled to a Y-shaped metal tube that connects the
blower to the bottom section of the separation chamber. The flow of air into the separation
chamber is regulated and controlled through the combined actions of a variable speed
control unit (inverter) and two pneumatic butterfly valves.
The two pneumatic butterfly valves are time-controlled to open and close in alternating
patterns; it is this alternating pattern of the valves that enables proper regulation of the
pulse frequencies, thus giving the device the jigging effect. A micro-programmable logic
5
WRAP MDD023 WEEE Separation Techniques – Dry Jigging Trial – Nottingham University
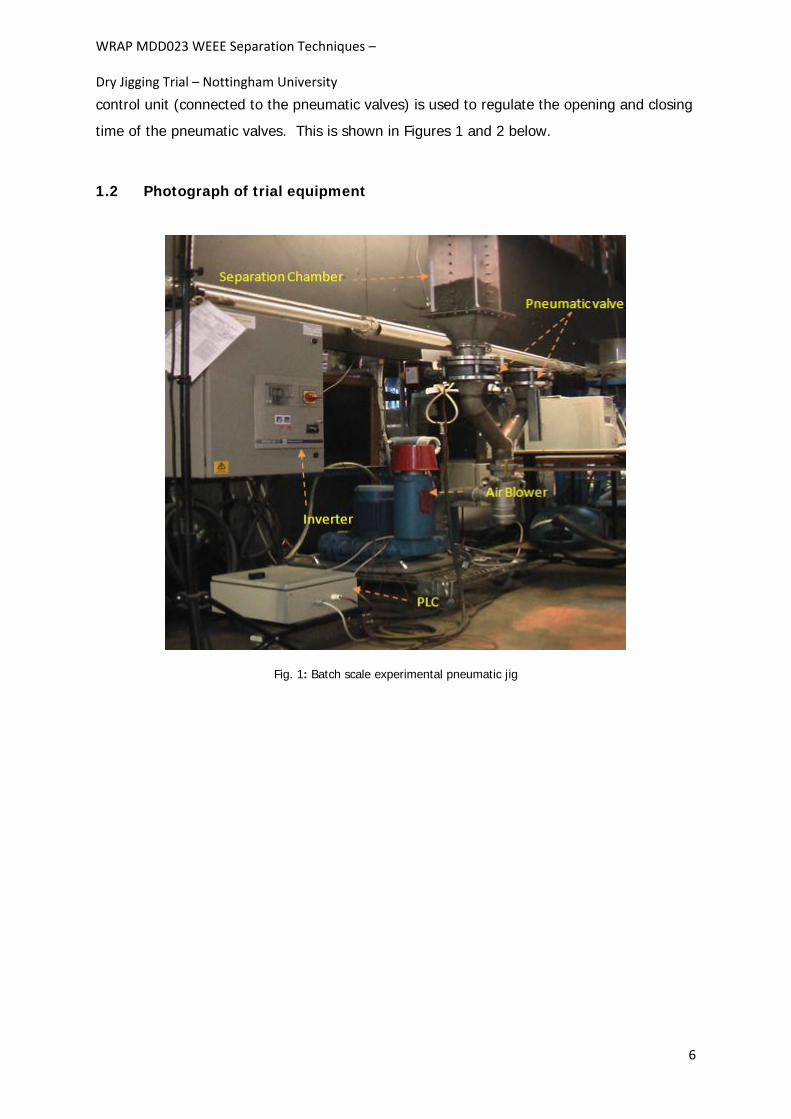
control unit (connected to the pneumatic valves) is used to regulate the opening and closing
time of the pneumatic valves. This is shown in Figures 1 and 2 below.
1.2 Photograph of trial equipment
Fig. 1: Batch scale experimental pneumatic jig
6

WRAP MDD023 WEEE Separation Techniques – Dry Jigging Trial – Nottingham University
Fig. 2: Schematic of the pneumatic dry jig and separation chamber
1.3 Trial objectives
The objective of the trial was to test the suitability of pneumatic dry jigging for processing materials derived from WEEE, with the specific aim of separating fine copper particles from copper-rich plastic mixtures. In commercial processing the materials will have already passed through conventional metal separation stages and the copper will have not been successfully recovered in a purity which is of interest to metal processors.
The combustible content of the copper fraction must be below 5% by weight to make it attractive to the majority of copper smelters in Europe. This is because conventional cupola furnaces are not designed to handle and clean significant gas flows from the melt. If the copper fraction contains too much plastic and other combustible material then this will burn in the furnace and create more gas than the furnace can cope with. There are very few specialist non-ferrous metal processors in Europe with the sophisticated gas cleaning systems required to cope with high plastic content. These processors target precious metals in non-ferrous scrap. The high value of the precious metals helps to justify the increased gas cleaning costs. The fine non-ferrous fraction from small WEEE tends to have a rather low precious metal content and is therefore of little interest to these specialist recyclers.
The objectives of this trial were:
To produce a copper fraction from WEEE containing less than 5% combustible material; and
7

WRAP MDD023 WEEE Separation Techniques – Dry Jigging Trial – Nottingham University
To produce individual fractions of stone/glass, metal and plastics or the metal distributed across stone/glass and plastics fractions.
1.4 Sample material
Three samples of various size fractions were supplied to the University of Nottingham by
Axion Recycling, derived from WEEE (see Table 1).
Material Size Sample Composition
<2.36 mm 1
2.36 – 5.0mm 2
WEEE
~12 mm 3
Plastic (70%), copper/metal (1-5%), PVC coated wires (~5%), rubber (~10%), glass, stone, wood and circuit boards
Table 1: Detail of WEEE Samples
Initially all the samples were riffled (a uniform sampling technique) down to produce a
range of representative samples for subsequent testing as shown in Figure 3.
Fig. 3: Riffled Samples
Some preliminary separation work was conducted using the jig to assess how amenable the
samples were to treatment and processing. These results indicated that Samples 1 and 2
produced layers of stratified particles, but stratification did not occur to any great degree for
Sample 3. Therefore, the trial focused on Samples 1 and 2 for treatment in the batch jig.
8

WRAP MDD023 WEEE Separation Techniques – Dry Jigging Trial – Nottingham University
1.5 Trial procedure For each run material was placed into the chamber and the airflow velocity and pulse
frequency were set from a pre-determined range for the trial. The jig was operated for a
300 second period, at the end of which the various stratified layers were removed and
subjected to both qualitative (visual inspection) and quantitative (Loss-on-Ignition (LOI) and
heavy liquid analysis) analysis. By conducting LOI it was possible to assess the quantity of
combustible (and non-combustible) material present in the materials. Heavy liquid analysis
was conducted using sodium polytungstate at two densities (2.2 and 2.8 g/cm3) to give
some indication of the quality of the products from the jig. Material that had a density less
than 2.2 g/cm3 would predominantly be wood, plastics and rubber; glass and stone would
be the major components in the 2.2 to 2.8 g/cm3 density range and at densities greater than
2.8 g/cm3 copper and other metals would be in the majority. It should be noted that the
above density classification only hold for fully liberated materials.
2.0 Trial 1 (Axion sample 1)
2.1 Specific trial objective
The objective of this trial was to produce a copper-rich fraction containing about 5%
combustible material or less. The presence of glass and stone was not considered to be
problematic in subsequent processing.
2.2 Feed material Material used in this trial (sample 1) had a particle size of less than 2.36mm. It comprised
plastic, copper, Poly Vinyl Chloride (PVC ) coated wires, rubber, small quantities of glass,
stone, wood and circuit board fragments.
2.3 Results and analysis The results of this trial covered the effect of both pulse frequency and air flow velocity on
subsequent separation.
Three experiments were conducted varying the pulse frequencies (75, 86 and 120
cycles/min) whilst maintaining a constant airflow velocity of 25cm/s over a jigging period of
300 seconds. A further experiment was conducted at an air flow velocity of 18 cm/s whilst
maintaining a constant pulse frequency of 86 cycles/min, over a similar jigging period of 300
seconds.
9
WRAP MDD023 WEEE Separation Techniques – Dry Jigging Trial – Nottingham University
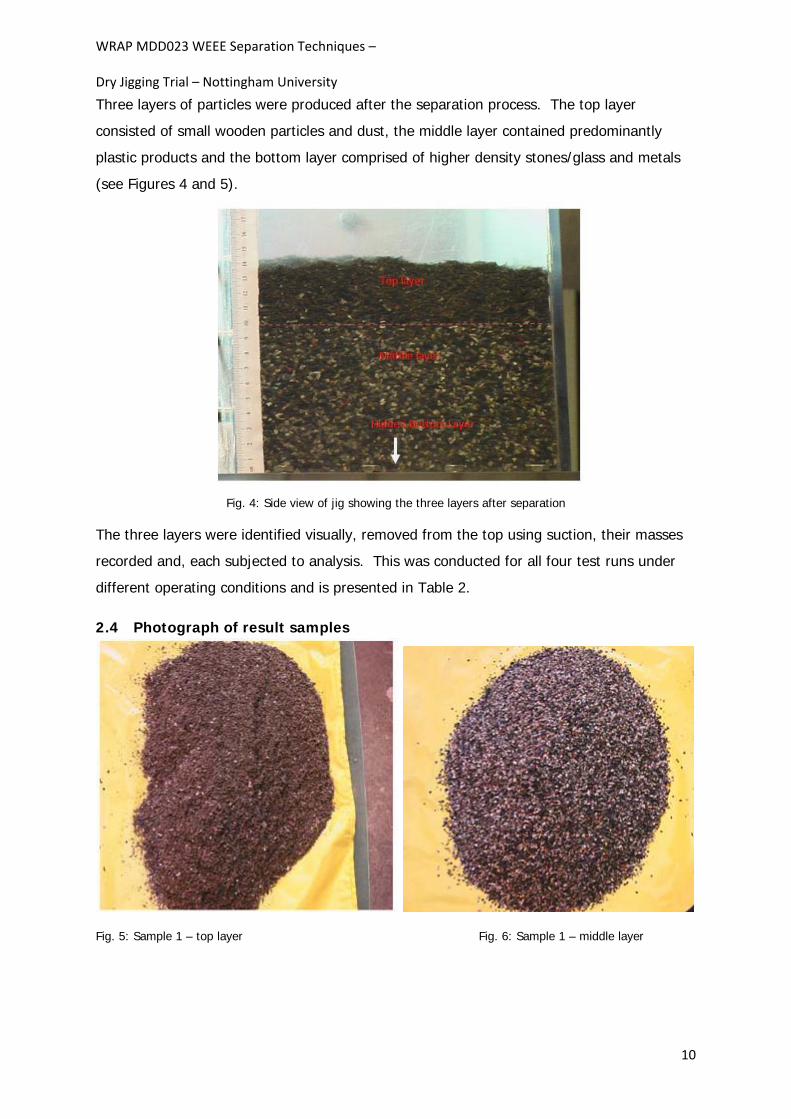
Three layers of particles were produced after the separation process. The top layer
consisted of small wooden particles and dust, the middle layer contained predominantly
plastic products and the bottom layer comprised of higher density stones/glass and metals
(see Figures 4 and 5).
Fig. 4: Side view of jig showing the three layers after separation
The three layers were identified visually, removed from the top using suction, their masses
recorded and, each subjected to analysis. This was conducted for all four test runs under
different operating conditions and is presented in Table 2.
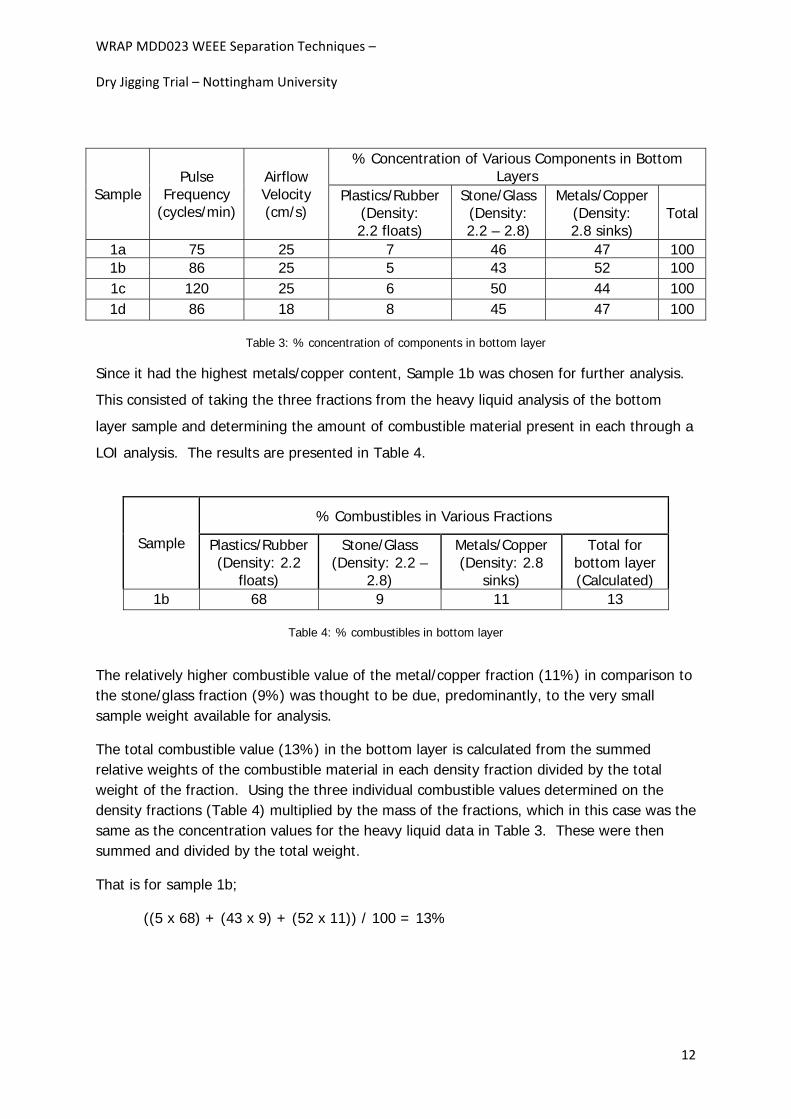
2.4 Photograph of result samples
Fig. 5: Sample 1 – top layer Fig. 6: Sample 1 – middle layer
10

WRAP MDD023 WEEE Separation Techniques – Dry Jigging Trial – Nottingham University
Fig. 7: Sample 1 – bottom layer (copper/metal rich fraction)
Fig. 8: Top view of jig compartment showing the bottom layer after the upper layers have been removed
% Mass Distribution Across Layers Sample Pulse Frequency
(cycles/min)
Airflow Velocity (cm/s) Top Middle Bottom Total
1a 75 25 17 63 20 100 1b 86 25 20 52 28 100 1c 120 25 15 63 22 100 1d 86 18 18 66 16 100
Table 2: Mass distribution across product layers
Since the bottom layers were considered to be the valuable phases containing the majority
of the metals (copper) they were subjected to heavy liquid analysis to ascertain the
approximate percentage of metals, plastics, stone and glass present. The results are
presented in Table 3.
11
WRAP MDD023 WEEE Separation Techniques – Dry Jigging Trial – Nottingham University
% Concentration of Various Components in Bottom Layers
Sample Pulse
Frequency (cycles/min)
Airflow Velocity (cm/s)
Plastics/Rubber (Density: 2.2 floats)
Stone/Glass (Density: 2.2 – 2.8)
Metals/Copper (Density: 2.8 sinks)
Total
1a 75 25 7 46 47 100 1b 86 25 5 43 52 100 1c 120 25 6 50 44 100 1d 86 18 8 45 47 100
Table 3: % concentration of components in bottom layer
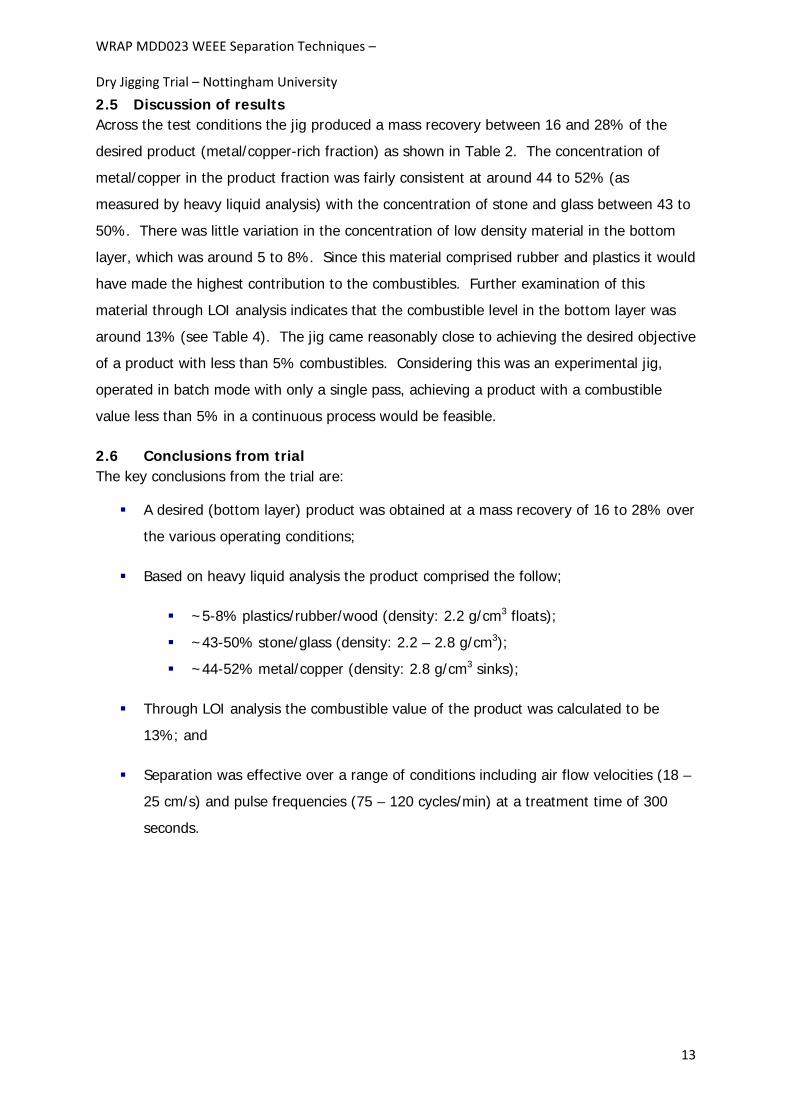
Since it had the highest metals/copper content, Sample 1b was chosen for further analysis.
This consisted of taking the three fractions from the heavy liquid analysis of the bottom
layer sample and determining the amount of combustible material present in each through a
LOI analysis. The results are presented in Table 4.
% Combustibles in Various Fractions
Sample Plastics/Rubber (Density: 2.2
floats)
Stone/Glass (Density: 2.2 –
2.8)
Metals/Copper (Density: 2.8
sinks)
Total for bottom layer (Calculated)
1b 68 9 11 13
Table 4: % combustibles in bottom layer
The relatively higher combustible value of the metal/copper fraction (11%) in comparison to the stone/glass fraction (9%) was thought to be due, predominantly, to the very small sample weight available for analysis.
The total combustible value (13%) in the bottom layer is calculated from the summed relative weights of the combustible material in each density fraction divided by the total weight of the fraction. Using the three individual combustible values determined on the density fractions (Table 4) multiplied by the mass of the fractions, which in this case was the same as the concentration values for the heavy liquid data in Table 3. These were then summed and divided by the total weight.
That is for sample 1b;
((5 x 68) + (43 x 9) + (52 x 11)) / 100 = 13%
12
WRAP MDD023 WEEE Separation Techniques – Dry Jigging Trial – Nottingham University
2.5 Discussion of results Across the test conditions the jig produced a mass recovery between 16 and 28% of the
desired product (metal/copper-rich fraction) as shown in Table 2. The concentration of
metal/copper in the product fraction was fairly consistent at around 44 to 52% (as
measured by heavy liquid analysis) with the concentration of stone and glass between 43 to
50%. There was little variation in the concentration of low density material in the bottom
layer, which was around 5 to 8%. Since this material comprised rubber and plastics it would
have made the highest contribution to the combustibles. Further examination of this
material through LOI analysis indicates that the combustible level in the bottom layer was
around 13% (see Table 4). The jig came reasonably close to achieving the desired objective
of a product with less than 5% combustibles. Considering this was an experimental jig,
operated in batch mode with only a single pass, achieving a product with a combustible
value less than 5% in a continuous process would be feasible.
2.6 Conclusions from trial The key conclusions from the trial are:
A desired (bottom layer) product was obtained at a mass recovery of 16 to 28% over
the various operating conditions;
Based on heavy liquid analysis the product comprised the follow;
~5-8% plastics/rubber/wood (density: 2.2 g/cm3 floats);
~43-50% stone/glass (density: 2.2 – 2.8 g/cm3);
~44-52% metal/copper (density: 2.8 g/cm3 sinks);
Through LOI analysis the combustible value of the product was calculated to be
13%; and
Separation was effective over a range of conditions including air flow velocities (18 –
25 cm/s) and pulse frequencies (75 – 120 cycles/min) at a treatment time of 300
seconds.
13
WRAP MDD023 WEEE Separation Techniques – Dry Jigging Trial – Nottingham University
3.0 Trial 2 (Axion sample 2)
3.1 Specific trial objective The objective of this trial was to produce a copper-rich fraction containing less than about
5% combustible material. The presence of glass and stone was not considered to be
problematic in subsequent processing.
3.2 Feed material
Material used in this trial (sample 2) was derived from WEEE and had a particle size
between 2.36 and 5.0 mm. It comprised plastic, copper, PVC coated wires, rubber, small
quantities of glass, stone, wood and circuit boards.
3.3 Results and analysis The results of this trial covered the effect of both pulse frequency and air flow velocity on
subsequent separation.
Three experiments were conducted varying the pulse frequencies (75, 86 and 120
cycles/min) whilst maintaining a constant airflow velocity of 25cm/s, over a jigging period of
300 seconds. A further experiment was conducted at an air flow velocity of 18 cm/s whilst
maintaining a constant pulse frequency of 86 cycles/min over the same jigging period of 300
seconds.
The process produced three layers of stratified particles; lower density plastics in the top
layer, denser plastics in the middle layer and a small amount of copper, metal and glass in
the bottom layer (see Figures 10, 11 and 12).
14

WRAP MDD023 WEEE Separation Techniques – Dry Jigging Trial – Nottingham University
Fig. 9: Side view of jig showing the three layers after separation
The three layers were identified visually, removed from above using suction, their masses
recorded and each was subjected to analysis. This was conducted for all four test runs
under different operating conditions and the mass distribution is presented in Table 5.
3.4 Photograph of result samples
Fig. 10: Top layer Fig. 11: Middle Layer
15

WRAP MDD023 WEEE Separation Techniques – Dry Jigging Trial – Nottingham University
Fig. 12: Bottom layer (small amount of copper/metal)
Fig. 13: Top view of jig compartment showing the bottom layer after the upper layers have been removed
16
WRAP MDD023 WEEE Separation Techniques – Dry Jigging Trial – Nottingham University
% Mass Distribution Across Layers Sample Pulse Frequency
(cycles/min)
Airflow Velocity (cm/s) Top Middle Bottom Total
2a 75 25 4 86 10 100 2b 86 25 5 83 12 100 2c 120 25 4 86 10 100 2d 86 18 4 86 10 100
Table 5: Mass distribution across product layers
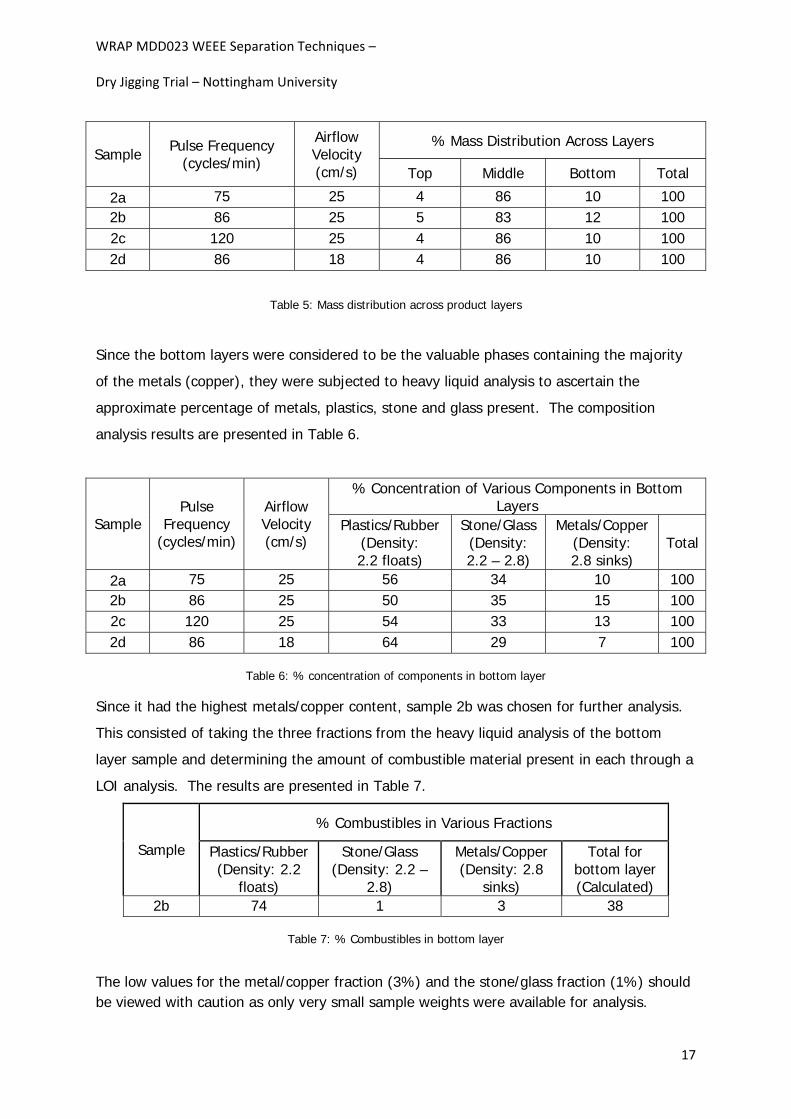
Since the bottom layers were considered to be the valuable phases containing the majority
of the metals (copper), they were subjected to heavy liquid analysis to ascertain the
approximate percentage of metals, plastics, stone and glass present. The composition
analysis results are presented in Table 6.
% Concentration of Various Components in Bottom Layers
Sample Pulse
Frequency (cycles/min)
Airflow Velocity (cm/s)
Plastics/Rubber (Density: 2.2 floats)
Stone/Glass (Density: 2.2 – 2.8)
Metals/Copper (Density: 2.8 sinks)
Total
2a 75 25 56 34 10 100 2b 86 25 50 35 15 100 2c 120 25 54 33 13 100 2d 86 18 64 29 7 100
Table 6: % concentration of components in bottom layer
Since it had the highest metals/copper content, sample 2b was chosen for further analysis.
This consisted of taking the three fractions from the heavy liquid analysis of the bottom
layer sample and determining the amount of combustible material present in each through a
LOI analysis. The results are presented in Table 7.
% Combustibles in Various Fractions
Sample Plastics/Rubber (Density: 2.2
floats)
Stone/Glass (Density: 2.2 –
2.8)
Metals/Copper (Density: 2.8
sinks)
Total for bottom layer (Calculated)
2b 74 1 3 38
Table 7: % Combustibles in bottom layer
The low values for the metal/copper fraction (3%) and the stone/glass fraction (1%) should be viewed with caution as only very small sample weights were available for analysis.
17

WRAP MDD023 WEEE Separation Techniques – Dry Jigging Trial – Nottingham University
The total combustibles in the bottom layer were calculated using sample 2b data. Using the three individual combustible values determined on the density fractions (Table 7) multiplied by the mass of the fractions, which in this case was the same as the concentration values for the heavy liquid data in Table 6. These were then summed and divided by the total weight.
That is for sample 2b;
((50 x 74) + (35 x 1) + (15 x 3)) / 100 = 38%
3.5 Discussion of results Sample 2 gave similar results to sample 1 in that concentration of the higher density
components into a bottom layer was achieved. The main difference being lower mass
recovery, i.e. 10 to 12% for sample 2 in comparison to 16 to 28% for sample 1 (cf. Tables 2
and 5). The concentration of metal/copper in the product fraction was relatively consistent
at around 7 to 15% (as measured by heavy liquid analysis) and it was significantly lower
than that obtained with sample 1 at 43 to 50% (cf. Tables 3 and 6). Less higher density
material in sample 1, in comparison to sample 2, resulted in the formation of a “thinner”
bottom layer making it difficult to extract the material for assessment. The combustible
values of the bottom layer presented in Table 7 support this hypothesis, with an overall level
of 38% for sample 2 in comparison to a value of 13% for sample 1. Although the
indications were strong that this material was amenable to dry jigging a larger stock of
higher density material was required for assessment and re-treatment to actually prove this
point.
3.6 Conclusions from trial The conclusions from this second trial were:
A (bottom layer) product was obtained at a mass recovery of 10 to 12% over the
various operating conditions;
Based on heavy liquid analysis the product comprised the follow;
o ~50-64% plastics/rubber/wood (density: 2.2 g/cm3 floats);
o ~29-35% stone/glass (density: 2.2 – 2.8 g/cm3);
o ~7-15% metal/copper (density: 2.8 g/cm3 sinks);
Through LOI analysis the combustible value of the product was calculated to be
38%; and
18

WRAP MDD023 WEEE Separation Techniques – Dry Jigging Trial – Nottingham University
Further enhancement of this material was considered possible if multiple batches
were treated to produce a larger stock for re-treatment. For this reason a third trial
on sample 2 was designed and is detailed below as Trial 3.
19
WRAP MDD023 WEEE Separation Techniques – Dry Jigging Trial – Nottingham University
4.0 Trial 3 (Axion sample 2 – retreat)
4.1 Specific trial objective The objective of this trial was to treat multiple lots of Axion sample 2, producing a pre-
concentrated feed for further treatment with the ultimate aim of generating a copper-rich
fraction containing less than about 5% combustible material. The presence of glass and
stone was not considered to be problematic in subsequent processing.
4.2 Feed material
Material used in this trial (sample 2) was derived from WEEE and had a particle size
between 2.36 and 5.0 mm. It comprised plastic, copper, PVC coated wires, rubber, small
quantities of glass, stone, wood and circuit boards.
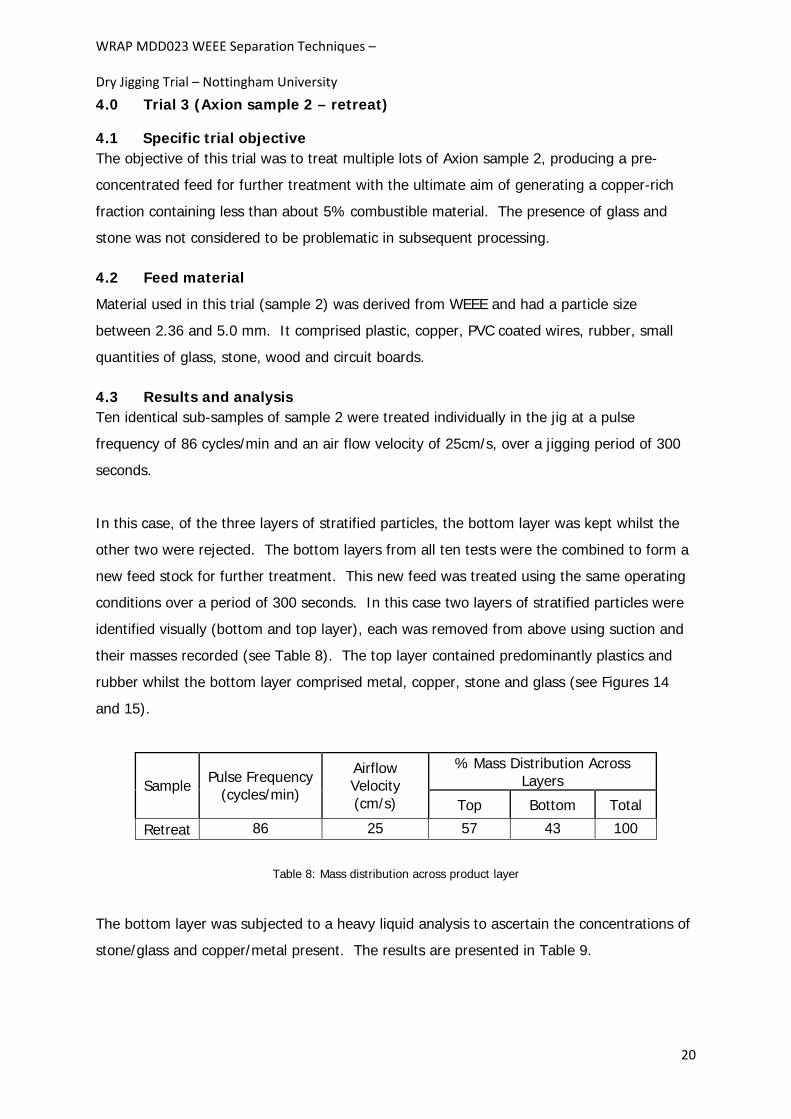
4.3 Results and analysis Ten identical sub-samples of sample 2 were treated individually in the jig at a pulse
frequency of 86 cycles/min and an air flow velocity of 25cm/s, over a jigging period of 300
seconds.
In this case, of the three layers of stratified particles, the bottom layer was kept whilst the
other two were rejected. The bottom layers from all ten tests were the combined to form a
new feed stock for further treatment. This new feed was treated using the same operating
conditions over a period of 300 seconds. In this case two layers of stratified particles were
identified visually (bottom and top layer), each was removed from above using suction and
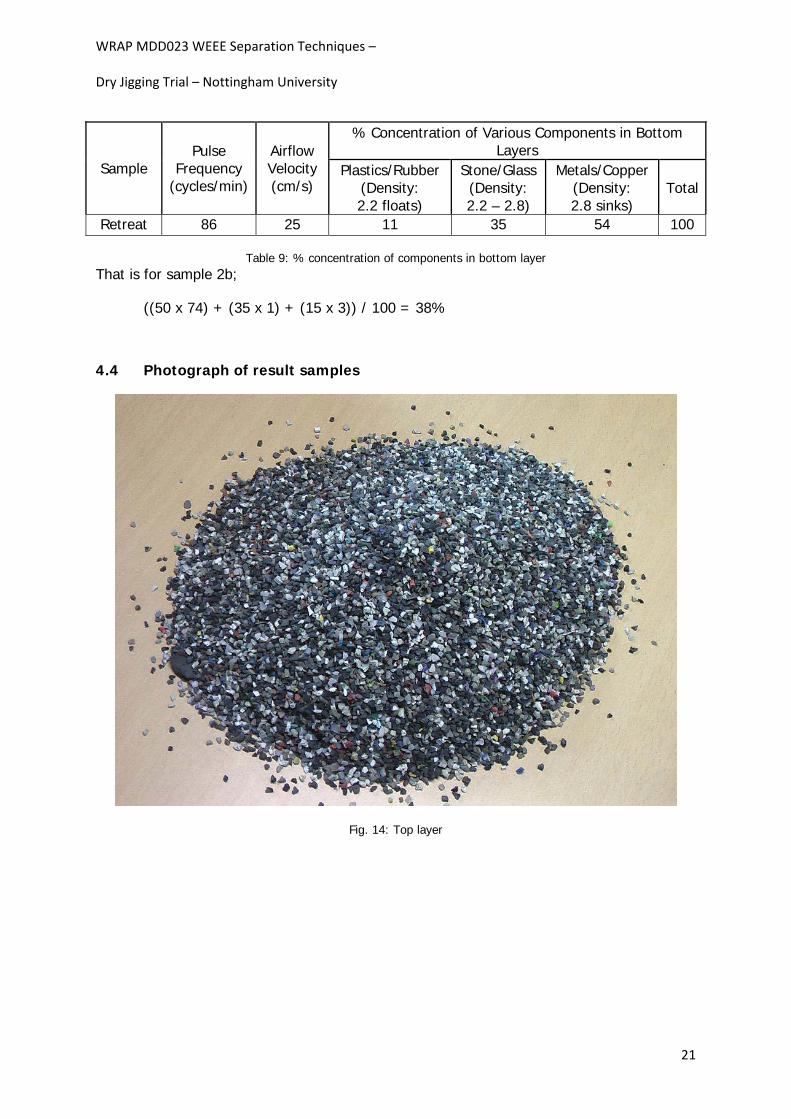
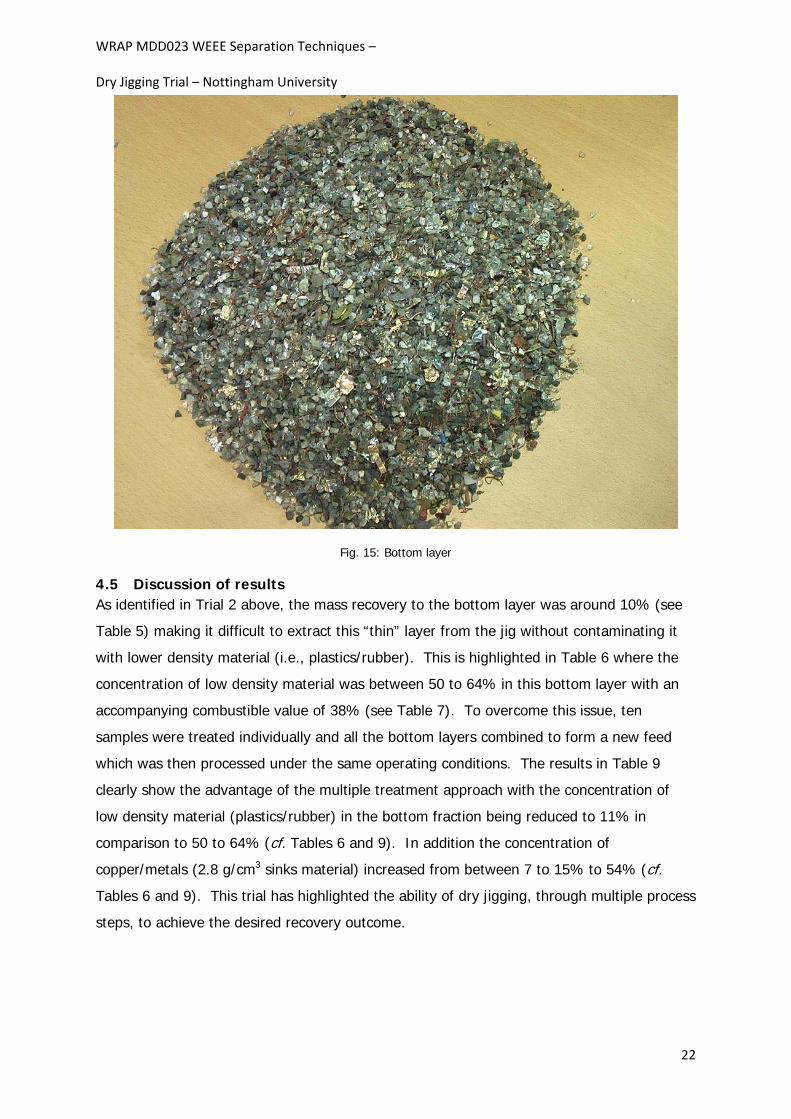
their masses recorded (see Table 8). The top layer contained predominantly plastics and
rubber whilst the bottom layer comprised metal, copper, stone and glass (see Figures 14
and 15).
% Mass Distribution Across Layers Sample Pulse Frequency
(cycles/min)
Airflow Velocity (cm/s) Top Bottom Total
Retreat 86 25 57 43 100
Table 8: Mass distribution across product layer
The bottom layer was subjected to a heavy liquid analysis to ascertain the concentrations of
stone/glass and copper/metal present. The results are presented in Table 9.
20
WRAP MDD023 WEEE Separation Techniques – Dry Jigging Trial – Nottingham University
% Concentration of Various Components in Bottom Layers
Sample Pulse
Frequency (cycles/min)
Airflow Velocity (cm/s)
Plastics/Rubber (Density: 2.2 floats)
Stone/Glass (Density: 2.2 – 2.8)
Metals/Copper (Density: 2.8 sinks)
Total
Retreat 86 25 11 35 54 100
Table 9: % concentration of components in bottom layer That is for sample 2b;
((50 x 74) + (35 x 1) + (15 x 3)) / 100 = 38%
4.4 Photograph of result samples
Fig. 14: Top layer
21
WRAP MDD023 WEEE Separation Techniques – Dry Jigging Trial – Nottingham University
Fig. 15: Bottom layer
4.5 Discussion of results As identified in Trial 2 above, the mass recovery to the bottom layer was around 10% (see
Table 5) making it difficult to extract this “thin” layer from the jig without contaminating it
with lower density material (i.e., plastics/rubber). This is highlighted in Table 6 where the
concentration of low density material was between 50 to 64% in this bottom layer with an
accompanying combustible value of 38% (see Table 7). To overcome this issue, ten
samples were treated individually and all the bottom layers combined to form a new feed
which was then processed under the same operating conditions. The results in Table 9
clearly show the advantage of the multiple treatment approach with the concentration of
low density material (plastics/rubber) in the bottom fraction being reduced to 11% in
comparison to 50 to 64% (cf. Tables 6 and 9). In addition the concentration of
copper/metals (2.8 g/cm3 sinks material) increased from between 7 to 15% to 54% (cf.
Tables 6 and 9). This trial has highlighted the ability of dry jigging, through multiple process
steps, to achieve the desired recovery outcome.
22

WRAP MDD023 WEEE Separation Techniques – Dry Jigging Trial – Nottingham University
4.6 Conclusions from trial The main conclusions from this trial are:
Retreatment of multiple samples of Axion sample 2 successfully reduced the
plastics/rubber content in the final product down to 11%;
Based on heavy liquid analysis the product comprised the follow;
11% plastics/rubber/wood (density: 2.2 g/cm3 floats);
[compares with 50-64% for a single pass];
35% stone/glass (density: 2.2 – 2.8 g/cm3);
[compares with 29-35% for a single pass];
54% metal/copper (density: 2.8 g/cm3 sinks);
[compares with 7-15% for a single pass].
The total combustibles in the bottom layer was approximated (no data for this trial) using sample 2b combustibles data. Using the three individual combustible values determined on the density fractions (sample 2b Table 7) multiplied by the mass of the fractions from above. These were then summed and divided by the total weight.
That is for Trial 3 bottom layer;
((11 x 74) + (35 x 1) + (54 x 3)) / 100 = 10%
5.0 Overall conclusions It has been demonstrated that pneumatic jigging can produce stratified layers of particulates
from a number of the samples of WEEE supplied by Axion. The results indicated that:
Separation was dependant on two variables operating over a fairly wide range –
pulse frequency (75 – 120 cycles/min) and air flow velocity (18 – 35 cm/s);
Treatment (including retreatment stages) of all three of the WEEE trials generated
high density (copper/metal rich) products at a mass recovery of between 10 to 28%
comprising;
~5-11% plastics/rubber/wood (density: 2.2 g/cm3 floats);
~35-50% stone/glass (density: 2.2 – 2.8 g/cm3);
~44-54% metal/copper (density: 2.8 g/cm3 sinks);
23

WRAP MDD023 WEEE Separation Techniques – Dry Jigging Trial – Nottingham University
24
The work contained in this report indicates that pneumatic jigging has potential as a
means to recover valuable metal rich materials from WEEE streams. However the
work was carried out on an experimental rig and that the practical and commercial
use of pneumatic separation techniques in the coal and minerals industry is,
currently, fairly sparse;
From an operational point of view such pneumatic jigging units used in the coal and
minerals industry had high capacities up to about 50-100 tonnes per hour per metre
width. The main operating costs were the energy used for vibration, air supply and
dust extraction;
Since the test pneumatic jigging unit involved a dry process there would be no
associated water recovery and treatment costs; and
For pneumatic jigging to be of industrial and commercial relevance in recovery of
metals/copper from WEEE streams, further work would be required to design and
develop a continuous pneumatic jig.


![WEEE Directive[1]](https://static.fdocuments.net/doc/165x107/577d35a31a28ab3a6b90ff41/weee-directive1.jpg)