Wrangler: Interactive Visual Specification of Data...
10
Wrangler: Interactive Visual Specification of Data Transformation Scripts Sean Kandel * , Andreas Paepcke * , Joseph Hellerstein † and Jeffrey Heer * * Stanford University † University of California, Berkeley skandel, paepcke, [email protected] [email protected] ABSTRACT Though data analysis tools continue to improve, analysts still expend an inordinate amount of time and effort manip- ulating data and assessing data quality issues. Such “data wrangling” regularly involves reformatting data values or layout, correcting erroneous or missing values, and integrat- ing multiple data sources. These transforms are often dif- ficult to specify and difficult to reuse across analysis tasks, teams, and tools. In response, we introduce Wrangler, an interactive system for creating data transformations. Wran- gler combines direct manipulation of visualized data with automatic inference of relevant transforms, enabling ana- lysts to iteratively explore the space of applicable operations and preview their effects. Wrangler leverages semantic data types (e.g., geographic locations, dates, classification codes) to aid validation and type conversion. Interactive histories support review, refinement, and annotation of transformation scripts. User study results show that Wrangler significantly reduces specification time and promotes the use of robust, auditable transforms instead of manual editing. Author Keywords Data cleaning, transformation, validation, visualization, pro- gramming by demonstration, mixed-initiative interfaces. ACM Classification Keywords H.5.2 Information Interfaces and Presentation: UI INTRODUCTION Despite significant advances in technologies for data man- agement and analysis, it remains time-consuming to inspect a data set and mold it to a form that allows meaningful anal- ysis to begin. Analysts must regularly restructure data to make it palatable to databases, statistics packages, and vi- sualization tools. To improve data quality, analysts must also identify and address issues such as misspellings, miss- ing data, unresolved duplicates, and outliers. Our own infor- mal interviews with data analysts have found that these types of transforms constitute the most tedious component of their analytic process. Others estimate that data cleaning is re- sponsible for up to 80% of the development time and cost in Permission to make digital or hard copies of all or part of this work for personal or classroom use is granted without fee provided that copies are not made or distributed for profit or commercial advantage and that copies bear this notice and the full citation on the first page. To copy otherwise, or republish, to post on servers or to redistribute to lists, requires prior specific permission and/or a fee. CHI 2011, May 7–12, 2011, Vancouver, BC, Canada. Copyright 2011 ACM 978-1-4503-0267-8/11/05...$5.00. data warehousing projects [4]. Such “data wrangling” often requires writing idiosyncratic scripts in programming lan- guages such as Python and Perl, or extensive manual editing using interactive tools such as Microsoft Excel. Moreover, this hurdle discourages many people from working with data in the first place. Sadly, when it comes to the practice of data analysis, “the tedium is the message.” Part of the problem is that reformatting and validating data requires transforms that can be difficult to specify and eval- uate. For instance, analysts often split data into meaning- ful records and attributes—or validate fields such as dates and addresses—using complex regular expressions that are error-prone and tedious to interpret [2, 24]. Converting coded values, such as mapping FIPS codes to U.S. state names, requires integrating data from one or more external tables. The effects of transforms that aggregate data or rearrange data layout can be particularly hard to conceptualize ahead of time. As data sets grow in size and complexity, discover- ing data quality issues may be as difficult as correcting them. Of course, transforming and cleaning a data set is only one step in the larger data lifecycle. Data updates and evolving schemas often necessitate the reuse and revision of transfor- mations. Multiple analysts might use transformed data and wish to review or refine the transformations that were previ- ously applied; the importance of capturing data provenance is magnified when data and scripts are shared. As a result, we contend that the proper output of data wrangling is not just transformed data, but an editable and auditable descrip- tion of the data transformations applied. This paper presents the design of Wrangler, a system for in- teractive data transformation. We designed Wrangler to help analysts author expressive transformations while simplify- ing specification and minimizing manual repetition. To do so, Wrangler couples a mixed-initiative user interface with an underlying declarative transformation language. With Wrangler, analysts specify transformations by build- ing up a sequence of basic transforms. As users select data, Wrangler suggests applicable transforms based on the cur- rent context of interaction. Programming-by-demonstration techniques help analysts specify complex criteria such as regular expressions. To ensure relevance, Wrangler enu- merates and rank-orders possible transforms using a model that incorporates user input with the frequency, diversity, and specification difficulty of applicable transform types. To convey the effects of data transforms, Wrangler provides
Transcript of Wrangler: Interactive Visual Specification of Data...
Wrangler: Interactive Visual Specificationof Data Transformation Scripts
Sean Kandel∗, Andreas Paepcke∗, Joseph Hellerstein† and Jeffrey Heer∗∗ Stanford University †University of California, Berkeley
skandel, paepcke, [email protected] [email protected]
ABSTRACTThough data analysis tools continue to improve, analystsstill expend an inordinate amount of time and effort manip-ulating data and assessing data quality issues. Such “datawrangling” regularly involves reformatting data values orlayout, correcting erroneous or missing values, and integrat-ing multiple data sources. These transforms are often dif-ficult to specify and difficult to reuse across analysis tasks,teams, and tools. In response, we introduce Wrangler, aninteractive system for creating data transformations. Wran-gler combines direct manipulation of visualized data withautomatic inference of relevant transforms, enabling ana-lysts to iteratively explore the space of applicable operationsand preview their effects. Wrangler leverages semantic datatypes (e.g., geographic locations, dates, classification codes)to aid validation and type conversion. Interactive historiessupport review, refinement, and annotation of transformationscripts. User study results show that Wrangler significantlyreduces specification time and promotes the use of robust,auditable transforms instead of manual editing.
Author KeywordsData cleaning, transformation, validation, visualization, pro-gramming by demonstration, mixed-initiative interfaces.
ACM Classification KeywordsH.5.2 Information Interfaces and Presentation: UI
INTRODUCTIONDespite significant advances in technologies for data man-agement and analysis, it remains time-consuming to inspecta data set and mold it to a form that allows meaningful anal-ysis to begin. Analysts must regularly restructure data tomake it palatable to databases, statistics packages, and vi-sualization tools. To improve data quality, analysts mustalso identify and address issues such as misspellings, miss-ing data, unresolved duplicates, and outliers. Our own infor-mal interviews with data analysts have found that these typesof transforms constitute the most tedious component of theiranalytic process. Others estimate that data cleaning is re-sponsible for up to 80% of the development time and cost in
Permission to make digital or hard copies of all or part of this work forpersonal or classroom use is granted without fee provided that copies arenot made or distributed for profit or commercial advantage and that copiesbear this notice and the full citation on the first page. To copy otherwise, orrepublish, to post on servers or to redistribute to lists, requires prior specificpermission and/or a fee.CHI 2011, May 7–12, 2011, Vancouver, BC, Canada.Copyright 2011 ACM 978-1-4503-0267-8/11/05...$5.00.
data warehousing projects [4]. Such “data wrangling” oftenrequires writing idiosyncratic scripts in programming lan-guages such as Python and Perl, or extensive manual editingusing interactive tools such as Microsoft Excel. Moreover,this hurdle discourages many people from working with datain the first place. Sadly, when it comes to the practice of dataanalysis, “the tedium is the message.”
Part of the problem is that reformatting and validating datarequires transforms that can be difficult to specify and eval-uate. For instance, analysts often split data into meaning-ful records and attributes—or validate fields such as datesand addresses—using complex regular expressions that areerror-prone and tedious to interpret [2, 24]. Converting codedvalues, such as mapping FIPS codes to U.S. state names,requires integrating data from one or more external tables.The effects of transforms that aggregate data or rearrangedata layout can be particularly hard to conceptualize aheadof time. As data sets grow in size and complexity, discover-ing data quality issues may be as difficult as correcting them.
Of course, transforming and cleaning a data set is only onestep in the larger data lifecycle. Data updates and evolvingschemas often necessitate the reuse and revision of transfor-mations. Multiple analysts might use transformed data andwish to review or refine the transformations that were previ-ously applied; the importance of capturing data provenanceis magnified when data and scripts are shared. As a result,we contend that the proper output of data wrangling is notjust transformed data, but an editable and auditable descrip-tion of the data transformations applied.
This paper presents the design of Wrangler, a system for in-teractive data transformation. We designed Wrangler to helpanalysts author expressive transformations while simplify-ing specification and minimizing manual repetition. To doso, Wrangler couples a mixed-initiative user interface withan underlying declarative transformation language.
With Wrangler, analysts specify transformations by build-ing up a sequence of basic transforms. As users select data,Wrangler suggests applicable transforms based on the cur-rent context of interaction. Programming-by-demonstrationtechniques help analysts specify complex criteria such asregular expressions. To ensure relevance, Wrangler enu-merates and rank-orders possible transforms using a modelthat incorporates user input with the frequency, diversity,and specification difficulty of applicable transform types. Toconvey the effects of data transforms, Wrangler provides
DataWranglerExportImport
Split data repeatedly on newline intorows
Split split repeatedly on ','
Promote row 0 to header
Delete row 7
Delete empty rows
Fill row 7 by copying values from above
Fill row 7 by copying values from below
Fold using row 7 as a key
Fold Year using row 7 as a key
Transform Script
Text
Split
Cut
Columns
Fill
Drop
Rows
Delete
Fill
Promote
Table
Fold
Unfold
Clear
Year Property_crime_rate0 Reported crime in Alabama1
2 2004 4029.33 2005 39004 2006 39375 2007 3974.96 2008 4081.97
8 Reported crime in Alaska9
10 2004 3370.911 2005 361512 2006 358213 2007 3373.914 2008 2928.315
16 Reported crime in Arizona17
18 2004 5073.319 2005 482720 2006 4741.621 2007 4502.622 2008 4087.323
24 Reported crime inArkansas
25
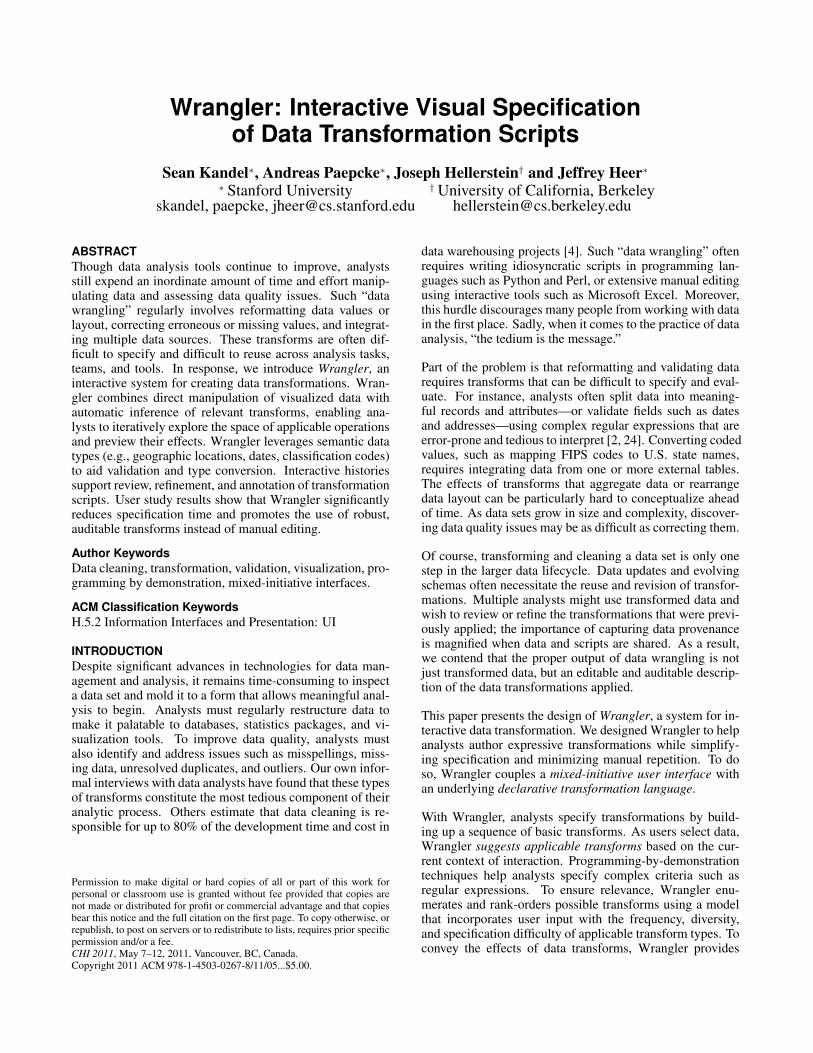
Figure 1. The Wrangler Interface. The left panel contains (from top-to-bottom) a history of transforms, a transform selection menu, and automat-ically suggested transforms based on the current selection. Bold text within the transform descriptions indicate parameters that can be clicked andrevised. The right panel contains an interactive data table; above each column is a data quality meter.
short natural language descriptions—which users can refinevia interactive parameters—and visual previews of transformresults. These techniques enable analysts to rapidly navigateand assess the space of viable transforms.
As analysts transform data, their steps are recorded in a scriptto facilitate reuse and provide documentation of data prove-nance. Wrangler’s interactive history viewer supports re-view, refinement, and annotation of these scripts. Wran-gler’s high-level language supports a variety of runtime plat-forms: Wrangler scripts can be run in a web browser usingJavaScript or translated into MapReduce or Python code.
We also present a controlled user study comparing Wran-gler and Excel across a set of data wrangling tasks. We findthat Wrangler significantly reduces specification time andpromotes the use of robust transforms rather than manualediting. Wrangler is one piece of a larger effort to addressbottlenecks in the data lifecycle by integrating insights andmethods from the HCI and database communities.
RELATED WORKThe database and machine learning communities have con-tributed a number of algorithmic techniques for aiding datacleaning and integration. These techniques include meth-ods for detecting erroneous values [10, 11], information ex-traction [1, 25], entity resolution [6], type inference [7], andschema matching [9, 21]. In the Wrangler interface we seekto surface such techniques in an accessible manner.
A number of commercial and research systems provide graph-ical interfaces leveraging the above methods. Many of thesetools provide interfaces for schema matching or entity reso-lution [3, 9, 16, 23]. Toped++ [24] is an interface for creatingTopes, objects that validate and transform data. Topes sup-port transformations such as text formatting and lookups, butprovide little support for filtering, reshaping, or aggregation.Bellman [5] helps users understand the structure and qualityof a database, but does not enable transformations.
Many data cleaning applications apply direct manipulationand programming-by-demonstration (PBD) methods to spe-cific cleaning tasks. Users of SWYN [2] build regular ex-pressions by providing example text selections and can eval-uate their effect in visual previews. Potluck [14] applies si-multaneous text editing [19] to merge data sources. Karma[26] infers text extractors and transformations for web datafrom examples entered in a table. Vegemite [18] appliesPBD to integrate web data, automates the use of web ser-vices, and generates shareable scripts. Other interfaces [15]apply PBD to data integration via copy and paste actions.
Wrangler applies a number of these techniques: it infers reg-ular expressions from example selections [2] and supportsmass editing [14, 19]. Wrangler uses semantic roles akinto Topes [24] and provides natural language descriptions oftransforms [18]. However, Wrangler differs in importantways. PBD data tools support text extraction or data integra-tion, but lack operations such as reshaping, aggregation, andmissing value imputation. Prior tools (except for Vegemite[18]) also do not generate scripts to document provenance.
Most closely related to Wrangler is prior work on interactivedata cleaning. Potter’s Wheel [22] provides a transformationlanguage for data formatting and outlier detection. Wranglerextends the Potter’s Wheel language with key differencesdiscussed later. Ajax [8] also provides an interface to spec-ify transforms, with advanced facilities for entity resolution.Neither tool provides much support for direct manipulation:interaction is largely restricted to menu-based commands orentering programming statements. Google Refine [13] (for-merly Freebase GridWorks) leverages Freebase to enable en-tity resolution and discrepancy detection. It provides sum-marization and filtering support through faceted histograms.Though users can specify some commands graphically, oth-ers must be written in a command language. Moreover, thesystem assumes that input data arrives in a proper tabularformat, limiting the forms of data to which it can be applied.
Wrangler builds on this prior work to contribute novel tech-niques for specifying data transforms. Wrangler providesan inference engine that generates and rank-orders suggestedtransforms in response to direct manipulation of a data table.Analysts can navigate the space of transforms by directly se-lecting data, indicating a desired transform via menus, or bymodifying a related transform; each of these actions leadsWrangler to further refine the set of suggestions. To helpanalysts understand the effects of an operation before theycommit to it, Wrangler’s natural language transform descrip-tions are augmented by novel transform previews that visu-alize transform results. In concert, these techniques help an-alysts iteratively hone in on a desired transformation.
USAGE SCENARIOConsider an example wrangling task, using housing crimedata from the U.S. Bureau of Justice Statistics. The datawere downloaded as a CSV (comma-separated values) file,but are not immediately usable by other tools: the data con-tains empty lines, U.S. states are organized in disjoint ma-trices, and the state names are embedded in other text. Wedescribe how an analyst can use Wrangler to transform thedata into more usable formats (Figures 1–7).
The analyst begins by pasting the text of the file into an inputbox; alternatively, she could upload the file. The interfacenow shows a data table (Fig. 1). To the left of the table isa panel containing an interactive history, a transform menu,and a transform editor. The history already contains threetransforms, as Wrangler inferred that the data was in CSVformat and so split the text into rows on newline characters,split the rows into columns on commas, and promoted thefirst row to be the table header. Note that the analyst couldundo any transform by clicking the red undo button (whichappears upon mouse-over of a transform), or could modifytransform parameters in place. In this case, she has no need.
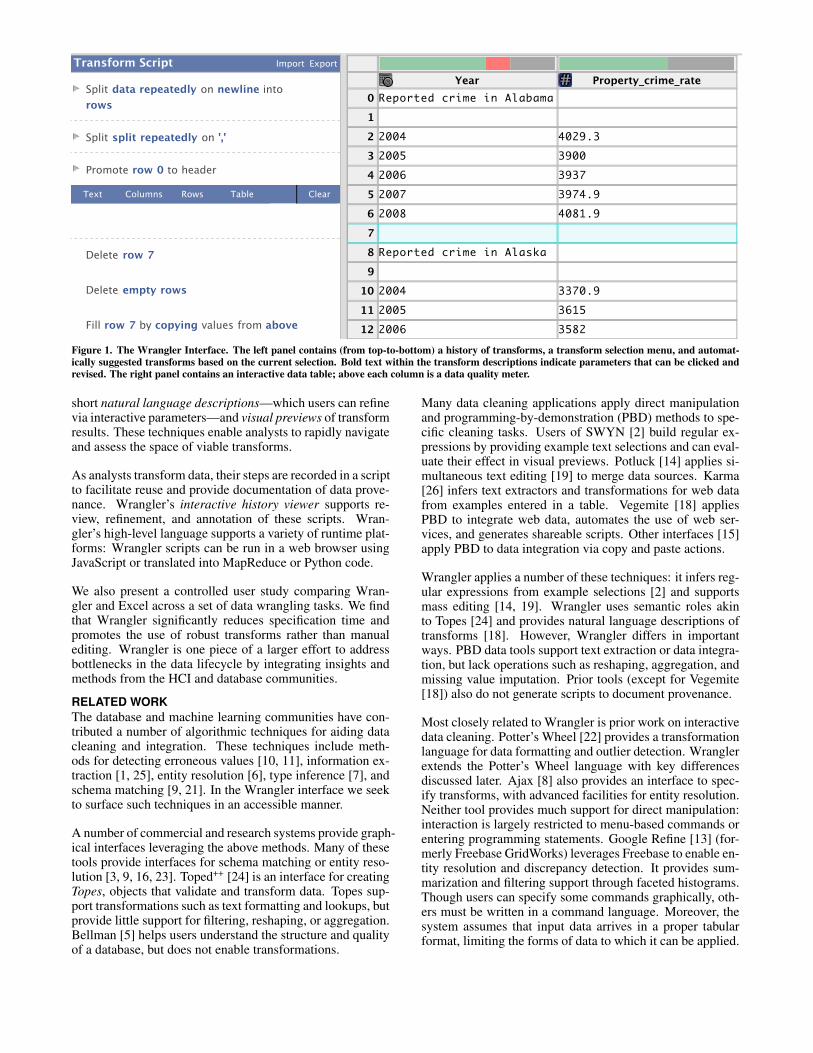
The analyst then begins wrangling the file into a usable form.The analyst could specify transforms explicitly by selectinga transform type from the menu and then assigning valuesto parameters; however, she instead opts to use direct ma-nipulation along with Wrangler’s suggestion engine. First,she clicks a row header for an empty row (7) to select it;the transformation editor suggests possible operations in re-sponse (Fig. 1). The first suggestion is to delete just theselected row. The analyst can navigate the suggestions usingthe keyboard up and down arrows or by mousing over thedescription in the editor pane. As she navigates the sugges-tions, Wrangler previews the effects of the transforms in thedata table. For deletions, the preview highlights the candi-date deleted rows in red (Fig. 2). The analyst mouses overthe suggestion to delete all empty rows in the table and clicksthe green add button to execute the transform. The systemthen adds the deletion operation to the history view.
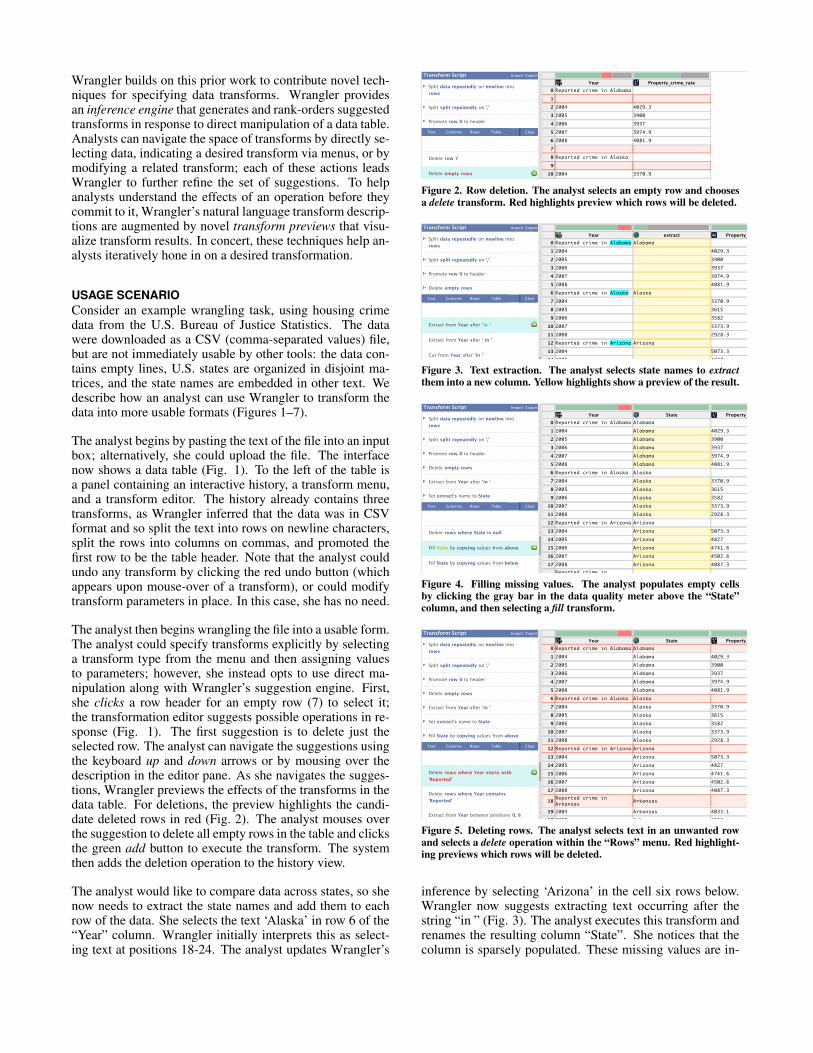
The analyst would like to compare data across states, so shenow needs to extract the state names and add them to eachrow of the data. She selects the text ‘Alaska’ in row 6 of the“Year” column. Wrangler initially interprets this as select-ing text at positions 18-24. The analyst updates Wrangler’s
DataWranglerExportImport
Split data repeatedly on newline intorows
Split split repeatedly on ','
Promote row 0 to header
Delete row 7
Delete empty rows
Fill row 7 by copying values from above
Fill row 7 by copying values from below
Fold using row 7 as a key
Fold Year using row 7 as a key
Transform Script
Text
Split
Cut
Columns
Fill
Drop
Rows
Delete
Fill
Promote
Table
Fold
Unfold
Clear
Year Property_crime_rate0 Reported crime in Alabama
2 2004 4029.33 2005 39004 2006 39375 2007 3974.96 2008 4081.9
8 Reported crime in Alaska
10 2004 3370.911 2005 361512 2006 358213 2007 3373.914 2008 2928.3
16 Reported crime in Arizona
18 2004 5073.319 2005 482720 2006 4741.621 2007 4502.622 2008 4087.3
24 Reported crime inArkansas
1
7
9
15
17
23
25
Figure 2. Row deletion. The analyst selects an empty row and choosesa delete transform. Red highlights preview which rows will be deleted.DataWrangler
ExportImport
Split data repeatedly on newline intorows
Split split repeatedly on ','
Promote row 0 to header
Delete empty rows
Extract from Year after 'in '
Extract from Year after ' in '
Cut from Year after 'in '
Cut from Year after ' in '
Split Year after 'in '
Split Year after ' in '
Transform Script
Text
Split
Cut
Columns
Fill
Drop
Rows
Delete
Fill
Promote
Table
Fold
Unfold
Clear
Year extract Property_crime_rate0 Reported crime in Alabama1 2004 4029.32 2005 39003 2006 39374 2007 3974.95 2008 4081.96 Reported crime in Alaska7 2004 3370.98 2005 36159 2006 3582
10 2007 3373.911 2008 2928.312 Reported crime in Arizona13 2004 5073.314 2005 482715 2006 4741.616 2007 4502.617 2008 4087.3
18 Reported crime inArkansas
19 2004 4033.120 2005 406821 2006 4021.622 2007 3945.523 2008 3843.7
24 Reported crime inCalifornia
25 2004 3423.9
Alabama
Alaska
Arizona
Arkansas
California
Figure 3. Text extraction. The analyst selects state names to extractthem into a new column. Yellow highlights show a preview of the result.DataWrangler
ExportImport
Split data repeatedly on newline intorows
Split split repeatedly on ','
Promote row 0 to header
Delete empty rows
Extract from Year after 'in '
Set extract's name to State
Delete rows where State is null
Fill State by copying values from above
Fill State by copying values from below
Transform Script
Text
Split
Cut
Columns
Fill
Drop
Rows
Delete
Fill
Promote
Table
Fold
Unfold
Clear
Year State Property_crime_rate0 Reported crime in Alabama Alabama1 2004 4029.32 2005 39003 2006 39374 2007 3974.95 2008 4081.96 Reported crime in Alaska Alaska7 2004 3370.98 2005 36159 2006 3582
10 2007 3373.911 2008 2928.312 Reported crime in Arizona Arizona13 2004 5073.314 2005 482715 2006 4741.616 2007 4502.617 2008 4087.3
18 Reported crime inArkansas Arkansas
19 2004 4033.120 2005 406821 2006 4021.622 2007 3945.523 2008 3843.7
24 Reported crime inCalifornia California
25 2004 3423.9
AlabamaAlabamaAlabamaAlabamaAlabama
AlaskaAlaskaAlaskaAlaskaAlaska
ArizonaArizonaArizonaArizonaArizona
ArkansasArkansasArkansasArkansasArkansas
California
Figure 4. Filling missing values. The analyst populates empty cellsby clicking the gray bar in the data quality meter above the “State”column, and then selecting a fill transform.DataWrangler
ExportImport
Split data repeatedly on newline intorows
Split split repeatedly on ','
Promote row 0 to header
Delete empty rows
Extract from Year after 'in '
Set extract's name to State
Fill State by copying values from above
Delete rows where Year starts with'Reported'
Delete rows where Year contains'Reported'
Extract from Year between positions 0, 8
Extract from Year on 'Reported'
Cut from Year between positions 0, 8
Cut from Year on 'Reported'
Transform Script
Text
Split
Cut
Columns
Fill
Drop
Rows
Delete
Fill
Promote
Table
Fold
Unfold
Clear
Year State Property_crime_rate
1 2004 Alabama 4029.32 2005 Alabama 39003 2006 Alabama 39374 2007 Alabama 3974.95 2008 Alabama 4081.9
7 2004 Alaska 3370.98 2005 Alaska 36159 2006 Alaska 3582
10 2007 Alaska 3373.911 2008 Alaska 2928.3
13 2004 Arizona 5073.314 2005 Arizona 482715 2006 Arizona 4741.616 2007 Arizona 4502.617 2008 Arizona 4087.3
19 2004 Arkansas 4033.120 2005 Arkansas 406821 2006 Arkansas 4021.622 2007 Arkansas 3945.523 2008 Arkansas 3843.7
25 2004 California 3423.9
0 Reported crime in Alabama Alabama
6 Reported crime in Alaska Alaska
12 Reported crime in Arizona Arizona
18 Reported crime inArkansas Arkansas
24 Reported crime inCalifornia California
Figure 5. Deleting rows. The analyst selects text in an unwanted rowand selects a delete operation within the “Rows” menu. Red highlight-ing previews which rows will be deleted.
inference by selecting ‘Arizona’ in the cell six rows below.Wrangler now suggests extracting text occurring after thestring “in ” (Fig. 3). The analyst executes this transform andrenames the resulting column “State”. She notices that thecolumn is sparsely populated. These missing values are in-
DataWranglerExportImport
Split data repeatedly on newline intorows
Split split repeatedly on ','
Promote row 0 to header
Delete empty rows
Extract from Year after 'in '
Set extract's name to State
Fill State by copying values from above
Delete rows where Year starts with'Reported'
Drop Year, Property_crime_rate
Fold Year, Property_crime_rate usingheader as a key
Fold Year, Property_crime_rate usingrow 0 as a key
Unfold Year on Property_crime_rate
Unfold Property_crime_rate on Year
Merge Year, Property_crime_rate withglue
Transform Script
Text
Split
Cut
Columns
Fill
Drop
Rows
Delete
Fill
Promote
Table
Fold
Unfold
Clear
NextPrev
Year State Property_crime_rate0 2004 Alabama 4029.31 2005 Alabama 39002 2006 Alabama 39373 2007 Alabama 3974.94 2008 Alabama 4081.95 2004 Alaska 3370.96 2005 Alaska 36157 2006 Alaska 35828 2007 Alaska 3373.99 2008 Alaska 2928.3
10 2004 Arizona 5073.311 2005 Arizona 482712 2006 Arizona 4741.613 2007 Arizona 4502.614 2008 Arizona 4087.3
State 2004 2005 2006 2007 20080 Alabama1 Alaska2 Arizona3 Arkansas4 California5 Colorado6 Connecticut7 Delaware8 District of Columbia9 Florida
10 Georgia11 Hawaii12 Idaho13 Illinois14 Indiana15 Iowa
4029.3 3900 3937 3974.9 4081.93370.9 3615 3582 3373.9 2928.35073.3 4827 4741.6 4502.6 4087.34033.1 4068 4021.6 3945.5 3843.73423.9 3321 3175.2 3032.6 2940.33918.5 4041 3441.8 2991.3 2856.72684.9 2579 2575 2470.6 2490.83283.6 3118 3474.5 3427.1 3594.74852.8 4490 4653.9 4916.3 5104.64182.5 4013 3986.2 4088.8 4140.64223.5 4145 3928.8 3893.1 3996.64795.5 4800 4219.9 4119.3 3566.52781 2697 2386.9 2264.2 2116.53174.1 3092 3019.6 2935.8 2932.63403.6 3460 3464.3 3386.5 3339.62904.8 2845 2870.3 2648.6 2440.5
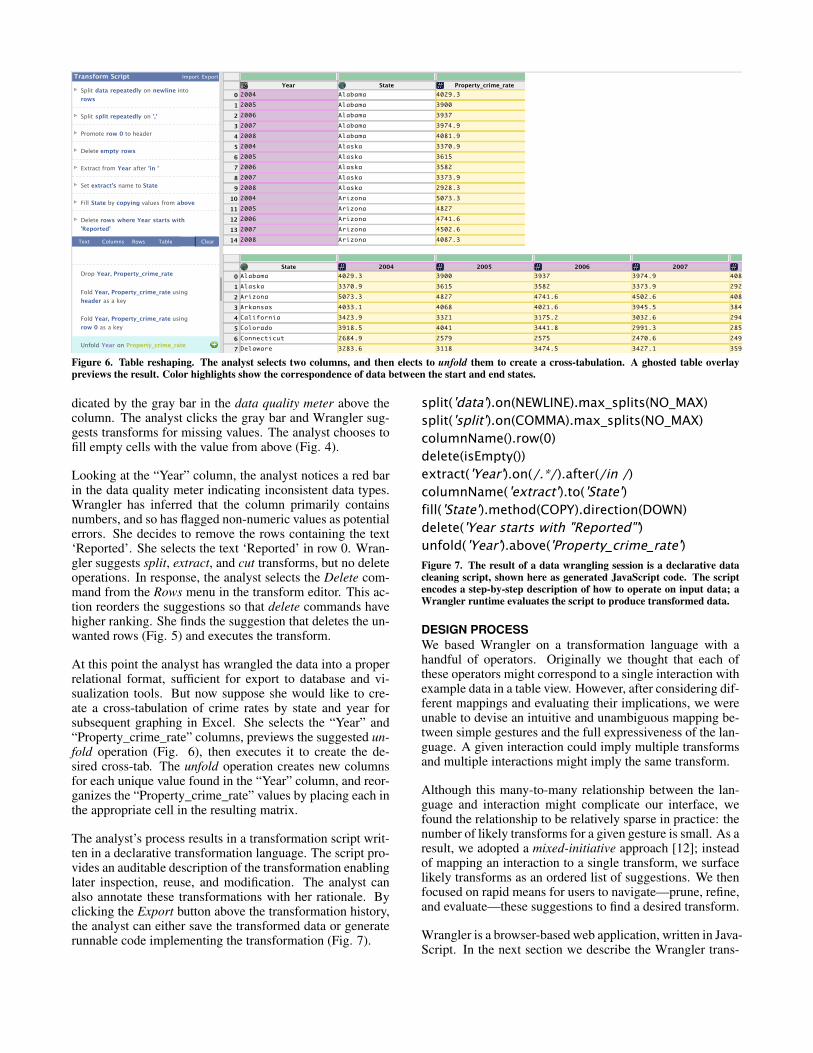
Figure 6. Table reshaping. The analyst selects two columns, and then elects to unfold them to create a cross-tabulation. A ghosted table overlaypreviews the result. Color highlights show the correspondence of data between the start and end states.
dicated by the gray bar in the data quality meter above thecolumn. The analyst clicks the gray bar and Wrangler sug-gests transforms for missing values. The analyst chooses tofill empty cells with the value from above (Fig. 4).
Looking at the “Year” column, the analyst notices a red barin the data quality meter indicating inconsistent data types.Wrangler has inferred that the column primarily containsnumbers, and so has flagged non-numeric values as potentialerrors. She decides to remove the rows containing the text‘Reported’. She selects the text ‘Reported’ in row 0. Wran-gler suggests split, extract, and cut transforms, but no deleteoperations. In response, the analyst selects the Delete com-mand from the Rows menu in the transform editor. This ac-tion reorders the suggestions so that delete commands havehigher ranking. She finds the suggestion that deletes the un-wanted rows (Fig. 5) and executes the transform.
At this point the analyst has wrangled the data into a properrelational format, sufficient for export to database and vi-sualization tools. But now suppose she would like to cre-ate a cross-tabulation of crime rates by state and year forsubsequent graphing in Excel. She selects the “Year” and“Property_crime_rate” columns, previews the suggested un-fold operation (Fig. 6), then executes it to create the de-sired cross-tab. The unfold operation creates new columnsfor each unique value found in the “Year” column, and reor-ganizes the “Property_crime_rate” values by placing each inthe appropriate cell in the resulting matrix.
The analyst’s process results in a transformation script writ-ten in a declarative transformation language. The script pro-vides an auditable description of the transformation enablinglater inspection, reuse, and modification. The analyst canalso annotate these transformations with her rationale. Byclicking the Export button above the transformation history,the analyst can either save the transformed data or generaterunnable code implementing the transformation (Fig. 7).
split('data').on(NEWLINE).max_splits(NO_MAX)split('split').on(COMMA).max_splits(NO_MAX)columnName().row(0)delete(isEmpty())extract('Year').on(/.*/).after(/in /)columnName('extract').to('State')fill('State').method(COPY).direction(DOWN)delete('Year starts with "Reported"')unfold('Year').above('Property_crime_rate')
dw.wrangle().push(dwsplit('data').on(dw.Regex.NEWLINE).max_splits(dwsplit.NO_MAX)).push(dwsplit('split').on(dw.Regex.TAB).max_splits(dwsplit.NO_MAX)).push(dw.filter(dw.isEmpty())).push(dw.extract('Year')..on(/.*/)).after(/in /).push(dw.columnName('match').to('State')).push(dw.fill('State').method(dw.Fill.COPY).direction(dw.Fill.DOWN)).push(dw.unfold('Year').above('Property_crime_rate'))
Figure 7. The result of a data wrangling session is a declarative datacleaning script, shown here as generated JavaScript code. The scriptencodes a step-by-step description of how to operate on input data; aWrangler runtime evaluates the script to produce transformed data.
DESIGN PROCESSWe based Wrangler on a transformation language with ahandful of operators. Originally we thought that each ofthese operators might correspond to a single interaction withexample data in a table view. However, after considering dif-ferent mappings and evaluating their implications, we wereunable to devise an intuitive and unambiguous mapping be-tween simple gestures and the full expressiveness of the lan-guage. A given interaction could imply multiple transformsand multiple interactions might imply the same transform.
Although this many-to-many relationship between the lan-guage and interaction might complicate our interface, wefound the relationship to be relatively sparse in practice: thenumber of likely transforms for a given gesture is small. As aresult, we adopted a mixed-initiative approach [12]; insteadof mapping an interaction to a single transform, we surfacelikely transforms as an ordered list of suggestions. We thenfocused on rapid means for users to navigate—prune, refine,and evaluate—these suggestions to find a desired transform.
Wrangler is a browser-based web application, written in Java-Script. In the next section we describe the Wrangler trans-
formation language. We then present the Wrangler interfaceand its techniques for navigating suggestion space. Next, wedescribe Wrangler’s mechanisms for verification. We go onto discuss the technical details of our inference engine.
THE WRANGLER TRANSFORMATION LANGUAGEUnderlying the Wrangler interface is a declarative data trans-formation language. Both prior work [8, 17, 22] and em-pirical data guided the language design. As our startingpoint we used the Potter’s Wheel transformation language[22] (which in turn draws from SchemaSQL [17]). Informedby a corpus of data sets gathered from varied sources (e.g.,data.gov, NGOs, log files, web APIs), we then extended thelanguage with additional operators for common data clean-ing tasks. These include features such as positional oper-ators, aggregation, semantic roles, and complex reshapingoperators (e.g., using multiple key rows for cross-tabs). Wealso introduced conditional mapping operators (e.g., updatecountry to “U.S.” where state=“California”). Language state-ments manipulate data tables with numbered rows and namedcolumns of data. Wrangler treats raw text as a “degenerate”table containing one row and one column. The languageconsists of eight classes of transforms, described below.
Map transforms map one input data row to zero, one, or mul-tiple output rows. Delete transforms (one-to-zero) acceptpredicates determining which rows to remove. One-to-onetransforms include extracting, cutting, and splitting valuesinto multiple columns; reformatting; simple arithmetic; andvalue updates. One-to-many transforms include operationsfor splitting data into multiple rows, such as splitting a textfile on newlines or unnesting arrays and sets.
Lookups and joins incorporate data from external tables.Wrangler includes extensible lookup tables to support com-mon types of transformations, such as mapping zip codes tostate names for aggregation across states. Currently Wran-gler supports two types of joins: equi-joins and approximatejoins using string edit distance. These joins are useful forlookups and for correcting typos for known data types.
Reshape transforms manipulate table structure and schema.Wrangler provides two reshaping operators: fold and unfold.Fold collapses multiple columns to two or more columnscontaining key-value sets, while an unfold creates new col-umn headers from data values; see [22] for an extended dis-cussion. Reshaping enables higher-order data restructuringand is common in tools such as R and Excel Pivot Tables.
Positional transforms include fill and lag operations. Filloperations generate values based on neighboring values in arow or column and so depend on the sort order of the table.For example, an analyst might fill empty cells with precedingnon-empty values. The lag operator shifts the values of acolumn up or down by a specified number of rows.
The language also includes functions for sorting, aggrega-tion (e.g., sum, min, max, mean, standard deviation), andkey generation (a.k.a., skolemization). Finally, the languagecontains schema transforms to set column names, specifycolumn data types, and assign semantic roles.
To aid data validation and transformation, Wrangler sup-ports standard data types (e.g., integers, numbers, strings)and higher-level semantic roles (e.g., geographic location,classification codes, currencies). Data types comprise stan-dard primitives and associated parsing functions. Semanticroles consist of additional functions for parsing and format-ting values, plus zero or more transformation functions thatmap between related roles. As an example, consider a se-mantic role defining a zip code. The zip code role can checkthat a zip code parses correctly (i.e., is a 5 digit number) andthat it is a valid zip code (checking against an external dic-tionary of known zipcodes). The zip code role can also reg-ister mapping functions, e.g., to return the containing stateor a central lat-lon coordinate. Wrangler leverages types androles for parsing, validation, and transform suggestion. TheWrangler semantic role system is extensible, but currentlysupports a limited set of common roles such as geographiclocations, government codes, currencies, and dates.
The Wrangler language design co-evolved with the interfacedescribed in subsequent sections. We sought a consistentmapping between the transforms shown in the interface andstatements in the language. Disconnects between the twomight cause confusion [20], particularly when analysts try tointerpret code-generated scripts. As a result, we chose to in-troduce redundancy in the language by adding operators forhigh-level actions that are commonly needed but have unin-tuitive lower-level realizations (e.g., positional operators canbe realized using key transforms, self-joins, and scalar func-tions). The result is a clear one-to-one mapping betweentransforms presented in the interface and statements in out-put scripts. Prior work [17, 22] proves that our basic set oftransforms is sufficient to handle all one-to-one and one-to-many transforms. Through both our own practice and dis-cussions with analysts, we believe our extended language issufficient to handle a large variety of data wrangling tasks.
THE WRANGLER INTERFACE DESIGNThe goal of the Wrangler interface is to enable analysts toauthor expressive transformations with minimal difficulty andtedium. To this aim, our interface combines direct manipula-tion, automatic suggestion, menu-based transform selection,and manual editing of transform parameters. This synthe-sis of techniques enables analysts to navigate the space oftransforms using the means they find most convenient.
Both novices and experts can find it difficult to specify trans-form parameters such as regular expressions. While directmanipulation selections can help, inference is required tosuggest transforms without programming. To reduce thisgulf of execution [20], Wrangler uses an inference enginethat suggests data transformations based on user input, datatype or semantic role, and a number of empirically-derivedheuristics. These suggestions are intended to facilitate thediscovery and application of more complicated transforms.
However, suggested transforms (and their consequences) maybe difficult to understand. To reduce this gulf of evaluation[20], Wrangler provides natural language descriptions andvisual transform previews. Natural language descriptions are
intended to enhance analysts’ ability to review and refinetransformation steps. Textual annotations enable communi-cation of analyst intent. Wrangler also couples verification(run in the background as data is transformed) with visual-ization to help users discover data quality issues.
Basic InteractionsThe Wrangler interface supports six basic interactions withinthe data table. Users can select rows, select columns, clickbars in the data quality meter, select text within a cell, editdata values within the table (for mass editing [14, 19]), andassign column names, data types or semantic roles. Userscan also choose transforms from the menu or refine sugges-tions by editing transform descriptions as described below.
Automated Transformation SuggestionsAs a user interacts with data, Wrangler generates a list ofsuggested transforms. In some cases the set of possible sug-gestions is large (in the hundreds), but we wish to show onlya relevant handful to avoid overload. Instead of enumerat-ing the entire suggestion space, users can prune and reorderthe space in three ways. First, users can provide more exam-ples to disambiguate input to the inference engine. Providingexamples is especially effective for text selections neededfor splitting, extraction, and reformatting; two or three well-chosen examples typically suffice. Second, users can filterthe space of transforms by selecting an operator from thetransform menu. Third, users can edit a transform by alter-ing the parameters of a transform to a desired state.
Wrangler does not immediately execute a selected sugges-tion. Instead, Wrangler makes it the current working trans-form. The user can edit this transform directly; as a user editsparameters, the suggestion space updates to reflect these ed-its. Also, a user can instead interact with the table to generatenew suggestions that use the working transform as context.
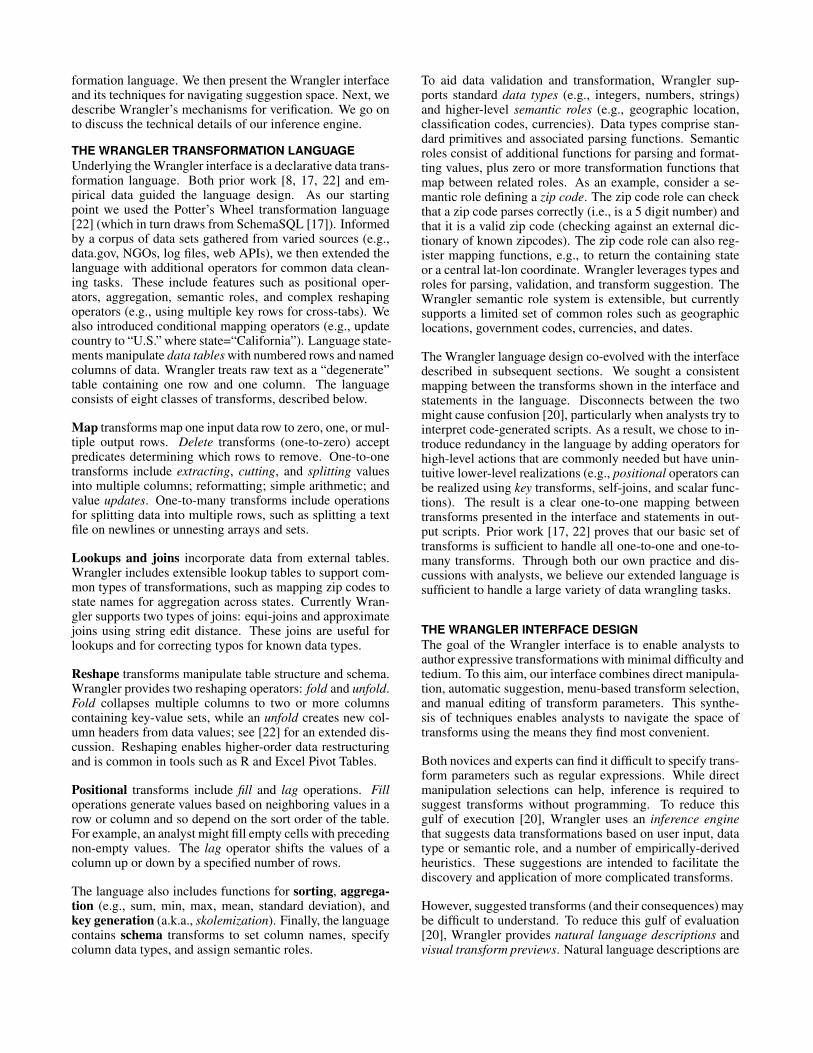
Natural Language DescriptionsTo aid apprehension of suggested transforms, Wrangler gen-erates short natural language descriptions of the transformtype and parameters. These descriptions are editable, withparameters presented as bold hyperlinks (Fig. 8). Clickinga link reveals an in-place editor appropriate to the parameter(Fig. 8b). Enumerable variables (such as the direction of afill) are mapped to drop-down menus while free-form textparameters are mapped to text editors with autocomplete.
We designed these descriptions to be concise; default param-eters that are not critical to understanding may be omitted.For example, the unless between parameter for split opera-tions indicates regions of text to ignore while splitting. Inmost cases, this parameter is left undefined and including itwould bloat the description. To edit hidden parameters, userscan click the expansion arrow to the left of the description,revealing an editor with entries for all possible parameters.
We also sought to make parameters within descriptions read-able by non-experts. For instance, we translate regular ex-pressions into natural language via pattern substitution (e.g.,(\d+) to ‘number’). This translation can make some descrip-tions less concise but increases readability. Translation is
Figure 8. Editable Natural Language Descriptions. (a) An example ofan editable description; highlighted text indicates editable parameters.(b) Clicking on a parameter reveals an in-place editor. (c) After editing,the description may update to include new parameters. In this case, anew window size parameter is displayed for the moving average.
only performed with regular expressions generated by theWrangler inference engine. If a user types in a custom ex-pression, Wrangler will reflect their input.
Visual Transformation PreviewsWrangler uses visual previews to enable users to quicklyevaluate the effect of a transform. For most transforms, Wran-gler displays these previews in the source data, and not asa separate visualization (e.g., side-by-side before and afterviews). In-place previews provide a visual economy thatserves a number of goals. First, displaying two versions ofa table inherently forces both versions to be small, whichis particularly frustrating when the differences are sparse.Second, presenting in-place modifications draws user atten-tion to the effect of the transformation in its original context,without requiring a shift in focus across multiple tables. Aswe discuss next, in-place previews better afford direct ma-nipulation for users to revise the current transform.
Wrangler maps transforms to at least one of five previewclasses: selection, deletion, update, column and table. Indefining these mappings, we attempted to convey a trans-form’s effect with minimum displacement of the originaldata. This stability allows users to continue interacting withthe original data, e.g., to provide new selection examples.
Selection previews highlight relevant regions of text in allaffected cells (Fig. 3). Deletion previews color to-be-deletedcells in red (Fig. 2). Update previews overwrite values in acolumn and indicate differences with yellow highlights (Fig.4). Column previews display new derived columns, e.g., asresults from an extract operation (Fig. 3). We show a side-by-side display of versions when previewing fold and unfoldtransforms. These alter the structure of the table to such anextent that the best preview is to show another table (Fig.6, 9). These table previews use color highlights to matchinput data to their new locations in the output table. Sometransforms map to multiple classes; e.g., extract transformsuse both selection and column previews.
When possible, previews also indicate where the user canmodify the transform through either direct manipulation ordescription refinement. Highlighting selected text or cellsworks well for certain transformations. For example, by
DataWranglerExportImport
Split data repeatedly onnewline into rows
Split split repeatedly on","
Promote row 0 to header
Delete rows 0,1
Fill row 0 by copyingvalues from the left
Transform Script
Text
Split
Cut
Columns
Fill
Drop
Rows
Delete
Fill
Promote
Table
Fold
Unfold
Clear
split split1 split2 split3 split40 2004 2004 2004 20031 STATE Participation Rate 2004 Mean SAT I Verbal Mean SAT I Math Participation Rate 20032 New York 87 497 510 823 Connecticut 85 515 515 844 Massachusetts 85 518 523 825 New Jersey 83 501 514 856 New Hampshire 80 522 521 757 D.C. 77 489 476 778 Maine 76 505 501 709 Pennsylvania 74 501 502 73
10 Delaware 73 500 499 7311 Georgia 73 494 493 66
split fold fold1 value0 New York 2004 Participation Rate 20041 New York 2004 Mean SAT I Verbal2 New York 2004 Mean SAT I Math3 New York 2003 Participation Rate 20034 New York 2003 Mean SAT I Verbal5 New York 2003 Mean SAT I Math6 Connecticut 2004 Participation Rate 20047 Connecticut 2004 Mean SAT I Verbal8 Connecticut 2004 Mean SAT I Math9 Connecticut 2003 Participation Rate 2003
10 Connecticut 2003 Mean SAT I Verbal11 Connecticut 2003 Mean SAT I Math12 Massachusetts 2004 Participation Rate 2004
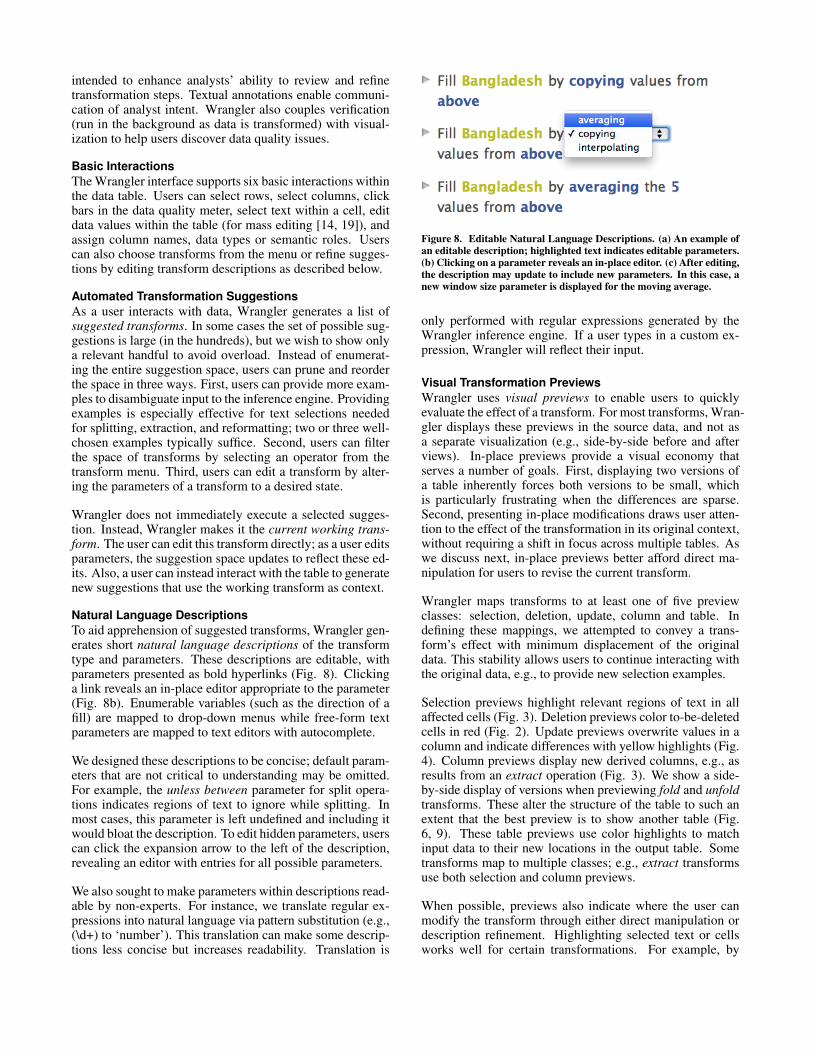
8749751082496510855155158451251485Figure 9. Visual preview of a fold operation. For transforms that rear-
range table layout, Wrangler previews the output table and uses colorhighlights to show the correspondence of values across table states.
highlighting the text selected by a regular expression in eachcell, users can determine which examples they need to fix.For reshape transforms, Wrangler highlights the input datain the same color as the corresponding output in the sec-ondary table. For instance, in a fold operation, data valuesthat will become keys are colored to match the keys in theoutput table (Fig. 9). Wrangler also highlights the param-eters in the transform description using the same colors asthose generated in previews (Fig. 3–6). The consistent useof colors allows users to associate clauses in a descriptionwith their effects in the table.
Transformation Histories and ExportAs successive transforms are applied, Wrangler adds theirdescriptions to an interactive transformation history viewer.Users can edit individual transform descriptions and selec-tively enable and disable prior transforms. Upon changes,Wrangler runs the edited script and updates the data table.Toggling or editing a transform may result in downstream er-rors; Wrangler highlights broken transforms in red and pro-vides an error message to aid debugging.
Wrangler scripts also support lightweight text annotations.Analysts can use annotations to document their rationale fora particular transform and may help future users better un-derstand data provenance. To annotate a transform, users canclick the edit icon next to the desired transform and writetheir annotation in the resulting text editor. Users can viewan annotation by mousing over the same edit icon. Theseannotations appear as comments in code-generated scripts.Users can export both generated scripts and transformed data;clicking the Export button in the transform history invokesexport options. Analysts can later run saved or exportedscripts on new data sources, modifying the script as needed.
TYPES, ROLES, AND VERIFICATIONIt is often difficult to discover data quality issues and there-fore difficult to address them by constructing the appropri-ate transform. Wrangler aids discovery of data quality issuesthrough the use of data types and semantic roles.
As users transform data, Wrangler attempts to infer the datatype and semantic role for each column. Wrangler appliesvalidation functions to a sample of a column’s data to infer
these types, assigning the type that validates for over half ofthe non-missing values. When multiple types satisfy this cri-teria, Wrangler assigns the more specific one (e.g., integer ismore specific than double). Wrangler infers semantic rolesanalogously. An icon in the column header indicates the se-mantic role of the column, or the underlying data type if norole has been assigned. Clicking the icon reveals a menuwith which users can manually assign a type or role.
Above each column is a data quality meter: a divided barchart that indicates the proportion of values in the columnthat verify completely. Values that parse successfully are in-dicated in green; values that match the type but do not matchthe role (e.g., a 6 digit zip code) are shown in yellow; thosethat do not match the type (e.g., ‘One’ does not parse as aninteger) are shown in red; and missing data are shown ingray. Clicking a bar generates suggested transforms for thatcategory. For instance, clicking the missing values bar willsuggest transforms to fill in missing values or delete thoserows. Clicking the fails role bar will suggest transforms suchas a similarity join on misspelled country names.
THE WRANGLER INFERENCE ENGINEWe now present the design of the Wrangler inference engine,which is responsible for generating a ranked list of suggestedtransforms. Inputs to the engine consist of user interactions;the current working transform; data descriptions such as col-umn data types, semantic roles, and summary statistics; anda corpus of historical usage statistics. Transform sugges-tion proceeds in three phases: inferring transform parame-ters from user interactions, generating candidate transformsfrom inferred parameters, and finally ranking the results.
Usage Corpus and Transform EquivalenceTo generate and rank transforms, Wrangler’s inference en-gine relies on a corpus of usage statistics. The corpus con-sists of frequency counts of transform descriptors and initi-ating interactions. We built our initial corpus by wranglingour collection of gathered data sets. The corpus updates overtime as more analysts use Wrangler.
For any given transform, we are unlikely to find an exactmatch in the corpus. For instance, an analyst may performa fold operation over a combination of columns and rowsthat does not appear in the corpus. In order to get usefultransform frequencies, we define a relaxed matching routine:two transforms are considered equivalent in our corpus if (a)they have an identical transform type (e.g., extract or fold)and (b) they have equivalent parameters as defined below.
Wrangler transforms accept four basic types of parameters:row, column or text selections and enumerables. We treattwo row selections as equivalent if they both (a) contain fil-tering conditions (either index- or predicate-based) or (b)match all rows in a table. Column selections are equivalentif they refer to columns with the same data type or semanticrole. We based this rule on the observation that transformsthat operate on identical data types are more likely to besimilar. Text selections are equivalent if both (a) are index-based selections or (b) contain regular expressions. We con-
sider enumerable parameters equivalent only if they matchexactly. We chose these equivalency classes based on ex-ploratory analysis of our corpus and they seem to work wellin practice. As our corpus of transforms grows with moreuse, we plan to explore more principled approaches (such asclustering) to refine our matching routines.
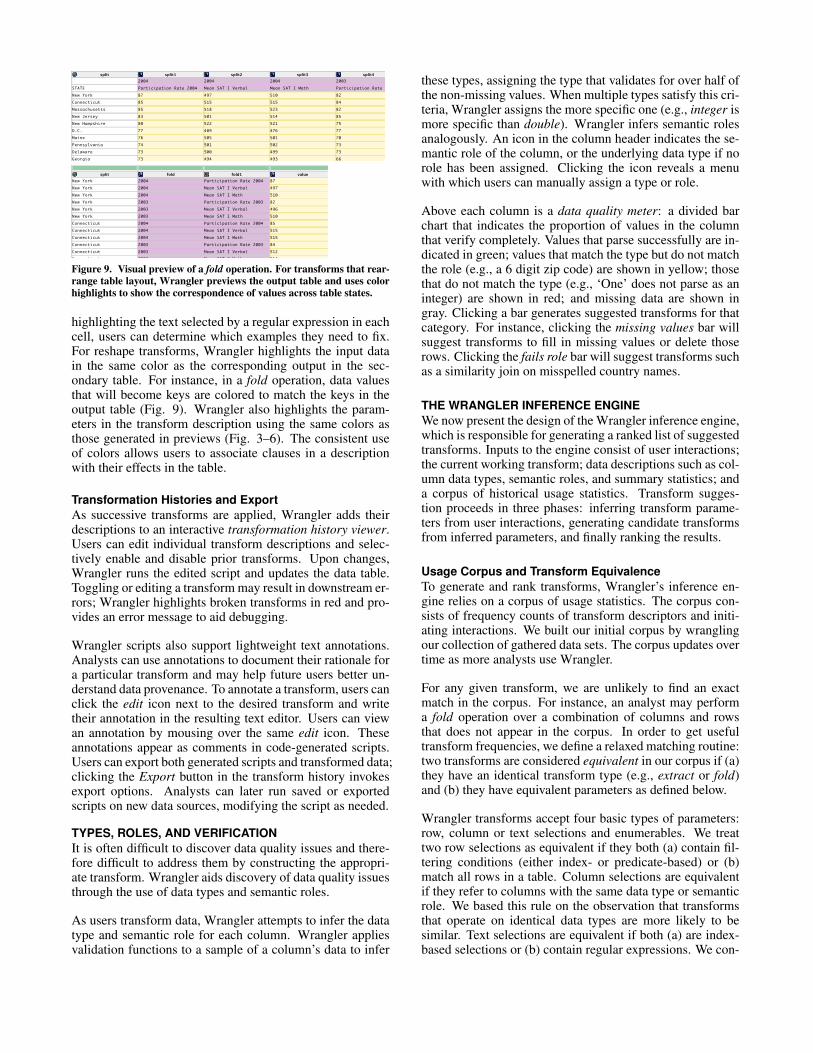
Inferring Parameter Sets from User InteractionIn response to user interaction, Wrangler attempts to inferthree types of transform parameters: row, column, or textselections. For each type we enumerate possible parametervalues, resulting in a collection of inferred parameter sets.We infer a parameter’s values independent of the other pa-rameters. For example, we infer regular expressions for textselection based solely on the selected text, a process other-wise independent of which rows or columns are selected.
We infer row selections based on row indices and predicatematching. We list predicates of the form “row is empty” and“column [equals | starts with | ends with | contains] selected-value”, then emit the selections that match the rows and textcurrently selected in the interface. For column selections wesimply return the columns that users have interacted with.
Emitted text selections are either simple index ranges (baseddirectly on selections in the interface) or inferred regular ex-pressions. To generate regular expressions, we tokenize thetext within a cell and extract both the selected text and anysurrounding text within a 5 token window. We annotate to-kens with one or more labels of the form number, word, up-percase word, lowercase word, or whitespace. We then enu-merate label sequences that match the text before, within,and after the selection range (see Fig. 10); sequences cancontain either an annotation label or the exact token text.Next we emit all possible combinations of before, within,and after sequences that match all current text selection ex-amples in the interface. It is then straightforward to translatematching label sequences into regular expressions.
Generating Suggested TransformsAfter inferring parameter sets, Wrangler generates a list oftransform suggestions. For each parameter set, we loop overeach transform type in the language, emitting the types thatcan accept all parameters in the set. For example, a splittransform can accept a parameter set containing a text selec-tion, but an unfold transform can not. Wrangler instantiateseach emitted transform with parameters from the parameterset. To determine values for missing parameters, we querythe corpus for the top-k (default 4) parameterizations that co-occur most frequently with the provided parameter set. Dur-ing this process we do not infer complex criteria such as rowpredicates or regular expressions; we do infer enumerableparameters, index-based row selections, and column inputs.We then filter the suggestion set to remove “degenerate” (no-op) transforms that would have no effect on the data.
Ranking Suggested TransformsWrangler then rank-orders transform suggestions accordingto five criteria. The first three criteria rank transforms bytheir type; the remaining two rank transforms within types.
(a) Reported crime in Alabama
(b)before: {‘in’, ‘ ’} ‘Alabama’→ {‘Alabama’, word}selection: {‘Alabama’} ‘in’→ {‘in’, word, lowercase}after: ∅ ‘ ’→ {‘ ’}
(c)before: {(‘ ’), (‘in’, ‘ ’), (word, ‘ ’), (lowercase, ‘ ’)}selection: {(‘Alabama’), (word)}after: ∅
(d)
{(),(‘Alabama’),()} {(),(word),()}{(‘ ’),(),()} {(word, ‘ ’),(),()}{(‘ ’),(‘Alabama’),()} {(word, ‘ ’),(‘Alabama’),()}{(‘ ’),(word),()} {(word, ‘ ’),(word),()}{(‘in’, ‘ ’),(),()} {(lowercase, ‘ ’),(),()}{(‘in’, ‘ ’),(‘Alabama’),()} {(lowercase, ‘ ’),(‘Alabama’),()}{(‘in’, ‘ ’),(word),()} {(lowercase, ‘ ’),(word),()}
(e) {(lowercase, ‘ ’),(‘Alabama’),()}→ /[a-z]+ (Alabama)/
Figure 10. Regular Expression Inference. (a) The user selects text in acell. (b) We tokenize selected and surrounding text. For clarity, the fig-ure only includes two neighboring tokens. For each token, we generatea set of matching labels. (c) We enumerate all label sequences matchingthe text. (d) We then enumerate all candidate before, selection and aftercombinations. Patterns that do not uniquely match the selected text arefiltered (indicated by strike-through). (e) Finally, we construct regularexpressions for each candidate pattern.
Ensuring that transforms of the same type are adjacent helpsusers compare varying parameterizations more easily.
First, we consider explicit interactions: if a user chooses atransform from the menu or selects a current working trans-form, we assign higher rank to transforms of that type. Sec-ond, we consider specification difficulty. We have observedthat row and text selection predicates are harder to specifythan other parameters. We thus label row and text selectionsas hard and all others as easy. We then sort transform typesaccording to the count of hard parameters they can accept.Third, we rank transform types based on their corpus fre-quency, conditioned on their initiating user interaction (e.g.,text or column selection). In the case of text selection, wealso consider the length of the selected text. If a user selectsthree or fewer characters, split transforms are ranked aboveextract transforms; the opposite is true for longer selections.
We then sort transforms within type. We first sort trans-forms by frequency of equivalent transforms in the corpus.Second, we sort transforms in ascending order using a sim-ple measure of transform complexity. Our goal is to prefer-entially rank simpler transforms because users can evaluatetheir descriptions more quickly. We define transform com-plexity as the sum of complexity scores for each parameter.The complexity of a row selection predicate is the number ofclauses it contains (e.g., “a=5 and b=6” has complexity 2).The complexity of a regular expression is defined to be thenumber of tokens (described previously) in its description.All other parameters are given complexity scores of zero.
Finally, we attempt to surface diverse transform types in thefinal suggestion list. We filter the transforms so that no typeaccounts for more than 1/3 of the suggestions, unless thetransform type matches the working transform or the filterresults in fewer suggestions than can appear in the interface.
COMPARATIVE EVALUATION WITH EXCELAs an initial evaluation of Wrangler, we conducted a com-parative user study with Microsoft Excel. Subjects performedthree common data cleaning tasks: value extraction, missingvalue imputation, and table reshaping. Our goal was to com-pare task completion times and observe data cleaning strate-gies. We chose Excel because it is the most popular data ma-nipulation tool and provides an ecologically valid baselinefor comparison: all subjects use it regularly and half self-report as experts. Excel also supports our chosen tasks. Nei-ther Potter’s Wheel [22] (no support for fill) nor Google Re-fine [13] (lack of reshaping) support the full set. In contrast,Excel includes specific tools for each task (text-to-columns,goto-special & pivot tables) in addition to manual editing.
Participants and MethodsWe recruited 12 participants, all professional analysts or grad-uate students who regularly work with data. Subjects ratedtheir prior experience with Excel on a 10-point scale (1 be-ing basic knowledge and 10 being expert); the median scorewas 5. Participants had never used the Wrangler interface.
We first presented a 10 minute Wrangler tutorial describ-ing how to create, edit, and execute transforms. We thenasked subjects to complete three tasks (described below) us-ing both Wrangler and Excel. We randomized the presenta-tion of tasks and tools across subjects. In each task, we askedsubjects to transform a data set into a new format, presentedto them as a picture of the final data table.
Task 1: Extract Text. In this task, we asked users to ex-tract the number of bedrooms and housing price from hous-ing listings on craigslist. The original data set contained onecell for each listing, with all the information in a text string.The target data set consisted of two columns: one for thenumber of bedrooms and one for the housing price.
Task 2: Fill Missing Values. We gave users data containingyear-by-year agricultural data for three countries. Some ofthe values in the data set were blank. The target data set con-tained the same data with all missing values replaced withthe closest non-empty value from a previous year.1
Task 3: Reshape Table Structure. Users started with threecolumns of housing data: year, month, and price. The targetdata set contained the same data formatted as a cross-tab: thedata contained one row for each year, with the 12 months ascolumn headers and housing prices as cell values.
When using Excel, we allowed subjects to ask for referencesto functions they could describe concretely (e.g., we wouldanswer “how do I split a cell?” but not “how do I get thenumber of bedrooms out?”). For Wrangler tasks, we did notrespond to user inquiries. We permitted a maximum of 10minutes per task. Each data set had at most 30 rows and 4columns; complete manual manipulation in Excel was eas-ily attainable within the time limits. Afterwards, each usercompleted a post-study questionnaire.1We acknowledge that this is not an ideal cleaning solution for thedata, but it nonetheless served as a useful test.
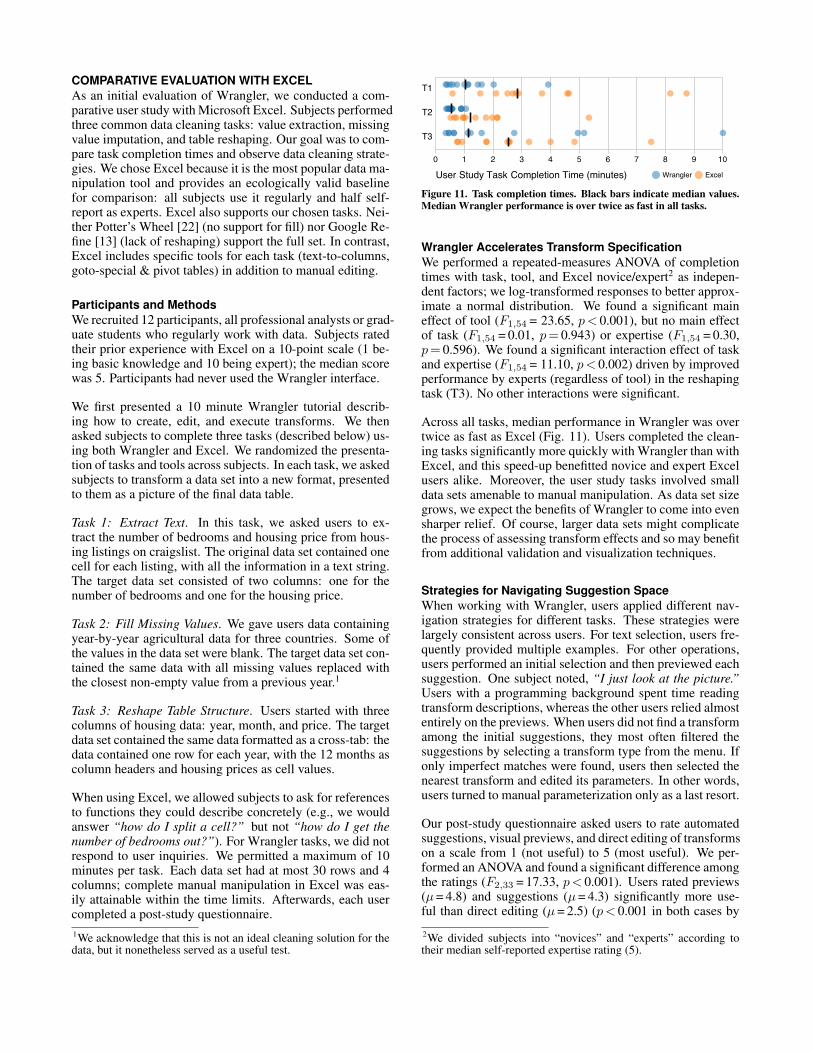
0 1 2 3 4 5 6 7 8 9 10
T1
T2
T3
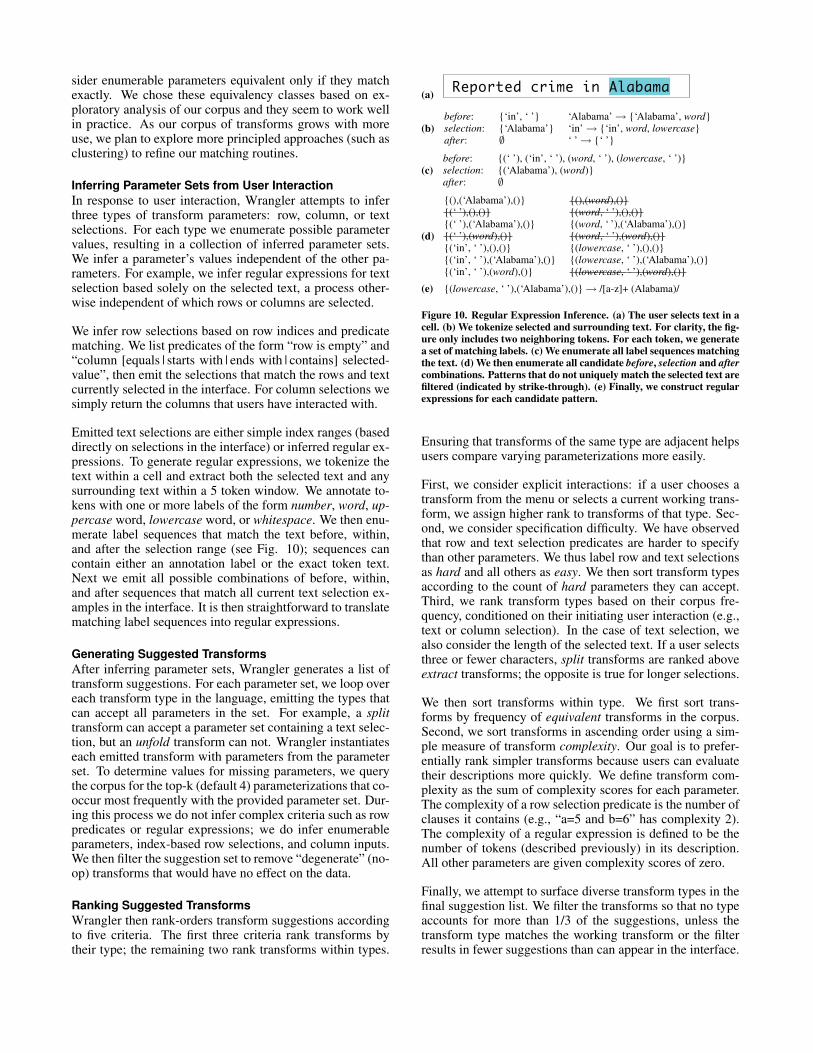
User Study Task Completion Time (minutes) Wrangler Excel
Figure 11. Task completion times. Black bars indicate median values.Median Wrangler performance is over twice as fast in all tasks.
Wrangler Accelerates Transform SpecificationWe performed a repeated-measures ANOVA of completiontimes with task, tool, and Excel novice/expert2 as indepen-dent factors; we log-transformed responses to better approx-imate a normal distribution. We found a significant maineffect of tool (F1,54 = 23.65, p< 0.001), but no main effectof task (F1,54 = 0.01, p= 0.943) or expertise (F1,54 = 0.30,p= 0.596). We found a significant interaction effect of taskand expertise (F1,54 = 11.10, p< 0.002) driven by improvedperformance by experts (regardless of tool) in the reshapingtask (T3). No other interactions were significant.
Across all tasks, median performance in Wrangler was overtwice as fast as Excel (Fig. 11). Users completed the clean-ing tasks significantly more quickly with Wrangler than withExcel, and this speed-up benefitted novice and expert Excelusers alike. Moreover, the user study tasks involved smalldata sets amenable to manual manipulation. As data set sizegrows, we expect the benefits of Wrangler to come into evensharper relief. Of course, larger data sets might complicatethe process of assessing transform effects and so may benefitfrom additional validation and visualization techniques.
Strategies for Navigating Suggestion SpaceWhen working with Wrangler, users applied different nav-igation strategies for different tasks. These strategies werelargely consistent across users. For text selection, users fre-quently provided multiple examples. For other operations,users performed an initial selection and then previewed eachsuggestion. One subject noted, “I just look at the picture.”Users with a programming background spent time readingtransform descriptions, whereas the other users relied almostentirely on the previews. When users did not find a transformamong the initial suggestions, they most often filtered thesuggestions by selecting a transform type from the menu. Ifonly imperfect matches were found, users then selected thenearest transform and edited its parameters. In other words,users turned to manual parameterization only as a last resort.
Our post-study questionnaire asked users to rate automatedsuggestions, visual previews, and direct editing of transformson a scale from 1 (not useful) to 5 (most useful). We per-formed an ANOVA and found a significant difference amongthe ratings (F2,33 = 17.33, p< 0.001). Users rated previews(µ= 4.8) and suggestions (µ= 4.3) significantly more use-ful than direct editing (µ= 2.5) (p< 0.001 in both cases by
2We divided subjects into “novices” and “experts” according totheir median self-reported expertise rating (5).
Tukey’s HSD). Users’ preference for suggestions and pre-views over direct editing provides evidence that these noveluser interface features have merit.
Users’ navigation strategies worked well when they under-stood the nature of the desired transform, even if they didnot know how to specify it. However, we found that usersof both tools experienced difficulty when they lacked a con-ceptual model of the transform. For instance, Task 3 ex-hibited an uneven distribution of completion times; 7 of the10 fastest times and 3 of the 4 slowest times were in Wran-gler. Wrangler does not provide the recourse of manual edit-ing, hence users who got stuck fared slightly better in Excel.However, those familiar with pivot operations in Excel uni-formly performed the task more quickly with Wrangler.
We also observed one recurring pitfall: a few users got stuckin a “cul-de-sac” of suggestion space by incorrectly filtering(e.g., by selecting a specific transform type from the menu).When this happened, some users kept searching and refiningonly these filtered transforms. By design, Wrangler does notafford users the same flexibility to layout data as in Excel;since users cannot perform arbitrary editing in Wrangler, therecourse is less obvious when they get stuck. This pitfall wasmost common in Task 3, where a user might mistakenly filterall but fold operations when an unfold operation was needed.One solution may be to suggest non-matching transforms re-lated to the selected transform type, in effect treating filteringcriteria as guidelines rather than strict rules.
CONCLUSION AND FUTURE WORKThis paper introduced Wrangler, an interface and underly-ing language for data transformation. The system providesa mixed-initiative interface that maps user interactions tosuggested data transforms and presents natural language de-scriptions and visual transform previews to help assess eachsuggestion. With this set of techniques, we find that userscan rapidly navigate to a desired transform.
Our user study demonstrates that novice Wrangler users canperform data cleaning tasks significantly faster than in Excel,an effect shared across both novice and expert Excel users.We found that users are comfortable switching navigationstrategies in Wrangler to suit a specific task, but can some-times get stuck—in either tool—if they are unfamiliar withthe available transforms. Future work should help users formdata cleaning strategies, perhaps through improved tutorials.
Looking forward, Wrangler addresses only a subset of thehurdles faced by data analysts. As data processing has be-come more sophisticated, there has been little progress onimproving the tedious parts of the pipeline: data entry, data(re)formatting, data cleaning, etc. The result is that peoplewith highly specialized skills (e.g., statistics, molecular bi-ology, micro-economics) spend more time in tedious “wran-gling” tasks than they do in exercising their specialty, whileless technical audiences such as journalists are unnecessarilyshut out. We believe that more research integrating methodsfrom HCI, visualization, databases, and statistics can play avital role in making data more accessible and informative.
ACKNOWLEDGEMENTSThe first author was supported by a Stanford Graduate Fel-lowship. We also thank the Boeing Company, Greenplumand Lightspeed Venture Partners for their support. This workwas partially funded by NSF Grant CCF-0963922.
REFERENCES1. A. Arasu and H. Garcia-Molina. Extracting structured data from web
pages. In ACM SIGMOD, pages 337–348, 2003.2. A. F. Blackwell. SWYN: A visual representation for regular
expressions. In Your Wish is my Command: Programming byExample, pages 245–270, 2001.
3. L. Chiticariu, P. G. Kolaitis, and L. Popa. Interactive generation ofintegrated schemas. In ACM SIGMOD, pages 833–846, 2008.
4. T. Dasu and T. Johnson. Exploratory Data Mining and Data Cleaning.John Wiley & Sons, Inc., New York, NY, 2003.
5. T. Dasu, T. Johnson, S. Muthukrishnan, and V. Shkapenyuk. Miningdatabase structure; or, how to build a data quality browser. In ACMSIGMOD, pages 240–251, 2002.
6. A. K. Elmagarmid, P. G. Ipeirotis, and V. S. Verykios. Duplicaterecord detection: A survey. IEEE TKDE, 19(1):1–16, 2007.
7. K. Fisher and R. Gruber. Pads: a domain-specific language forprocessing ad hoc data. In ACM PLDI, pages 295–304, 2005.
8. H. Galhardas, D. Florescu, D. Shasha, and E. Simon. Ajax: anextensible data cleaning tool. In ACM SIGMOD, page 590, 2000.
9. L. M. Haas, M. A. Hernández, H. Ho, L. Popa, and M. Roth. Cliogrows up: from research prototype to industrial tool. In ACMSIGMOD, pages 805–810, 2005.
10. J. M. Hellerstein. Quantitative data cleaning for large databases, 2008.White Paper, United Nations Economic Commission for Europe.
11. V. Hodge and J. Austin. A survey of outlier detection methodologies.Artif. Intell. Rev., 22(2):85–126, 2004.
12. E. Horvitz. Principles of mixed-initiative user interfaces. In ACM CHI,pages 159–166, 1999.
13. D. Huynh and S. Mazzocchi. Google Refine.http://code.google.com/p/google-refine/.
14. D. F. Huynh, R. C. Miller, and D. R. Karger. Potluck: semi-ontologyalignment for casual users. In ISWC, pages 903–910, 2007.
15. Z. G. Ives, C. A. Knoblock, S. Minton, M. Jacob, P. Pratim, T. R.Tuchinda, J. Luis, A. Maria, and M. C. Gazen. Interactive dataintegration through smart copy & paste. In CIDR, 2009.
16. H. Kang, L. Getoor, B. Shneiderman, M. Bilgic, and L. Licamele.Interactive entity resolution in relational data: A visual analytic tooland its evaluation. IEEE TVCG, 14(5):999–1014, 2008.
17. L. V. S. Lakshmanan, F. Sadri, and S. N. Subramanian. SchemaSQL:An extension to SQL for multidatabase interoperability. ACM Trans.Database Syst., 26(4):476–519, 2001.
18. J. Lin, J. Wong, J. Nichols, A. Cypher, and T. A. Lau. End-userprogramming of mashups with vegemite. In IUI, pages 97–106, 2009.
19. R. C. Miller and B. A. Myers. Interactive simultaneous editing ofmultiple text regions. In USENIX Tech. Conf., pages 161–174, 2001.
20. D. A. Norman. The Design of Everyday Things. Basic Books, 2002.21. E. Rahm and P. A. Bernstein. A survey of approaches to automatic
schema matching. The VLDB Journal, 10:334–350, 2001.22. V. Raman and J. M. Hellerstein. Potter’s wheel: An interactive data
cleaning system. In VLDB, pages 381–390, 2001.23. G. G. Robertson, M. P. Czerwinski, and J. E. Churchill. Visualization
of mappings between schemas. In ACM CHI, pages 431–439, 2005.24. C. Scaffidi, B. Myers, and M. Shaw. Intelligently creating and
recommending reusable reformatting rules. In ACM IUI, pages297–306, 2009.
25. S. Soderland. Learning information extraction rules forsemi-structured and free text. Mach. Learn., 34(1-3):233–272, 1999.
26. R. Tuchinda, P. Szekely, and C. A. Knoblock. Building mashups byexample. In ACM IUI, pages 139–148, 2008.