
WP7 - Healthcare prioritisation at the local level A...
24
Priority Setting for Population Health Working paper series ISSN 2046-4614 Working paper no. 7 Healthcare prioritisation at the local level: a socio-technical approach M Airoldi, A Morton, J Smith and G Bevan A working paper from the SyMPOSE Research team: Mara Airoldi, Research Officer, LSE Gwyn Bevan, Professor of Management Science, LSE Alec Morton, Lecturer, LSE Jenifer Smith, Director of Public Health and Medical Adviser, Isle of Wight NHS PCT Corresponding author: Mara Airoldi Department of Management London School of Economics & Political Science Houghton Street London WC2A 2AE Tel. +44 (0)20 7955 6234 Email: [email protected] Series editor: Prof Gwyn Bevan Department of Management London School of Economics & Political Science Houghton Street London WC2A 2AE Tel. +44 (0)20 7955 6269 Email: [email protected] Online publication March 2011
Transcript of WP7 - Healthcare prioritisation at the local level A...

Priority Setting for Population Health Working paper series ISSN 2046-4614
Working paper no. 7
Healthcare prioritisation at the local level: a socio-technical
approach
M Airoldi, A Morton, J Smith and G Bevan A working paper from the SyMPOSE Research team:
Mara Airoldi, Research Officer, LSE Gwyn Bevan, Professor of Management Science, LSE
Alec Morton, Lecturer, LSE Jenifer Smith, Director of Public Health and Medical Adviser, Isle of Wight NHS PCT
Corresponding author:
Mara Airoldi
Department of Management London School of Economics & Political
Science
Houghton Street London WC2A 2AE
Tel. +44 (0)20 7955 6234 Email: [email protected]
Series editor:
Prof Gwyn Bevan
Department of Management London School of Economics & Political
Science
Houghton Street London WC2A 2AE
Tel. +44 (0)20 7955 6269 Email: [email protected]
Online publication March 2011

2
Healthcare prioritisation at the local level: a socio-technical approach
Abstract
Cost effectiveness analysis is a systematic tool to inform resource allocation decision in healthcare. There is extensive evidence, however, that the tool is difficult to apply in practice, particularly at the level of local health planners, because it is not accessible to those involved in the prioritisation process and not embeds assumptions which are felt to be unacceptable for ethical or other reasons. Pragmatic tools such as Program Budgeting and Marginal Analysis appear to be more suitable for supporting local decisions by engaging stakeholders in a deliberative process. Unlike cost-effectiveness analysis, however, these tools are hard to relate to widely accepted health economic principles. This paper presents a socio-technical approach which draws explicitly on health economic theory and in a practical and reproduceable way through an action research case study with a local healthcare planner of the English National Health Service. Through close and iterative work with those responsible for allocating resources we present a formal model to capture the objectives of the health planners, a communicative procedure and interactive elicitation methods to help key stakeholders to articulate their knowledge and values. The approach proved accessible and acceptable and has been used in making spending decisions.
1. Introduction
One of the central aims of health economics as a discipline is the development of methods for the
prioritisation of healthcare resources in a way which is justifiable with respect to normative
principles and incorporates evidence about health and healthcare performance. However,
methods also have to be practical and what counts as practical depends on the level at which
prioritisation takes place. For example, in the English National Health Service (NHS) over the
last few years, at least two levels can be distinguished. At the national level priorities are
expressed through national policies which lay out standards of care and good practice guidelines.
However, it is at the local level that decisions about contracting particular services are made, and
it is these decisions which determine, in the most direct and tangible sense, how much, what and
what sort of care patients resident in the locality receive. System actors at these different levels
have quite different needs and competencies, and hence may require different processes for
setting priorities.
The most widely accepted framework for healthcare prioritisation, at least within the health
economic community, is Cost Effectiveness Analysis or CEA (Drummond, Sculpher, Torrance,
O' Brien, & Stoddart, 2005; Gold, Siegel, Russell, & Weinstein, 1996). The precise usage of this

3
term is somewhat contested, but considered in its broadest sense, the key idea of CEA is that
decisions about which particular programmes to fund should be made on the basis of (or at least
meaningfully informed by) a comparative analysis of the costs of those programmes, and the
quantum of health which those programmes deliver, and to whom. Within the mainstream of
health economics orthodoxy, the quantum of health is generally measured in Quality Adjusted
Life Years or QALYs, and the focus is traditionally on the marginal beneficiary (Williams, 1985).
A subject of some controversy in the area in recent years has been the role of the methods of the
World Health Organisation, so-called “Generalised Cost Effectiveness Analysis” (Tan-Torres
Edejer, Baltussen, Adam, Hutubessy, Acharya, Evans et al., 2003). Two features of this
generalised approach stand out: one is the use of the DALY (Disability-Adjusted Life Year)
instead of the QALY metric, and the other is a stress on taking the population perspective, rather
the perspective of the marginal beneficiary We consider the DALY metric to be problematic for
technical reasons (Airoldi & Morton, 2009), but we also take a population focus. As we argue
below this allows decision makers to have a sense of the cost impact of implementing change and
the opportunity costs when operating out of a fixed budget envelope – something which applying
a simple cost-effectiveness cut-off rule does not do (Birch & Gafni, 2006; Gafni & Birch, 2006).
Despite the existence of standards to perform CEA laid out in the above cited texts, there is a gap
between technical analyses and their use to design policy recommendations both at the national
and local levels, but particularly at the local level.
At the national level, where CEA is relatively widely applied, Bryan and colleagues (Bryan,
Williams, & McIver, 2007; Williams & Bryan, 2007), offer a general characterisation of barriers
to the use of CEA in terms of “accessibility” and “acceptability” based on interviews, committee
observations and document analysis of the Appraisals Committee, the Health Technology
Assessment agency of the English NHS. These authors claim that accessability is compromised
because of the difficulties of interpreting the results of CEA because of the lack of health
economic skills of individual members of the committee, lack of timely access to data underlying
the analysis and results presented too technically, making it difficult for non health-economists to
fully appreciate their meaning and robustness. The acceptability of CEA is limited because of the
inability of the Quality Adjusted Life Year (QALY) tool to account for benefits which are valued
by patients (e.g. an issue identified by NICE Appraisal Committee was the difficulty to account
for disease irreversibility); the lack of a standard, systematic way to account for the impact of
4
interventions on health inequality which the committee could apply consistently across different
evaluations; and concerns over the implicit consideration of the opportunity cost of recommended
interventions through the use of a threshold cost-effectiveness value, over which interventions are
deemed cost-ineffective and should not be funded.
At the local level the problems of acceptability and accessibility are exacerbated by the even
scarcer availability of time and resources to commission CEA, and the specialist skills to interpret
it. Moreover, the local environment is more constrained than the national environment, as local
prioritisation must take place within a framework of budgets and political objectives which are
exogenously determined and imposed on the local organisation (Eddama & Coast, 2008).
One approach that has been proposed and used extensively to facilitate systematic planning at the
local level is Program Budgeting and Marginal Analysis (PBMA; Madden, Hussey, Mooney, &
Church, 1995; Mitton & Donaldson, 2001; Mitton & Donaldson, 2004; Mitton, Patten, Waldner,
& Donaldson, 2003; Mooney, 1978; Peacock, Mitton, Ruta, Donaldson, Bate, & Hedden, 2010;
Peacock, Richardson, Carter, & Edwards, 2007). PBMA is a pragmatic approach to applying the
economic principles of marginal analysis and opportunity cost to local resource allocation
decisions. In PBMA a structured process is used to engage local stakeholders in considering
current spend, and proposing a ‘wish list’ of new interventions and a ‘hit list’ of potential
disinvestments from current activity to fund the new proposals. The value of current and new
interventions is generally assessed against all the criteria considered relevant by the local
stakeholders using Multi-Criteria Decision Analysis (MCDA; Keeney & Raiffa, 1976) and
participants are invited to consider the impact of changes to healthcare provision, that is the
difference in benefits between funding the interventions on the wish list or on the hit list.
However, contrary to CEA, it is not clear how the criteria proposed within PBMA relate to the
normative principles, of health economics, nor it it clear how epidemiological and clinical
evidence can be integrated into the modelling in a way consistent way.
This paper contributes to the development of methods to inform resource allocation by local
healthcare planners proposing a “socio-technical” approach. The term “socio-technical” emerged
around the 1960s to refer to an approach to designing organisational change in the workplace
which recognised the need to take into account simultaneously the people and technology
dimensions of the work environment (Trist, 1981). More broadly, the term can be understood as
applying to approaches which consider simultaneously a social dimension, e.g. engaging

5
stakeholders in defining and solving a problem, and a technical dimension, e.g. the rational-
analytic method which could be applied to quantify and solve the problem at hand (Phillips, 2007;
Phillips & Bana e Costa, 2007). The use of a socio-technical approach seems appropriate in the
context of healthcare systems, which are characterised by a natural tension which arises from the
need to reconcile policy-making as both a political process with policy-making and an analytical-
rational process based on expertise (Klein, 2006).
The paper presents a case study to describe the development and application of a socio-technical
approach. Section two describes the research methods. Section three presents the case study in
terms of context, terms of reference, the socio-technical process (formal analysis, communication
procedure and interactive elicitation methods) and results. Section four discusses the accessibility,
acceptability and the impact of the approach and section five provides concluding remarks.
2. Methods
This paper employs action research and the case study methodology. The term action research
covers a multitude of activities and methods; their common feature is the participative
engagement of the subjects of the analysis in the research, the research objective of analysing the
world and trying to change it at the same time (Eden & Huxham, 1996). The case study
methodology illuminates the set of decisions taken by the health planners in terms of why and
how they were taken (Yin, 2009).
The research was conducted in collaboration with and for the Isle of Wight Primary Care Trust
(PCT) of the English National Health Service (NHS) in 2008. PCTs are responsible for designing
contracts with providers defining the type and volume of activity they expect to purchase to meet
the health need of the local population of about 330,000 people on average. As the local planning
and purchasing agency of the NHS, PCTs are funded through general taxation and a capitation
formula (Department of Health, 2008).
The approach we took to helping the organisation prioritise was a decision analysis approach.
Decision analysis aims at assisting ‘decision makers’ to make better decisions by dividing a
complex problem in its simpler elements, analysing these separately, and re-combining them
according to a valid theory (Raiffa, 1968). The use of decision analysis to assist with problems of
6
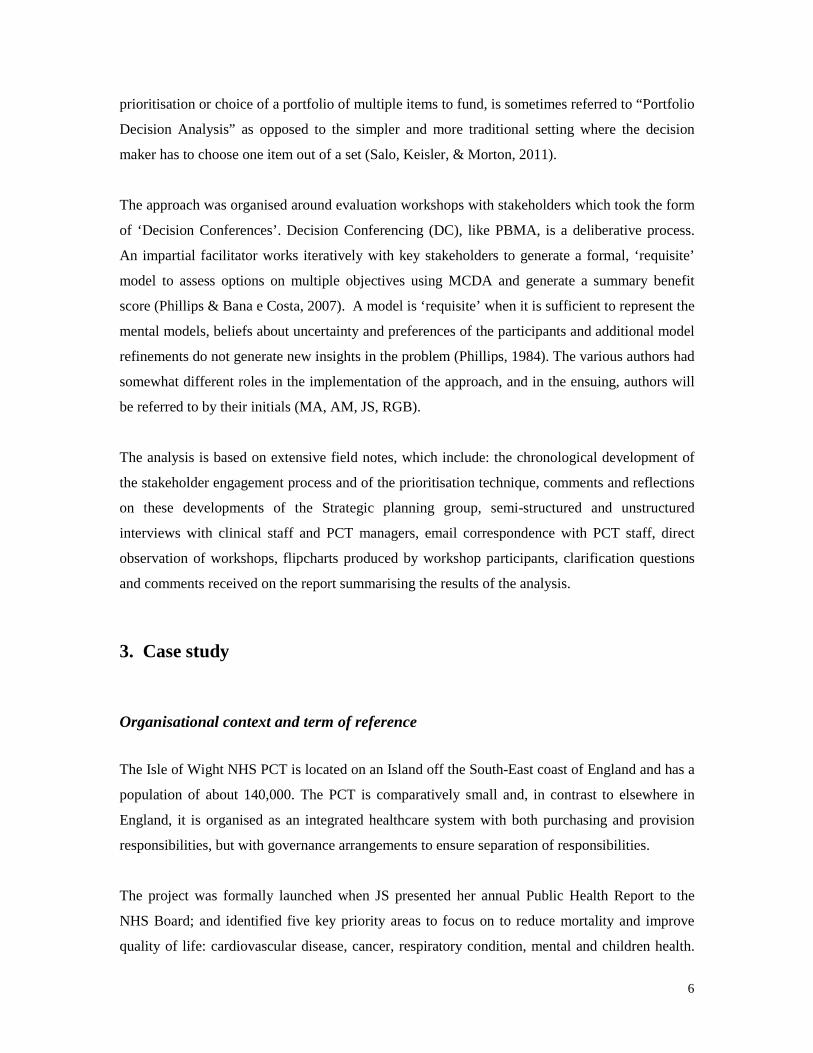
prioritisation or choice of a portfolio of multiple items to fund, is sometimes referred to “Portfolio
Decision Analysis” as opposed to the simpler and more traditional setting where the decision
maker has to choose one item out of a set (Salo, Keisler, & Morton, 2011).
The approach was organised around evaluation workshops with stakeholders which took the form
of ‘Decision Conferences’. Decision Conferencing (DC), like PBMA, is a deliberative process.
An impartial facilitator works iteratively with key stakeholders to generate a formal, ‘requisite’
model to assess options on multiple objectives using MCDA and generate a summary benefit
score (Phillips & Bana e Costa, 2007). A model is ‘requisite’ when it is sufficient to represent the
mental models, beliefs about uncertainty and preferences of the participants and additional model
refinements do not generate new insights in the problem (Phillips, 1984). The various authors had
somewhat different roles in the implementation of the approach, and in the ensuing, authors will
be referred to by their initials (MA, AM, JS, RGB).
The analysis is based on extensive field notes, which include: the chronological development of
the stakeholder engagement process and of the prioritisation technique, comments and reflections
on these developments of the Strategic planning group, semi-structured and unstructured
interviews with clinical staff and PCT managers, email correspondence with PCT staff, direct
observation of workshops, flipcharts produced by workshop participants, clarification questions
and comments received on the report summarising the results of the analysis.
3. Case study
Organisational context and term of reference
The Isle of Wight NHS PCT is located on an Island off the South-East coast of England and has a
population of about 140,000. The PCT is comparatively small and, in contrast to elsewhere in
England, it is organised as an integrated healthcare system with both purchasing and provision
responsibilities, but with governance arrangements to ensure separation of responsibilities.
The project was formally launched when JS presented her annual Public Health Report to the
NHS Board; and identified five key priority areas to focus on to reduce mortality and improve
quality of life: cardiovascular disease, cancer, respiratory condition, mental and children health.

7
During the same meeting MA illustrated the process of DC and gained support from the Board to
use this in developing their commissioning strategy. The aims of the engagement were to involve
local stakeholders in the five identified priority areas to generate a robust plan for allocating an
additional £1m on a recurrent basis from 2008 to 2012 through the PCT ‘operational plan’ (i.e.
the budgeting or purchasing plan), on a value for money basis. The Board recommended looking
at costs and using three criteria to identify value: to increase health (both in terms of reduced
mortality and increased quality of life), to reduce health inequalities, and to be operationally and
politically feasible.
The socio-technical process
The action research project ran from April to November 2008. This time corresponded with the
process leading up to the operational plan proposal. The engagement consisted in (i) a schedule of
meetings (two initial meetings in the spring and then fortnightly from June); (ii) the design, in
collaboration with the PCT, of a social process to engage key stakeholders (including managers,
clinicians, patients and public representatives) and of a technical process based in CEA principles
to derive a list of priorities to allocate the growth money; (iii) the guidance on extracting
information from available demographic and epidemiological data to support the evaluation of
different interventions; (iv) the facilitation of meetings with stakeholders; (v) the analysis of
results; (vi) the production of a report to document the process and to identify recommendations
from the analysis; and answering further questions and and performing supplementary analyses.
Executive level leadership was provided through the Strategic Planning group, which was set up
by the Director of Public Health and Chief Medical Adviser of the Island (JS) with the support of
the PCT board. They met fortnightly under the chairmanship of JS who also proposed and
circulated for comments an agenda in advance. The group consisted of all eight executive
directors; MA and a secretary also attended meetings. Its responsibility was to design an
engagement process, choose a prioritisation technique and put forward recommendations to invest
available, additional resources.
The Strategic Planning group selected and engaged stakeholders in two different types of event.
First, they organised separate workshops for each of the five priority areas asking lead
commissioners responsible for those areas to draw a list of key stakeholders including acute and
8
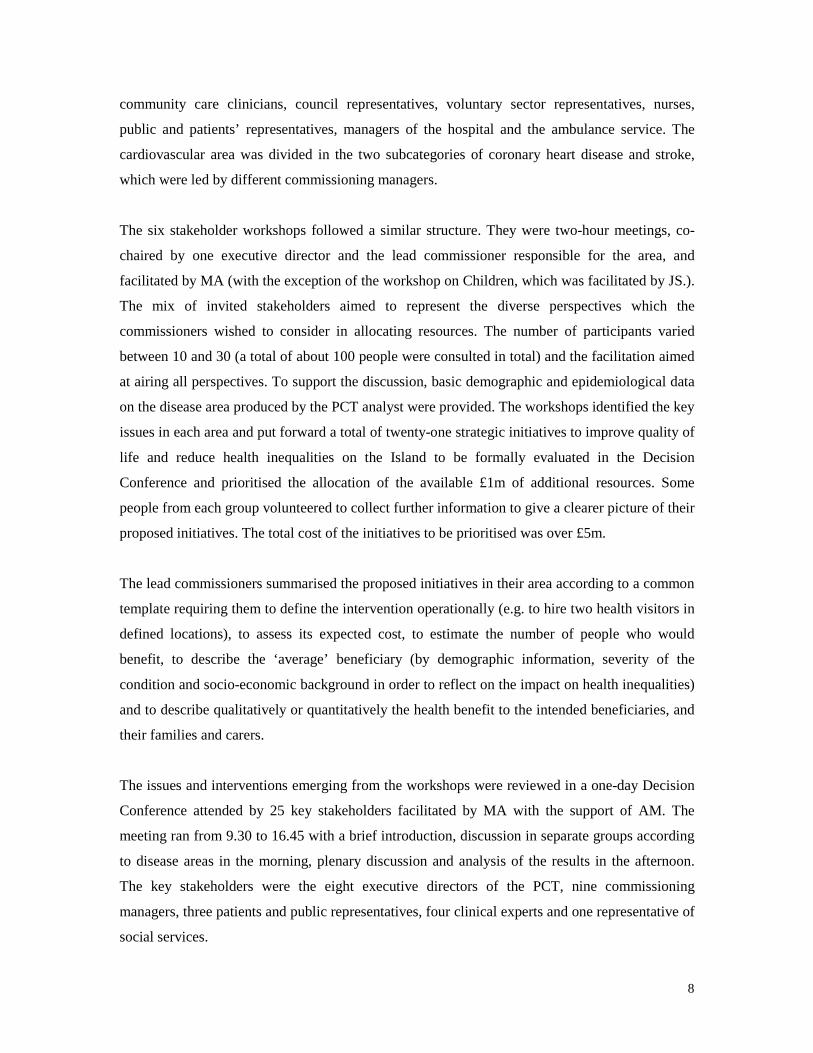
community care clinicians, council representatives, voluntary sector representatives, nurses,
public and patients’ representatives, managers of the hospital and the ambulance service. The
cardiovascular area was divided in the two subcategories of coronary heart disease and stroke,
which were led by different commissioning managers.
The six stakeholder workshops followed a similar structure. They were two-hour meetings, co-
chaired by one executive director and the lead commissioner responsible for the area, and
facilitated by MA (with the exception of the workshop on Children, which was facilitated by JS.).
The mix of invited stakeholders aimed to represent the diverse perspectives which the
commissioners wished to consider in allocating resources. The number of participants varied
between 10 and 30 (a total of about 100 people were consulted in total) and the facilitation aimed
at airing all perspectives. To support the discussion, basic demographic and epidemiological data
on the disease area produced by the PCT analyst were provided. The workshops identified the key
issues in each area and put forward a total of twenty-one strategic initiatives to improve quality of
life and reduce health inequalities on the Island to be formally evaluated in the Decision
Conference and prioritised the allocation of the available £1m of additional resources. Some
people from each group volunteered to collect further information to give a clearer picture of their
proposed initiatives. The total cost of the initiatives to be prioritised was over £5m.
The lead commissioners summarised the proposed initiatives in their area according to a common
template requiring them to define the intervention operationally (e.g. to hire two health visitors in
defined locations), to assess its expected cost, to estimate the number of people who would
benefit, to describe the ‘average’ beneficiary (by demographic information, severity of the
condition and socio-economic background in order to reflect on the impact on health inequalities)
and to describe qualitatively or quantitatively the health benefit to the intended beneficiaries, and
their families and carers.
The issues and interventions emerging from the workshops were reviewed in a one-day Decision
Conference attended by 25 key stakeholders facilitated by MA with the support of AM. The
meeting ran from 9.30 to 16.45 with a brief introduction, discussion in separate groups according
to disease areas in the morning, plenary discussion and analysis of the results in the afternoon.
The key stakeholders were the eight executive directors of the PCT, nine commissioning
managers, three patients and public representatives, four clinical experts and one representative of
social services.

9
In the meeting, participants built a formal model of the costs and value of all twenty-one strategic
interventions on-the-spot in terms of costs and the three criteria defined by the Strategic planning
group as follows:
� Costs (c): The additional annual funding required in 2009 and 2010 both to set-up and to
run the intervention, in £’000. Set-up costs included initial investments such as training
and equipment and the running costs included costs such as personnel.
� Health benefit to the Isle of Wight population (N*B): the extent to which the assessed
additional intervention would improve the quality (and length) of life of those who
benefit. The health benefit was modelled as the product of:
o the number (N) of patients who benefit (excluding carers/family) by funding this
additional intervention;
o the potential benefit (B) in quality (and length) of life from this additional
intervention, assuming successful implementation, to the ‘average’ patient who
benefits, including the benefit to his/her carers/family and taking into account
the timing and duration of those benefits.
� Health inequalities (I): the extent to which this additional intervention has the potential
for reducing both differences in access and differences in health outcomes (across
geographical areas, between men and women, of special groups) if appropriately
targeted.
� Feasibility (p): Probability of success (from 0% to 100%) to achieve the assessed
benefits, assuming funding is granted and taking into account: ease of implementation;
availability of workforce; acceptability to stakeholder/environment (e.g. willingness to
make this change happen); process complexity (e.g. number of steps required). This
criterion captures the concept of ‘operationally and politically feasible’ the Board asked
the Strategic Planning group to consider in its terms of reference.
The formal model underpinning the evaluation is to Max Σj E(vj) * xj, where E() indicates an
expected value calculation, vj is the benefit from intervention j (details of its calculation will be
provided later), and xj is an index variable with value 1 in case intervention j is funded, and value
0 in case it is not. In the model used during the workshop, we made a simplifying assumption
about E(), namely we assumed that the intervention would have been successful and deliver its
benefits in full with probability p%; if unsuccessful (1-p% probability), it would have delivered
no benefit. This assumption was subjected to sensitivity analysis after the stakeholder event. The
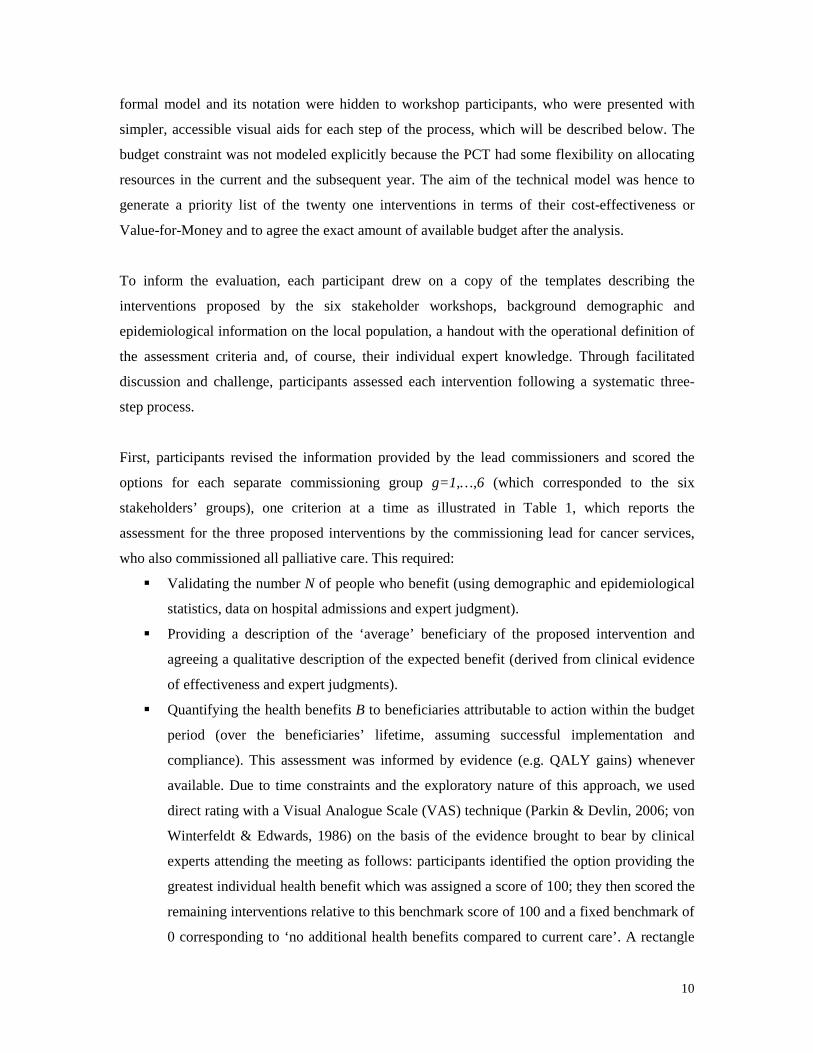
10
formal model and its notation were hidden to workshop participants, who were presented with
simpler, accessible visual aids for each step of the process, which will be described below. The
budget constraint was not modeled explicitly because the PCT had some flexibility on allocating
resources in the current and the subsequent year. The aim of the technical model was hence to
generate a priority list of the twenty one interventions in terms of their cost-effectiveness or
Value-for-Money and to agree the exact amount of available budget after the analysis.
To inform the evaluation, each participant drew on a copy of the templates describing the
interventions proposed by the six stakeholder workshops, background demographic and
epidemiological information on the local population, a handout with the operational definition of
the assessment criteria and, of course, their individual expert knowledge. Through facilitated
discussion and challenge, participants assessed each intervention following a systematic three-
step process.
First, participants revised the information provided by the lead commissioners and scored the
options for each separate commissioning group g=1,…,6 (which corresponded to the six
stakeholders’ groups), one criterion at a time as illustrated in Table 1, which reports the
assessment for the three proposed interventions by the commissioning lead for cancer services,
who also commissioned all palliative care. This required:
� Validating the number N of people who benefit (using demographic and epidemiological
statistics, data on hospital admissions and expert judgment).
� Providing a description of the ‘average’ beneficiary of the proposed intervention and
agreeing a qualitative description of the expected benefit (derived from clinical evidence
of effectiveness and expert judgments).
� Quantifying the health benefits B to beneficiaries attributable to action within the budget
period (over the beneficiaries’ lifetime, assuming successful implementation and
compliance). This assessment was informed by evidence (e.g. QALY gains) whenever
available. Due to time constraints and the exploratory nature of this approach, we used
direct rating with a Visual Analogue Scale (VAS) technique (Parkin & Devlin, 2006; von
Winterfeldt & Edwards, 1986) on the basis of the evidence brought to bear by clinical
experts attending the meeting as follows: participants identified the option providing the
greatest individual health benefit which was assigned a score of 100; they then scored the
remaining interventions relative to this benchmark score of 100 and a fixed benchmark of
0 corresponding to ‘no additional health benefits compared to current care’. A rectangle
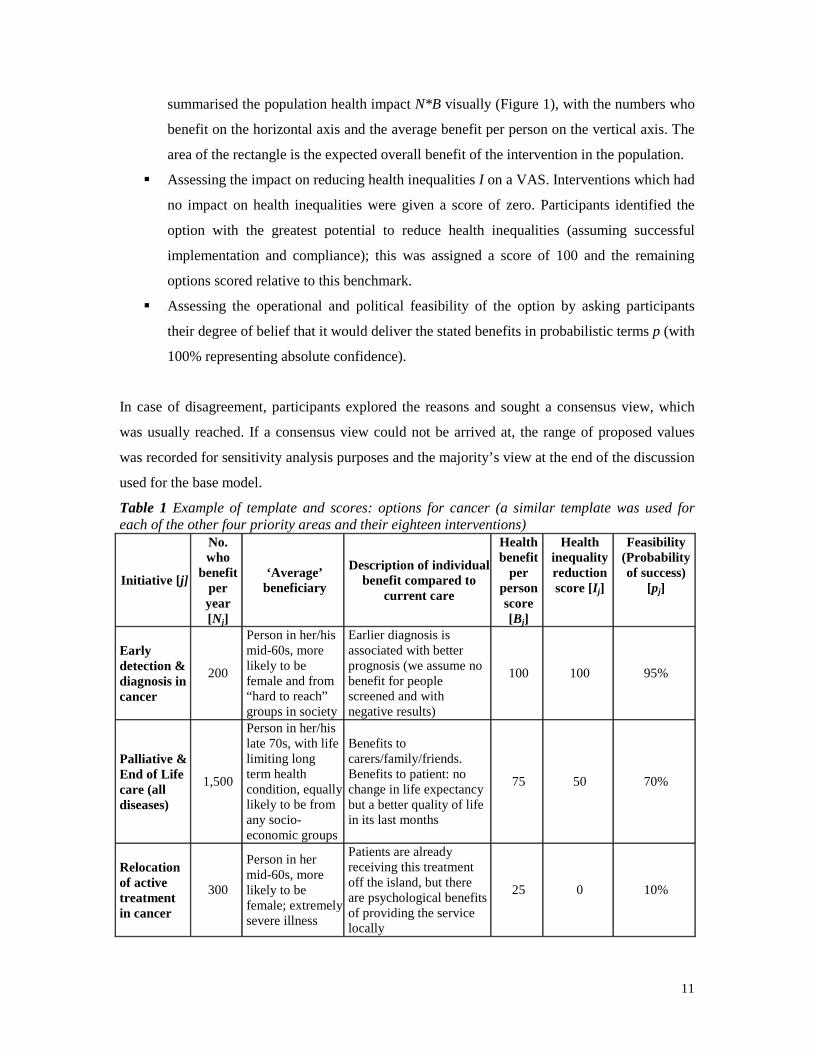
11
summarised the population health impact N*B visually (Figure 1), with the numbers who
benefit on the horizontal axis and the average benefit per person on the vertical axis. The
area of the rectangle is the expected overall benefit of the intervention in the population.
� Assessing the impact on reducing health inequalities I on a VAS. Interventions which had
no impact on health inequalities were given a score of zero. Participants identified the
option with the greatest potential to reduce health inequalities (assuming successful
implementation and compliance); this was assigned a score of 100 and the remaining
options scored relative to this benchmark.
� Assessing the operational and political feasibility of the option by asking participants
their degree of belief that it would deliver the stated benefits in probabilistic terms p (with
100% representing absolute confidence).
In case of disagreement, participants explored the reasons and sought a consensus view, which
was usually reached. If a consensus view could not be arrived at, the range of proposed values
was recorded for sensitivity analysis purposes and the majority’s view at the end of the discussion
used for the base model.
Table 1 Example of template and scores: options for cancer (a similar template was used for each of the other four priority areas and their eighteen interventions)
Initiative [ j]
No. who
benefit per year [Nj]
‘Average’ beneficiary
Description of individual benefit compared to
current care
Health benefit
per person score [Bj]
Health inequality reduction score [Ij]
Feasibility (Probability of success)
[pj]
Early detection & diagnosis in cancer
200
Person in her/his mid-60s, more likely to be female and from “hard to reach” groups in society
Earlier diagnosis is associated with better prognosis (we assume no benefit for people screened and with negative results)
100 100 95%
Palliative & End of Life care (all diseases)
1,500
Person in her/his late 70s, with life limiting long term health condition, equally likely to be from any socio-economic groups
Benefits to carers/family/friends. Benefits to patient: no change in life expectancy but a better quality of life in its last months
75 50 70%
Relocation of active treatment in cancer
300
Person in her mid-60s, more likely to be female; extremely severe illness
Patients are already receiving this treatment off the island, but there are psychological benefits of providing the service locally
25 0 10%

12
-
10
20
30
40
50
60
70
80
90
100
0 200 400 600 800 1000 1200 1400 1600
numbers who benefit (N )
aver
age
hea
lth
ben
efit
per
per
son
(B
)
Early detection & diagnosis Active treatment relocat Palliative & EoL care
Figure 1 The rectangles of health benefit to the population for the three proposed initiatives in Cancer. Similar rectangles were drawn for each of the five areas and their interventions.
Second, the facilitators used decision analysis techniques to convert the scores on the three
criteria on a common metric using three vectors of weights (Goodwin & Wright, 2004), which
were elicited from participants. With the first vectors of weights, 1 6( ,..., ,..., )B B B Bgw w w w= and
1 6( ,..., ,..., )I I I Igw w w w= , participants considered one objective or criterion at a time and assessed
the relative contribution to achieving the given objective by investing in a set of interventions in a
disease group g (e.g. all proposed initiatives in the Cancer area) compared to another (e.g. all
proposed initiatives in the Respiratory one). These weights are rescaling factors to convert scores
for the same criterion in different disease areas on a common scale. We elicited a total of twelve
within-criteria weights assigning a weight of 100 to the highest Bgw and the highest I
gw . Then
participants considered health benefit and inequality reduction criteria and assessed their relative
contribution to achieve the PCT’s objectives, to convert scores on different criteria on a common
value scale. To elicit this weight, participants considered the disease areas which received the
highest within criteria weights of 100. A single rescaling factor W was sufficient to render scores

13
on the health inequality criterion commensurable with scores on the health benefit cirterion. The
judgments expressed in the across criteria weights are inherently subjective and the weighting
procedure is cognitively complex and emotionally challenging. The facilitator helped participants
in forming and expressing these values openly, noting uncertainty and disagreements to be
explored by sensitivity analysis.
To incorporate the feasibility criterion, in the Decision Conference it was assumed that the PCT
would not achieve any benefit from an unsuccessful intervention (for each intervention j this
occurs with probability 1-pj%). After the meeting, extensive parametric sensitivity analysis tested
the robustness of results to this assumption through a parameter k∈[0,1], which represented the
proportion of benefits which would have been achieved in case of unsuccessful interventions.
Defining ( )g j as the commissioning group of intervention j, the expected value of each
intervention was hence calculated as follows (assuming k=0 during the Decision Conference):
( ) ( ) ( )( ) ( ) ( ) ( )(1 )B I B Ij j g j j j g j j j g j j j g j jE v p w N B W w I p k w N B W w I = ⋅ ⋅ ⋅ + ⋅ + − ⋅ ⋅ ⋅ ⋅ + ⋅ .
Thus, at the core of the analysis was a value model based on the expected value, with value
computed as a weighted additive combination of health gain and inequality reduction. There is
precedent for this sort of modelling strategy in the decision analysis literature: for example,
Keeney and Winkler (1985) also present an additive model with absolute and distributional
components for evaluating risk reductions.
Third, participants were presented with a triangle that focused the discussion on Value-for-Money
of each intervention (Figure 2). The horizontal side of the triangle is the additional cost cj
associated with the intervention; the vertical side is the additional expected benefit score E(vj);
and the slope of the hypotenuse of the triangle represents Value-for-Money with steeper
hypotenuses representing better value for money, that is, more benefits for each pound spent.
Showing the triangles stimulated a discussion both for their comparative size and slope. In most
cases participants recognised the comparison as a fair representation of their intuitive judgments,
but they had now a language to entertain a more informed discussion. In few cases results were
less intuitive and explored extensively by revising the assessments of costs and benefits that
constituted the scale and slope of the triangle creating a better understanding of the appraised
interventions. Whenever necessary, assessments were revised.

14
Costs (c)
Reduced inequalitieswacross*wwithinI*I
Improved population health
wwithinB*N*B
Benefit score (v)
Expectedbenefit E(v)
For k=0
VfM index E(v)/c
Figure 2 The structure of a value-for-money triangle
Results
The triangles were used to generate a priority list in which interventions were ranked according to
Value-for-Money (Table 2), from the triangle with the steepest hypotenuse to the one with the
flattest. This ranking is a cost effectiveness ranking similar to cost/QALY league table. Extensive
sensitivity analysis was used to explore the uncertainties and disagreements among participants
and the model proved robust. Figure 3 shows the same information in graphical form. The visual
display generated important learning: for example, one intervention the evaluation of which had
attracted considerable attention within the organisation, was represented by a triangle which was
not only shallow (and thus low value for money), but tiny, because they it touched such a small
number of people. Thus, from the point of view of almost everyone in the local population, and
from the point of view the cost imposed on the system, it did not really matter whether this
intervention was undertaken or not. To our minds, this sort of insight validates the importance of
looking at benefits scaled up to the level of the population.

15
Table 2 Priority order according to Value-for-money (‘league table’) for k=0.5.
Commissioning area [g]
Intervention [j]
Additional cost in £k
[cj]
Additional benefit [E(vj)]
VfM ratio
[E(vj)/cj]
Cumulative cost in £k
Cumulative benefit
RESPIRATORY pneumonia £ 75 11.84 0.1579 £ 75 11.84 MENTAL HEALTH
Dementia services
£ 50 5.18 0.1036 £ 125 17.02
CVD TIA & 2ndary prevention
£ 130 5.40 0.0415 £ 255 22.42
MENTAL HEALTH
Prison MH £ 150 4.51 0.0301 £ 405 26.94
CHILDREN Obesity training £ 60 1.73 0.0289 £ 465 28.67
CHILDREN Workforce development
£ 100 2.78 0.0278 £ 565 31.44
MENTAL HEALTH
Psych therapies £ 120 3.05 0.0254 £ 685 34.49
CANCER Early detection and diagnostics
£ 300 5.74 0.0191 £ 985 40.23
CHILDREN CAMHS School £ 160 2.76 0.0173 £ 1,145 42.99 CVD Prevention £ 650 10.48 0.0161 £ 1,795 53.48 CHILDREN CAMHS 1:1 £ 80 1.26 0.0157 £ 1,875 54.73 CVD Cardiac Rehab £ 100 1.29 0.0129 £ 1,975 56.02 MENTAL HEALTH
Alcohol misuse svc
£ 300 3.77 0.0126 £ 2,275 59.78
MENTAL HEALTH
Social inclusion £ 300 3.75 0.0125 £ 2,575 63.54
CANCER Palliative & EOL
£ 760 9.05 0.0119 £ 3,335 72.59
CHILDREN Obesity 1:1 £ 140 1.22 0.0087 £ 3,475 73.81
CHILDREN Primary prevention
£ 600 4.61 0.0077 £ 4,075 78.42
CHILDREN Access to dental £ 480 3.24 0.0068 £ 4,555 81.66
CANCER Active Treatment
£ 50 0.31 0.0062 £ 4,605 81.97
CVD Stroke emergency
£ 600 3.37 0.0056 £ 5,205 85.34
CVD CHD acute £ 300 0.78 0.0026 £ 5,505 86.12

16
0
10
20
30
40
50
60
70
80
90
100
£0 £1,000 £2,000 £3,000 £4,000 £5,000 £6,000
cumulative spend (in £000)
cum
ula
tive
ben
efit
s
budg
et c
onst
rain
t
Figure 3 The efficient frontier of triangles ranked by value-for-money
Three weeks after the Decision Conference, participants received a copy of the report for
consultation. The report summarised the approach, documented each step of the process, and the
results of the base models and of sensitivity analyses. The executive directors and commissioning
leads discussed the results and proposed an operational plan based on the analysis to the IoW
NHS Board for approval. The proposal followed the VfM ranking of Table 2 and Figure 3 with
the exception of End of Life care for which separate funding was provided in addition to the
planned £1m.
The IoW NHS Board received the results of the analysis favourably and approved the proposed
operational plan. The Board found the efficient frontier (Figure 3) particularly insightful (JS
attended the meeting). It enabled them to visualise the expected efficiency gain of about 25%
compared to the alternative ranking and to articulate a clear rationale for the proposed list of
interventions based on the principles of opportunity cost. In the end, the PCT Board approved an
operational plan to fund the interventions with the highest Value-for-Money as resulting from the
analysis, with the exception of the End of Life proposal which was funded irrespective of the
analysis.

17
The following year, 2009, the PCT hired a private consultancy firm of trained decision analysts
able to replicate the approach and participants from the previous year confirmed their willingness
to engage in the workshops, which were extended to more people. Thus the approach which we
introduced was seen as adding value, and had momentum. However, following the structural
reforms announced by the coalition government in 2010, the Primary Care Trust tier of the NHS
is to be abolished. At the time of writing it is unclear where healthcare planning will sit in the
English system and what form it will take.
4. Discussion
Accessibility
The approach was relatively accessible to the Strategic planning group. This is not surprising
because they had been continuously and actively engaged in designing the framework and the
elicitation frameworks used were based on their conscious and deliberate choice. For instance, in
the design of a scoring procedure the group first considered the use of “fixed scales” to provide a
qualitative description of different levels on the scale of each criterion (Bana e Costa & Beinat,
2005), but the Strategic planning group considered this too laborious to develop and too difficult
for invited participants to understand. The group proposed to use a simple scoring tool of ‘High-
Medium- or Low- impact’ which was not ultimately used because it might not have been
sufficient to discriminate among alternatives and it would have been difficult to ensure
consistency in scoring alternatives which fell on the border of two categories. Further, in
preparation for the prioritisation event with stakeholders of the six commissioning areas the
Strategic planning group pilot-tested the proposed scoring tools in a mock Decision Conference
for a sample of interventions. The pilot proved useful to test the accessibility of the visual aids,
and to improve the definition of feasibility in terms of ‘probability of success’ to replace the
original definition in terms of ‘ease of implementation’, a concept which proved unhelpful
whenever participants held different views because each participant seemed to hold a different
perception of ‘ease’.
The use of the decision analytic principles with the development of simple visual aids for each
step of the process proved invaluable in the deliberative process with the invited stakeholders, and
18
participants particularly praised the quality of the discussion the framework enabled before,
during and after the event. Before the event, the framework defined specific questions and
focused the data extraction. During the event, the use of rectangles to visualise the population
health gain helped clinicians and patients to share their knowledge or to articulate their expert
opinion on the impact for the individual patient; and it enabled participants to advise
commissioning leads more clearly on the details of the implementation to achieve a larger number
of beneficiaries, the associated costs, and to document the agreed changes. This was particularly
evident for interventions in primary prevention, for which hard evidence was not available and
local characteristics of the health economy are particularly critical: it enabled participants to
volunteer estimates and for these to be challenged by others.
Similarly, the triangles of Value-for-Money and their aggregation in an efficient frontier enabled
participants to engage in a discussion on the opportunity cost of alternative budget allocations
both during and after the event. In particular, participants tested the impact of alternative scores
and weights on the efficiency frontier as well as the opportunity cost of financing an alternative
with relatively low VfM, by exploring what options would have to be given up if that alternative
were to be funded.
At the merge meeting it became evident, however, that our definition of health inequalities was
not as accessible as we would have liked. In particular, if health inequalities are measured in
terms of the health gap between different groups in the population measured for instance in terms
of quality-adjusted life expectancy at birth, one would expect that the higher the number of
health-poor people affected the higher the impact on health inequalities. Participants, however,
did not consider the number of people affected by the intervention unless prompted by the
facilitators and the rationales used to defend their health inequality score usually reflected their
personal view of the extent of “health-poverty” of a typical beneficiary or his/her deservingness
of better health. The development of a more intuitive and theory-based approach to modelling
health inequality is the focus of ongoing research (Morton & Airoldi, 2010).
Acceptability
With the exception of one member, members of the Strategic planning group found the approach
acceptable in terms of the included criteria, their definition, their operationalisation, and the

19
method to translate values into a priority order and the evaluation of palliative and end of life
treatments.
The objecting member of the Strategic planning group raised a general concern with the use of
“an approach which aims at getting the greatest good for the greatest number”. This was clearly a
rejection of the utilitarian principle embedded in the ‘a QALY is a QALY is a QALY’ principle
commonly applied in health economics. At the core of the objection was a legalistic and
pragmatic perspective and she contended that it would have been difficult to defend hard choices
based on the utilitarian principle in front of the public or the courts. The majority of the Strategic
planning group, however, thought that the utilitarian principle was acceptable and would have
been useful to identify the hard trade-off involved in funding decisions; they agreed to aggregate
health gains across people additively in the analysis and to discuss the political feasibility of the
recommended set of interventions to be funded at the end of the process.
For the specific assessment of palliative and end of life interventions the executive directors and
commissioning leads judged the approach unacceptable and decided to ignore the results for these
treatments. They felt that the value of these interventions is to provide ‘a good death’ and this
could not be captured by the criteria used in the approach. They were not able to articulate a
general, acceptable definition of ‘good death’ as different patients and their families may have
very different needs at this difficult time of their life and ‘a good death’ may have more to do
with allowing them time to understand these needs and respecting their wishes than with a
specific healthcare intervention (Sandman, 2005).
The difficulty of using a common tool to assess curative and palliative interventions is not unique
to this case study, as demonstrated by the debate about the appropriate cost-effectiveness
threshold within the cost per QALY approach for end of life treatments, in which some authors
advocate for the appropriateness of a higher cost per QALY threshold (Mason, Jones-Lee, &
Donaldson, 2009; Towse, 2009). The recent report on End of Life issued by the National Audit
Office in the UK, which assess the Value-for-Money of public services, has also sidestepped the
issue of attaching a value to treatment and focused its analysis on costs (National Audit Office,
2008).
The assessment of preventative and potentially life-saving interventions posed a similar
challenge, with participants invoking the ‘rule of rescue’ principle – the moral imperative to

20
rescue identified people in immediate peril regardless of the costs – to express their difficulty in
comparing the relative health benefits across these interventions. The executive directors decided
to exclude ‘rule of rescue’ considerations in the formal analysis in order to be able to quantify and
to face the hard trade-offs between investing in prevention compared to treatment. They
recognised that the choice between prevention and potential cure is an intrinsically difficult value
judgment but also highlighted the value of visualising the opportunity cost of providing additional
treatment to inform their decisions. Their difficulty is consistent with the current absence of any
clear, agreed operationalisation of the rule of rescue principles (Cookson, McCabe, & Tsuchiya,
2008). Despite the dismissal of ‘rule of rescue’ considerations, however, the analysis identified
most preventative interventions as poor Value for Money because they were usually also
associated with a relatively low probability of success (which reduced their expected value).
Most clinicians and patients appreciated the logic of the approach but were somewhat
uncomfortable with the use of subjective estimates to assess interventions. For instance, clinicians
played a crucial role to assess the health benefit to the average patient. They volunteered their
estimates based on their knowledge of the literature and their professional expertise and found the
process acceptable to stimulate a discussion but frequently called for a more systematic use of the
evidence to validate their judgments. In particular, they found it difficult to assess the relative
health gain from different interventions for the ‘average’ beneficiaries as they felt that in their
professional experience “there is no such thing as an ‘average’ patient” and their professional
ethos demanded “to do the best [they] could possibly do for each individual patient”.
Similarly, one of the patient representatives highlighted that he enjoyed the event and that the
process was “an advance on just sitting around a table and talking it through”, but that he was
uneasy about the subjectivity of the estimates. He was not convinced that extensive sensitivity
analyses could replace objective evidence and invited the PCT to collect more objective
epidemiological and clinical evidence, and to use it to put into perspective the anecdotal evidence
that the public is most likely to draw upon.
The executive directors recognised that several estimates were based on expert judgments brought
to bear on the day and discussed their confidence in the model results. They concluded that the
model was a fair representation of the evidence available on the day, the knowledge shared by
those who participated in the event but appreciated that a different group of participants and the
collection of more evidence might have led to different results. This naturally raised questions

21
which were dealt with extensive sensitivity analysis on scores and weights to assess in particular
the robustness of the model to different assumption on the effectiveness (numbers who benefits
and benefit per person) of preventative interventions. The model proved robust to extreme
changes in scores and weights, which increased the confidence of the executive team to base the
recommendations for funding on the results of the model.
5. Conclusions
This paper describes a socio-technical approach to bring together those responsible for allocating
resources to healthcare intervention on behalf of a local population with different sources of
expert knowledge to inform their decision. It presents a framework for prioritisation, comprising a
value model, a communication procedure and an interactive elicitation method to enable
participants in articulating their views, communicating and sharing their expertise and
formulating their value judgments through a weighting a scoring procedure supported by simple
visual aids. The interactive engagement with those responsible to recommend a plan for resource
allocation in designing the approach contributed to its accessibility and acceptability. The results
of the work had a material and demonstrable influence on spending decisions by the PCT.
The framework that we present draws explicitly on health economics. As such it provides a
framework within which evidence from public health and demographic surveys, health economic
studies and RCTs, and local administrative and accounting systems can be synthesised with the
judgement of the people who know the system best, and structured to be directly relevant to
management decisions. We believe our success in facilitating clear, value-driven and evidence-
based discussions are attributable to the intellectual robustness of the underpinning health
economic theory, and indeed, where our methods were less informed by health economics – as in
the modelling of inequality, and the health benefit/ inequality tradeoff – we were less successful
in facilitating such discussions.
This notwithstanding, the approach we present is genuinely a sociotechnical one, which aims to
enable discussion and reflection rather than prescribe choice. Hence, in areas where health
economics theory has less purchase as a normative theory– in particular in the valuation of End of
Life care – decision makers set aside the priorities as assessed by the model and, for explicit and
legitimate reasons, made their decisions on the basis of other concerns. This is of course as it

22
should be, for in an arena where values are as contested as healthcare, the highest aspiration for
analysis can only be to provide a basis for thoughtful and informed moral choices.
References
Airoldi, M., & Morton, A. (2009). Adjusting Life for Quality or Disability: stylistic difference or substantial dispute? Health Economics, 18, 1237-1247.
Bana e Costa, C. A., & Beinat, E. (2005). Model-structuring in public decision-aiding. LSE Operational Research working paper series. London.
Birch, S., & Gafni, A. (2006). The biggest bang for the buck or bigger bucks for the bang: the fallacy of the cost-effectiveness threshold. Journal of Health Services Research and Policy, 11(1), 46-51.
Bryan, S., Williams, I., & McIver, S. (2007). Seeing the NICE side of cost-effectiveness analysis: a qualitative investigation of the use of CEA in NICE technology appraisals. Health Economics, 16, 179-193.
Cookson, R., McCabe, C., & Tsuchiya, A. (2008). Public healthcare resource allocation and the Rule of Rescue. J Med Ethics, 34, 540-544.
Department of Health. (2008). Resource allocation: weighted capitation formula - sixth edition. In Resource Allocation Team (Ed.). London: Department of Health.
Drummond, K. F., Sculpher, M. J., Torrance, G. W., O' Brien, B. J., & Stoddart, G. L. (2005). Methods for the Economic Evaluation of Health Care Programmes. Oxford: OUP.
Eddama, O., & Coast, J. (2008). A systematic review of the use of economic evaluation in local decision-making. Health Policy, 86, 129-141.
Eden, C., & Huxham, C. (1996). Action Research for the study of organisations. In S. Clegg, C. Hardy & W. Nord (Eds.), Handbook of Organization Studies. Beverley Hills: Sage.
Gafni, A., & Birch, S. (2006). Incremental cost-effectiveness ratios (ICERs): The silence of the lambda. Social Science & Medicine, 62(9), 2091-2100.
Gold, M. R., Siegel, J. E., Russell, L. B., & Weinstein, M. C. (Eds.) (1996). Cost-effectiveness in health and medicine. Oxford: OUP.
Goodwin, P., & Wright, G. (2004). Chapter 13 Resource allocation and negotiation problems. Decision Analysis for management judgment pp. 329-354). Chichester: John Wiley & Son.
Keeney, R. L., & Raiffa, H. (1976). Decisions with Multiple Objectives. Preferences and Value Tradeoffs. Cambridge: Cambridge University Press.
Keeney, R. L., & Winkler, R. L. (1985). Evaluating decision strategies for equity of public risks. Operations Research, 33(5), 955-970.
23
Klein, R. (2006). The new politics of the NHS. Oxford: Radcliffe publishing.
Madden, L., Hussey, R., Mooney, G., & Church, E. (1995). Public health and economics in tandem: programme budgeting, marginal analysis and priority setting in practice. Health Policy, 33, 161-168.
Mason, H., Jones-Lee, M., & Donaldson, C. (2009). Modelling the monetary value of a QALY: a new approach based on UK data. Health Economics, 18, 933-950.
Mitton, C., & Donaldson, C. (2001). Twenty-five years of programme budgeting and marginal analysis in the health sector, 1974-1999. Journal of Health Services Research and Policy, 6(4), 239-248.
Mitton, C., & Donaldson, C. (2004). Health care priority setting: principles, practice and challenges. Cost Effectiveness and Resource Allocation, 2(3).
Mitton, C., Patten, S., Waldner, H., & Donaldson, C. (2003). Priority setting in health authorities: a novel approach to a historical activity. Social Science & Medicine, 57, 1653-1663.
Mooney, G. (1978). Planning for balance of care of the elderly. Scottish Journal of Political Economy, 25(2), 149-164.
Morton, A., & Airoldi, M. (2010). Incorporating health inequalities considerations in PCT priority setting (LSEOR10.122). LSEOR Working Paper Series. London: LSE.
National Audit Office. (2008). End of Life Care. London: National Audit Office.
Parkin, D., & Devlin, N. (2006). Is there a case for using visual analogue scale valuations in cost-utility analysis? Health Economics, 15, 653-664.
Peacock, S. J., Mitton, C., Ruta, D., Donaldson, C., Bate, A., & Hedden, L. (2010). Priority setting in healthcare: towards guidelines for the program budgeting and marginal analysis framework. Expert Review of Pharmacoeconomics & Outcomes Research, 10(5), 539-552.
Peacock, S. J., Richardson, J. R. J., Carter, R., & Edwards, D. (2007). Priority setting in health care using multi-attribute utility theory and programme budgeting and marginal analysis (PBMA). Social Science and Medicine, 64(4), 897-910.
Phillips, L. D. (1984). A theory of requisite decision models. Acta Psychologica, 56, 29-48.
Phillips, L. D. (2007). Decision Conferencing. In W. Edwards, R. F. Miles & D. Von Winterfeldt (Eds.), Advances in decision analysis: from foundations to applications. Cambridge: CUP.
Phillips, L. D., & Bana e Costa, C. (2007). Transparent prioritisation, budgeting and resource allocation with multi-criteria decision analysis and decision conferencing. Annals of Operations Research, 154(1), 51-68.
Raiffa, H. (1968). Decision analysis: Introductory lectures on choices under uncertainty. Reading, MA: Addison-Wesley.
Salo, A., Keisler, J., & Morton, A. (Eds.) (2011). Portfolio Decision Analysis: methods for improved resource allocation. New York: Springer.
24
Sandman, L. (2005). A good death. On the value of death and dying. Maidenhead: Open University Press.
Tan-Torres Edejer, T., Baltussen, R., Adam, T., Hutubessy, R., Acharya, A., Evans, D. B., et al. (Eds.) (2003). WHO guide to cost-effectiveness analysis. Geneva: World Health Organisation.
Towse, A. (2009). Should NICE's threshold range for cost per QALY be raised? Yes. BMJ, 338(31 January 2009), 268.
Trist, E. L. (1981). The evolution of socio-technical systems: a conceptual framework and an action research program. Toronto: Ontario Ministry of Labour, Ontario Quality of Working Life Centre.
von Winterfeldt, D., & Edwards, W. (1986). Decision analysis and behavioral research. Cambridge: Cambridge University Press.
Williams, A. (1985). Economics of coronary artery bypass grafting. British Medical Journal, 291, 326-329.
Williams, I., & Bryan, S. (2007). Understanding the limited impact of econonomic evaluation in health care resource allocation: a conceptual framework. Health Policy, 80, 135-143.
Yin, R. K. (2009). Case study research: design and methods. Los Angeles: Sage.


