
WP 340 - Mini Thomas - isec.ac.in 340 - Mini Thomas - Final.pdf · framework, consumption includes...
23
Relationship Between Services Trade, Economic Growth and External Stabilisation in India: An Empirical Investigation Mini Thomas P
-
Upload
truongdiep -
Category
Documents
-
view
219 -
download
0
Transcript of WP 340 - Mini Thomas - isec.ac.in 340 - Mini Thomas - Final.pdf · framework, consumption includes...

Relationship BetweenServices Trade, EconomicGrowth and ExternalStabilisation in India: AnEmpirical Investigation
Mini Thomas P

ISBN 978-81-7791-196-1
© 2015, Copyright ReservedThe Institute for Social and Economic Change,Bangalore
Institute for Social and Economic Change (ISEC) is engaged in interdisciplinary researchin analytical and applied areas of the social sciences, encompassing diverse aspects ofdevelopment. ISEC works with central, state and local governments as well as internationalagencies by undertaking systematic studies of resource potential, identifying factorsinfluencing growth and examining measures for reducing poverty. The thrust areas ofresearch include state and local economic policies, issues relating to sociological anddemographic transition, environmental issues and fiscal, administrative and politicaldecentralization and governance. It pursues fruitful contacts with other institutions andscholars devoted to social science research through collaborative research programmes,seminars, etc.
The Working Paper Series provides an opportunity for ISEC faculty, visiting fellows andPhD scholars to discuss their ideas and research work before publication and to getfeedback from their peer group. Papers selected for publication in the series presentempirical analyses and generally deal with wider issues of public policy at a sectoral,regional or national level. These working papers undergo review but typically do notpresent final research results, and constitute works in progress.

RELATIONSHIP BETWEEN SERVICES TRADE, ECONOMIC GROWTH AND
EXTERNAL STABILISATION IN INDIA: AN EMPIRICAL INVESTIGATION1
Mini Thomas P*
Abstract The economic reforms initiated in India after the emergence of the balance of payments crisis in 1990-91 resulted in the Government of India reversing its policy stand of import substitution, followed since independence. A policy of export-oriented growth was adopted, following the footsteps of East Asian countries. India’s international trade in services benefited immensely from this change in policy stance, and received a further boost when India became a signatory to the WTO in 1995. In spite of this, India’s external sector has come under growing pressure from a burgeoning Current Account Deficit, in the aftermath of the global economic recession of 2008-09. In such a scenario, this paper attempts to study the inter-relationships between services trade, economic growth and external stabilisation for the Indian economy, during the post-reform period. The contribution of international trade in non-factor services and other invisibles towards India’s economic growth and current account stabilisation is examined descriptively. The relationship between the three macroeconomic variables is estimated using the ARDL approach to co-integration, for the time-span from 1996-97:Q1 to 2011-12:Q4. The study finds the existence of co-integrated relationship between Current Account Balance, GDP and services trade, for the Indian economy. The study also finds empirical evidence indicating that workers’ remittances are more crisis prone compared to net services exports, in case of Indian economy. Key words: Services Trade, Current Account Deficit, Economic Growth, ARDL approach JEL Classification Code: F14, F32, F43
Introduction International trade in services started expanding rapidly in the last decades of twentieth century,
growing much faster than both world output and world merchandise trade. Global trade in services
increased from USD1798.9 billion in 1991 to USD8699.8 billion by 2012 (UNCTAD 2013). International
trade in services gained importance in policy-circles after the General Agreement on Trade in Services
(GATS) came into being in 1995. Developing countries now account for one-fourth of the world trade in
services. In spite of a rising contribution to services trade by developing countries, developed countries
accounted for 67 per cent of world services exports and 59 per cent of world services imports in 2012
(UNCTAD 2013). Services trade is characterised by import of factors and brings along technology, which
is a source of endogenous growth. New economy services, i.e., services that are increasingly tradable
internationally on account of advances in ICT and raise productivity growth, have emerged as a
powerful force contributing to economic growth and external stabilisation of many countries in recent
years.
* PhD Scholar at Centre for Economic Studies and Policy, Institute for Social and Economic Change (ISEC),
Bangalore, India. Email: [email protected]
1 This paper is based on the author’s ongoing doctoral dissertation, under UGC-Junior Research Fellowship Scheme, at Institute for Social and Economic Change. The author is very grateful to her PhD supervisor, Prof M R Narayana, for his valuable comments and suggestions on an earlier version of this paper. Thanks are also due to Ms B P Vani and an anonymous referee for their comments. However, the usual disclaimers apply.
2
The emergence of service sector-led growth in India is in consonance with the growing
importance of services trade worldwide. The economic reforms initiated in India after the emergence of
the balance of payments (BoP) crisis in 1990-91resulted in the Government of India reversing its policy
stand of import substitution, followed since independence. A policy of export-oriented growth was
adopted, following the footsteps of East Asian countries. India’s international trade in services benefited
immensely from this change in policy stance, and received a further boost when India became a
signatory to the WTO in 1995. As per GOI (2012), the share of services in India’s total GDP at factor
cost rose from 43 per cent in 1990-91 to 59 per cent in 2011-12. The service sector’s annual GDP
growth rate has been higher than the country’s overall GDP since 1997-98. Services exports have been
growing at a pace even faster than services GDP in the post-reform period, reflecting the export-
oriented nature of India’s service sector growth. India’s share in global services exports stood at 3.2 per
cent in 2012, whereas its share in global merchandise exports was only 1.6 per cent in the same year
(WTO 2013).
Services exports also have the potential to bring about external stabilisation for the Indian
economy. Since the advent of the global economic recession in 2008-09, India’s external sector has
been under growing pressure from the widening current account deficit (CAD). The CAD in 2011-12 was
4.2 per cent of GDP, historically the highest (even higher than the CAD of 3 per cent of GDP during the
peak of the 1991 BoP crisis). The current account balance, which averaged nil over the Tenth Plan
period, deteriorated during the Eleventh Plan to an average CAD of 2.4 per cent. The Approach Paper to
the Twelfth Five-year Plan (GOI 2011, 21) has stated that for prudent management of the external
account, it is desirable to restrict the CAD to an average below 2.5 per cent of India’s GDP over the plan
period. This is the CAD that would be commensurate with the 12th Plan growth target of 9-9.5 per cent.
Excessive CAD tends to make an economy vulnerable to external debt and currency crisis, and brings
along financial instability, substantial output and welfare losses. An RBI study (R Goyal 2012, 1) has
concluded that a CAD between 2.4-2.8 per cent of GDP is sustainable over the medium term, under the
assumptions that GDP growth ranges between 6-8 per cent, inflation hovers around the 5 per cent
level, and interest rate and size of capital flows broadly follow their trends in the recent past.
There are three different perspectives on current account balance: a domestic perspective
based on national income and product accounts; an international perspective based on trade flows in
goods and services; and another international perspective based on flows and holdings of financial
assets. Each perspective involves a decision to focus on certain variables or economic relationships and
to de-emphasise or ignore other variables and relationships (Mann 2002, 134). This study will focus on
the second perspective, based on international trade flows in goods and services. It has also been noted
that the CAD in the Indian economy is influenced more by external factors such as oil supply shocks or
the sudden collapse of export markets rather than domestic saving and investment rates (A Goyal
2012). Given this background, this paper attempts to examine the relationship between services trade,
economic growth and external stabilisation for the Indian economy.
3
Review of Literature Services have not figured prominently in economic growth theory, and have only recently been
highlighted in international trade theory. However, the relationship between international trade and
economic growth has been extensively studied in the literature. Proponents of the export-led growth
hypothesis (Beckerman 1965; Balassa 1978; Feder 1982) have argued that export growth leads to an
expansion in production via the foreign trade multiplier, economies of scale and technological
innovation. A few others (Vernon 1966; Krugman 1984; Bhagwati 1988) have focussed on the reverse
causality channel, wherein increase in skilled labour and technology in the domestic economy stimulates
productivity gains, which give rise to comparative advantage in certain sectors, and eventually export
expansion. Endogenous growth models emphasised imports as an important channel for long-run
economic growth, by providing domestic firms with access to foreign technology and R&D knowledge
(Grossman and Helpman 1991; Lee 1995). Oulton (2001) proved that international trade in services
increases overall growth, because greater outsourcing of services by productive firms in non-stagnant
sectors entails a reallocation of factors, which increases overall output and aggregate productivity.
Pradhan (2010) examined the export-led growth hypothesis for the Indian economy. The time-
frame of his study was from 1970-71 to 2009-10, and covered exports of both goods and services.
Using the Engle-Granger approach to co-integration and the vector error correction model (VECM), he
found that about 14 per cent of disequilibrium is corrected every year in the case of “exports of goods
and services” and GDP. He also found that the direction of causality was from export growth to GDP
growth. He did not find any empirical evidence suggesting a reverse causation. Dash and Parida (2012)
examined the role of services exports and services imports in India’s economic growth, using a bound-
testing approach to an auto-regressive distributed lag (ARDL) model and VECM. Using quarterly data
from 1996-97 to 2010-11, they found the existence of a long-run equilibrium relationship between GDP,
services exports, services imports and the real effective exchange rate (REER) for the Indian economy.
The direction of short-run causality was found to be present only from services exports to GDP, and not
vice-versa.
The relationship between the current account balance (CAB) and economic growth has been
examined in international theoretical and empirical studies. Brissimis et al (2010) postulated that a small
open economy that starts from a relatively low domestic income is expected to have low savings, as
optimal consumption levels are high relative to current income. This implies increased external
borrowing against future income, which coupled with substantial initial investment needs, would
translate into a larger current account deficit at an early stage of development. As the economy catches
up and a higher level of development is achieved, external financing needs tend to moderate. Hence,
relative real GDP per capita is expected to be positively related to the current account balance.
According to Obstfeld and Rogoff (2007), economies that are in the early stages of economic
development have a greater need for investment and are likely to finance investment through external
borrowing. As they develop and approach the income levels of advanced economies, their CAB should
improve. Among countries at a similar initial stage of development, the stronger a country’s economic
growth is relative to its trading partners; the lower the current account is likely to be. Hence,
theoretically, causality is found to run from economic growth to CAB. Estimating cross-country

4
regressions for the time-span from 1974-2004, Edwards (2007) found that a decline in GDP growth of 1
percentage point relative to the long-term trend resulted in an improvement in the CAB – higher surplus
or lower deficit – of one quarter of a percentage point of GDP. Sekmen and Calisir (2011) examined the
trade-off between CAD and economic growth for Turkey for the period from 1998 to 2009. Using VECM
and ARDL models, they found the existence of a positive relationship between economic growth and
CAD in the short-run. However, there have been no Indian empirical studies analysing this relationship.
Mann (2004) proposed two channels through which rise in new economy services would
impact the trajectory of the US current account. First, increased trade in new economy services has
improved the income-elasticity asymmetry of US trade. Second, integration of new economy services in
the domestic economies of US’s trading partners will raise economic growth there. After estimating new
income elasticities for US exports and imports of “new economy services” and incorporating it into a
simple model of the US current account, she concluded that reasonable estimates of the above two
structural changes are not sufficient to stabilise the US current account deficit, partly because the share
of new economy services in US trade is still small.
However, these two changes were found to help slow the further widening of the US CAD.
Rath and Rajesh (2006) studied the trend in India’s services exports and CAD for the post-reform
period, using descriptive statistics and growth rates. The period of their study was from 1990-91 to
2005-06. They found that the rising surplus in net services exports have been significantly responsible
for lower CAD in the Indian economy since the early nineties. Ghose (2013) argued that there are two
choices before the Indian government in dealing with the widening CAD, namely, attracting foreign
investment or imposing curbs on merchandise imports. According to him, attracting foreign investment
is a greater evil because it implicitly makes the judgement that the risk of economic collapse tomorrow
is preferred to the risk of higher inflation and lower growth today.
Dhar and Rao (2014) examined the causes behind the sharp deterioration of India’s CAD to
5% of GDP in recent years. They found that surge in imports (mainly crude oil and gold imports), and
indifferent manufacturing export performance, contributed to India’s merchandise trade deficit of 11%
of GDP in 2012-13. Secondly, India couldn’t penetrate much into the markets of partner countries, with
whom economic partnership agreements were signed. It was found that India’s imports from partner
countries grew at twice the rate of India’s exports to partner countries, since mid-2000s. Thirdly,
investment income outflows in India’s invisibles account, especially royalty payments and remittances
for maintenance of offices abroad, increased rapidly since 2010-11, all of which contributed to India’s
ballooning CAD.
Methodology As per IMF’s balance of payments framework, the current account balance is defined as the sum of net
exports of goods and services, (net of) primary income and (net of) secondary income. The sum of
“investment income” and “compensation of employees” is referred to as primary income. The sum of
“private transfers” and “official transfers” is referred to as secondary income. Primary income,
secondary income and trade in non-factor services are categorised as “invisibles” in this framework.
External stabilisation is being defined as “current account stabilisation” in this study. India’s

5
international trade in services is measured in terms of “net exports of non-factor services”. India’s
economic growth is measured in terms of gross domestic product at market prices. The Reserve Bank of
India’s (RBI) definition of the service sector, inclusive of “construction activities”, is adopted for this
study.
An in-depth analysis of the contribution of services trade and other invisibles towards India’s
economic growth and external stabilisation is initially carried out, with the help of growth rates and
percentage shares. The contribution of net services exports and private transfers in bringing down
India’s CAD is compared, to identify which of these invisibles have played a bigger role in India’s
external stabilisation. Balance of payments data published in “Handbook of Statistics on Indian Economy
(HBSIE) 2011-12” of RBI, is the main data source for this study. The accounting relationship between
services trade and economic growth for the Indian economy is analysed, using the national income
accounting framework. The time span for this descriptive analysis is the post-reform period, from 1990-
91 to 2011-12. A decomposition analysis of the contribution of other invisibles towards the growth in
India’s national disposable income is also carried out, with the help of the methodology utilised by
Jalava and Pohjola (2002). Data published in National Account Statistics (base year: 2004-05) of Central
Statistical Organisation is used for the empirical analysis based on national income accounting
framework.
Afterwards, time-series analysis is carried out to examine the nature of the relationship
between net services exports, economic growth and current account balance during the post-reform
period. Quarterly data on all three variables, from 1996-97:Q1 to 2011-12:Q4, at current prices, is
compiled from HBSIE 2011-12, published by RBI. The year 1996-97 is chosen as the starting point for
the time series analysis, since quarterly data on India’s GDP is available only from that particular year.
Moreover, India’s services trade received a boost post-1995 once GATS became operational facilitated
by access to a growing overseas market. All three variables are initially tested for their stationary
properties, using unit-root tests. In this study, the bound testing approach to Auto-Regressive
Distributed Lag (ARDL) model developed by Pesaran et al (2001) is used to check for the presence of
co-integration. This approach is preferred because the direction of causality among the variables is
known beforehand. Moreover, the bound-testing approach can be used regardless of whether the time-
series is stationary or integrated to the first order or a mixture of both.
Empirical Results 1. Contribution of Services Trade and other invisibles towards India’s external
stabilisation
Invisibles is an important component of India’s balance of payments (bop), and has become crucial for
India’s external stabilisation in recent decades, as is evident from figure 1. Balance of invisibles is found
to be in surplus (except during the 1990-91 balance of payments crisis) throughout the study period,
although the magnitude of the invisibles balance witnessed a phenomenal increase only after the 1991
economic reforms.
In December 1990, India was at the brink of a foreign-exchange crisis, wherein foreign
exchange reserves had depleted to such a level that India could afford only three weeks of imports.

6
India’s Current Account Deficit stood at 2.96 % of GDP in 1990-91. The Reserve Bank of India had to
temporarily pledge gold to raise loans to tide over the bop crisis. India has come a long way ever-since,
on the external front, with the growing contribution of invisibles in bringing down India’s Current
Account Deficit. Invisibles greatly benefited from the economic reforms and opening up of the Indian
economy, post 1991. India’s balance of invisibles which was ` 42.59 billion in 1991-92, grew at a CAGR
of 25% over the next 20 years, and stood at ` 5362 billion in 2011-12. Current Account is defined to be
the sum of “merchandise trade balance” and “balance of invisibles” of a country. India even managed to
register a current account surplus during three years, 2001-02, 2002-03 and 2003-04, due to a
significant surplus in the Invisibles account. Invisibles account is found to be in surplus even during the
peak of the global economic recession in 2008-09. On the other hand, merchandise trade has
consistently been running on deficit throughout the study period. The balance on the current account is
being bogged down by the negative balance on the merchandise trade account, because of which India
always suffers from a current account deficit. The global economic meltdown of 2008 has adversely
affected India’s current account balance, resulting in CAD exceeding 2% of GDP in recent years.
Figure 2 reveals the growth pattern of different components of India’s invisibles. It is found
that the remarkable surplus witnessed in India’s balance of invisibles during the post-reform period can
be mostly attributed to workers’ remittances (net) and net non-factor services exports. Private transfers
more than doubled within a span of one year after the BoP crisis, from ` 37.12 billion in 1990-91 to `
93.82 billion in 1991-92. Private transfers have grown rapidly ever since, and stood at ` 3050 billion in
2011-12. India is currently the largest recipient of workers’ remittances world-wide. Although net
exports of non-factor services more than doubled from ` 12.05 billion in 1989-90 to ` 31.33 billion in
1991-92, it fell during the next five years. It started increasing again from 1997-98, after the benefits of
India becoming a signatory to the GATS of WTO started trickling down. Major growth spurt in India’s
international trade in non-factor services happened only in the last decade. Primary income (net) is
found to be in deficit throughout the study period, mainly due to the increasing outflows on account of
investment income. The magnitude of official transfers, another component of Invisibles account,
increased moderately since 1990-91, and peaked during 2001-2002, 2002-03 and 2003-04, when it
contributed to India’s current account surplus. The contribution of official transfers to the balance of
invisibles is found to be negligible since then.

7
Figure 1: India’s Current Account Dynamics during the Post-reform period
Source: Author’s compilation based on data from Handbook of Statistics on Indian Economy 2011-12,
RBI
Figure 2: Trend in Invisibles in India’s Current Account
Source: Author’s compilation based on data from Handbook of Statistics on Indian Economy 2011‐12, RBI
Figure 3 reveals the growth pattern of different components of India’s net non-factor services
exports during the post-reform period. Non-factor services, as per RBI classification, include travel,
transportation, insurance, g.n.i.e. (government not included elsewhere) and miscellaneous services. Net
exports of travel services is found to be the top contributor to India’s total net non-factor services
exports in the 1990s, up to 1997-98. However, it is clear from the figure that net exports of
miscellaneous services have emerged as the major contributor to India’s non-factor services export
basket since late 1990s. Net exports of miscellaneous services grew at a CAGR of 35% during the 14-
year period, from 1998-99 to 2011-12. Business services, finance and communications, which are
categorised as “miscellaneous services” in India’s balance of payments, are known as “new economy
-10000-8000-6000-4000-2000
02000400060008000
1989
-90
19
90-9
1
1991
-92
19
92-9
3
1993
-94
19
94-9
5
1995
-96
19
96-9
7
1997
-98
19
98-9
9
1999
-00
20
00-0
1
2001
-02
20
02-0
3
2003
-04
20
04-0
5
2005
-06
20
06-0
7
2007
-08
20
08-0
9
2009
-10
20
10-1
1
2011
-12
Rs.
(in b
illio
n)
YEAR
Merchandise Trade Deficit Balance of Invisibles Current Account Balance
-1000-500
0500
100015002000250030003500
1989
-90
19
90-9
1
1991
-92
19
92-9
3
1993
-94
19
94-9
5
1995
-96
19
96-9
7
1997
-98
19
98-9
9
1999
-00
20
00-0
1
2001
-02
20
02-0
3
2003
-04
20
04-0
5
2005
-06
20
06-0
7
2007
-08
20
08-0
9
2009
-10
20
10-1
1
2011
-12
Rs.
(in b
illio
n)
YEAR
non-factor services exports(net) primary income (net)private transfers (net) official transfers (net)

8
services” world-wide. The contribution of insurance and g.n.i.e services to India’s net exports of non-
factor services is found to be negligible, especially post 2000. Net receipts from trade in transportation
services are found to be even negative during most of the study period.
Figure 3: Trend in different components of India’s net exports of non-factor services
Source: Author’s compilation based on data from Handbook of Statistics on Indian Economy (HBSIE) 2011-12, RBI
It is well-established by now that Invisibles is the major contributor to India’s external
stabilisation during the post-reform period. However the policy-relevant question here is, whether
private transfers (net) or net services exports have played a bigger role in bringing down India’s Current
Account Deficit. External stabilisation is being measured in terms of current account deficit as a
percentage of India’s GDP at Market Prices, in this study.
Table 1 gives a comparative picture of the role of private transfers and net services exports in
India’s current account stabilisation. It is found that India’s current account deficit would have been of a
much bigger magnitude which would have proved unsustainable for the economy, in the absence of
these crucial components of India’s balance of payments. It is found that the contribution of private
transfers in bringing down India’s Current Account Deficit is higher than that of net services exports
during the 1990s and even during India’s balance of payments crisis in 1990-91. In the absence of
private transfers, the current account surplus that India registered during the years 2001-02, 2002-03
and 2003-04; would have turned into a current account deficit. However, the period since 2004-05 is
quite crucial, while analysing the contribution of net services exports towards India’s external
stabilisation.
The gap in magnitude between net service exports and private transfers started declining, post
2004-05. It is found that the contribution of private transfers and net services exports in bringing down
India’s Current Account Deficit is almost the same during the years, 2005-06 and 2006-07. However,
the magnitude of net services exports is found to be much higher than private transfers in 2008-09.
During the peak of the global economic recession in 2008-09, the contribution of net services exports
towards India’s current account stabilisation exceeded that of private transfers. In the absence of net
-5000
50010001500200025003000
1989
-90
19
90-9
1
1991
-92
19
92-9
3
1993
-94
19
94-9
5
1995
-96
19
96-9
7
1997
-98
19
98-9
9
1999
-00
20
00-0
1
2001
-02
20
02-0
3
2003
-04
20
04-0
5
2005
-06
20
06-0
7
2007
-08
20
08-0
9
2009
-10
20
10-1
1
2011
-12
Rs.
(in b
illio
n)
YEAR
travel transportation insurance gnie miscellaneous
9
services exports, India’s CAD would have been 6.7% of GDP in 2008-09, instead of the actual CAD of
2.3%. In the absence of net private transfers, India’s CAD would have been 5.9% of GDP in the same
year. Even in 2011-12, the magnitude and contribution of net services exports to India’s external
stabilisation exceeded that of private transfers. In the absence of any of these two crucial components
in the invisibles account, India’s CAD would have exceeded 7.5% of GDP in 2011-12, which would have
pushed the economy into another external crisis.
The interesting finding here is the contrasting behaviour of private transfers and net services
exports during the peak of India’s balance of payments crisis in 1990-91, and the global economic crisis
in 2008-09. Remittances to India were adversely affected during both these years. Remittances, which
registered an annual growth rate of 24.4 per cent in 2007-08, declined to 21.3 per cent in 2008-09, in
response to the global economic meltdown that year. It is also found that private transfers declined by
2.3 per cent in 1990-91 over the previous year. India’s international trade in services, on the other
hand, is found to be relatively resilient during the recent economic recession, which was also noted by
Borchert and Mattoo (2009). Net services exports registered an annual growth rate of 59 per cent in
2008-09, compared to 17.4 per cent in 2007-08. Most of it can be attributed to India’s net exports of
miscellaneous services in particular, which registered a spectacular growth in 2008-09 (refer Figure 3).
It is also found that net services exports grew by 46 per cent even in 1990-91 over the previous year.
Private transfers is thus found to be more crisis prone compared to net exports of non-factor services,
in the context of Indian economy.
In this context, it is also interesting to note the factors which drive growth in private transfers
and net exports and non-factor services. The literature broadly distinguishes between an altruistic
motive to remit earnings to the migrant’s native country (mostly for consumption by the family); and an
investment motive, wherein remittances are sent either to invest in the native country or to repay
previously borrowed funds. Gupta (2005) analysed the macro-economic determinants of workers’
remittances to India from 1991 to 2002. She found that the growth in remittances over time can be
explained by the increase in migration from India and total earnings of the migrants. Remittances were
also found to be determined by the economic activity in the source countries, and it was higher when
economic conditions abroad were benign. None of the remaining variables considered in her study,
including political uncertainty, interest rates, or exchange rate depreciation, were found to affect
remittances significantly. As per national income accounting identity, the difference between savings
and investment (S-I) of a country should equal its net exports of goods and services (X-M). There are a
wide range of factors which determine a country’s net exports of goods and services, namely, foreign
and domestic income, exchange rates, trade restrictions such as customs duties and tariffs, subsidies,
non-tariff barriers, tastes and cultural preferences, technology etc.

10
Table 1: Role of Private Transfers versus Net Services Exports in India’s External
Stabilisation
Year
Net Services
Exports
Private
transfers
(net)
Current
Account
Deficit
CAD without
net services
Exports
CAD without
private
transfers
(as percentage of GDP at Market Prices)
1989-90 0.2 0.8 -2.27 -2.5 -3.03
1990-91 0.3 0.6 -2.96 -3.3 -3.6
1991-92 0.5 1.4 -0.3 -0.8 -1.7
1995-96 -0.06 2.3 -1.6 -1.5 -3.9
2000-01 0.4 2.7 -0.5 -0.9 -3.2
2001-02 0.7 3.1 0.7 0.02 -2.4
2002-03 0.7 3.1 1.2 0.5 -1.9
2003-04 1.6 3.5 2.3 0.6 -1.2
2004-05 2.1 2.8 -0.4 -2.5 -3.2
2005-06 2.8 2.9 -1.2 -3.96 -4.1
2006-07 3.1 3.1 -1.03 -4.1 -4.2
2007-08 3.1 3.4 -1.3 -4.4 -4.6
2008-09 4.4 3.6 -2.3 -6.7 -5.9
2009-10 2.6 3.8 -2.8 -5.4 -6.6
2010-11 2.9 3.2 -2.7 -5.6 -5.9
2011-12 3.5 3.4 -4.2 -7.72 -7.69
Source: Author’s Calculations based on data from Handbook of Statistics on Indian Economy 2011-12,
RBI
2. Accounting relationship between services trade and economic growth
According to the expenditure approach to national income accounting, GDP at market prices of
any country is the sum of consumption, investment and net exports of goods and services. In this
framework, consumption includes both private final consumption expenditure and government final
consumption expenditure. Investment is measured in terms of Gross Capital Formation; as the sum of
gross fixed capital formation, change in stocks and valuables. Using this framework, the accounting
relationship between economic growth and services trade is being examined by separating out net
services exports from India’s total net exports of goods and services. Table 2 gives the percentage
share of different components of India’s GDP at Market Prices (base year: 2004-05) during the post-
reform period, from 1990-91 to 2011-12. For this analysis, annual data on relevant variables published
in National Account Statistics (base year: 2004-05), at current prices (in ` crore), is utilised. It is found
that the percentage share of net services exports in India’s GDP at market prices was less than 1 per
cent throughout the 1990s. However, the share of net services exports is found to be much better in
comparison with net merchandise exports, whose share in India’s GDP is found to be negative
throughout the post-reform period.

11
Merchandise trade deficit widened to a maximum of -10.01 per cent of GDP in 2011-12 due to
massive gold and oil imports, which resulted in India’s Current Account Deficit registering a historic high
of 4.2 percent of GDP in 2011-12. The share of net services exports averaged 1.41 per cent of India’s
GDP at Market Prices during the entire post-reform period, whereas the share of net merchandise
exports in India’s GDP averaged -3.49 per cent. The share of net services exports in India’s GDP
crossed 1 per cent in 2003-04 and has increased ever since, signifying the growing importance of
services trade in India’s economic growth during the past one decade. The share of net services exports
in India’s GDP reached a peak of 4.41 per cent in 2008-09, during the peak of the global economic
recession. This can be attributed to the spectacular growth witnessed in India’s net exports of
miscellaneous services in 2008-09, as already noted earlier. Although the share of net services exports
in India’s GDP declined in the following two years due to the slowdown in global demand, it recovered
again in 2011-12. This empirical analysis points to the potential for services trade to become an engine
of export-led growth for the Indian economy in the coming years.
Table 2: Percentage Share of Different Components in India’s GDP at Market Prices
Year Final Consumption Expenditure (PFCE+GFCE)
Gross Capital Formation
Merchandise (X-M)
Services (X-M)
1990-91 78.87 24.80 -1.68 0.30
1991-92 79.03 22.56 -0.46 0.46
1992-93 77.51 24.40 -1.08 0.35
1993-94 77.38 21.77 -0.17 0.19
1994-95 75.95 24.14 -0.48 0.18
1995-96 74.94 27.29 -1.10 -0.06
1996-97 75.96 22.70 -1.32 0.18
1997-98 75.57 24.52 -1.53 0.31
1998-99 77.33 23.22 -2.14 0.51
1999-00 78.09 26.75 -2.77 0.88
2000-01 77.17 24.75 -1.26 0.36
2001-02 77.69 24.79 -1.54 0.68
2002-03 75.94 25.83 -1.66 0.70
2003-04 73.87 27.48 -2.32 1.63
2004-05 70.08 32.45 -3.88 2.12
2005-06 69.16 34.28 -5.52 2.78
2006-07 67.99 35.87 -6.26 3.10
2007-08 67.25 38.03 -7.15 3.13
2008-09 68.64 35.53 -9.48 4.41
2009-10 69.36 36.41 -8.02 2.63
2010-11 68.29 37.56 -7.04 2.61
2011-12 68.87 35.92 -10.01 3.48
Average 73.86 28.68 -3.49 1.41 Source: Author’s calculations based on data from National Account Statistics, CSO
12
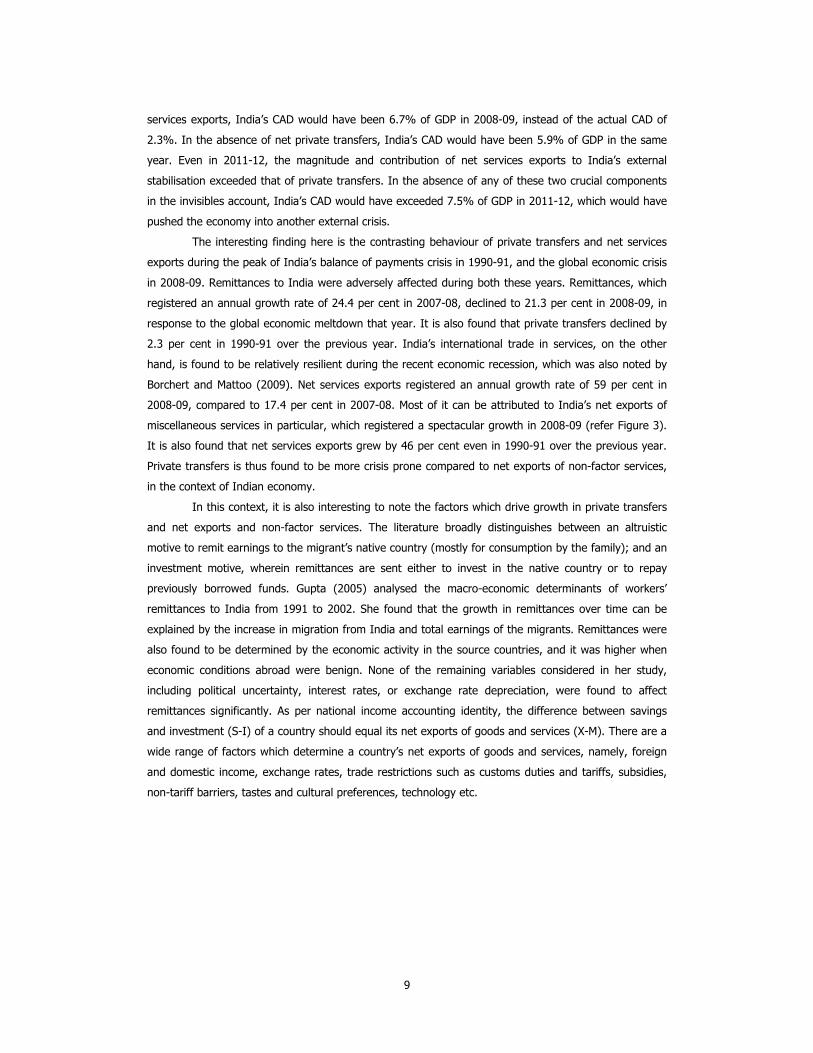
3. Decomposition of the contribution of other invisibles to growth in India’s national
disposable income
Studying the contribution of other invisibles (except net exports of non-factor services) towards
economic growth poses a methodological problem since GDP does not include remittances,
compensation of employees or investment income. However, as per to national income accounting
(NIA), net national disposable income (NNDI) is the sum of (i) net domestic product (NDP) at market
prices (ii) net factor income from abroad and (iii) other current transfers from rest of world (net). It
needs to be noted here that “net factor income from abroad” in NIA is the sum of “compensation of
employees (net)” and “investment income (net)” in the balance of payments. Similarly, “other current
transfers from rest of the world” in NIA is the same as private transfers/remittances in balance of
payments. Therefore, it is possible to quantify the contribution of these invisibles towards the growth in
India’s national disposable income. For this decomposition analysis, annual data on the relevant
variables published in National Account Statistics (base year: 2004-05), at current prices (in ` crore), is
utilised. Accordingly, the growth rate of India’s NNDI (Y^) is decomposed into the sum of (i) the share-
weighted growth rate of India’s NDP at market prices, w1Y1^ (ii) the share-weighted growth rate of net
factor income (NFI) from abroad, w2Y2^ and (iii) the share-weighted growth rate of other current
transfers (net) from rest of the world, w3Y3^. The weights w1, w2 and w3 in equation (1) give the
respective shares of the three components in India’s total NNDI.
Y^ = w1Y1^ + w2Y2
^ + w3Y3^ ………………………………… (1)
Where w1+w2+w3 = 1
Table 3: Decomposition Analysis of India’s National Disposable Income
Year
Share-weighted growth rate of NDP at Market Prices
(w1Y1^)
Share-weighted growth rate of
NFI from abroad (w2Y2
^)
Share-weighted
growth rate of
Remittances(net) from Rest of the
World (w3Y3
^)
Growth rate of
India's Net National
Disposable Income
(Y^)
Contribution of
Remittances to Growth in
NNDI (w3Y3
^/w1Y1^
+ w2Y2^+
w3Y3^)* 100
Contribution of NFI
from abroad to Growth in NNDI (w2Y2
^/ w1Y1
^ + w2Y2
^ + w3Y3
^)* 100 1991-92 14.03 -0.34 4.58 18.27 25.09 -1.84
1992-93 14.49 -0.16 0.59 14.93 3.95 -1.04
1993-94 15.04 -0.04 1.41 16.42 8.61 -0.23
1994-95 17.11 -0.08 1.62 18.64 8.68 -0.45
1995-96 16.87 -0.03 -0.39 16.45 -2.37 -0.19
1996-97 15.37 0.03 2.97 18.37 16.14 0.16
1997-98 10.44 -0.01 -0.01 10.42 -0.13 -0.09
1998-99 14.56 -0.13 -0.04 14.39 -0.25 -0.93
1999-00 11.20 -0.03 0.69 11.86 5.79 -0.26
2000-01 7.19 -0.47 0.32 7.04 4.56 -6.73
2001-02 7.74 0.12 0.74 8.60 8.63 1.36
2002-03 7.33 0.17 0.24 7.74 3.09 2.17
2003-04 12.03 -0.09 0.97 12.91 7.51 -0.72

13
2004-05 17.73 -0.23 -0.37 17.14 -2.15 -1.32
2005-06 13.66 -0.17 0.54 14.03 3.86 -1.19
2006-07 16.08 -0.27 0.72 16.53 4.35 -1.65
2007-08 15.84 0.38 0.73 16.95 4.32 2.26
2008-09 12.24 -0.61 0.64 12.28 5.21 -4.93
2009-10 14.21 -0.15 0.63 14.69 4.28 -1.03
2010-11 18.95 -1.08 -0.05 17.82 -0.26 -6.07
2011-12 16.67 0.03 0.78 17.48 4.46 0.15
Average 13.75 -0.15 0.82 14.4 5.4 -1.07 Source: Author’s calculations based on data from National Account Statistics, CSO
The average share of NDP at Market Prices in India’s NNDI is found to be w1 = 0.98; the
average share of “net factor income from abroad” in India’s NNDI is found to be w2 = -0.01; and the
average share of “other current transfers (net) from rest of the world” in India’s NNDI is found to be w3
= 0.03. The annual growth rates of these three components (Y1^, Y2
^, Y3^) are also computed.
Table 3 reports the results of the decomposition analysis. The growth rate of India’s Net
National Disposable Income is found to average 14.4 per cent during the study-period. It is found that
growth in remittances is the only component among “other invisibles” that has contributed to the
growth in country’s national disposable income during the post-reform period. The contribution of
remittances to growth in NNDI remained below 10 per cent during most of the years, except in 1991-92
and 1996-97. The impressive contribution of remittances to the extent of 25 per cent in 1991-92 can
mostly be attributed to the great surge in remittances after India’s 1990-91 balance of payment crisis.
The contribution of remittances to growth in NNDI averaged 5.4 per cent during the study period. The
contribution of net factor income from abroad (i.e., investment income + compensation of employees)
to growth in NNDI remained negligible and negative during most of the study-period, and exceeded 1
per cent during 2001-02, 2002-03 and 2007-08. The contribution of remittances to growth in NNDI also
turned negative during five years, over the time-span of this study. Most of the growth in NNDI during
the post-reform period can be attributed to the growth in Net Domestic Product at market prices.
4. Estimation of the Relationship between Services Trade, Economic Growth and Current
Account Balance for Indian Economy
The macroeconomic variables, current account balance (CAB), GDP at market prices (GDPMP),
and net services exports (NSX) are initially examined for their unit-root properties. The results of the
ADF test and KPSS test are reported in Tables A1 and A2, in the Appendix. All three variables are found
to be I (1), i.e., integrated of order 1. This implies that the data series is non-stationary at levels, and
becomes stationary only at first difference. From the literature review, economic growth and services
trade are found to influence the behaviour of the current account balance. Therefore, the bound-testing
approach to ARDL model is used to study the long-run relationship among these variables. One
significant advantage of this approach over other co-integration techniques is that different variables
can be assigned different lag-lengths in the ARDL model. The model is specified in the linear form since

14
it is not possible to derive the logarithmic form for CAB and net services exports (NSX), because these
variables take on both positive as well as negative values.
∆CABt = α + ∑ 1i ∆CAB t-i +∑ 2i ∆GDPMPt-i + ∑ 3i ∆NSXt-i + β4 CABt-1 +
β5 GDPMPt-1 + β6 NSXt-1 + ut ………………………………… (2)
The existence of a co-integrated relationship between the variables in the ARDL model
specificed in equation (2) is examined with the help of F or Wald test statistics. Wald test examines the
joint null hypothesis of zero co-integration between the variables (H0: β4=β5=β6=0), against the
alternate hypothesis of presence of co-integration. The calculated F-statistics is compared with two sets
of critical values computed by Pesaran et al (2001) for a given level of significance, in their bound
testing approach to the analysis of long-run relationships. If the computed F-statistic exceeds the upper
critical bound value, it implies that the null hypothesis of zero co-integration can be rejected. If the
computed F-statistic falls below the lower critical bounds value, it implies that the null hypothesis of
zero co-integration cannot be rejected. However, if the calculated F-statistic lies within the bounds, then
the test becomes inconclusive.
Table 4: Long-run Coefficients Estimated from ARDL (1,2,3) Model
Dependent Variable is CAB
Regressor Coefficient T-Ratio[Prob.]
GDPMP -0.08*** -2.94[.005]
NSX 0.27 .48[.636]
C 426.81*** 3.16[.003]
Source: Author’s calculations
***,**,* denotes statistical significance at the 1%, 5% and 10% level of significance, respectively.
Table A3 in the Appendix gives the estimation results of ARDL (1,2,3) model, chosen based on
Schwarz Bayesian Criterion (SBC). When the Wald test is performed for this model, the F statistic is
found to be 4.62 and is statistically significant. The Wald test results are given in Table A4 in the
Appendix. Assuming a model with unrestricted intercept and no trend, and with 2 regressors (k=2), the
lower and upper bound values of F-statistic from Pesaran et al (2001) are [3.17, 4.14] at the 10 per
cent level of significance, and [3.79, 4.85] at the 5 per cent level of significance. The computed F
statistic is found to exceed the critical upper bound value at the 10% significance level, and fall within
the bounds at the 5 % significance level. Hence, the null hypothesis of zero co-integration can be
rejected at the 10 per cent level of significance. This establishes the presence of a long-run equilibrium
relationship between current account balance, GDP and net services exports for the Indian economy,
during the post-reform period. Further, Table 4 gives long-run coefficients derived from the ARDL
(1,2,3) Model. The long-run coefficient for GDP (-0.08) is found to be negative and statistically
significant, implying that an increase in India’s GDP leads to a deterioration in CAB in the long-run. This

15
implies that India still has not reached the stage of a developed economy, wherein the needs of
economic growth do not take a toll on the country’s CAB. The long-run coefficient for net services
exports (0.27) is found to be positive but statistically insignificant. This is in consonance with the
findings of Mann (2004) for the US economy. It implies that an increase in net services exports leads to
an improvement in India’s CAB in the long run, although the impact is insignificant, which can be
attributed to the over-arching merchandise trade deficit of the Indian economy.
The Granger Representation Theorem states that if a set of variables are co-integrated, then
there exists a valid error correction representation of the data. Error Correction Representation of the
chosen ARDL (1,2,3) Model gives the short-run dynamics, and estimation results are reported in Table
5. The error correction term (ECT) = -0.53 is found to be negative and statistically significant at the 1
per cent level of significance, providing further econometric evidence of the presence of a co-integrated
relationship among the variables. In the short-run, an increase in GDP is found to improve India’s CAB,
after a time-lag of one quarter, as implied by the positive and statistically significant short-run
coefficient. Similarly, an increase in net Services Exports is found to improve India’s CAB, after a time-
lag of two quarters, as implied by the positive and statistically significant short-run coefficient. A key
assumption in the bound-testing methodology is that the errors of the estimated ARDL model must be
serially independent. Hence, regression diagnostic tests are performed on the estimated model and the
test results are reported in Table A5, in the Appendix. It is found that the estimated ARDL model neither
suffers from autocorrelation, heteroscedasticity, non-normality or specification error.
Table 5: Error Correction Representation for the ARDL(1,2,3) Model
Dependent variable is dCAB
Regressor Coefficient T-Ratio[Prob.]
dGDPMP .02 .73365[.466]
dGDPMP1 .11*** 3.9841[.000]
dNSX .18 .58876[.559]
dNSX1 -.25 -.73782[.464]
dNSX2 .57* 1.8350[.072]
dC 225.71*** 2.8581[.006]
ECT(-1) -.53*** -4.0990[.000]
Source: Author’s calculations
***,**,* denotes statistical significance at the 1 %,5% and 10% level of significance, respectively.
Conclusion and Implications The quantum, quality and financing of CAD have emerged as a major concern for Indian policy-makers
after the recent global recession, as they faced a gloomy macro-economic scenario of decelerating
growth, capital exit from stock markets and significant rupee depreciation. The IMF’s approach to

16
external stabilisation often involves a reduction in CAD by introducing painful structural adjustment
measures such as deep cuts in domestic investment, which is not a good recipe for economic growth.
Moreover, gold and oil imports, which largely account for India’s burgeoning CAD, are relatively inelastic
to income changes. In this context, this paper finds the existence of a long-run equilibrium relationship
between net services exports, GDP and current account balance in the Indian economy during the post-
reform period. This paper also finds empirical evidence indicating that private transfers are more crisis-
prone compared to net services exports, in case of Indian economy. Hence, this paper argues for a
bigger role for net services exports (rather than remittances), in bringing down India’s CAD. Moreover,
some of the remittances are likely to filter out of the economy via higher imports of goods and services.
Therefore, the net impact on the current account balance maybe much smaller than the actual flow of
remittances. However, the significant contribution of remittances to the growth in India’s national
disposable income is duly noted in this study. Although India is a significant player in the world market
for services, most of the international trade in services still takes place between developed countries.
Adopting policies that promote and diversify India’s services exports as well as export markets, and
raise India’s export competitiveness in the world services market is a much better recipe for India’s
external stabilisation.
References Balassa, Bela (1978). Exports and Economic Growth: Further Evidence. Journal of Development
Economics, 5 (2): 181-89.
Beckerman, Wilfred (1965). Demand, Exports and Growth. In W Beckerman and Associates (eds), The
Britain Economy in 1975. UK: Cambridge University Press. 44-72.
Bhagwati, Jagdish (1988). Protectionism. Cambridge: MIT Press.
Borchert, Ingo and Aaditya Mattoo (2009). The Crisis Resilience of Services Trade. Policy Research
Working Paper 4917. World Bank, Washington DC.
Brissimis, Sophocles N, George Hondroyiannis, Christos Papazoglou, Nicholas T. Tsaveas and Melina A
Vasardani (2010). Current Account Determinants and External Sustainability in Periods of
Structural Change. Working Paper Series 1243. European Central Bank, Frankfurt am Main.
Dash, Ranjan K and Purna C Parida (2012). Services Trade and Economic Growth in India: An Analysis
in the Post-reform Period. International Journal of Economics and Business Research, 4 (3):
326-45.
Dhar, Biswajit and K S Chalapathi Rao (2014). India’s Current Account Deficit: Causes and Cures.
Economic and Political Weekly, XLIX (21): 41-45.
Edwards, Sebastian (2007). On Current Account Surpluses and the Correction of Global Imbalances.
NBER Working Paper 12904. National Bureau of Economic Research, Cambridge, MA.
Feder, Gershon (1982). On Exports and Economic Growth. Journal of Development Economics, 12 (1-2):
59-73.
Ghose, Ajit K (2013). Ballooning Current Account Deficit: What Options?. Economic and Political Weekly,
XLVIII (34): 10-12.

17
GOI (Government of India) (2011). Faster, Sustainable and More Inclusive Growth: An Approach to the
Twelfth Five Year Plan (2012-17). New Delhi: Planning Commission.
————— (2012). Economic Survey 2010-12. New Delhi: Ministry of Finance.
Goyal, Ashima (2012). Causes and Cures for India’s Current Account Deficit. Hindu Businessline, August
8.
Goyal, Rajan (2012). Sustainable Level of India’s Current Account Deficit. RBI Working Paper Series 16.
Reserve Bank of India, Mumbai.
Grossman, Gene M and Elhanan Helpman (1991). Innovation and Growth in the Global Economy.
Cambridge: MIT Press.
Gupta, Poonam (2005). Macro-economic Determinants of Remittances: Evidence from India. IMF
Working Paper WP/05/224. International Monetary Fund, Washington D.C.
Jalava, Jukka and Matti Pohjola (2002). Economic Growth in the New Economy: Evidence from
Advanced Economies. Information Economics and Policy, 14: 189-210.
Krugman, Paul (1984). Import Protection as Export Promotion: International Competition in the
Presence of Oligopoly and Economies of Scale. In H Kierkowski (ed), Monopolistic Competition
in International Trade. Oxford: Oxford University Press.
Lee, Jong W (1995). Capital Goods Imports and Long-run Growth. Journal of Development Economics,
48 (1): 91-110.
Mann, Catherine L (2002). Perspectives on the U.S. Current Account Deficit and Sustainability. Journal
of Economic Perspectives, 16 (3): 131-52.
————— (2004). The U.S. Current Account, New Economy Services, and Implications for
Sustainability. Review of International Economics, 12 (2): 262-76.
Obstfeld, Maurice and Kenneth Rogoff (2007). Foundations of International Macroeconomics.
Cambridge: MIT Press.
Oulton, Nicholas (2001). Must the Growth Rate Decline? Baumol’s Unbalanced Growth Revisited. Oxford
Economic Papers, 53 (4): 605-27.
Pesaran, Hashem M, Yongcheol Shin and Richard J Smith (2001). Bound Testing Approaches to the
Analysis of Level Relationships. Journal of Applied Econometrics, 16: 289-326.
Pradhan, Narayan C (2010). Exports and Economic Growth: An Examination of ELG Hypothesis for
India. Reserve Bank of India Occasional Papers, 31 (3): 35-66.
Rath, Deba P and Raj Rajesh (2006). Analytics and Implications of Services Sector Growth in Indian
Economy. The Journal of Income and Wealth, 28 (1): 1-20.
Sekmen, Fuat and Mustafa Calisir (2011). Is there Trade-offs Between Current Account Deficits and
Economic Growth? The Case of Turkey. International Research Journal of Finance and
Economics, 62: 166-72.
UNCTAD (United Nations Conference on Trade and Development) (2013). Trade and Development
Report 2013. Geneva: United Nations.
Vernon, Raymond (1966). International Investment and International Trade in the Product Cycle.
Quarterly Journal of Economics, 80 (2): 190-207.
WTO (World Trade Organisation) (2013). World Trade Report 2013. Geneva: WTO.

18
APPENDIX Table A1: Testing for Stationarity - ADF test
Variable Test statistic Test statistic Test statistic Test statistic
(level of variables) (level of variables) (First Difference) (First difference)
Intercept Intercept + trend Intercept Intercept + trend
GDPMP 3.34 1.796 -4.27*** -20.7***
CAB 1.72 0.127 -8.12*** -8.78***
NSX 0.0028 -2.517 -9.15*** -9.33***
Source: Author’s calculations
***The null hypothesis that the variable concerned is non-stationary can be rejected at 1% level of
significance.
Table A2: Testing for Stationarity - KPSS test
variable Test statistic Test statistic Test statistic Test statistic
(level of variables) (level of variables) (First difference) (First difference)
Intercept Intercept + trend Intercept Intercept + trend
GDPMP 0.95*** 0.25*** 0.38 0.14
CAB 0.79*** 0.28*** 0.402 0.14
NSX 0.96*** 0.23*** 0.33 0.08 Source: Author’s calculations
***The null hypothesis that the variable concerned is stationary can be rejected at 1% level of
significance.
Table A3: ARDL (1, 2, 3) Model Estimation Results
Dependent Variable is CAB
Regressor Coefficient T-Ratio[Prob]
CA (-1) .47117*** 3.6521[.001]
GDPMP .022533 .73365[.467]
GDPMP (-1) .046950 1.2119[.231]
GDPMP (-2) -.11080*** -3.9841[.000]
NSX .17857 .58876[.559]
NSX (-1) -.27117 -.76085[.450]
NSX (-2) .80501** 2.2376[.030]
NSX (-3) -.56954* -1.8350[.072]
C 225.7095*** 2.8581[.006]
R-Squared: 0.79 R-Bar-Squared: 0.75
S.E. of Regression: 152.43 F-stat. F (8, 51): 23.46 [.000]
Akaike Info. Criterion: -390.86 Schwarz Bayesian Criterion: -400.29
DW-statistic: 2.01 Source: Author’s calculations
Note: Lag-length is chosen on the basis of SBC
***,**,* denotes statistical significance at the 1 %,5% and 10% level of significance, respectively.

19
Table A4: Wald Test Results for ARDL (1,2,3) Model
Test Statistic Value df Probability
F-statistic 4.62*** (3, 48) 0.0064
Chi-square 13.86*** 3 0.0031
Source: Author’s calculations
***,**,* denotes statistical significance at the 1 %,5% and 10% level of significance, respectively.
Table A5: Regression Diagnostic Tests for ARDL Model
Diagnostic Tests Null H0 LM Version F Version
Lagrange Multiplier test zero serial correlation CHSQ(4)= 2.9691 [0.563] F(4,47)= .61171 [0.656]
Jarque Bera test Normality(normally distributed residuals) CHSQ(2)= 3.1559 [0.206] Not applicable
White test Homoskedasticity CHSQ(1)= 1.7402 [0.187] F(1,58)= 1.7325 [0.193]
Ramsey's RESET test
Model is correctly specified. CHSQ(1)= 1.6903 [0.194] F(1,50)= 1.4494 [0.234]
Source: Author’s calculations
***,**,* denote Null Hypothesis can be rejected at 1%, 5% and 10% level of significance, respectively.
Figures in parenthesis [ ] are probability values.

277 Climate Change, Agriculture, Povertyand Livelihoods: A Status ReportK N Ninan and Satyasiba Bedamatta
278 District Level NRHM Funds Flow andExpenditure: Sub National Evidence fromthe State of KarnatakaK Gayithri
279 In-stream Water Flows: A Perspectivefrom Downstream EnvironmentalRequirements in Tungabhadra RiverBasinK Lenin Babu and B K Harish Kumara
280 Food Insecurity in Tribal Regions ofMaharashtra: Explaining Differentialsbetween the Tribal and Non-TribalCommunitiesNitin Tagade
281 Higher Wages, Cost of Separation andSeasonal Migration in IndiaJajati Keshari Parida and S Madheswaran
282 Pattern of Mortality Changes in Kerala:Are they Moving to the Advanced Stage?M Benson Thomas and K S James
283 Civil Society and Policy Advocacy inIndiaV Anil Kumar
284 Infertility in India: Levels, Trends,Determinants and ConsequencesT S Syamala
285 Double Burden of Malnutrition in India:An InvestigationAngan Sengupta and T S Syamala
286 Vocational Education and Child Labour inBidar, Karnataka, IndiaV Anil Kumar
287 Politics and Public Policies: Politics ofHuman Development in Uttar Pradesh,IndiaShyam Singh and V Anil Kumar
288 Understanding the Fiscal Implications ofSEZs in India: An Exploration in ResourceCost ApproachMalini L Tantri
289 Does Higher Economic Growth ReducePoverty and Increase Inequality?Evidence from Urban IndiaSabyasachi Tripathi
290 Fiscal DevaluationsEmmanuel Farhi, Gita Gopinath and Oleg Itskhoki
291 Living Arrangement Preferences andHealth of the Institutionalised Elderly inOdishaAkshaya Kumar Panigrahi and T S Syamala
292 Do Large Agglomerations Lead toEconomic Growth? Evidence from UrbanIndiaSabyasachi Tripathi
293 Representation and Executive Functionsof Women Presidents andRepresentatives in the GramaPanchayats of KarnatakaAnand Inbanathan
Recent Working Papers294 How Effective are Social Audits under
MGNREGS? Lessons from KarnatakaD Rajasekhar, Salim Lakha and R Manjula
295 Vulnerability Assessment Of TheAgricultural Sector In Yadgir District,Karnataka: A Socio-Economic SurveyApproachSarishti Attri and Sunil Nautiyal
296 How Much Do We Know about theChinese SEZ Policy?Malini L Tantri
297 Emerging Trends in E-Waste Management- Status and IssuesA Case Study of Bangalore CityManasi S
298 The Child and the City: AutonomousMigrants in BangaloreSupriya RoyChowdhury
299 Crop Diversification and Growth of Maizein Karnataka: An AssessmentKomol Singha and Arpita Chakravorty
300 The Economic Impact of Non-communicable Disease in China and India:Estimates, Projections, and ComparisonsDavid E Bloom, Elizabeth T Cafiero, Mark EMcGovern, Klaus Prettner, Anderson Stanciole,Jonathan Weiss, Samuel Bakkia and LarryRosenberg
301 India’s SEZ Policy - Retrospective AnalysisMalini L Tantri
302 Rainwater Harvesting Initiative inBangalore City: Problems and ProspectsK S Umamani and S Manasi
303 Large Agglomerations and EconomicGrowth in Urban India: An Application ofPanel Data ModelSabyasachi Tripathi
304 Identifying Credit Constrained Farmers: AnAlternative ApproachManojit Bhattacharjee and Meenakshi Rajeev
305 Conflict and Education in Manipur: AComparative AnalysisKomol Singha
306 Determinants of Capital Structure ofIndian Corporate Sector: Evidence ofRegulatory ImpactKaushik Basu and Meenakshi Rajeev
307 Where All the Water Has Gone? AnAnalysis of Unreliable Water Supply inBangalore CityKrishna Raj
308 Urban Property Ownership Records inKarnataka: Computerized LandRegistration System for Urban PropertiesS Manasi, K C Smitha, R G Nadadur, N Sivanna, P
G Chengappa309 Historical Issues and Perspectives of
Land Resource Management in India: AReviewM S Umesh Babu and Sunil Nautiyal
310 E-Education: An Impact Study of SankyaProgramme on Computer Education
N Sivanna and Suchetha Srinath

311 Is India’s Public Debt Sustainable?Krishanu Pradhan
312 Biomedical Waste Management: Issuesand Concerns - A Ward Level Study ofBangalore CityS Manasi, K S Umamani and N Latha
313 Trade and Exclusion: Review of ProbableImpacts of Organised Retailing onMarginalised Communities in IndiaSobin George
314 Social Disparity in Child Morbidity andCurative Care: Investigating forDetermining Factors from Rural IndiaRajesh Raushan and R Mutharayappa
315 Is Access to Loan Adequate for FinancingCapital Expenditure? A Household LevelAnalysis on Some Selected States of IndiaManojit Bhattacharjee and Meenakshi Rajeev
316 Role of Fertility in Changing Age Structurein India: Evidence and ImplicationsC M Lakshmana
317 Healthcare Utilisation Behaviour in India:Socio-economic Disparities and the Effectof Health InsuranceAmit Kumar Sahoo
318 Integrated Child Development Services inIndia – A Sub-National ReviewJonathan Gangbar, Pavithra Rajan and K Gayithri
319 The Infrastructure-Output Nexus:Regional Experience from IndiaSumedha Bajar
320 Uncertainty, Risk and Risk Mitigation: FieldExperiences from Farm Sector inKarnatakaMeenakshi Rajeev and B P Vani
321 Socio-Economic Disparities in Health-Seeking Behaviour, Health Expenditureand Sources of Finance in Orissa: Evidencefrom NSSO 2004-05Amit Kumar Sahoo and S Madheswaran
322 Does Living Longer Mean Living Healthier?Exploring Disability-free Life Expectancyin IndiaM Benson Thomas, K S James and S Sulaja
323 Child and Maternal Health and Nutrition inSouth Asia - Lessons for IndiaPavithra Rajan, Jonathan Gangbar and K Gayithri
324 Reflecting on the Role of Institutions inthe Everyday Lives of Displaced Women:The Case of Ganga-Erosion in Malda, WestBengalPriyanka Dutta
325 Access of Bank Credit to VulnerableSections: A Case Study of KarnatakaVeerashekharappa
326 Neighbourhood Development and CasteDistribution in Rural IndiaRajesh Raushan and R Mutharayappa
327 Assessment of India’s Fiscal and ExternalSector Vulnerability: A Balance SheetApproachKrishanu Pradhan
328 Public Private Partnership’s GrowthEmpirics in India’s InfrastructureDevelopmentNagesha G and K Gayithri
329 Identifying the High Linked Sectors forIndia: An Application of Import-AdjustedDomestic Input-Output MatrixTulika Bhattacharya and Meenakshi Rajeev
330 Out-Of-Pocket (OOP) Financial RiskProtection: The Role of Health InsuranceAmit Kumar Sahoo and S Madheswaran
331 Promises and Paradoxes of SEZs Expansionin IndiaMalini L Tantri
332 Fiscal Sustainability of National FoodSecurity Act, 2013 in IndiaKrishanu Pradhan
333 Intergrated Child Development Servicesin KarnatakaPavithra Rajan, Jonathan Gangbar and K Gayithri
334 Performance Based Budgeting:Subnational Initiatives in India and ChinaK Gayithri
335 Ricardian Approach to FiscalSustainability in IndiaKrishanu Pradhan
336 Performance Analysis of National HighwayPublic-Private Partnerships (PPPs) in IndiaNagesha G and K Gayithri
337 The Impact of Infrastructure Provisioningon Inequality: Evidence from IndiaSumedha Bajar and Meenakshi Rajeev
338 Assessing Export Competitiveness atCommodity Level: Indian Textile Industryas a Case StudyTarun Arora
339 Participation of Scheduled CasteHouseholds in MGNREGS: Evidence fromKarnatakaR Manjula and D Rajasekhar
Price: ` 30.00 ISBN 978-81-7791-196-1
INSTITUTE FOR SOCIAL AND ECONOMIC CHANGEDr V K R V Rao Road, Nagarabhavi P.O., Bangalore - 560 072, India
Phone: 0091-80-23215468, 23215519, 23215592; Fax: 0091-80-23217008E-mail: [email protected]; Web: www.isec.ac.in


![(Microsoft PowerPoint - Seminario conclusivo [modalit\340 compatibilit\340])](https://static.fdocuments.net/doc/165x107/568bd9ab1a28ab2034a7e986/microsoft-powerpoint-seminario-conclusivo-modalit340-compatibilit340.jpg)