WP-2012-009 A Corporate Governance Index for Large · PDF fileWP-2012-009 A Corporate...
36
WP-2012-009 A Corporate Governance Index for Large Listed Companies in India Jayati Sarkar, Subrata Sarkar and Kaustav Sen Indira Gandhi Institute of Development Research, Mumbai March 2012 http://www.igidr.ac.in/pdf/publication/WP-2012-009.pdf
Transcript of WP-2012-009 A Corporate Governance Index for Large · PDF fileWP-2012-009 A Corporate...

WP-2012-009
A Corporate Governance Index for Large Listed Companies in India
Jayati Sarkar, Subrata Sarkar and Kaustav Sen
Indira Gandhi Institute of Development Research, Mumbai
March 2012
http://www.igidr.ac.in/pdf/publication/WP-2012-009.pdf

A Corporate Governance Index for Large
Listed Companies in India
Jayati Sarkar, Subrata Sarkar
Indira Gandhi Institute of Development Research
A.K. Vaidya Marg, Mumbai 400065, INDIA
Email: [email protected] and [email protected]
and
Kaustav Sen
Indian Institute of Management
Diamond Harbour Road, Joka, Kolkata 700104, INDIA
Email: [email protected]
March 30, 2012
Abstract
We construct a Corporate Governance Index for 500 large listed Indian firms for the
period from 2003 to 2008 in this paper. The index construction uses information on
four important corporate governance mechanisms: the board of directors, the
ownership structure, the audit committee, and the external auditor. The construction of
the index for six years allows an examination of the evolution of corporate governance
in India in a period when there have been a large number of corporate governance
reforms. The analysis documents a rising trend in the level of the Corporate
Governance Index of Indian companies. There is a strong association between the
Corporate Governance Index and the market performance of companies, where
companies with better corporate governance structures earn substantially higher rates
of return in the market. This analysis shows that Indian markets tend to reward
companies that carry out governance reforms. It provides an impetus to regulators as
well as to push for further reforms.
Keywords: Corporate Governance Index, board of directors, ownership structure,
audit committee, external auditors
JEL Code: C43, G18, G34, M41, M42
1
1 Introduction
Governance reforms have become the corner stone of corporate sector development inIndia in recent years. As Indian companies begin to access international capital and asforeign investors begin to acquire stakes in Indian companies, the design of a well laid outgovernance structure has become increasingly important for corporate sector growth. Tothis extent a large number of governance reforms have taken place in the India, beginningwith the implementation of the Clause 49 of the Listing Agreement in February 2000 andcontinuing with the drafting of the New Companies Bill of 2009 which is awaiting approvalof the parliament. It is envisaged that institution of these reforms is likely to lead to bettergovernance of Indian companies.
However, quantifying the state of corporate governance of companies is not easy. In partthe difficulty comes from the encompassing nature of the definition of corporate governance.A scanning of the academic literature suggests a plethora of definitions. Of these, perhapsthe ones that most adequately capture the overarching reach of corporate governance iscontained in the following two definitions:
1. Corporate governance refers to the ”the whole set of legal, cultural, and institutionalarrangements that determine what public corporations can do, who controls them,how that control is exercised, and how the risks and return from the activities theyundertake are allocated.” (Blair, 1995).
2. Corporate governance is the system by which business corporations are directed andcontrolled. The corporate governance structure specifies the distribution of rights andresponsibilities among different participants in the corporation, such as, the board,managers, shareholders and other stakeholders, and spells out the rules and proce-dures for making decisions on corporate affairs. By doing this, it also provides thestructure through which the company objectives are set, and the means of attainingthose objectives and monitoring performance (OECD, 1999).
Thus corporate governance covers a wide range of arrangements. Scholars classify thesearrangements into internal and external mechanism. With internal mechanisms, the own-ership structure of the firm, the board of directors, the auditor and the audit committee,other committees of the board like nomination committee, remuneration committee ac-quire special significance. Within external mechanisms, the market for corporate controland product market competition play a significant role in improving corporate governance.The internal and external mechanisms in turn are shaped by the overall legal and institu-tional structures of the country.
Given the large number of facets that are covered by corporate governance it is not easyto understand the overall state of corporate governance of a company. There are too manyvariables and too much information which need to be processed for this understanding. Inthis context an overall Corporate Governance Index that can adequately summarize thedifferent aspects of governance with a few numbers may be highly useful.
2

In this paper we construct such a Corporate Governance Index for 500 large listed firmsin the Indian corporate sector using information on four important corporate governancemechanisms namely, the Board of Director, Ownership Structure, Audit Committee, andthe external Auditor. We construct the indices for six years for the period 2003 to 2008.Construction of the index for six years allows us to examine the evolution of the stateof corporate governance in India over a time period when a large number of corporategovernance reforms have taken place and continue to do so. Our empirical analysis showsan increasing trend in the corporate governance structure of Indian companies. We alsoexamine the relation of the Corporate Governance Index with the market performance ofcompanies and find a very strong association between the two. Companies with bettercorporate governance structures appear to earn substantially higher rates of return in themarket. The empirical analysis shows that that good governance practices are rewardedby the market which provides an added incentive to companies to carry out governancereforms. It provides an impetus to regulators as well as to push for further reforms. Toour knowledge this is one of the first attempts to construct a Corporate Governance Indexfor a wide range of companies spanning a large number of years.
We believe the Index would be useful to a wide range of participants in the capital market.To begin with, it will be helpful to regulators to judge how the corporate governancereforms are working. Second, the index would be helpful to companies to realize thebenefit of adopting good governance practice - the Index can work as a rating tool. Finally,the index would be helpful to investors to pick well governed companies. Above all, theextensive database that is created in the process of creating the Index will provide valuableinformation for conducting research in various fields of governance.
The rest of the paper is organized as follows. Section 2 describes the importance of thefour governance mechanisms used to construct the Index, and the attributes considered toconstruct each sub index. Section 3 discusses the methodology of Index construction andSection outlines the sample and the data source. Empirical analysis of the cross-sectionaldistribution of the Index and its components, its time behavior and its relation to marketperformance are presented in Section 5. Section 6 concludes the paper.
2 Components of the Corporate Governance Index
As outlined in the introduction, corporate governance covers a numbers of internal andexternal mechanisms that reduce agency cost within a corporation and thereby lead toan increase in firm value. We consider four important governance mechanisms to capturethe overall state of corporate governance of a company. These four governance mechanismare the (1) Board of Directors, (2) Ownership Structure, (3) Audit Committee and (4)Auditor.
3

2.1 The Board of Directors
The board of directors acts as one of the most important governance mechanisms in aligningthe interests of managers and shareholders. A typical board of modern corporations consistsof inside or executive directors who are full time employees of the company and are involvedin its day to day operations and non-executive or outside directors who do not have anyexecutive responsibilities and play mostly an advisory role. The outside directors aregenerally further classified as affiliated directors (or grey directors) who are former companyofficers, relatives of the company officers, or those who have existing business relationshipswith the company such as investments bankers and lawyers; and non-affiliated directorswho are outside directors with no such affiliation. It is the non-affiliated outside directors,commonly referred to as non executive independent directors or simply as independentdirectors who are envisaged to perform the monitoring role and are widely regarded as thefiduciaries of the shareholders interest.
Apart from board independence there are number of other issues that relate to the effi-cient functioning of the board of directors, especially in the case of emerging economiesincluding India, where family owned corporations belonging to business groups dominatethe corporate landscape. These issues relate to the influence that owners can potentiallyexert through their presence on corporate boards, often through having substantial equityownership in the company as well as by holding important managerial positions. Influ-ence can also be exercised by combining the role of CEO and Chairman (CEO-Duality)which might lead to reduced board oversight. Coupled with the influence of insiders, theeffectiveness of independent directors to discharge their fiduciary duties also depends ontheir ability to devote sufficient time to discharge their functions. In this respect, multipledirectorships by independent directors acquire special significance. While multiple direc-torships at one level might signal the quality of directors, a large number of directorshipsis likely to hamper the ability to discharge their functions effectively. Accordingly, regula-tions in some countries, and certainly in India, try to limit multiple directorships beyond apoint. In addition to board independence, ceo-duality and multiple directorships, there isone more important issue that is relevant for board of directors in India. This pertains tothe presence of nominee directors on board and the debate as to whether these directorsshould be considered as independent directors. While the current Clause 49 regulationsconsider nominee directors as independent directors, almost all academic discourse as wellas recommendations of corporate governance committees in India tend to suggest other-wise given that these directors are most likely to look after the interest of the financialinstitutions they represent. Since most these financial institutions are providers of debtcapital, it is argued that nominee directors as more likely to protect debt-holders interestwhich might often run counter to the interest of the equity holders.
4

Keeping the above discussions in perspective, we consider ten important attributes thatdescribe sate of governance with respect to the Board of Directors. These ten attributesare:
1. Board size
2. Percentage of outside directors
3. Percentage of independent directors
4. Presence of nominee directors
5. Presence of non-executive or promoter chairman
6. Presence of promoter on board
7. Total number of directorships held by independent directors
8. Number of board meetings held
9. Percentage of board meetings attended by independent directors
10. Percentage of independent directors who attended AGM
2.2 The Ownership Structure
The ownership structure of a publicly held corporation is one of the internal mechanismsof corporate governance that has been extensively studied in the developed countries,particularly the US and UK, and has more recently been the subject of much research inemerging economies. While the ownership and control structure of a firm is the source ofagency costs in firms and is at the root of all corporate governance problems, the literatureon ownership as a governance mechanism focuses on how the ownership structure per se,i.e., stock ownership by different shareholders, can separately or in conjunction mitigateagency costs in a firm.
The role of ownership as a mitigating mechanism first came into focus in the contextof agency costs arising from separation of ownership and control in widely held firms.In owner-controlled firms with concentrated ownership, while there may be separationof ownership and management, owners have strong incentives to monitor managers. Itis argued that higher shareholding by controlling insiders of family controlled firms, bystrengthening the link between the value of the firm and the wealth of controlling insiders,can help align their interests with that of outside minority shareholders. However, insuch firms, agency problems could manifest on account of conflict of interest betweencontrolling shareholders and minority shareholders. Extant literature suggests that oneway of reducing this agency cost is to have outside blockholders with relatively large equitypositions.
5

These large shareholders have substantial investments at stake, as well as the voting powerto ensure that the investments are not lost. Large shareholders can also help alleviatethe free rider problem associated with small shareholders. Moreover, blockholders likeforeign institutional investors and domestic financial institutions can engage in ”relationalinvesting” and are likely to be more committed to the company, which will benefit thecompany in the long run. Finally, given the size of block-holdings, the costs of governanceby the large investors is likely to be less as these can be spread across more investments, andenhancing the influence of blockholders like institutional investors would benefit society atlarge as their interests tend to coincide with the interests of the society.
We use four attributes to capture the ownership structure of the firm that has a bearingon corporate governance. These are:
1. Percentage of promoter ownership
2. Percentage of foreign institutional ownership
3. Percentage of domestic financial institution ownership
4. Percentage of dispersed ownership
2.3 The Audit Committee
Information is basic input for governance. It is the primary ingredient for enabling share-holders to exercise their voting rights in the general meetings of the company. Indeedimportant decisions like ratification of mergers, approval of crucial corporate decisions,holding management accountable for their actions and deciding if the current board ofdirectors is duly discharging their fiduciary duties depend on shareholders getting the cor-rect and right amount of information from the company. In turn, the ability of the boardof directors to discharge their fiduciary duties and monitoring the management as well ascarrying out their responsibilities in the various committees of the board depend cruciallyon these directors getting the right picture about the operations of the company. Withinthe external corporate governance mechanisms, the workings of the market for corporatecontrol, the ability of the capital market to allocate external finance to the most produc-tive use, the operation of the managerial labor market, and the fixation of managerialcompensation all depend on the availability of correct information. Further, adequate andrelevant information enable scrutiny of the companys action by outside investors and ana-lysts and ensure that the company puts the scarce resources of the shareholders to the mostproductive use. Thus information is the key pillar of corporate governance as it enablesboth direct and indirect monitoring of the corporate managers by both insiders as well asoutsiders.
The audit committee is one of the most important governance mechanisms that is designedto ensure that a company produces relevant, adequate and credible information that in-vestors as well as independent observers can use to assess the performance of the company.
6

The audit committee ensures that the external auditor receives all the necessary informa-tion that are required to carry out the audit process independently and effectively and thatthe functioning of the external auditor is not subjected to the pulls and pressures of theinside management. The audit committee sets the scope of audit and terms of engagementof the external auditor and continually monitors its functioning and progress. Given theimportance of the audit committee in corporate governance, it is not surprising to findthat regulations all over the world to have placed a major emphasis on the structure, roleand powers and the functioning of the audit committee.
A major issue with respect to audit committees is its independence from the management.The management, with help of the internal auditors prepares the financial statementsin accordance with the established accounting principles. The external auditor has theresponsibility to audit these financial statements. For verification of these financial state-ments, the auditor requires access to all necessary documents and a truthful explanationof all procedures. It is unlikely that this can be expected from the inside managementwhose very actions is the subject of the auditing process. Even granted management istruthful, there is a need to insulate the verification process from the influence of the insidemanagement so that outsiders perceive the audit process as independent as they cannotdirectly observe the managers truthfulness. Under these circumstances, the independenceof the audit committee becomes crucial. Accordingly, regulations in most countries re-quire the audit committee to comprise only of independent directors. In India though, theClause 49 regulations only require the audit committee to have two-thirds of its membersas independent directors. The Clause 49 regulations also require the audit committee tobe a minimum size of three and that its chairman be an independent director.
We consider four important attributes of the audit committee to construct the AuditCommittee Index. These are:
1. Size of audit committee
2. Percentage of independent directors
3. Presence of executive directors in audit committee
4. Number of meetings held
2.4 The Auditor
The auditors are the lead actors in the auditing process and provide independent over-sight to the financial reporting by companies. Modern day corporations are huge andtheir operations are complex. Though accounting standards and norms are specified bythe regulators for proper accounting, yet many areas require judgments by management,assumptions, and choice among alternative accounting principles. Consistency of appli-cations in preparing accounts and coverage of all relevant financial aspects are required.Auditors scrutinize and verify the accounts and certify that the financial statements are
7

prepared in accordance to the prescribed principles and that the accounts are free frommaterial misstatements and give a true and fair view of the companys financial status. Indischarging its functions, the auditor verifies and certifies that the information producedby the company are in accordance with the various disclosure statutes prescribed under thecountrys legal framework and are in accordance to the accounting and auditing standardsprescribed by the regulators. It ensures that various management assumptions regardingthe recognition of revenue and expenses are in conformity with the established proceduresand standards.
Like the audit committee, independence is the key issue with respect to the auditor func-tioning. Accordingly, regulations in all countries tend to specify strict conditions relatingto non-audit services that an auditing firm can render, auditor rotation, and independenceof the employees of the audit firm as well as the audit client from each other. In addition,regulations require the auditor to report directly to the audit committee and the termsof engagement and scope of services of the auditor to be decided by the audit committeerather than by the management. Auditor independence has been an important area ofresearch in the accounting literature. Studies on auditor independence have focused onthe extent of non-audit services provided by the external auditor as well audit firm tenure,both of which are generally seen as hindrances to auditor independence. The extant liter-ature provides strong empirical support that higher audit independence has a significantbeneficial effect on enhancing the quality of disclosures, in reducing discretionary earn-ings management, increasing the informativeness of earnings, and in general enhancing thevalue of the firm.
Keeping in view the above discussion, we consider four attributes of the external auditorto construct the Auditor Index. These are:
1. Percentage of non-audit fees to total payment to auditors
2. Top auditor in terms of audit fees
3. Top auditor in terms of audit clients
4. Change in auditor from last year
8

3 Methodology of Index Construction
We construct the Corporate Governance Index in two steps. In the first step we constructa sub index for each of the four corporate governance components namely, the BoardIndex, the Ownership Index, the Audit Committee Index and the Auditor Index. In thesecond step we average the values of the four sub-indices to arrive at the overall CorporateGovernance Index.
To construct the Board Index, the Ownership Index, the Audit Committee Index andthe Auditor Index we take the attributes within a specified governance mechanism andscore each attribute on a scale of 0 to 5. We then aggregate the score across all theattributes within that specific governance mechanism, divide it by the maximum possiblescore and multiply it by 100. The simple aggregation of scores implies that we constructan unweighted index. The unweighted index has the advantage of treating all attributesof the a specific sub-index symmetrically without having to make arbitrary or data-drivenjudgments on the relative importance of each attribute as is the characteristics of weightedindices and those that are formed through principal component analysis. Unweightedindices are widely used in the literature for index construction (Cooke, 1989; Hossain andHammami, 2009). Note that though the maximum value for each sub index is thus set to100, none of the sample firms may earn the maximum score. In other words, we normalizethe maximum score to 100 rather than normalizing the best firm in the sample to 100.This ensures that improvements over time in a particular governance mechanism will beadequately captured by the index.
We use the standards specified in the Clause 49 regulations as well as insights from variousacademic studies to score each attribute within a particular corporate governance mech-anism.1 For example, with respect to percentage of independent directors, we penalizecompanies that do not meet the Clause 49 requirements of having at least one third of itsboard members as independent directors (in case the company has non-executive chair-man) or 50 percent (in case the company has an executive/promoter chairman). Likewise,we penalize companies that do not have an audit committee with majority of indepen-dent directors and that do not conduct at least four meetings a year as per the Clause 49regulations. For scoring attributes that do not have specified standards in the Clause 49regulations, we take help of existing academic studies. For example to score the attributeboard size, we use the finding that large boards may not be good for companies (Yermack,1996). So we divide companies into quintiles based on board size, and give the highestscore to companies in the middle and lower points to companies at the lower and higherquintiles.
9

4 Sample and Data Source
We construct the Corporate Governance Index and the index for the various componentsfor 500 large listed companies in the Indian corporate sector for the years 2003 to 2008.For this we sort all the companies listed on the Bombay Stock Exchange in terms of theiraverage daily market capitalization for the year 2008 and select the top 500 companies. Forthese companies, we then scrutinize the Corporate Governance Reports contained in theannual reports to tabulate the information on board composition, board size, and numberof multiple directorships, promoter presence, and presence of nominee directors, attendanceof board and annual general meetings, size of the audit committee, number of meetingsheld and other related information. We collect the name of the external auditor, andinformation on total audit and non-audit fees from the annual reports of the companies.We source these annual reports from SANSCO. We source the equity ownership informationand stock market details of companies from the Prowess database created by the Centerfor Monitoring Indian Economy. Though are focus is on the top 500 companies, we areunable to find the annual reports for some companies even after extensive searching. Thisis especially true for the earlier years. Accordingly in the empirical analysis, the samplebecomes unbalanced. However, we believe that the missing companies are fairly randomso that the sample gives a fair representation of the top 500 firms in the Indian corporatesector1.
1Clause 49 was introduced by SEBI in February 2000 based on the recommendations of the KumaraMangalam Birla Committee on Corporate Governance. The Clause required all listed companies withpaid up capital of Rs 3 crore or above to comply with a broad set of corporate governance standardsby the March 2003. Standards were specified with respect to (i) the Board of Directors (ii) the AuditCommittee (iii) Subsidiary Companies (iv) Disclosures including those on related party transactions (v)CEO/CFO Certification (vi) Report on Corporate Governance, and (vii) Compliance. Apart from themandatory regulatory requirements, Clause 49 also contained certain non-mandatory requirements suchas the option of setting up a remuneration committee, shareholder rights, training of board members,audit qualifications, etc. Companies were required to disclose their compliance with these regulations in aseparate section on Corporate Governance in their Annual Reports.
10
5 Results
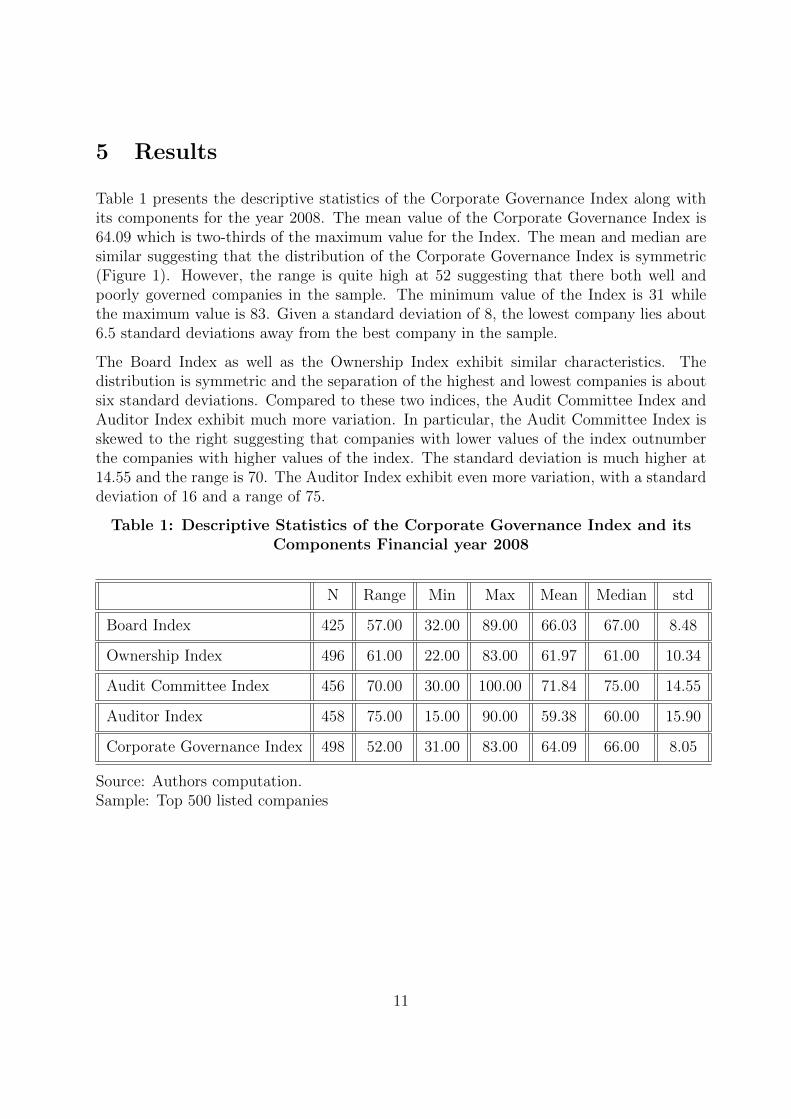
Table 1 presents the descriptive statistics of the Corporate Governance Index along withits components for the year 2008. The mean value of the Corporate Governance Index is64.09 which is two-thirds of the maximum value for the Index. The mean and median aresimilar suggesting that the distribution of the Corporate Governance Index is symmetric(Figure 1). However, the range is quite high at 52 suggesting that there both well andpoorly governed companies in the sample. The minimum value of the Index is 31 whilethe maximum value is 83. Given a standard deviation of 8, the lowest company lies about6.5 standard deviations away from the best company in the sample.
The Board Index as well as the Ownership Index exhibit similar characteristics. Thedistribution is symmetric and the separation of the highest and lowest companies is aboutsix standard deviations. Compared to these two indices, the Audit Committee Index andAuditor Index exhibit much more variation. In particular, the Audit Committee Index isskewed to the right suggesting that companies with lower values of the index outnumberthe companies with higher values of the index. The standard deviation is much higher at14.55 and the range is 70. The Auditor Index exhibit even more variation, with a standarddeviation of 16 and a range of 75.
Table 1: Descriptive Statistics of the Corporate Governance Index and itsComponents Financial year 2008
N Range Min Max Mean Median std
Board Index 425 57.00 32.00 89.00 66.03 67.00 8.48
Ownership Index 496 61.00 22.00 83.00 61.97 61.00 10.34
Audit Committee Index 456 70.00 30.00 100.00 71.84 75.00 14.55
Auditor Index 458 75.00 15.00 90.00 59.38 60.00 15.90
Corporate Governance Index 498 52.00 31.00 83.00 64.09 66.00 8.05
Source: Authors computation.Sample: Top 500 listed companies
11

Table 2: Descriptive Statistics of the Corporate Governance Index and itsComponents Financial year 2003
N Range Min Max Mean Median Std
Board Index 269 55.00 36.00 91.00 66.48 67.00 9.31
Ownership Index 356 56.00 27.00 83.00 57.77 61.00 10.25
Audit Committee Index 170 80.00 15.00 95.00 69.32 75.00 16.49
Auditor Index 374 75.00 15.00 90.00 56.34 60.00 14.50
Corporate Governance Index 428 70.00 15.00 85.00 59.91 60.00 9.65
Source: Authors computationSample: Top 500 listed companies
Given the large number of corporate governance reforms that have taken place in Indiasince 2000, it is natural to ask if the Corporate Governance Index and its componentsshow an improvement over the years. Table 2 presents the descriptive statistics of theCorporate Governance Index and its components for the year 2003. One might recall, thatMarch 2003, was the cut-off date for all listed companies (with share capital of Rs. 3 croreor above) to comply with the Clause 49 Regulations. It is apparent that the corporategovernance standard has improved over the years. The value of Corporate GovernanceIndex has increased from 59.91 in 2003 to 64.09 in 2008. Noticeably, both the range and thestandard deviation in 2008 are lower than in 2003, suggesting that there is an improvementacross the board with the distribution of the Index become tighter. In particular, theminimum value of the Index has increased from 15.00 in 2003 to 31.00 in 2008 which ismore than a hundred percent improvement. Looking at the different components, it isclear that all components of the Index, except for the Board Index have contributed tothe improvement of the Corporate Governance Index. In particular, the Audit CommitteeIndex shows the maximum improvement when judged in terms of reduction in the rangeand standard deviation.
12

Table 3: Correlations: The Corporate Governance Index and Its Components
Pearson Correlation Coefficients Prob > |r| under H0: Rho=0
bod index own index ac index aud index CG index1
Board Index 1.00000 0.02732 0.10684 0.132897 0.458040.2307 <.0001 <.0001 <.0001
Ownership Index 0.02732 1.00000 0.19855 0.10295 0.580700.2307 <.0001 <.0001 <.0001
Audit Commitee Index 0.10684 0.19855 0.100000 0.13824 0.67830<.0001 <.0001 <.0001 <.0001
Auditor Index 0.13897 0.10295 0.13824 1.00000 0.70576<.0001 <.0001 <.0001 <.0001
Corporate Governance Index 0.45804 0.58070 0.67830 0.70576 1.00000<.0001 <.0001 <.0001 <.0001
Source: Authors computationSample: Top 500 listed companies
Table 3 presents the correlation between the Corporate Governance Index and it compo-nents based on the last six years from 2003 to 2008. The Pearsons correlation coefficient isstatistically significant for all pairs except for the correlation between the Board Index andthe Ownership Index. The correlations are all positive implying that companies in generalstrive to have better governance structures with respect to each mechanism.
However, the magnitude of the correlation coefficients between the individual componentsis relatively low suggesting that each aspect of corporate governance can be independentlychosen to arrive at the right mix of the overall governance structure. This is in line withthe academic discourse which points out that the governance structure that is most appro-priate for a company depends on its characteristics. A company that has a highly concen-trated ownership structure with large insider presence, perhaps to safeguard owner-capital,might compensate it by having a board with large presence of independent directors. Theindividual components however, display a strong correlation with the overall CorporateGovernance Index as expected.
As highlighted earlier, complying with corporate governance norms is costly for companiesas it involves the use of large amount of resources to comply with the regulations. How-ever, if compliance leads to an overall increase in the performance of the firm as well asto a lowering of the cost of capital thereby leading to higher rates of return on the com-panys stock, then it provides an incentive for companies to comply with the governance
13

norms. Corporate governance regulation all over the world is based on this fundamentalpremise that good corporate governance makes business sense both with respect to existingshareholders as well as prospective investors.
We explore this idea by analyzing the relation between the Corporate Governance Indexand the market return on the stock of the company. Specifically, we take the financialyear-ending monthly return i.e., the return in the month of March, on the stock of thecompany in the year (t) and regress it on the value of the Corporate Governance Index inthe year (t-1) and other control variables. The use of lagged values of the Index reducesthe sample to the period 2004 to 2008. We use a panel data fixed effects model with yearspecific intercepts to examine this relation. As noted earlier, corporate governance reformsin India has been a gradual and continual process since early 2000. To capture this idea, weinteract the Corporate Governance Index (CG Index) with year specific dummy variables.The year 2004 which marks the first full year of compliance by all listed companies is takenas the reference year. The coefficient on the interaction terms therefore shows the differencein the effect of the Corporate Governance Index in that particular year compared to thebase year of 2004. The total effect of the Corporate Governance Index in a particularyear is the sum of the coefficient on the Index in the base year plus the coefficient of theinteraction terms. We include fixed year effects to take into account the fact the years2007 and 2008 represent the years of the financial crisis. Finally we include the returnvariance as a proxy of the risk of the company and average market capitalization to proxyfor company size.
The returns regression that we estimate to examine the relation between the CorporateGovernance Index and return is different in spirit than the familiar Fama-French (1993)return regression. The Fama-French three factor model is a regression equation to explainhow different risk factors are related to return in equilibrium. In this scenario the futurestream of cash flow is fixed (pre-determined) and only the relation between risk and returnis explored. In our case the setup is one of disequilibrium where the future stream of cashflow depends on the evolving corporate governance norms practiced by a company. Untilthe optimal corporate governance framework is chosen, we postulate that any improvementin corporate governance practices would lead to an increase in the future stream of cashflow, or more generally, to a betterment in the performance of the company (Demsetz andLehn, 1985). Thus, in disequilibrium both governance standards as well as risk wouldcausally influence the price of the security and hence its rate of return. The positive effectof corporate governance on the rate of return, if any, can be interpreted as a higher alphafor a better governed company.
14

Table 4: The Corporate Governance Index and Average Rate of ReturnRegression Analysis
Dependent Variable: Thirty Days Return in the Financial Year-ending Monthof March
Parameter Estimates
Variable Parameter Estimate Standard Error t Value Pr> |t|
Intercept 0.26119 0.27505 0.95 0.3424
Lag of CG Index -0.00759 0.00448 -1.70 0.0901
y2005 0.13132 0.35255 0.37 0.7096
y2006 0.40121 0.37479 1.07 0.2845
y2007 -0.80493 0.35893 -2.24 0.0250
y2008 -1.85995 0.33834 -5.50 ¡.0001
CG Index X y2005 0.00096 0.00574 0.17 0.8662
CG Index X y2006 0.00320 0.00596 0.54 0.5913
CG Index X y2007 0.01401 0.00573 2.44 0.0146
CG Index X y2008 0.01598 0.00543 2.95 0.0033
Return Variance 0.00879 0.00089624 9.81 ¡.0001
Average Market Cap. 0.00000225 7.924927E-7 2.84 0.0046
Total observations: 2091R-Squared: 0.346
Table 4 presents the results of the return regression on the Corporate Governance Index.Consistent with our expectation we find the years fixed effects to be significant. In particu-lar the fixed effects for the years 2007 and 2008 are negative and highly significant. Also asexpected, the coefficient on the return variance is positive and significant confirming thatcompanies with higher risk has to compensate the investor with higher rates of return. Thecoefficient on the size variable is positive and significant suggesting that bigger companiesearn higher rates of return perhaps because of better diversification or perhaps because oftheir ability to negotiate lower rates of capital.
The coefficient on the CG Index and its interactions offer an interesting story. The co-efficient on the CG Index pertains to the base year 2004 (ending March 31st, 2004). Asnoted earlier, corporate governance regulations came into effect on a widespread basis on
15

31st of March of 2003. Accordingly, this coefficient captures the relation mostly in the firstyear of the post-Clause 49 era. The coefficient is negative and significant, but only at the10 percent level. However, the coefficients on the interaction terms suggest a gradual anda monotonic increase in the effect of the Corporate Governance Index in the subsequentyears. All the four coefficients on the interaction terms are positive. The coefficient on thefirst two years are however insignificant. Recall that several modifications to the Clause49 regulations were carried out in the years following 2003 culminating with the new no-tification in August 2004 that required listed companies to comply with new governancestandards from January 1, 2006. Accordingly the year 2005 and most part of the finan-cial year 2006 can be taken as adjustment phase in the Indian corporate sectors as far asgovernance reforms are concerned. The positive but insignificant coefficients are consistentwith these developments as companies were still in the process of meeting the new regu-lations and accordingly there could be large variations within companies regarding theircompliance standards.
However, there is strong positive trend since the year 2007. Both the coefficients onthe interaction terms are positive and highly significant. The coefficients also increasemonotonically suggesting a stronger and stronger correlation with governance structureand rate of return on the stock. Note that the positive magnitude in each of these twoyears is higher is than the negative magnitude attached to the Index in the base year 2004,suggesting that the total effect is positive. Thus the regression results point to a strongpositive correlation between governance structures and rates of return.
The magnitudes of the coefficients are also economically large. For example, for the year2008, the net coefficient of 0.00839 (0.01598 0.00759) implies that an of improvement ofabout 52 points in the Corporate Governance Index which is equal to the difference ofthe observed minimum and maximum value of the Index, leads to an increase of about5.3 percent increase in the annual raw return of the company. Similarly, an improvementof about 30 points in the Index, which is equal to the observed minimum value and themean value of the Index in 2008, leads to an increase of 3.0 percent in annual raw returns.For the year 2007, the corresponding figures are 4.0 and 2.3 percent respectively. Thesenumbers are economically significant.
A better proxy of the effectiveness of corporate governance mechanisms in improving theoperation of the company and hence its future valuation and consequent increase in its stockprice, is the excess return of the companys stock over and above the market. We therefore,rerun the return regression replacing the raw return on the stock with the thirty day excessreturn on the stock over the market index Nifty. These results are presented in Table 5.The results of this regression strongly corroborate the findings obtained in the previousregression. Again, the coefficients on the interaction terms are highly significant for theyears 2007 and 2008 and are economically large in magnitude suggesting the emergence ofa strong relation between the governance of companies and excess return in the later years.Given the coefficients of 0.26807 in 2007 and 0.35129 for 2008, a 10 point increase in theCorporate Governance Index implies an increase of 7.5 percent and 18.6 percent annual
16
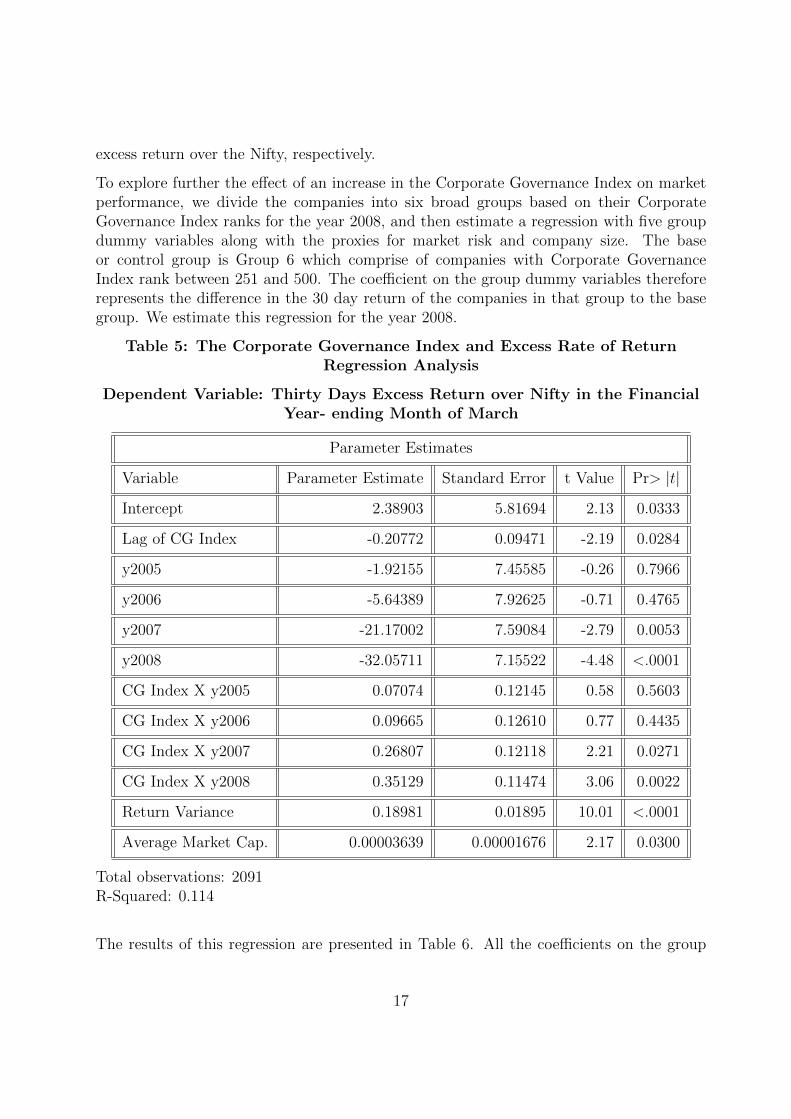
excess return over the Nifty, respectively.
To explore further the effect of an increase in the Corporate Governance Index on marketperformance, we divide the companies into six broad groups based on their CorporateGovernance Index ranks for the year 2008, and then estimate a regression with five groupdummy variables along with the proxies for market risk and company size. The baseor control group is Group 6 which comprise of companies with Corporate GovernanceIndex rank between 251 and 500. The coefficient on the group dummy variables thereforerepresents the difference in the 30 day return of the companies in that group to the basegroup. We estimate this regression for the year 2008.
Table 5: The Corporate Governance Index and Excess Rate of ReturnRegression Analysis
Dependent Variable: Thirty Days Excess Return over Nifty in the FinancialYear- ending Month of March
Parameter Estimates
Variable Parameter Estimate Standard Error t Value Pr> |t|
Intercept 2.38903 5.81694 2.13 0.0333
Lag of CG Index -0.20772 0.09471 -2.19 0.0284
y2005 -1.92155 7.45585 -0.26 0.7966
y2006 -5.64389 7.92625 -0.71 0.4765
y2007 -21.17002 7.59084 -2.79 0.0053
y2008 -32.05711 7.15522 -4.48 <.0001
CG Index X y2005 0.07074 0.12145 0.58 0.5603
CG Index X y2006 0.09665 0.12610 0.77 0.4435
CG Index X y2007 0.26807 0.12118 2.21 0.0271
CG Index X y2008 0.35129 0.11474 3.06 0.0022
Return Variance 0.18981 0.01895 10.01 <.0001
Average Market Cap. 0.00003639 0.00001676 2.17 0.0300
Total observations: 2091R-Squared: 0.114
The results of this regression are presented in Table 6. All the coefficients on the group
17
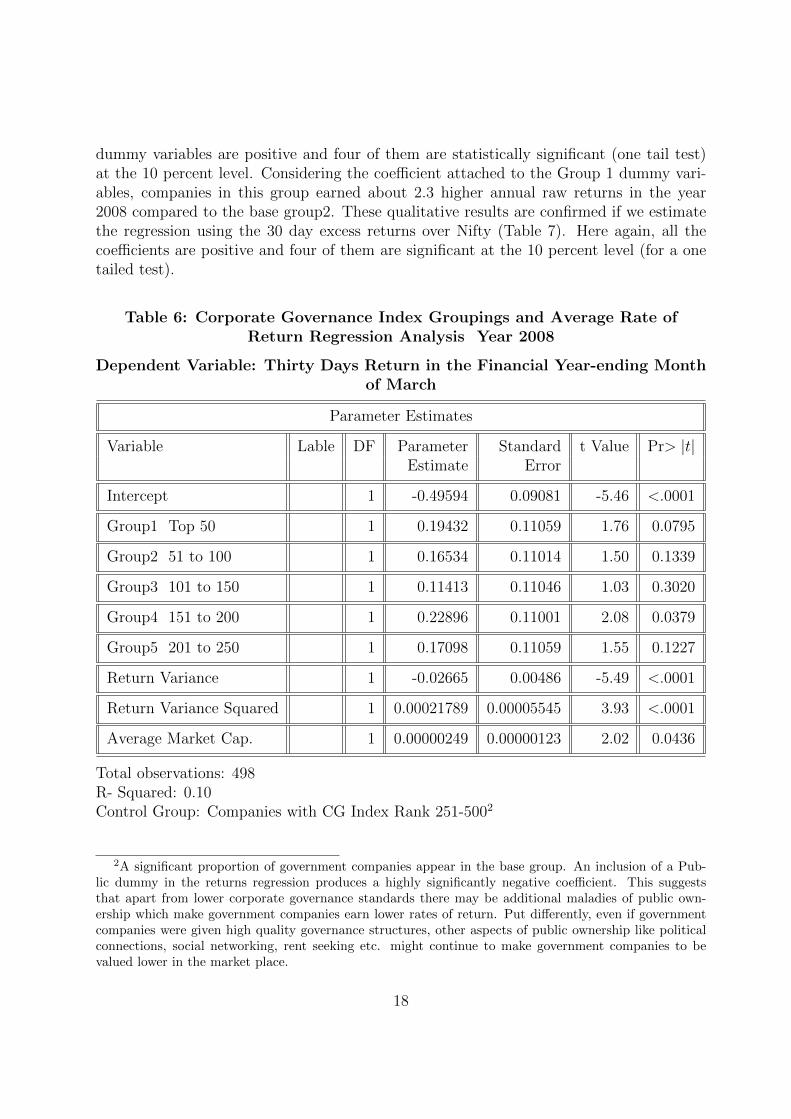
dummy variables are positive and four of them are statistically significant (one tail test)at the 10 percent level. Considering the coefficient attached to the Group 1 dummy vari-ables, companies in this group earned about 2.3 higher annual raw returns in the year2008 compared to the base group2. These qualitative results are confirmed if we estimatethe regression using the 30 day excess returns over Nifty (Table 7). Here again, all thecoefficients are positive and four of them are significant at the 10 percent level (for a onetailed test).
Table 6: Corporate Governance Index Groupings and Average Rate ofReturn Regression Analysis Year 2008
Dependent Variable: Thirty Days Return in the Financial Year-ending Monthof March
Parameter Estimates
Variable Lable DF Parameter Standard t Value Pr> |t|Estimate Error
Intercept 1 -0.49594 0.09081 -5.46 <.0001
Group1 Top 50 1 0.19432 0.11059 1.76 0.0795
Group2 51 to 100 1 0.16534 0.11014 1.50 0.1339
Group3 101 to 150 1 0.11413 0.11046 1.03 0.3020
Group4 151 to 200 1 0.22896 0.11001 2.08 0.0379
Group5 201 to 250 1 0.17098 0.11059 1.55 0.1227
Return Variance 1 -0.02665 0.00486 -5.49 <.0001
Return Variance Squared 1 0.00021789 0.00005545 3.93 <.0001
Average Market Cap. 1 0.00000249 0.00000123 2.02 0.0436
Total observations: 498R- Squared: 0.10Control Group: Companies with CG Index Rank 251-5002
2A significant proportion of government companies appear in the base group. An inclusion of a Pub-lic dummy in the returns regression produces a highly significantly negative coefficient. This suggeststhat apart from lower corporate governance standards there may be additional maladies of public own-ership which make government companies earn lower rates of return. Put differently, even if governmentcompanies were given high quality governance structures, other aspects of public ownership like politicalconnections, social networking, rent seeking etc. might continue to make government companies to bevalued lower in the market place.
18

Table 7: Corporate Governance Index Groupings and Excess Rate of ReturnRegression Analysis - Year 2008
Dependent Variable: Thirty Days Excess Return over Nifty in the FinancialYear-ending Month of March
Parameter Estimates
Variable Lable DF Parameter Standard t Value Pr> |t|Estimate Error
Intercept 1 1.34623 1.34146 1.00 0.3161
Group1 Top 50 1 2.83177 1.63372 1.73 0.0837
Group2 51 to 100 1 2.38857 1.62700 1.47 0.1427
Group3 101 to 150 1 1.37360 1.63176 0.84 0.4003
Group4 151 to 200 1 3.07880 1.62505 1.89 0.0587
Group5 201 to 250 1 2.46950 1.63365 1.51 0.1313
Return Variance 1 -0.47687 0.07177 -6.64 <.0001
Return Variance Squared 1 0.00334 0.00081918 4.07 <.0001
Average Market Cap. 1 0.00003598 0.00001819 1.98 0.0485
Total observations: 498R- Squared: 0.16Control Group: Companies with CG Index Rank 251-500
6 Conclusion
In this paper we have outlined the construction of a corporate governance index for thelarge listed firms in India. The Index is based on four major corporate governance mech-anisms namely the Board of Directors, the Ownership Structure, the Audit Committee,and the External Auditor. For each of the four governance mechanisms several impor-tant attributes as identified in the academic literature were used to construct an overallCorporate Governance Index as well the four sub-indices.
Empirical analysis of the Corporate Governance Index and the its components for the lastsix years namely 2003 to 2008, shows an upward trend in the governance practices of thelarge listed firms in India. At the same time there is a tightening of the distribution of the
19

Index over the years implying that companies are moving close to each other in terms oftheir governance standards. However, there is sufficient scope for improvement.
Our regression results show a strong correlation between the Corporate Governance Indexand the market performance of the company whether judged in terms of raw returns orexcess returns. Companies with higher values of the Corporate Governance Index earnhigher economically meaningful raw and excess returns in the market. This should providean added incentive for companies to undertake the various governance reforms even if doingso requires the allocation of additional resources. The positive relation also implies thatprospective investors perceive a well governed company as less risky and are willing tolend capital at lower cost. Our results also provide strong evidence of strengthening of therelation between the Corporate Governance Index and market performance over the yearsas corporate governance reforms continue to be enacted in the Indian corporate sector.Coupled with this, the fact that the general level of corporate governance is showing anincreasing trend over the years, should provide encouraging news to the regulators aboutthe success of the already instituted governance reforms as well as those that are slated inthe years to come.
In conclusion, the real corporate governance crises in India came from the 2008 periodonwards starting notably with the Satyam fiasco. Post Satyam, corporate governance issuescame into the forefront and companies with poor corporate governance practices came intolimelight with many such companies experienced an exodus of independent directors fromtheir boards (Chakrabarti et. al, 2011). However, the data in this paper stops at 2008 andhence misses many of these interesting cases. As we extend the Index for the later years andbring other important corporate governance mechanisms like related party transactions,remuneration patterns and accounting quality into the picture, it would be interesting tosee if the corporate governance index is able to identify the good and poorly governedcompanies which in turn should provide a test for the acceptability of the Index.
20

REFRENCES
Chakrabarti, Rajesh, Krishnamurthy, V. Subramanium, and Naresh Kotrike, 2011. Afterthe Storm: The unregulated effect of a corporate governance failure on the market fordirectors. Working Paper, Indian School of Business and BITS Pillani.
Cooke, T. E. (1989). Disclosure in the corporate annual reports of Swedish companies.Accounting and Business Research, 19 (74), pp. 113-124.
Demsetz, Harold and Kenneth Lehn, 1985. The Structure of Corporate Ownership: Causesand Consequences. Journal of Political Economy, Vol. 93, No. 6 (Dec., 1985), pp. 1155-1177.
Fama, Eugene F. and Kenneth R. French, 1993. Common Risk Factors in the Returns onStocks and Bonds”. Journal of Financial Economics, Vol. 33 (1): pp. 3+−56.
Hossein, M. and H. Hammami, 2009. Voluntary Disclosure in the Annual reports of Qataricompanies: An empirical Assessment. Advances in Accounting, Vol. 25, pp. 255-265.
Yermack, David, 1996. Higher Market Valuation of companies with Small Boards of Di-rectors. The Journal of Finance, Vol. 59, pp. 2281-308.
21

Appendix IGrouping of Companies Based on the Overall Corporate Governance Index
Mean value of CG Index: 64.18Standard Deviation of CG Index: 7.93
Groups: Classification Value of CG Index No. of CompaniesGroup 1: > Mean + 1.5*SD (>= 77) 14Group 2: Mean + 0.5*SD to Mean + 1.5*SD (69− 76) 144Group 3: Mean 0.5*SD to Mean + 0.5*SD (61− 68) 195Group 4: Mean 1.5*SD to Mean 0.5*SD (53− 60) 102Group 5: <= Mean 1.5*SD (<= 52) 45
Names within a group are in alphabetical order.
Company Name Group
Colgate-Palmolive (India) Ltd. 1Crisil Ltd. 1Gateway Distriparks Ltd. 1Glenmark Pharmaceuticals Ltd. 1Graphite India Ltd. 1H C L Technologies Ltd. 1H D F C Bank Ltd. 1Hexaware Technologies Ltd. 1Hindustan Unilever Ltd. 1Infosys Technologies Ltd. 1Piramal Healthcare Ltd. 1Punjab Tractors Ltd. 1South Indian Bank Ltd. 1Tata Steel Ltd. 13I Infotech Ltd. 2A B B Ltd. 2A C C Ltd. 2Aban Offshore Ltd. 2Aditya Birla Nuvo Ltd. 2Alstom Projects India Ltd. 2
22

Amtek Auto Ltd. 2Amtek India Ltd. 2Andhra Bank 2Aptech Ltd. 2Areva T & D India Ltd. 2Ashok Leyland Ltd. 2Asian Electronics Ltd. 2Aurobindo Pharma Ltd. 2Axis Bank Ltd. 2Bajaj Auto Finance Ltd. 2Bajaj Hindusthan Ltd. 2Bajaj Holdings & Invst. Ltd. 2Balaji Telefilms Ltd. 2Balkrishna Industries Ltd. 2Bank Of Baroda 2Bank Of Rajasthan Ltd. 2Bata India Ltd. 2Bharat Bijlee Ltd. 2Bharat Forge Ltd. 2Britannia Industries Ltd. 2C E S C Ltd. 2Carborundum Universal Ltd. 2Castrol India Ltd. 2Chambal Fertilisers & Chemicals Ltd. 2Cholamandalam D B S Finance Ltd. 2Cipla Ltd. 2Coromandel Fertilisers Ltd. 2Cranes Software Intl. Ltd. 2Cummins India Ltd. 2Development Credit Bank Ltd. 2Dishman Pharmaceuticals & Chemicals Ltd. 2Dr. Reddy’S Laboratories Ltd. 2E I D-Parry (India) Ltd. 2Eicher Motors Ltd. 2Electrosteel Castings Ltd. 2Entertainment Network (India) Ltd. 2Essel Propack Ltd. 2Exide Industries Ltd. 2Federal Bank Ltd. 2Financial Technologies (India) Ltd. 2Fortis Healthcare Ltd. 2
23

G M R Infrastructure Ltd. 2G T L Ltd. 2G V K Power & Infrastructure Ltd. 2Geojit Financial Services Ltd. 2Glaxosmithkline Consumer Healthcare Ltd. 2Glaxosmithkline Pharmaceuticals Ltd. 2Great Eastern Shipping Co. Ltd. 2Gujarat Alkalies & Chemicals Ltd. 2Gujarat Gas Co. Ltd. 2Gujarat N R E Coke Ltd. 2H C L Infosystems Ltd. 2Hero Honda Motors Ltd. 2Himatsingka Seide Ltd. 2Hinduja Ventures Ltd. 2Hindustan Oil Exploration Co. Ltd. 2Housing Development Finance Corpn. Ltd. 2I F C I Ltd. 2I N G Vysya Bank Ltd. 2I T C Ltd. 2I V R C L Infrastructures & Projects Ltd. 2Idea Cellular Ltd. 2India Cements Ltd. 2Indiabulls Financial Services Ltd. 2Indian Hotels Co. Ltd. 2Infotech Enterprises Ltd. 2Ispat Industries Ltd. 2J S W Steel Ltd. 2Jagran Prakashan Ltd. 2Jaiprakash Associates Ltd. 2Jaybharat Textiles & Real Estate Ltd. 2Jyoti Structures Ltd. 2K E C International Ltd. 2K S L & Industries Ltd. 2Karur Vysya Bank Ltd. 2Kesoram Industries Ltd. 2Kirloskar Oil Engines Ltd. 2Kotak Mahindra Bank Ltd. 2
24

M R F Ltd. 2Mahindra Lifespace Developers Ltd. 2Max India Ltd. 2Motherson Sumi Systems Ltd. 2N I I T Ltd. 2N I I T Technologies Ltd. 2Nagarjuna Construction Co. Ltd. 2Nava Bharat Ventures Ltd. 2Nestle India Ltd. 2Northgate Technologies Ltd. 2Novartis India Ltd. 2Nucleus Software Exports Ltd. 2Oracle Financial Services Software Ltd. 2Orchid Chemicals & Pharmaceuticals Ltd. 2Orient Paper & Inds. Ltd. 2P T C India Ltd. 2Panacea Biotec Ltd. 2Pantaloon Retail (India) Ltd. 2Parsvnath Developers Ltd. 2Peninsula Land Ltd. 2Prakash Industries Ltd. 2Procter & Gamble Hygiene & Health Care Ltd. 2Punj Lloyd Ltd. 2Rajesh Exports Ltd. 2Ranbaxy Laboratories Ltd. 2Reliance Capital Ltd. 2Reliance Industries Ltd. 2Reliance Infrastructure Ltd. 2Reliance Natural Resources Ltd. 2Sasken Communication Technologies Ltd. 2Satyam Computer Services Ltd. 2Sesa Goa Ltd. 2Shriram Transport Finance Co. Ltd. 2Siemens Ltd. 2Simplex Infrastructures Ltd. 2Strides Arcolab Ltd. 2Sun Pharma Advanced Research Co. Ltd. 2Sun Pharmaceutical Inds. Ltd. 2Sun T V Network Ltd. 2Sundram Fasteners Ltd. 2
25

Taj G V K Hotels & Resorts Ltd. 2Tata Consultancy Services Ltd. 2Tata Investment Corpn. Ltd. 2Tata Motors Ltd. 2Tata Power Co. Ltd. 2Tech Mahindra Ltd. 2Titan Industries Ltd. 2Trent Ltd. 2Tube Investments Of India Ltd. 2Tulip Telecom Ltd. 2United Breweries (Holdings) Ltd. 2United Breweries Ltd. 2United Spirits Ltd. 2Usha Martin Ltd. 2Varun Shipping Co. Ltd. 2Voltas Ltd. 2Welspun-Gujarat Stahl Rohren Ltd. 2Wipro Ltd. 2Wockhardt Ltd. 2Yes Bank Ltd. 2A B G Shipyard Ltd. 3A I A Engineering Ltd. 3Adani Enterprises Ltd. 3Adhunik Metaliks Ltd. 3Adlabs Films Ltd. 3Alembic Ltd. 3Alok Industries Ltd. 3Ambuja Cements Ltd. 3Anant Raj Inds. Ltd. 3Ansal Properties & Infrastructure Ltd. 3Apollo Hospitals Enterprise Ltd. 3Apollo Tyres Ltd. 3Ashapura Minechem Ltd. 3Asian Hotels Ltd. 3Asian Paints Ltd. 3Aventis Pharma Ltd. 3B F Utilities Ltd. 3Balrampur Chini Mills Ltd. 3Bayer Cropscience Ltd. 3Berger Paints India Ltd. 3
26

Binani Cement Ltd. 3Biocon Ltd. 3Birla Corporation Ltd. 3Blue Dart Express Ltd. 3Blue Star Ltd. 3Bombay Dyeing & Mfg. Co. Ltd. 3Bongaigaon Refinery & Petrochemicals Ltd. 3Bosch Ltd. 3C M C Ltd. 3Cadila Healthcare Ltd. 3Century Textiles & Inds. Ltd. 3Container Corpn. Of India Ltd. 3Core Projects & Technologies Ltd. 3D C M Shriram Consolidated Ltd. 3Dabur India Ltd. 3Dalmia Cement (Bharat) Ltd. 3Deccan Chronicle Holdings Ltd. 3Deepak Fertilisers & Petrochemicals Corpn. Ltd. 3Dish T V India Ltd. 3Divi’S Laboratories Ltd. 3Emco Ltd. 3Escorts Ltd. 3Ess Dee Aluminium Ltd. 3Essar Oil Ltd. 3Essar Shipping Ports & Logistics Ltd. 3F A G Bearings India Ltd. 3Finolex Cables Ltd. 3Finolex Industries Ltd. 3Fresenius Kabi Oncology Ltd. 3Future Capital Holdings Ltd. 3G H C L Ltd. 3G T L Infrastructure Ltd. 3Gillette India Ltd. 3Gitanjali Gems Ltd. 3Godrej Consumer Products Ltd. 3Godrej Industries Ltd. 3Grasim Industries Ltd. 3Great Offshore Ltd. 3Gujarat Fluorochemicals Ltd. 3Gujarat Industries Power Co. Ltd. 3Gujarat Narmada Valley Fertilizers Co. Ltd. 3Gujarat State Fertilizers & Chemicals Ltd. 3
27

Gujarat State Petronet Ltd. 3Gulf Oil Corpn. Ltd. 3H E G Ltd. 3H F C L Infotel Ltd. 3H T Media Ltd. 3Havells India Ltd. 3Himachal Futuristic Communications Ltd. 3Hindalco Industries Ltd. 3Hinduja Global Solutions Ltd. 3Hindustan Construction Co. Ltd. 3Hindustan Zinc Ltd. 3Honeywell Automation India Ltd. 3I C I C I Bank Ltd. 3I C I India Ltd. 3I C R A Ltd. 3I C S A (India) Ltd. 3I D B I Bank Ltd. 3I L & F S Investsmart Ltd. 3I S M T Ltd. 3I V R Prime Urban Developers Ltd. 3Indiabulls Real Estate Ltd. 3Indian Oil Corpn. Ltd. 3Indian Overseas Bank 3Indraprastha Gas Ltd. 3nfo Edge (India) Ltd. 3Infrastructure Development Finance Co. Ltd. 3Ipca Laboratories Ltd. 3J K Cement Ltd. 3J S L Ltd. 3Jaiprakash Hydro Power Ltd. 3Jammu & Kashmir Bank Ltd. 3Jet Airways (India) Ltd. 3Jindal Drilling & Inds. Ltd. 3Jindal Saw Ltd. 3Jindal South West Holdings Ltd. 3Jindal Steel & Power Ltd. 3Jubilant Organosys Ltd. 3K P I T Cummins Infosystems Ltd. 3K S Oils Ltd. 3Kalyani Steels Ltd. 3
28

Kansai Nerolac Paints Ltd. 3Kennametal India Ltd. 3Kirloskar Brothers Ltd. 3Koutons Retail India Ltd. 3L I C Housing Finance Ltd. 3Lakshmi Energy & Foods Ltd. 3Lakshmi Machine Works Ltd. 3Lanco Infratech Ltd. 3Madras Aluminium Co. Ltd. 3Maharashtra Seamless Ltd. 3Mahindra & Mahindra Financial Services Ltd. 3Mahindra & Mahindra Ltd. 3Marico Ltd. 3Maruti Suzuki India Ltd. 3Matrix Laboratories Ltd. 3Mercator Lines Ltd. 3Micro Inks Ltd. 3Mindtree Ltd. 3Monnet Ispat & Energy Ltd. 3Monsanto India Ltd. 3Moser Baer India Ltd. 3Motilal Oswal Financial Services Ltd. 3Mphasis Ltd. 3Nesco Ltd. 3New Delhi Television Ltd. 3Nirma Ltd. 3Onmobile Global Ltd. 3Opto Circuits (India) Ltd. 3P S L Ltd. 3P V P Ventures Ltd. 3Patel Engineering Ltd. 3Petronet L N G Ltd. 3Pidilite Industries Ltd. 3Polaris Software Lab Ltd. 3Praj Industries Ltd. 3Prism Cement Ltd. 3Provogue (India) Ltd. 3Pyramid Saimira Theatre Ltd. 3Radico Khaitan Ltd. 3Raymond Ltd. 3
29

Redington (India) Ltd. 3Reliance Communications Ltd. 3Reliance Industrial Infrastructure Ltd. 3Reliance Petroleum Ltd. 3Religare Enterprises Ltd. 3Rolta India Ltd. 3Rural Electrification Corpn. Ltd. 3S K F India Ltd. 3S R E I Infrastructure Finance Ltd. 3S R F Ltd. 3Sadbhav Engineering Ltd. 3Sanghi Industries Ltd. 3Shaw Wallace & Co. Ltd. 3Shipping Corpn. Of India Ltd. 3Shopper’S Stop Ltd. 3Shree Cement Ltd. 3Shree Renuka Sugars Ltd. 3Shriram E P C Ltd. 3Sintex Industries Ltd. 3Spicejet Ltd. 3State Bank Of Bikaner & Jaipur 3State Bank Of India 3State Bank Of Travancore 3Sterlite Industries (India) Ltd. 3Subex Ltd. 3Subhash Projects & Mktg. Ltd. 3Sundaram Finance Ltd. 3Sundaram-Clayton Ltd. 3Suzlon Energy Ltd. 3Swan Energy Ltd. 3T V S Motor Co. Ltd. 3Tanla Solutions Ltd. 3Tata Chemicals Ltd. 3Tata Communications Ltd. 3Tata Tea Ltd. 3Tata Teleservices (Maharashtra) Ltd. 3Techno Electric & Engg. Co. Ltd. 3Television Eighteen India Ltd. 3Texmaco Ltd. 3Thermax Ltd. 3
30
Torrent Pharmaceuticals Ltd. 3Triveni Engineering & Inds. Ltd. 3U T V Software Communications Ltd. 3Ultratech Cement Ltd. 3Union Bank Of India 3United Phosphorus Ltd. 3Videocon Industries Ltd. 3Vipul Ltd. 3Vishal Retail Ltd. 3Walchandnagar Industries Ltd. 3Wire & Wireless (India) Ltd. 3Wyeth Ltd. 3Zee Entertainment Enterprises Ltd. 33M India Ltd. 4Ahluwalia Contracts (India) Ltd. 4Ajmera Realty & Infra India Ltd. 4Akruti City Ltd. 4Alfa Laval (India) Ltd. 4Allahabad Bank 4Allied Digital Services Ltd. 4Arshiya International Ltd. 4Arvind Ltd. 4Asahi India Glass Ltd. 4Asian Star Co. Ltd. 4Astrazeneca Pharma India Ltd. 4B E M L Ltd. 4B L Kashyap & Sons Ltd. 4Ballarpur Industries Ltd. 4Bank Of India 4Bank Of Maharashtra 4Bharat Heavy Electricals Ltd. 4Bharti Airtel Ltd. 4Bhushan Steel Ltd. 4Bilcare Ltd. 4Bombay Rayon Fashions Ltd. 4Brigade Enterprises Ltd. 4Cals Refineries Ltd. 4Canara Bank 4Central Bank Of India 4Century Plyboards (India) Ltd. 4
31

Chettinad Cement Corpn. Ltd. 4Consolidated Construction Consortium Ltd. 4Corporation Bank 4Crompton Greaves Ltd. 4D L F Ltd. 4Dena Bank 4Dredging Corpn. Of India Ltd. 4E I H Ltd. 4Edelweiss Capital Ltd. 4Educomp Solutions Ltd. 4Elecon Engineering Co. Ltd. 4Emami Ltd. 4Era Infra Engg. Ltd. 4Everonn Systems India Ltd. 4Firstsource Solutions Ltd. 4Gammon India Ltd. 4Ganesh Housing Corpn. Ltd. 4Godfrey Phillips India Ltd. 4Greaves Cotton Ltd. 4Gujarat Mineral Devp. Corpn. Ltd. 4H M T Ltd. 4Himadri Chemicals & Inds. Ltd. 4Hotel Leelaventure Ltd. 4Housing Development & Infrastructure Ltd. 4I O L Netcom Ltd. 4Ibn18 Broadcast Ltd. 4India Infoline Ltd. 4Indian Bank 4Indusind Bank Ltd. 4Ingersoll-Rand (India) Ltd. 4J M Financial Ltd. 4Jai Corp Ltd. 4Jain Irrigation Systems Ltd. 4Kalpataru Power Transmission Ltd. 4Karnataka Bank Ltd. 4Kolte Patil Developers Ltd. 4Larsen & Toubro Ltd. 4Lupin Ltd. 4M I C Electronics Ltd. 4Madhucon Projects Ltd. 4
32

Madras Cements Ltd. 4Mahanagar Telephone Nigam Ltd. 4Maytas Infra Ltd. 4Mundra Port & Special Economic Zone Ltd. 4Nagarjuna Fertilizers & Chemicals Ltd. 4National Fertilizers Ltd. 4Network 18 Media & Invst. Ltd. 4Neyveli Lignite Corpn. Ltd. 4Oil & Natural Gas Corpn. Ltd. 4Orbit Corporation Ltd. 4Oriental Bank Of Commerce 4Patni Computer Systems Ltd. 4Phoenix Mills Ltd. 4Punjab National Bank 4Puravankara Projects Ltd. 4Ratnamani Metals & Tubes Ltd. 4Rei Agro Ltd. 4Reliance Power Ltd. 4Ruchi Soya Inds. Ltd. 4S Kumars Nationwide Ltd. 4Sarda Energy & Minerals Ltd. 4Shriram City Union Finance Ltd. 4Steel Authority Of India Ltd. 4Sterlite Technologies Ltd. 4Syndicate Bank 4Teledata Informatics Ltd. 4Thomas Cook (India) Ltd. 4Time Technoplast Ltd. 4Torrent Power Ltd. 4Uco Bank 4Uflex Ltd. 4Unitech Ltd. 4Vijaya Bank 4Voltamp Transformers Ltd. 4Zee News Ltd. 4Advanta India Ltd. 5Allcargo Global Logistics Ltd. 5Atlas Copco (India) Ltd. 5B G R Energy Systems Ltd. 5Bharat Electronics Ltd. 5
33

Bharat Petroleum Corpn. Ltd. 5Bharati Shipyard Ltd. 5Cairn India Ltd. 5Cambridge Solutions Ltd. 5Chennai Petroleum Corpn. Ltd. 5Engineers India Ltd. 5Everest Kanto Cylinder Ltd. 5Fertilisers & Chemicals, Travancore Ltd. 5G A I L (India) Ltd. 5Geodesic Ltd. 5Hindustan Copper Ltd. 5Hindustan Petroleum Corpn. Ltd. 5I R B Infrastructure Developers Ltd. 5I T I Ltd. 5Jai Balaji Inds. Ltd. 5Jyothy Laboratories Ltd. 5Kingfisher Airlines Ltd. 5Maharashtra Elektrosmelt Ltd. 5Mangalore Refinery & Petrochemicals Ltd. 5M M T C Ltd. 5N M D C Ltd. 5N T P C Ltd. 5National Aluminium Co. Ltd. 5Omaxe Ltd. 5Pfizer Ltd. 5Plethico Pharmaceuticals Ltd. 5Power Finance Corpn. Ltd. 5Power Grid Corpn. Of India Ltd. 5Prime Focus Ltd. 5Rashtriya Chemicals & Fertilizers Ltd. 5Shiv-Vani Oil & Gas Exploration Services Ltd. 5Sobha Developers Ltd. 5Spice Communications Ltd. 5State Bank Of Mysore 5State Trading Corpn. Of India Ltd. 5Sterling Biotech Ltd. 5Sterling International Enterprises Ltd. 5Take Solutions Ltd. 5Bosch Chassis Systems India Ltd. NACenturion Bank Of Punjab Ltd. NA
34

Note: This Corporate Governance Index is based on Board, Audit Committee, Auditor,and Aggregate Ownership characteristics. Other important aspects of governance likeRelated Party Transactions, Accounting and Earnings Quality, Meetings and Procedures,and Ownership Opacity etc. need to be incorporated. The grouping of companies is likelyto change with these incorporations. To this extent, the current groupings should be takenas interim. This is a preliminary version of the Index. Comments welcome.
35