
WP-2010 1 Berga CPAD 02 - International Potato...
55
ISSN 0256-8748 Social Sciences Working Paper No. 2010 - 1 Working Paper 2010-1 Markets for fresh and frozen potato chips in the ASARECA region and the potential for regional trade: Ethiopia, Tanzania, Rwanda, Kenya, Burundi and Uganda A. Tesfaye, B. Lemaga, J. A. Mwakasendo, Z. Nzohabonayoz, J. Mutware, K.Y. Wanda, P. M. Kinyae, O. Ortiz, C. Crissman, G.Thiele
Transcript of WP-2010 1 Berga CPAD 02 - International Potato...

ISSN 0256-8748Social SciencesWorking PaperNo. 2010 - 1
Wor
king
Pap
er 2
010-
1
Markets for fresh and frozen potatochips in the ASARECA region andthe potential for regional trade:Ethiopia, Tanzania, Rwanda, Kenya,Burundi and Uganda
A. Tesfaye, B. Lemaga, J. A. Mwakasendo, Z. Nzohabonayoz,
J. Mutware, K.Y. Wanda, P. M. Kinyae, O. Ortiz, C. Crissman, G.Thiele

I I

Wor
king
Pap
er
A. TesfayeEIAR-Ethiopia
B. LemagaCIP-Kampala
J. A. MwakasendoUyole Research Center-Tanzania
Z. NzohabonayozISABU-Burundi
J. Mutware5ISAR- Rwanda
K.Y WandaIITA/Foodnet-Uganda
P. M.KinyaeKARI-Kenya
O. Ortiz, C. Crissman, G. ThieleCIP-Lima
Markets for fresh and frozen potatochips in the ASARECA region and the
potential for regional trade:Ethiopia, Tanzania, Rwanda, Kenya,
Burundi and Uganda
4
Inte
rna
tio
na
l P
ota
to C
en
ter
• W
ork
ing
Pa
pe
r 1
© International Potato Center (CIP), 2010
ISSN 0256-8748
CIP publications contribute important development information to thepublic arena. Readers are encouraged to quote or reproduce materialfrom them in their own publications. As copyright holder CIP requestsacknowledgement, and a copy of the publication where the citationor material appears. Please send a copy to the Communication and PublicAwareness Department at the address below.
International Potato CenterP.O.Box 1558, Lima 12, [email protected] • www.cipotato.org
Produced by the CIP Communication and PublicAwareness Department (CPAD)
Correct citation:A. Tesfaye, B. Lemaga, J. A. Mwakasendo. Z.Nzohabonayoz, J. Mutware, K.YWanda, P. M.Kinyae, O. Ortiz, C. Crissman and G. Thiele. Markets for freshand frozen potato chips in the ASARECA region and the potential forregional trade: Ethiopia, Tanzania, Rwanda, Kenya, Burundi and Uganda.International Potato Center (CIP), Lima, Peru.Working Paper 2010-1. 44p.
LayoutZandra Vasquez
Printed in Peru by Comercial Gráfica SucrePress run: 150December 2010
Markets for fresh and frozen potato chipsin the ASARECA region and the potentialfor regional trade: Ethiopia, Tanzania,Rwanda, Kenya, Burundi and Uganda
The Social Sciences Working Paper Series is intended to advance social science knowledge about production and utilizationof potato, sweetpotato, and root and tuber crops in developing countries to encourage debate and exchange of ideas. Theviews expressed in the papers are those of the author(s) and do not necessarily reflect the official position of the InternationalPotato Center (CIP) or of the United States Agency for International Development of the United States Government.
Comments are invited.

iii
Table of Contents 1. Introduction ........................................................................................................................................................... 1 Objectives of the study....................................................................................................................................... 2 Specific objectives................................................................................................................................................ 2 2. Literature review................................................................................................................................................... 2 3. Methodology ......................................................................................................................................................... 7 4. Results and discussions ....................................................................................................................................10 4.1 Ownership of retail outlets in ECA countries....................................................................................12 4.2 Experiences of retail outlets ...................................................................................................................12 4.3 Socio-economic characteristics of households ...............................................................................12 4.3.1 Age of respondents.........................................................................................................................12 4.3.2 Family sizes of households...........................................................................................................13 4.4 Source and qualities of processing potatoes ...................................................................................13 4.4.1 Sources of potatoes for chips processing................................................................................13 4.4.2 Quality attributes of potatoes preferred for chips processing.........................................15 4.4.3 Consumer preferences of potato products in retail outlets..............................................16 4.4.4 Consumer preferences of potato products in households................................................17 4.5 Chips processing practices in the ECA countries ............................................................................17 4.5.1 The status of chips processing in retail outlets......................................................................17 4.5.2 The status of chips processing in households .......................................................................19 4.5.3 Quantity of chips processed in retail outlets, households and processors..................20 4.5.4 Economic profitability of chips processing in retail outlets ..............................................21 4.5.5 Import and export status of frozen chips in ECA countries...............................................23 4.5.6 The cold store chain for chips......................................................................................................24 4.5.7 Transportation chain for chips ....................................................................................................25 4.5.8 Credit facilities in ECA countries.................................................................................................25 4.5.9 The status of trade tariffs in ECA countries ............................................................................. 27 4.6 Marketing channels of chips in the ECA countries .........................................................................28 4.6.1 Scenario 1: Retail outlets as a source of chips........................................................................28 4.6.2 Scenario 2: Processors as a source of chips.............................................................................29 4.6.3 Scenario 3: Imports as a source of chips ..................................................................................29 4.7 Demand trends of chips ..........................................................................................................................30 4.8 Future prospects and potentials of regional trade in frozen chips...........................................31 4.8.1 Scenario analysis..............................................................................................................................31 4.8.2 Projections .........................................................................................................................................34 4.9 Cross-cutting problems in chips processing and trade in the ECA region.............................35 5. Conclusion and recommendations ..............................................................................................................38 5.1 Conclusions..................................................................................................................................................38 5.2 Recommendations ....................................................................................................................................39 5.2.1 Major intervention options ..........................................................................................................39 5.2.2 Stakeholders involvement and their major roles..................................................................40 6. References.................................................................................................................................................................43

I V
List of Tables Table 1. Sample cities and towns representing production and consumption zones......................7 Table 2. Samples sizes (number) selected for the study in the six countries of ECA..........................8 Table 3. Ownership of sampled hotels in ECA countries. ......................................................................... 10 Table 4. Registered Hotels and Restaurants in Nairobi in 1997 and 2004. ......................................... 11 Table 5. Age of sample respondents in the households of ECA countries......................................... 13 Table 6. Family sizes of sample households in the ECA countries ........................................................ 13 Table 7. Commonly available and preferred potatoes for chips processing
in the study countries. ......................................................................................................................... 15 Table 8. Quality attributes of potatoes required for chips processing in retail outlets of ECA
countries................................................................................................................................................... 15 Table 9. Retail outlets that did not get potatoes with required quality attributes
for chips making in ECA countries. .................................................................................................. 15 Table 10. Potato products consumed in retail outlets in the study countries..................................... 16 Table 11. Consumer preferences of chips in the retail outlets of ECA countries. ............................... 16 Table 12. Most consumed forms of potato products by households in ECA countries. .................. 17 Table 13. Processing practices of chips in retail outlets of ECA countries. ........................................... 18 Table 14. Status of chips processing enterprises in ECA countries. ........................................................ 18 Table 15. Households processing chips in the study countries................................................................ 20 Table 16. Average quantity of chips (tons/annum) processed in retail outlets and
households of some ECA countries................................................................................................. 21 Table 17. Economic profitability of processing 100 kg of potatoes into chips in Tanzania. ........... 21 Table 18. Economic profitability of processing 100 kg of potatoes into chips in Ethiopia ............. 22 Table 19. Economic profitability of processing 100 kg of potatoes into chips in Burundi. ............. 22 Table 20. Economic profitability of processing 100 kg of potatoes into chips in Rwanda.............. 23 Table 21. Annual demand trends of chips consumption in retail outlets of ECA countries ........... 30 Table 22. Price comparisons of domestically processed and imported chips in ECA countries.... 32 Table 23. Estimates of potential chips production in ECA countries by 2008 and 2015.................. 34 List of Figures Figure 1. The study countries in Eastern and Central Africa (ECA).............................................................9 Figure 2. Volumes of potato consumption in hotels and restaurants in Nairobi
between 1997 and 2004...................................................................................................................... 11 Figure 3. Proportion of bars and restaurants established in Ethiopia under different
economic systems................................................................................................................................. 12 Figure 4. The simple marketing channel of locally processed chips for scenario 2 .......................... 29 Figure 5. The simple marketing channel of imported chips for scenario 3.......................................... 29 Figure 6. Potential of chips processing in the ASARECA region .............................................................. 35

v
Abstract Potato is an important food and cash crop in eastern and central African countries. Potato
production is growing faster than other major root crops and cereals. Yields are low due to
shortage of appropriate varieties, chronic shortage of quality seed of the improved varieties,
suboptimal cultural practices, and poor access to market.
Most potatoes produced in the ECA region are consumed fresh, mainly boiled. With population
doubling every 25 years and urbanization continuing to grow by 13% in the next 10 years,
feeding habits are rapidly changing in favor of easy-to-prepare foods such as chips. There is good
potential for the growth of processing industry and also good market access for both fresh and
frozen potato chips in the region. This study was conducted to make available baseline data on
chips consumption, processing, marketing, potential for regional chips trade and its contribution
towards improving the farmers livelihoods in the ECA region. The study was carried out from
2004 to 2006 in Burundi, Ethiopia, Kenya, Rwanda, Tanzania and Uganda. Two to three cities or
towns in each of the countries were selected. A survey was made of household consumers,
hotels, bars and restaurants using a structured questionnaire. Further information was also
collated from supermarkets and local processors.
Demand for potato chips is increasing in the ECA region at household and retail outlets, with
most of the growth in the retail outlets such as hotels, restaurants and supermarkets. On average
77% of the high income and 57% of the low income households process their own chips; similarly
80% of the retail outlets process chips for their own consumption. Chips processed in households
and retail outlets are fresh and usually of poor quality. It is very common to find chips of variable
thickness and length in a given package. Despite poor quality, chips processing in retail outlets is
economically viable with net profits from processing 100 kg of potatoes ranging from US$ 11.0 in
Tanzania to US$ 126.0 in Rwanda. At the time of the study Kenya had only one frozen chips (Njoro
Canning) and four chilled chips processors, Uganda had one chilled chips processor, while the
rest of the countries had none.
V I
Due to lack of adequate and constant supply of good quality chips, five star hotels and big
supermarkets import frozen chips either from South Africa or Europe at high prices. In Kenyan
supermarkets chips made by Njoro Canning were selling much faster than imported ones
because quality was acceptable and prices lower. In Kenya, Tanzania, Ethiopia and Uganda the
prices of imported chips are higher than locally made chips by 632%, 198%, 228% and 301%,
respectively. The experience of Njoro Canning shows that the region has potential to produce
acceptable quality chips if potato varieties appropriate for chips making are available and the
supply is reliable. This would save large amounts of hard currency for the region in the form of
import substitution and the consumers would have access to acceptable quality chips at
reasonable prices.
The potential for regional chips trade, especially frozen chips, looks very promising because of
the existence of Common Market for Eastern and Southern Africa (COMESA) and East African
Community (EAC) whose polices favour inter-regional trade in goods and services, and all the
study countries are party to one or both.
Although regional chips trade is potentially lucrative, bottlenecks include limited access to
processing varieties and processing machines, limited knowledge of processing techniques, high
costs of electricity, lack of standards, insufficient and poor storage and transport facilities, poor
road network infrastructure, inefficient utility service providers, lack of strong farmer associations,
limited flow of information, and inadequate financial intermediaries. Moreover, loose linkages
and partnerships between research, farmer organizations and stakeholders stand out as an
important constraint.
To realize the benefits of regional chips trade for smallholder potato farmers and other
stakeholders, improved access to appropriate varieties for processing, wide-spread knowledge of
processing techniques, access to processing machines, strong links and partnerships between
research, NGOs, farmer organizations, potato producers, processors and traders and enabling
regional polices are vital. Working very closely with COMESA and EAC is of paramount
importance to have an enabling regional policy in place.

vii
Acknowledgments The study team would like to extend its deepest gratitude to PRAPACE for its financial support
and technical backstopping. ECAPAPA supported the study in Uganda, which is duly
acknowledged. NARS of participating countries (EIAR-Ethiopia, KARI-Kenya, ISAR-Rwanda, ISABU-
Burundi, Ministry of Agriculture, Food Security and Cooperatives of Tanzania) and IITA/Foodnet)
are also highly acknowledged for their favorable administrative services and implementing the
studies. We would also like to extend our gratitude to respondents for their cooperation in
providing the information. This study was conducted by a team of scientists from each of the
participating countries under the leadership of a socio-economist from EIAR-Ethiopia.
During the survey a number of managers of hotels, and bars & restaurants and their staff,
households, processors, traders and NGOs were contacted and visited. We sincerely thank them
for their willingness to interact with us and share their ideas, opinions, fears, critics and
experiences.
The study was funded by USAID-EA through ASARECA, both of whom we sincerely thank.

V I I I

M A R K E T S F O R F R E S H A N D F R O Z E N P O T A T O C H I P S I N T H E A S A R E C A 1
Markets for fresh and frozen potato chips in the ASARECA region and the potential for regional trade: Ethiopia, Tanzania, Rwanda, Kenya, Burundi and Uganda
1. INTRODUCTION
The markets for fresh and processed potatoes are distinct. In many countries the important
source of new growth in demand is from the processed potato market, especially chips also
called “French fries.” In industrial countries potatoes are mostly eaten in processed form, with the
largest volume as chips. According to the reports of Global AgriSystem (2005), total world trade of
potato fries is estimated at 2.5 Million MT for 2000/01. The report also indicated that Netherlands,
Canada, and USA are the major players contributing more than 90% of the trade. India is also
becoming a substantial market for frozen French fries. It was also noted that the frozen French
fries market in India is at a nascent stage with production in quality sector of over 3500 tons per
annum, but it is growing at the rate of about 25% per year. The estimated domestic production of
French fries in India is about 500 MT. It was reported that in 2005 US exports of frozen French fry
only to mainland China was about 227,000 tons and to Greater China about 454,000 tons (Zhang
et al. 2009).
In contrast, most potato in the ASARECA region is sold fresh and unprocessed. However, there is
considerable potential to expand the consumption of processed potato products in urban
centers in the ASARECA region. Potato is widely produced in the ASARECA region, ensuring a
potentially reliable supply throughout the year. Moreover, potato is a common menu for most of
the population, consumed in different ways. This context helps facilitate the expansion of potato
consumption by adding value in processed form, mainly chips. The increased demand creation in
turn helps boost potato production through utilization of improved technologies and
innovations.
Adequate baseline information is lacking in the Eastern and Central Africa (ECA) region on potato
processing and marketing practices. Hence, there is a strong need to investigate the potential of
fresh and frozen potato chips and crisps (called chips in the US) processing and marketing to
increase the contribution of potatoes to improving the livelihoods of the poor in the region.
C I P • S O C I A L S C I E N C E S W O R K I N G P A P E R 2 0 1 0 - 1
2 M A R K E T S F O R F R E S H A N D F R O Z E N P O T A T O C H I P S I N T H E E C A
This study assessed the existing scenarios and potential of chips processing for the domestic and
export markets. The recommendations will lead to improved potato processing and marketing
and increased production and productivity of potato through increased utilization of potato
technologies. This will boost the potato sub-sector and contribute to CIP’s aim to enhance
productivity, value addition and competitiveness of potato system in eastern and central Africa.
Objectives of the study The major objective of the study is to facilitate the development of a processed potato industry
to improve livelihoods and increase incomes of communities in the ECA region.
Specific objectives
Assess consumer preferences for chips in the retail outlets and households.
Estimate the quantity of fresh and frozen chips processed and sold in the retail outlets.
Assess the status and practices of chips processing industry in the ECA region.
Describe and analyze the refrigerated storage and refrigerated transport infrastructure
(the cold-store chain).
Describe and analyze the status of trade tariffs for frozen chips in the ECA region.
Identify and prioritize the constraints related to chips processing sector in the ECA
region and suggest appropriate recommendations to stimulate the development of the
sub-sector.
Assess the potential of fresh and frozen chips as a new source of demand for potatoes in
the ECA region.
The outputs of this study will be extensively and strategically disseminated to beneficiaries
through various mechanisms, including publications, workshops, seminars and websites.
2. LITERATURE REVIEW
Evidence suggests that the potato sub-sector is expanding, with more value added products,
such as potato chips, mainly due to increasing demands associated with growth of population
and urbanization. Population in Sub-Saharan Africa (SSA) is doubling every 25 years (Seyfu, 2004).
Poverty is widespread in SSA accounting for 32% of the world’s poor, and 50% of the population
lives on less than $1 per day. The FAO estimate (cited by Seyfu, 2004) also indicates that there are
more than 180 million hungry people in Africa and food needs will double by the year 2025. In
Africa, urban population is currently 40% and it will be 60% 20 years from now, implying that the
issue of food security will remain high on the agenda of the region.

C I P • S O C I A L S C I E N C E S W O R K I N G P A P E R 2 0 1 0 - 1
M A R K E T S F O R F R E S H A N D F R O Z E N P O T A T O C H I P S I N T H E E C A
3
Reports have shown that potato sub-sector in Africa is expanding faster. For instance, during the
period 1998-2004, estimates indicate that over 18 million metric tons of potato worth over
US$1.9 billion was produced in Burundi, D. R. Congo, Eritrea, Ethiopia, Kenya, Madagascar,
Rwanda, Sudan, Tanzania and Uganda (Berga and Nsumba, 2005). Potato production has also
expanded to non-traditional areas. Adoption of improved varieties has also significantly
improved household food security and income. It was also reported that regionally released
varieties are being used for processing instead of imported ones in a few cases, substituting for
imports. For instance, the use of processing potato varieties, such as Asante and Tigoni in Kenya
resulted in an aggregate annual net benefit of KSh 10 million (Kabira, 2002). These varieties
covered approximately 10% of all the area under potato production in 2002. Farmer-based
improved seed production was also found to be economically viable. For instance, in Uganda,
mean returns of 216% and 82% were obtained in 1998 and 1999, respectively, while in Kenya the
use of Asante and Tigoni potato varieties increased farmers’ returns by 22 – 53%. In Ethiopia,
ownership of livestock and other animals has increased and overall living standards greatly
improved from the incomes of improved potato sales (Agajie et al., 2002). In ECA, the net margin
has increased by 280% by using improved potato varieties as compared to the use of traditional
varieties. This evidence implies a huge potential for the expansion of the market for processed
potato products, especially chips, in eastern and central African region.
FAO statistics of 2002 also indicate the fast growth of the potato sub-sector in Sub-Saharan Africa
(SSA). The area under potato in SSA accounts for about 5% of the world potato area and it
increased by about 250% in 2001 as compared to 1993. The area under potato in the eastern and
central African region accounts for 71% of the total area In SSA. The statistics also indicate that
the rate of growth in area coverage of potato in SSA is faster than other crops such as wheat, rice,
maize, sweetpotato, cassava and yams. This is true partly because commercially-oriented farmers
are responding to increased demand from the growing urban centers and subsistence-oriented
farmers are responding to shrinking farm sizes. The revenue from potatoes is generally 10 times
greater than that from grains. Policy makers have also noticed and believed that potato exports
offer a potential source of foreign exchange. The findings also indicate that in most SSA countries
potato is a highly commercial crop. Hence, to avoid the risks of commodity trade, policy makers
seek value addition as part of trade through potato chips.
FAO statistics also indicate that world potato exports increased from 2% in 1983 to 5% in 2001.
The value of frozen world potato trade has increased by about 10 times in 2001 as compared to
the year 1980. This was because, frozen potato market is growing rapidly as a result of growth in
franchised fast food restaurants, growth in global processing capacity especially among major
C I P • S O C I A L S C I E N C E S W O R K I N G P A P E R 2 0 1 0 - 1
4 M A R K E T S F O R F R E S H A N D F R O Z E N P O T A T O C H I P S I N T H E E C A
processors. Moreover, rising incomes and urbanization, and lower tariffs from WTO have
contributed to the growth of frozen potato market. However, the value of export share of SSA in
frozen potato trade was insignificant (about 0.07%) of world total.
Sub-Saharan Africa exports frozen potato worth $1,348,000 (9 exporters), while its imports are
valued $5,083,000 (30 importers). Trade and production data indicate the potential of expanding
potato production generally in SSA and particularly in the ASARECA region.
One of the factors that contributed to the fast growth of the potato sub-sector in general and
processed potato products, particularly chips is the growth of urbanization. Potato chips were
introduced as street food in cities and towns and consumption will increase as urbanization
increases.
Crissman (2001) observed that national development goals have to focus on agriculture-led
economic growth through agro-industrialization, such as connecting farmers to value added
markets. It was also noted that cross-border trade responds to different price cycles in nearby
markets. For instance, high prices in Nairobi and low prices in Kampala induce flow into Kenya.
Moreover, different cropping seasons among the regions induce cross border trades, although
such trades are often unrecorded. For instance, the 1994-1995 survey of 11 Kenya-Uganda border
posts found $1.8 Million in unrecorded root and tuber exports to Kenya. Such scenarios shed light
on the possibility of strengthening regional trade.
Kabira (2002) indicated that some of the processing companies have plans to explore the
possibility of exporting frozen chips to the neighboring countries. The processors also look for
local markets in institutions like colleges, schools, hospitals, the armed forces and other
companies. These companies have requested research institutes, such as, KARI-Tigoni to
introduce another variety with similar or superior chipping characteristics to Tigoni to reduce
dependency on one variety. Kabira's report suggests that since some processors are looking for
options of export to neighboring countries, availing information on regional trade will be of great
help.
A study by Agajie, et al. (2002) on production and marketing of potato in Ethiopia indicates that
the total acreage of potato in Ethiopia exceeds 160,000 hectares with an annual production of
1.28 million tones. The production and use of potatoes has also shown a rapid increase in the
highlands and mid-altitude areas compared to the 30,000 hectares under potatoes in the early
1980’s. The current national average yield of potato in Ethiopia is estimated at 8 t/h. Moreover,

C I P • S O C I A L S C I E N C E S W O R K I N G P A P E R 2 0 1 0 - 1
M A R K E T S F O R F R E S H A N D F R O Z E N P O T A T O C H I P S I N T H E E C A
5
the post-harvest loss of potato is estimated at 30-50%. This prompted research to improve the
productivity and reduce post-harvest loss of potato. As a result, several improved varieties and
associated post-harvest handling techniques have been generated, and productivity has
improved to as high as 25 to 40 t/ha. This could lead to an increase in the national annual
production of potato of between 4.0 and 6.4 million tonnes. The study has also indicated that
potato is one of the most important sources of on-farm incomes for the farmers in Ethiopia. In
areas where there is relatively good market infrastructure, potato has become the leading cash
crop and one of the most important food security crops to farmers. One of the major problems in
potato marketing was low prices offered for ware potato. This was because consumption of
potato is not diversified. This suggests the need for assessing chips processing sub-sector and the
potential of expanding the market both domestically and regionally.
According to potato production and marketing study in Kenya by Okoboj (2001), annual
production of potato in 1996 was about 499,000 metric tons. The study indicated that the author
did not get any information concerning potato exports from Kenya to other countries in the
region. However, it was unofficially estimated that about 10 trucks offload 40 feet trailer loads of
potatoes weekly from Tanzania. This indicates that the demand for potato is high in Nairobi and
the local supply deficit is supplemented by imports.
According to FAO estimates (www.faostat.org), Kenya produced only 360,000 metric tons in 2000
compared to 478,000 metric tons produced by Uganda. However, it is known that Kenya has a
higher per capita consumption of potato products in urban areas than Uganda. All these statistics
positively illustrate the possibility of expanding urban markets with processed potato products.
There is limited formal and informal trade taking place along the Uganda-Rwanda border
(Okoboj, 2001). The study identified potato chips as the most popular potato product in urban
areas evidenced by the increasing number of fast food outlets. The study also indicated limited
border traders. For instance, some traders import potato from Rwanda to Uganda through the
Katuna border. Potato trade between Uganda and Rwanda exists informally along other smaller
border crossings in Kabale and Kisoro, such as the Kyanika border. Some traders occasionally
bring potatoes from eastern D. R. Congo. This evidence indicates the possibility of strengthening
cross border trades to enhance the production and productivity of potato. Such existing practices
could be strengthened through formal support to ensure the availability of potato as a raw
material for chips processing industries.
In general, evidence illustrates the considerable demand that exists for potatoes and potato chips
in the world in general and in SSA countries in particular. Among the SSA sub-region, a large
C I P • S O C I A L S C I E N C E S W O R K I N G P A P E R 2 0 1 0 - 1
6 M A R K E T S F O R F R E S H A N D F R O Z E N P O T A T O C H I P S I N T H E E C A
proportion of potato is produced in the ASARECA region, implying considerable potential to
expand chips marketing among the countries involved. In the ASARECA region, potato is one of
the most important food security crops consumed by a large proportion of the population.
However, there is a lack of market research on fresh and frozen potato chips processing,
consumption and marketing in eastern and central African region. This report, therefore, bridges
such a gap and presents baseline information on chips processing, consumption and marketing
practices in selected major cities and towns of Ethiopia, Tanzania, Uganda, Rwanda, Burundi and
Kenya. Moreover, the report investigates the potential that exists for chips processing,
consumption and marketing as a new source of demand for potatoes.
C I P • S O C I A L S C I E N C E S W O R K I N G P A P E R 2 0 1 0 - 1
M A R K E T S F O R F R E S H A N D F R O Z E N P O T A T O C H I P S I N T H E E C A
7
3. METHODOLOGY
3.1 The study sites The study was conducted in six eastern and central African (ECA) countries: Burundi, Ethiopia,
Kenya, Rwanda, Tanzania and Uganda (Figure 1). The study in Ethiopia, Kenya and Uganda was
conducted in 2004/05, while the one in Tanzania, Rwanda and Burundi was conducted in
2005/06. Two to three cities or towns in each of the six countries were selected for the study
based on potato consumption or production (Table 1). Respondents of the cities were stratified
into three homogenous categories based on their status of consumption and processing of
potato chips. These were Hotels, Bars and Restaurants, and Households. In addition to these,
information was collected from supermarkets and local processors. Since the processing and
consumption practices of chips are closely related to different standards and level of wealth,
hotels were further stratified into Five, Three, and One-star Hotels, while Bars and Restaurants
were stratified into High and low Class categories. Households were stratified into High and Low
Income groups.
Table 1. Sample cities and towns representing production and consumption zones.
Country City/town representing potato
consumption zone City/town representing potato production zone
Ethiopia Addis Ababa, Nazreth Awassa Kenya Mombassa Nairobi Uganda Kampala Kabale Tanzania Dar Es Salaam Arusha Rwanda Kigali Gisenyi Burundi Bujumbura Kayanza
When selecting the required samples of all the categories, a city or town was divided into
different segments to make sure that every part of the city or town was included in the study. A
total sample size of 225 Hotels, 317 Bars and Restaurants, and 948 household consumers and six
chips processing companies were selected for the study (Table 2).

C I P • S O C I A L S C I E N C E S W O R K I N G P A P E R 2 0 1 0 - 1
8 M A R K E T S F O R F R E S H A N D F R O Z E N P O T A T O C H I P S I N T H E E C A
Table 2. Sample sizes for the study in the six countries of ECA.
Country Towns Hotels Bars & Restaurants
Households Processing companies
Addis Ababa 31 26 83 - Nazreth 14 16 59 Awassa 17 14 69
Ethiopia
Sub-total 62 56 211 Nairobi 15 19 89 5 Mombassa 26 16 76
Kenya
Sub-total 41 35 165 Uganda Sub-total 46 72 176 1
Bujumbura 23 41 93 -
Kayanza 6 5 51
Burundi
Sub-total 29 46 144
Dar Es Salam 5 28 70 - Arusha 8 12 70
Tanzania
Sub-total 13 40 140 Kigali 23 42 67 - Gisenyi 11 26 45
Rwanda
Sub-total 34 68 112 Grand Total 225 317 948 6
3.2 Data collection techniques and analytical tools Three data collection stages were employed. In the first stage, extensive background information
was collected from secondary sources, including published and unpublished materials, and web
sites to deepen understanding of the marketing systems of processed potato products. In the
second stage, descriptive information was collected from key informants and groups of
respondents using a checklist. In this stage, a rapid market assessment survey was conducted to
collect qualitative preliminary information from key informants and groups of respondents using
a guideline. The first two stages helped design an appropriate questionnaire. In the third stage,
the structured questionnaire was developed for different strata of respondents.
Three types of structured questionnaires were developed for different strata of respondents:
Hotels, Bars and Restaurants, and households to collect quantitative information. The
questionnaire was pre-tested to verify the validity of questions and the time for interviews. Even
though the standard questionnaire was developed, some modifications were made after pre-
testing according to the local circumstances of each country. Enumerators were recruited and
trained to enable them to collect quality data using questionnaires. Data collected were
processed using Excel and SPSS packages.

C I P • S O C I A L S C I E N C E S W O R K I N G P A P E R 2 0 1 0 - 1
M A R K E T S F O R F R E S H A N D F R O Z E N P O T A T O C H I P S I N T H E E C A
9
Figure 1. The study countries in Eastern and Central Africa (ECA).

C I P • S O C I A L S C I E N C E S W O R K I N G P A P E R 2 0 1 0 - 1
10 M A R K E T S F O R F R E S H A N D F R O Z E N P O T A T O C H I P S I N T H E E C A
4. RESULTS AND DISCUSSIONS
4.1 Ownership of retail outlets in ECA countries The findings established that the main retail outlets for potato chips were hotels, and restaurants
and bars. In Ethiopia, Kenya, Burundi and Rwanda 77%, 99%, 88%, and 95%, respectively of the
retail outlets were privately owned (Table 3). On the other hand, in Uganda and Tanzania, all the
retail outlets were privately owned. Generally, privately owned hotels are more likely to be free
and flexible in decision making, risk taking and are more profit-oriented than those owned by the
government. The implication is that the chances for easy adoption of new chips processing
technologies and expansion of chips in these countries are high.
Table 3. Ownership of sampled hotels in ECA countries.
Ownership ET Ke Rw Bu All countries n % n % n % n % n % Private 47 77 75 99 30 88 71 95 223 91 Government 14 23 1 1 4 12 4 5 23 9 Total 61 76 34 75 246
ET – Ethiopia, Ke – Kenya, Rw – Rwanda, Bu – Burundi
Moreover, all governments in the ECA region are increasingly privatizing state-owned enterprises
aimed at enhancing their efficiency and competitiveness in the free market economic systems.
Thus, the opportunity for development of the potato chips industry, among others, seems to be
promising.
4.2 Experiences of retail outlets The data showed varied scenarios in the hotels and other retail outlets. In Ethiopia, for example,
the hotels had 20 years of experience on average ranging from 1 to 57 years and establishment of
three star hotels dated back to early 1950’s, while one-star hotels were established since late
1940’s. In the case of Kenya, the hotels interviewed had on average 25 years of experience
ranging from 1 to 102 years. Establishment of five-star hotels dated back to 1902 and that of
three-star hotels to early 1950’s, while most of the one-star hotels started in early 2000. This trend
of hotel and restaurant establishment and development (Table 4) seems to have a direct effect on
consumption of potato products (Figure 2). This indicates a 117% growth in volume of potatoes
consumed by restaurants from 1997 to 2004, which translates to a simple 16.7% growth per
annum.

C I P • S O C I A L S C I E N C E S W O R K I N G P A P E R 2 0 1 0 - 1
M A R K E T S F O R F R E S H A N D F R O Z E N P O T A T O C H I P S I N T H E E C A
11
Table 4. Registered Hotels and Restaurants in Nairobi in 1997 and 2004.
Hotels Bars & Restaurants
Year 1997 2004 1997 2004
Nairobi 434 443 587 1275
Mombassa 201 268 210 165
Other Towns 1485 1541 723 707
National Total 2120 2252 1520 2147
(Source: Kirumba et al., 2004)
In all the cities that were sampled for this study, chips are a common menu item in all the bars
and restaurants which are either parts of the hotels or independent or particularly franchised-
type fast food restaurants. In all cities that have influx of tourists like Mombassa, hoteliers use
menus that are familiar to the visiting tourists and such menus invariably include chips.
Figure 2. Volumes of potato consumption in hotels and restaurants in Nairobi between 1997 and 2004.

C I P • S O C I A L S C I E N C E S W O R K I N G P A P E R 2 0 1 0 - 1
12 M A R K E T S F O R F R E S H A N D F R O Z E N P O T A T O C H I P S I N T H E E C A
The trend for establishment of bars and restaurants is illustrated by the data from Ethiopia (Figure
3). It indicates that 67% of the bars and restaurants were established recently during the free
market economy. The current free market system of economy has encouraged private
investments, including establishment of bars and restaurants with a corresponding increase in
demand for fast foods, among which chips are rated highly.
Trends similar to this were also observed in the other ECA countries. Therefore, the increasing
numbers of such business enterprises gives an indication that there will be a growing demand for
potato chips in the region.
4.3 Socio-economic characteristics of households 4.3.1 Age of respondents
Age is one of the socio-economic factors associated with utilization of chips and adoption of
chips processing technologies. The average age of the overall sample respondents within the
study areas of Burundi, Ethiopia, Kenya, Uganda and Rwanda was 39 years ranging from 11 to 75
(Table 5). If we assume that a person starts an independent family life at 19 years of age, a
household on average has 20 years of experiences.
Figure 3. Proportion of bars and
restaurants established in Ethiopia under different
economic systems.

C I P • S O C I A L S C I E N C E S W O R K I N G P A P E R 2 0 1 0 - 1
M A R K E T S F O R F R E S H A N D F R O Z E N P O T A T O C H I P S I N T H E E C A
13
Table 5. Age of sample respondents in the households of ECA countries
Country Burundi Ethiopia Kenya Uganda Rwanda Buj Kay AA Na Aw Nb Msa Kla Kbl Ki Gis
All countries
N 82 51 83 57 69 89 76 116 60 67 45 795 Mean 38 35 32 42 32 39 59 35 34 43 43 39 Minimum 15 13 19 22 23 11 16 18 18 32 30 11 Maximum 75 70 60 61 53 55 85 60 60 55 51 75
n= Sample size
Buj – Bujumbura, Kay – Kayanza; AA – Addis Ababa, Na – Nazreth, Aw – Awassa; Nb – Nairobi, Msa – Mombassa; Kla – Kampala, Kbl – Kabale, Ki – Kigali, Gis - Gisenyi
The mean ages were higher in the city areas that were designated consumption areas and they
varied from 32 in Addis Ababa and Awassa (Ethiopia) to 59 in Mombassa (Kenya). The maximum
age of respondents also had a similar trend with Gisenyi-Rwanda being lowest (51) and
Mombassa-Kenya highest (85).
4.3.2 Family sizes of households
The average family size of the sample households among the high and low income groups of the
respondents in Burundi, Ethiopia, Kenya, Rwanda and Uganda is seven and ranges from a mean
of 2 to 14 (Table 6). The average family sizes of high income households are higher than those of
the low income households. The size of family has a role to play in adopting technologies that
require human labor. For instance, chips processing technologies require labor for washing
potatoes, peeling, chips making and frying. Moreover, family size affects the demand for
products. Large family size, especially children and youths in a household in urban areas, might
imply more demand for chips and since the high income groups have larger households, this
creates a higher demand for foods associated with the rich such as chips.
Table 6. Family sizes of sample households in the ECA countries
Burundi Ethiopia Kenya Uganda Rwanda Country HI LI HI LI Hi LI HI LI HI LI
N 63 80 101 110 85 80 87 89 67 45 Mean 8 7 6 5 10 7 7 5 7 6 Minimum 2 2 2 1 1 1 2 1 3 3 Maximum 20 18 12 12 19 12 13 12 9 9
HI – High income, LI – Low income;
4.4. Source and qualities of processing potatoes 4.4.1 Sources of potatoes for chips processing
Each country had specific varieties preferred for chips processing (Table 7) which, however, was
affected by availability. In Ethiopia, 72% of the overall sample hotels purchase potatoes directly
from wholesale vegetable markets, while 28% of the hotels get potatoes directly supplied to

C I P • S O C I A L S C I E N C E S W O R K I N G P A P E R 2 0 1 0 - 1
14 M A R K E T S F O R F R E S H A N D F R O Z E N P O T A T O C H I P S I N T H E E C A
them on a daily basis. Direct delivery helps hotels to ensure sustainable supply of the required
quantity even at times of supply shortages. Potato varieties preferred by retail outlets in Ethiopia
are locally known as Shashemene, Durame, Tolcha and Jalene.
Most chips processors in Kenya sourced their potatoes from produce markets near them.
Availability in the market and price are the most important attributes chips processors consider
when buying potatoes, though shape and size were an important aspect as well. Varieties
preferred for making chips in Nairobi and Mombasa were Roslin Tana and Meru Mugaruro,
respectively. Other varieties were Tigoni and Kerr’s Pink, but the later was not commonly used
due to inconsistent supply and higher prices.
The most common source of potatoes in Uganda is the retail market followed by supermarkets.
An estimated 60% of the respondents from the high income class mentioned supermarkets as a
source for their potato. This indicates the change in marketing chain of food, especially for the
high income class. It also indicates a premium price for quality as the prices in supermarkets are
much higher than those in retail outlets. On the contrary, the most common source of potatoes
for the low income class is the retail market that enables low income consumers to obtain the
small quantities they normally buy.
In Tanzania, the retail markets were the major sources of potatoes for chips processing, while
some retail outlets obtain potatoes through suppliers. Source of potatoes for chips is mainly
determined by the amount of potato required. For example, a retail outlet that processes five or
six kilograms of potato per day may not require a supplier, while those that process 60 to 100
kilograms of potatoes per day require a supplier. A supplier finds it cheaper to buy from the
wholesaler than from a retailer. Retail market is also a source of potatoes for 78% of households
followed by wholesale market (15%). The common varieties preferred for chips processing are
locally named as Arka, Kidinya and Kikondo.
In Rwanda, there are no specific sources of potatoes for chips processing, instead potatoes are
selected based on required attributes. However, high standard hotels such as Kivu Sun in Gisenyi
and Intercontinental and Milles Collines in Kigali, have special suppliers who select good quality
potatoes and deliver directly to them. The two commonly used potato varieties for chips
processing are named Sangema and Mabondo.

C I P • S O C I A L S C I E N C E S W O R K I N G P A P E R 2 0 1 0 - 1
M A R K E T S F O R F R E S H A N D F R O Z E N P O T A T O C H I P S I N T H E E C A
15
The most important source of potatoes for 71% of retail outlets in Burundi is imports from
Rwanda, which is dominated by a popular variety for chips making called Ruhengeri. Other retail
outlets source their potatoes from local retail markets.
Table 7. Commonly available and preferred potatoes for chips processing in the study countries.
Country Commonly available and preferred potatoes for chips processing Ethiopia Shashemene, Durame, Tolcha and Jalene Kenya Kenya Faulu and Tigoni Rwanda Sangema, Mabondo Burundi Ruhengeri imported from Rwanda Uganda Rutuku and Victoria, Sangema, Tanzania Arka and Kidinya
4.4.2 Quality attributes of potatoes preferred for chips processing
The four important quality attributes required from potatoes for making quality chips are smooth
skin (86%), high dry matter content (84%), medium to large size (80%) and shallow eye depth
(79%). Table 8 presents quality attributes demanded for chips processing by each of the study
countries. Smoothness of skin has a direct association with extent of peeling loses. The smoother
the skin, the less the peeling loss will be. Potatoes with high dry matter content are believed to
yield quality and crispy chips. The size of potatoes is also associated with dimensions of chips, its
length and width. The bigger the size of potato, the more attractive the chips will be because of
length. For instance, in the case of Kenya the average yield of raw chips is between 50-75% of the
original weight, and the final chips (processed) yield is 30-45%. This very low recovery percentage
is as a result of poor quality of potato tubers. Potatoes endowed with these and other quality
attributes are most preferred for chips making. However, a large proportion of retail outlets (72%)
do not get potatoes that fulfill the required quality attributes (Table 9).
Table 8. Quality attributes of potatoes required for chips processing in retail outlets of ECA countries.
Ethiopia Burundi Tanzania Rwanda Uganda All countries Quality attributes n % n % n % n % n % n %
High dry matter content 68 58 49 65 -- -- 101 99 111 94 329 84 Medium to big size 52 44 72 96 41 77 102 100 78 66 345 80 White/cream color 66 56 50 67 11 21 97 95 20 17 244 69 Smooth skin 40 34 -- -- 49 93 100 98 108 92 297 86 Oval and round shape 49 42 45 60 -- -- -- -- -- -- 94 51 Shallow eye depth 47 40 41 54 -- -- 97 95 108 92 293 79
Table 9. Retail outlets that did not get potatoes with required quality attributes for chips making in ECA countries.
Country n % Ethiopia 118 75 Kenya 35 46 Burundi 24 32 Tanzania 36 68 Rwanda 92 90 All countries 305 72

C I P • S O C I A L S C I E N C E S W O R K I N G P A P E R 2 0 1 0 - 1
16 M A R K E T S F O R F R E S H A N D F R O Z E N P O T A T O C H I P S I N T H E E C A
4.4.3 Consumer preferences of potato products in retail outlets
In almost all the ECA countries, potato is mainly consumed in the form of chips in the retail
outlets (Table 10). The other potato products consumed in retail outlets are boiled, crisps, grilled,
mashed and mixed sauce.
In Uganda, demands for and rankings of potato products generally vary with the category of
retail outlets and also with the size of the enterprise. Within the restaurants, potato products
feature as main components of dishes and are highly preferred to other food types, especially
amongst the small to medium restaurants. However, within the hotels these products account for
a smaller percentage and are mainly accompaniments. Hotels offer buffet with a variety of dishes
unlike in the restaurants, where customers order a specific type of food. Chips are the most
preferred potato product according to most retail outlets and their consumption is increasing at
all socio-economic levels.
Table 10. Potato products consumed in retail outlets in the study countries.
Burundi Ethiopia Tanzania Uganda Type of product n % n % n % n %
Chips 59 79 75 64 53 100 110 93 Boiled 2 3 2 2 1 2 106 90 Others* 8 10 18 15 -- -- 50 42
*includes crisps, fried/grilled, mashed, sauce
According to consumer preferences, 83% of retail outlets in the study countries preferred chips to
other potato products, with 100% respondents putting chips first in Kenya, Tanzania and
Rwanda. The percentage reduced to 65-79% in Uganda, Ethiopia and Burundi (Table 11). At the
regional level, chips were reported to have become standard menus in hotels and restaurants
and consumption of chips is increasing in all the income groups.
Table 11. Consumer preferences of chips in the retail outlets of ECA countries.
Country n % of retail outlets that preferred chips to other potato products Ethiopia 97 66 Kenya 41 100 Uganda 76 65 Burundi 59 79 Tanzania 53 100 Rwanda 102 100 All countries 428 83

C I P • S O C I A L S C I E N C E S W O R K I N G P A P E R 2 0 1 0 - 1
M A R K E T S F O R F R E S H A N D F R O Z E N P O T A T O C H I P S I N T H E E C A
17
4.4.4 Consumer preferences of potato products in households
Consumption practices of potato products vary from country to country. In the households of
almost all eastern and central African countries, consumption of boiled potato is most dominant
cultural dish (Table 12). However, consumption of potato in the form of sauce in mixture with
other spices is the most popular cultural dish in Ethiopia. Consumption of fried/grilled potato is
also a common cultural dish in Tanzania.
The forms in which potato products are consumed are closely related to income levels of
households. Low income households consume potatoes in the form of traditional dishes, such as
mixed sauce and boiled, while the high income households consume potatoes in western type
dishes such as chips, crisps, salads and others.
Table 12. Most consumed forms of potato products by households in ECA countries.
Burundi Ethiopia Tanzania Uganda Type of potato product n % n % n % n % Chips 136 94 97 46 123 87.9 158 89.8 Boiled 139 97 156 74 123 87.9 163 92.6 Crisps 7 5 127 60 32 22.9 34 19.3 Fried/grilled 73 51 - - 1 100 94 53.4 Mashed 15 10 - - 7 5 21 11.9 Sauce - - 205 97 - - - -
Different reasons were given for the varying potato product preferences. For example, in
Tanzania high income households prefer potato chips because of what they called “good
palatability” (68.1%), easy to prepare (62.9%) and chips can be obtained at low cost because
ingredients for preparation are locally available (61.5%).
In Uganda, 70% of the households preferred chips to other potato products because of children.
In Burundi, the preferences of potato products for household consumption varied according to
age and income. The youth and children like potato chips and fried potato, while elders prefer
boiled potato.
4.5. Chips processing practices in the ECA countries 4.5.1 The status of chips processing in retail outlets
In eastern and central African countries, 80% of the retail outlets purchase potatoes and carry out
own processing of chips, usually on orders by customers (Table 13). In Tanzania and Rwanda, all
the sampled retail outlets process chips in their own premises. The corresponding figures in
Ethiopia and Burundi account for 58% and 66%, respectively. All the high standard retail outlets

C I P • S O C I A L S C I E N C E S W O R K I N G P A P E R 2 0 1 0 - 1
18 M A R K E T S F O R F R E S H A N D F R O Z E N P O T A T O C H I P S I N T H E E C A
and most of the low standard ones in ECA countries practice own processing of chips in their
premises. Own processing of French Fries is also a common practice of retail outlets in other
countries. For instance, quick service restaurants in India, such as Wimpy, was reported to process
70 MT of French Fries per day (Global AgriSystem, 2005).
Table 13. Processing practices of chips in retail outlets of ECA countries.
Country n % of retail outlets that process chips by themselves Ethiopia 118 58 Kenya 76 78 Uganda 118 80 Burundi 75 66 Tanzania 53 100 Rwanda 102 100 All countries 542 80
At the time of the study, it was established that there was no enterprise or company that is
engaged in processing, packaging and selling of ready-to-fry chilled or frozen chips in Ethiopia,
Tanzania, Burundi and Rwanda (Table 14). However, five processors1 (one frozen chips processor
and the rest chilled chips processors) were identified in Kenya. Only one processor of chilled chips
was also identified in Uganda. The practice of processing chilled and frozen ready-to-fry chips is
relatively more advanced in Kenya.
In Kenya, 78% of the overall sampled hotels process their own chips and 22% get fresh chips
supplied by processors on a daily basis. The processor in Njoro, named as Njoro Canning, focuses
on processing and supplying frozen chips, while other processors supply fresh chips. We suspect
that the number of processors may be higher than five, as they are unregistered and operate
informally at the back of their business areas or houses.
Table 14. Status of chips processing enterprises in ECA countries.
Country Status of chips processors Kenya Five chips processors were identified during the study (2004)
All of the processors are not registered and operate informally and there could be even more processors Njoro canning processes and supplies frozen chips, while others process and supply fresh/chilled chips Two of the suppliers of fresh/chilled chips process 183 tons/annum Supplier of frozen chips (Njoro canning) processes 144 – 216 tons/annum
Uganda Only one processor (Kitty Enterprise) was identified at the time of the study (2004) This processing plant was at its infant stage (only two years old ) It was focusing on promotion and quality testing of chips It was processing at the time of the study 2 tons/annum
Ethiopia, Tanzania, Burundi, Rwanda
No enterprises that are engaged in processing, packaging and selling of ready-to-fry frozen/chilled chips were identified Post processing quality loss is their fear Their major problem is unawareness of processing, packaging, storage, etc. techniques in chips making
1 In this study, processors imply enterprises that are engaged in processing and selling of ready-to-cook chips.

C I P • S O C I A L S C I E N C E S W O R K I N G P A P E R 2 0 1 0 - 1
M A R K E T S F O R F R E S H A N D F R O Z E N P O T A T O C H I P S I N T H E E C A
19
Njoro Canning has linkages with Tigoni Research Center, KARI, Kenya. Different varieties of potato
were given to Njoro Canning for testing and evaluation of their chips quality. Njoro Canning
contracts farmers to produce and supply potatoes. It processes and stores frozen chips in its
storage depots located at Njoro, Nairobi and Mombassa. Having storage depots especially in
Nairobi and Mombassa helps Njoro Canning to immediately supply frozen chips to retail outlets
such as hotels and supermarkets on demand.
In Uganda, processing of chips is of recent phenomenon. Only one local fresh/chilled chips
processor, Kitty Enterprise, was identified during the study. This processor started processing
business in 2002, but still has a small processing capacity. Fresh chips are packaged in ordinary
polythene bags on which the name of the company is printed. Kitty Enterprise supplies the
packaged fresh/chilled chips to supermarkets, such as PAYLESS and UCHUMI. Some of the major
problems of this enterprise were lack of skills and knowledge on processing and preservation
techniques. These included determination of the shelf life of frozen chips, quantity of
preservatives and additives that are adequate for quality chilled chips. Other problems faced by
the processor included unsustainable supply and even lack of quality potatoes for chips making,
poor post harvest handling of potatoes and lack of capital to strengthen the business. However,
Kitty Enterprise plans to build a big factory for chips processing and export frozen chips to
neighboring countries.
The major reason that initiated the retail outlets to start processing of chips in their own premises
was to fulfill the demands of their customers as expressed by 40% - 96% of the respondents in the
study countries. The second reason is that there is no company that processes and sells ready-to-
prepare frozen chips in adequate quantities at reasonable prices. Even though frozen chips are
imported by all the study countries except Rwanda and Burundi, most of the retail outlets still
preferred own processing of fresh chips to purchasing frozen chips. This was for three reasons:
first, the retail price of frozen chips is high and it will discourage customers. Second, trade in
frozen chips is very limited and not easily and adequately available on the market and third, most
of the customers tend to prefer the tastes of fresh chips to frozen chips.
4.5.2 The status of chips processing in households
In Eastern and Central African countries, the practice of chips processing is common in urban
households. Seventy percent of the urban households on average process chips in their own
houses (Table 15). It ranges from 45% of urban households in Tanzania to 86% in Rwanda. Chips
processing in urban households is also closely related to wealth. Seventy seven percent of the
high income and 57% of the low income urban households purchase potatoes and practice chips
C I P • S O C I A L S C I E N C E S W O R K I N G P A P E R 2 0 1 0 - 1
20 M A R K E T S F O R F R E S H A N D F R O Z E N P O T A T O C H I P S I N T H E E C A
processing in their own kitchens. In countries where there is no imports of frozen chips, such as
Burundi and Rwanda, the proportion of urban households that process own chips is higher than
other countries. Processing of fresh chips at household levels is also a common practice in Sudan.
It was reported that French fries are either produced at household level, or purchased as
imported deep-frozen food from super markets (NL EVD International, 2009).
Table 15. Households processing chips in the study countries.
High income Low income Overall Country n % n % n %
Ethiopia 78 77 19 17 97 65 Kenya 72 85 10 13 82 76 Uganda 60 68 50 57 110 63 Burundi 57 89 65 81 122 85 Rwanda 45 100 48 72 93 86 Tanzania 75 54 35 25 110 45 All countries 387 77 227 57 614 70
4.5.3 Quantity of chips processed in retail outlets, households and processors
Retail outlets in ECA countries have different capacities of chips processing, ranging from 6.1
tons/annum/retail outlet in Burundi to 33 tons/annum/retail outlet in Tanzania (Table 16). Since
households process chips for their own consumption, the quantity processed per household is
small, ranging from 0.05 ton/annum in Ethiopia to 0.7 ton/annum in Rwanda.
Each of the three chips processors in Kenya on average processed 117 tons of chips per annum.
The infant chips processing enterprise in Uganda processed only 2 tons/annum of chilled chips.
With increasing demand, the quantity of chips processed in retail outlets and processors is
expected to increase. In general, the small quantities processed indicate that trade in chips in ECA
countries is not yet strong even though there is a high potential for chips demand and quality
potato production suitable for chips making.
Processing of French fries was the most progressed economic activity in South Africa. Reports
indicate that the South African potato processing industry has grown over the past ten years at a
rapid pace and it is still growing fast. The growth of French fries processing industry was mainly
ascribed to the expansion of fast food industry, the growth of average income of population and
the rapid rate of urbanization (Aartappels, 2010). The report has also indicated that in the year
2008/09, about 380,000 tons of potato was used mainly for French fries processing.
C I P • S O C I A L S C I E N C E S W O R K I N G P A P E R 2 0 1 0 - 1
M A R K E T S F O R F R E S H A N D F R O Z E N P O T A T O C H I P S I N T H E E C A
21
Table 16. Average quantity of chips (tons/annum) processed in retail outlets and households of some ECA countries.
Country retail outlets households processors Tanzania 33.0 0.30 ---- Kenya 29.0 0.10 117 Rwanda 6.1 0.70 --- Uganda 19.3 0.07 2 Ethiopia 10.1 0.05 --- Burundi 7.3 0.15 ---
4.5.4 Economic profitability of chips processing in retail outlets
Even though chips processing is not a developed sector in the ECA countries, estimation of
profitability in retail outlets indicates that it is a worthwhile investment. From processing of 100
kg of potatoes, a net profit of USD 11.0 was obtained from retail outlets in Tanzania (Table 17)
and the corresponding profit from processing 100 kg of potatoes in Ethiopia and Burundi about
USD 69 (Tables 18 and 19). The profit rose to USD 126 in Rwanda (Table 20). Although the
magnitude of the profit varied from country to country, it was positive and highly encouraging.
The high potential of ECA region for potato production is also a good opportunity to take
advantage of investments in chips processing.
Table 17. Economic profitability of processing 100 kg of potatoes into chips in Tanzania.
Type of retail outlet/company Item Unit
Hotel Bars & restaurant
Overall sample of retail outlets
Cost Particulars: Purchase of potatoes TAS 43,272.73 42,192.5 42,425.49 Transport TAS 2,181.82 2,055.00 2,082.35 Labor / processing TAS 2,962.5 2,230.00 2,788.1 Quantity of fresh chips fried/ lt of oil Kg 12.8 11.8 12.3 Price of cooking oil TAS 1,265.4 988.75 1,056.60 Cost of cooking oil TAS 9223.58 7088.83 7,732.94 Additives TAS 238.46 119.4 152.34 Cooking fuel TAS 1,500.00 1,200.00 1,350.00 Frying pan charges TAS 150.0 140.0 145 Total costs TAS 59529.09 55025.73 56676.22 Benefit particulars: Amount of fresh chips obtained from 100 Kg 93.30 84.60 90.02 Weight of fried chips obtained from 100 Kg 43.0 41.0 42.0 Sale price of one kg of fried chips TAS 1857.69 1495.90 1583.85 Benefit from sells of fried chips TAS 79880.67 61331.90 66521.70 Benefit from peels of potato TAS 1,200.00 1,000.00 1,100.00 Gross benefits TAS 81080.67 62331.90 67621.70 Net benefit in local currency TAS 21551.58 7306.17 10945.48 Net benefit in hard currency USD 21.558 7.31 10.95
TAS = Tanzanian Shillings. One USD = 1000 TAS (2005/06)

C I P • S O C I A L S C I E N C E S W O R K I N G P A P E R 2 0 1 0 - 1
22 M A R K E T S F O R F R E S H A N D F R O Z E N P O T A T O C H I P S I N T H E E C A
Table 18. Economic profitability of processing 100 kg of potatoes into chips in Ethiopia.
Particulars Unit Value per 100 kg of potatoes
Costs Purchase of potatoes Birr 127.55 Transportation of potatoes Birr 8.31 Labor for processing chips Birr 30.00 Additives (such as cooking oil) Birr 51.52 Depreciation value of processing utensils Birr 2.50 Frying fuel Birr 22.5 Total cost Birr 242.38 Benefits Sale of one kg of Chips on average Birr 18 Quantity of fresh chips that could be produced from 100 kg of potatoes Kg 56.00 Quantity of fried chips obtained from 100 kg of potatoes kg 46.00 Gross benefits
Birr 828.00
Net benefit in local currency Birr 585.62 Net benefit in hard currency USD 68.90
One USD = 8.5 Birr (2004)
Table 19. Economic profitability of processing 100 kg of potatoes into chips in Burundi.
Particulars Unit Value per 100 kg of potatoes Costs Purchase of potato BUF 25000
The transport of BUF 1000
labour BUF 1500
The quantity of chips fried/ litre of cooking oil BUF 5
Additives BUF 3088.80
Frying fuel BUF 5138.10
The price of one litre of cooking oil BUF 1 500
The cost of cooking oil BUF 24000
Total cost BUF 59726.90
Benefits BUF
The quantity of fresh chips they get out of 100 kg of potato BUF 80
The quantity of fried chips they get from 100 kg of fresh chips BUF 64
The sale price of 1 kg of fried chips BUF 2000
Gross benefits BUF 128000
Net benefit in local currency BUF 68273.1
Net benefit in hard currency USD 68.96 One USD = 990 FBU (2005/06).

C I P • S O C I A L S C I E N C E S W O R K I N G P A P E R 2 0 1 0 - 1
M A R K E T S F O R F R E S H A N D F R O Z E N P O T A T O C H I P S I N T H E E C A
23
Table 20. Economic profitability of processing 100 kg of potatoes into chips in Rwanda.
Designation Unit Value (Frw)
Cost
Purchase of potato RWF 8000
Labor cost RWF 1000
Transportation RWF 200
Additives (cooking oil) RWF 11200
Total cost RWF 20400
Benefits RWF
Sale of one kg of fried chips on average RWF 1500
Quantity of chips obtained from 100 kg of potatoes RWF 60
Gross benefits RWF 90000
Net benefit in local currency RWF 69600
Net benefit in hard currency USD 126.09
One USD = 552 FBU (2006).
4.5.5 Import and export status of frozen chips in ECA countries
Although domestic processing is the major source of chips in the ECA countries, limited quantity
of frozen chips is imported in Ethiopia, Kenya, Uganda and Tanzania from Europe and South
Africa. Companies import frozen chips and distribute to retail outlets, mainly higher star hotels
and supermarkets. In Ethiopia, very limited amounts of frozen chips, not exceeding 25 tons, is
imported from Europe (mainly from Belgium, Holland and Germany) each year to be used in only
two five-star hotels. However, no imported frozen chips is available in supermarkets or other
retail shops. In the case of Kenya, Uganda and Tanzania, relatively large quantities of frozen chips
are imported from South Africa and it is also easily available in big supermarkets, such as Uchumi
and Nakumatt in Kenya, Shoprite in Uganda and U-turn in Tanzania. For instance, only one
company in Tanzania imports about 73 tons of frozen chips per annum and distributes to hotels,
restaurants, supermarkets and fast food retail outlets. Importing will remain an important option
as far as there is no competitive enterprise in the ECA countries that can process and supply
quality and adequate amounts of frozen chips to domestic market in a sustainable manner.
Import of frozen potato chips is also a common experience of other ASARECA member countries,
such as Sudan. Processing and marketing of frozen French fries are not a strong practice in Sudan
and the domestic demand is almost entirely fulfilled by imports from Egypt, Saudi Arabia,
Malaysia and European countries (NL EVD International, 2009). It was also reported that Sudan is a
promising market potential for Frozen French fries as import is increasing from year to year.
Burundi and Rwanda did not import frozen chips at the time of this study (2005/06). Burundi,
rather, imports potatoes from Rwanda for chips processing. One hotel in Rwanda (Hotel des
C I P • S O C I A L S C I E N C E S W O R K I N G P A P E R 2 0 1 0 - 1
24 M A R K E T S F O R F R E S H A N D F R O Z E N P O T A T O C H I P S I N T H E E C A
Milles Collines) used to import frozen chips from Belgium via Sabena airways. However, Rwanda
was not importing at the time of the study because of lack of importer.
No export of frozen chips was, however, reported in all the ECA countries. The processors in
Kenya and Uganda are still at infant stages and they are not able to meet even the domestic
demands. Njoro Canning in Kenya is stronger than all the other processors in ECA countries and it
has the potential to export to neighbouring countries in the near future.
4.5.6 The cold store chain for chips
The cold store chain is not a well developed service for frozen chips in the ECA countries. This is
because there is no production of frozen chips in all of the study countries, except Kenya. Njoro
Canning enterprise in Kenya has a relatively well developed cold storage depots in Mombassa
and Nairobi since it produces frozen chips.
Other enterprises that provide cold store services are those that import frozen chips. Importers of
frozen chips in all the ECA countries, except Rwanda and Burundi, have cold storage chambers for
imported frozen chips. Almost all the retail outlets and high income households in all of the
countries have refrigerators mainly to store soft drinks, alcohols and perishable stuff. The practice
of storing fresh chips in refrigerators is very limited since chips are produced on demand for
immediate consumption. Some retail outlets store fresh chips in refrigerators until requests are
received to save time when order for chips is highest. Among the retail outlets that do not use
refrigerator to store fresh chips, most of them believed that storing fresh chips in refrigerator
reduces the quality.
Njoro Canning, Kenya, in addition to depots it has in Nairobi and Mombasa, has one cold store at
the factory enough to store 200 tons and one refrigerated truck for delivery. Nairobi Airport
Service (NAS) has Cold stores and Refrigerated trucks to handle customers’ goods at a fee.
Horticultural Crop Development Authority (HCDA) has about half a dozen refrigerated trucks
which are available for hire. Big supermarkets that are involved in trade of imported frozen chips
in all the importing ECA countries have also cold storage chambers.
In Uganda, Kitty Enterprise does not have a well developed cold storage system for potato chips
except refrigerators. Once processed, the chips are quickly delivered to the retail outlet. In the
case of Rwanda, only Intercontinental Hotel in Kigali and Kivu Sun Hotel in Gisenyi have cool
storage chambers.
C I P • S O C I A L S C I E N C E S W O R K I N G P A P E R 2 0 1 0 - 1
M A R K E T S F O R F R E S H A N D F R O Z E N P O T A T O C H I P S I N T H E E C A
25
In Tanzania, except for the cold store chain operating for Bright Choice Company in handling
imported food items, including frozen chips, none of the interviewed retail outlets and
households had cold store chain in operation. Bright Choice Company, the only importer of
frozen chips to Tanzania, has a well-established cold chain facility, including refrigerated cars and
insulated vans for short distance delivery of their products.
In the case of Burundi, hotels have refrigerators but the majority of them don’t store fresh chips
because they prepare for immediate consumption on order. Hotels of very high class have cold
rooms, but they don’t store potato chips. Some bars and restaurants of high class have cold
chambers.
4.5.7 Transportation chain for chips
Refrigerated transport services are vital especially for perishable commodities such as potato
chips. In all the ECA countries, they use refrigerated transport services for chips from ports or
points of supply to points of distribution.
In the case of Ethiopia, the company that imports frozen chips from Europe is the only enterprise
that has refrigerated facility to transport frozen chips from the port of Djibouti to Addis Ababa.
In Kenya, transport services are available through road networks, railways, air freights and ports.
Kenya Railways has specialized facilities which could handle frozen chips including mechanically
refrigerated bogies and iced perishable wagon.
In Tanzania, Bright Choice uses ship (shipping agent: MAERSK SEALAND), vans and cars (all
refrigerated) for transportation of frozen chips. Frozen chips come from South Africa by ship in
refrigerated containers. At Mombassa and or Dar es Salaam ports, the product is taken in
refrigerated trucks to the company yards where the product is stored in refrigerated chambers.
Refrigerated vans and or cars distribute the frozen chips to customers.
In Rwanda and Burundi, there is no demand for refrigerated transport service since there is no
import of frozen chips.
4.5.8 Credit facilities in ECA countries
Despite the fact that all the retail outlets have access to credit services in Ethiopia, only 32% of
them had taken credit either to construct new hotels or re-habilitate existing ones. The main
sources of credit for the hotels are banks. Other retail outlets did not take credit because they had

C I P • S O C I A L S C I E N C E S W O R K I N G P A P E R 2 0 1 0 - 1
26 M A R K E T S F O R F R E S H A N D F R O Z E N P O T A T O C H I P S I N T H E E C A
adequate capital and there was no need for credit. Some of the state owned hotels get subsidy
from the government and they did not want to take credit. Since they can provide collateral, all
the hotels have expressed that credit services were favorable to them, but faced problems related
to credit services. The government is also encouraging investors through provision of long-term
loans. In general, credit facilities in Ethiopia are favorable for investments in worthy enterprises.
Hotels and restaurants in Rwanda can access credit easily from different financial institutions like
banks, Co-operatives and microfinance institutions. Although credit services are available, all
(100%) hotels, and Bars & Restaurants visited did not get credit and the reasons given are that
they use own capital, high interest rates for some banks and lack of land to expand their
businesses.
In Kenya, entrepreneurs both small and large could easily access credit facilities from micro-
finance institutions, commercial banks, and farmers co-operatives.
In Burundi, the loan is provided by banks, saving and loan cooperatives and socio-professional
mutuality. The loan forms that are found in Burundi are: short term credit for small equipment,
midterm and long term credits for important investments. Midterm and long term credits require
mostly guarantee or mortgage. There also exists an informal loan system where traders lend
money to other traders at high interest rates. The traders with less means borrow money from big
traders who are credible with banks. The loan system existing in Burundi is not favorable to small
entrepreneurs due to lack of guarantee or mortgage. The two main constraints to credit system in
Burundi thus are lack of guarantee or mortgage and high interest rates. It is necessary to improve
the credit system in order to promote the potato chips industry.
In Tanzania, a high percentage of respondents (87.8%) admitted that credit facilities were
available and could be accessed. Respondents from bars and restaurants said that the credit they
had accessed was used as capital. On the other hand, many respondents said that they had no
need for credit. High interest rates and difficulties in getting loans are main problems related to
credit services in Tanzania. It appears that respondents were not interested in getting credit
because the repay back period was very short.
Whereas there are several financial institutions in Uganda, the majority of entrepreneurs
interviewed did not take credit because of fear of failure to pay back the debts. All the small
processing units interviewed did not access credit services. Borrowing is not a particularly
attractive option. There is fear to obtain credit mainly due to the small volume of sales. On the

C I P • S O C I A L S C I E N C E S W O R K I N G P A P E R 2 0 1 0 - 1
M A R K E T S F O R F R E S H A N D F R O Z E N P O T A T O C H I P S I N T H E E C A
27
other hand, the lending costs are high. However, liquidity problems limit the scale of individual
trading business, resulting in high costs of operation, high prices and low demand.
4.5.9 The status of trade tariffs in ECA countries
Government policies in the ECA countries are favorable for importations and investments. The
states have established investment promotion agencies to create favorable conditions for
investment. There are also Bureaus of Standards and Quality Control in the countries to control
the qualities and standards of imported goods. This safeguards the health of consumers and
quality of products.
In general, there is favorable trade policy in the ECA region. The existence of Common Market for
Eastern and Southern Africa (COMESA) and East African Community (EAC) trade policy favors
inter-regional trade in goods and services. All the countries covered in this study, with the
exception of Tanzania are members of COMESA and Kenya, Uganda and Tanzania are members of
the EAC. Then, all the study countries are members of either COMESA or EAC or both and this
makes them beneficiaries of inter-regional trade agreements. Trade liberalization program of
COMESA aims to create a single economic space in which there is free movement of goods,
services, capital and labor (Chanthunya, 2004). The EAC also aims at widening and deepening
cooperation among the partner states through policies and programs. In the economic sphere,
the EAC will focus on regional integration of trade and investment policy, monetary and fiscal
policy, and labor and capital markets (Economic analysis paper No. 2.1, 2001). The trade policy
agenda of the EAC aims at turning the three partner countries into a single investment and trade
area, in order to increase the volume of trade among them and with the rest of the world. The
ultimate goal is to promote rapid economic growth and development, generate employment
and uplift the standard of living of the East African people. Eventually, goods, labor, and capital
will move freely among the three countries. EAC has now expanded to include Burundi and
Rwanda, for which policies will have to be developed. This will further enhance easy and free
regional trade.
The government policy in Rwanda is very favorable for importation investment in whatever
business. A Rwanda Investment Promotion Agency (RIPA) has been created to promote
investments by setting up favorable conditions. There exists also the Rwanda Bureau of standards
which controls the quality of imported and exported goods.
Trade tariffs for frozen chips in Ethiopia are treated similarly to those of other products imported
into the country. Importers are expected to pay 30% duty, 15% VAT and 3% withhold tax when

C I P • S O C I A L S C I E N C E S W O R K I N G P A P E R 2 0 1 0 - 1
28 M A R K E T S F O R F R E S H A N D F R O Z E N P O T A T O C H I P S I N T H E E C A
importing frozen chips, which is the requirement for other imported products. However, there
are no non-tariff barriers to import frozen chips as far as it fulfills the standard quality
requirements. The status of trade tariffs, therefore, is favorable to import frozen chips to the
country.
Kenya Bureau of Standards (KBS) plays a big role in regulating the quality of industrial products,
but it plays an insignificant role in agricultural products through issuing import permit to
importers of agricultural goods at a cost of KSh. 1500 per permit. Uchumi and Nakumatt
supermarkets import frozen chips from Mc-Cain (Canadian agrifood company) through its
Subsidiary company of McCain South Africa. South Africa is a member of COMESA and accedes to
the region’s trade agreement of free trade on agricultural goods. If this company was out of
COMESA, it could attract a 5% (1999 budget) import duty.
Burundi has the most favorable environment for imports of agricultural products. In Burundi, the
agricultural products from abroad were taxed until the end of the year 2005. However, such
products are not taxed anymore except for imported rice. The case of Tanzania is also similar to
the other study countries. Import permit can be easily obtained from Plant Health Services
Department in the Ministry of Agriculture, Food Security and Cooperatives. The ministry requires
that any importer shall present a phytosanitary certificate from the exporting country before
issuing an import permit. The importer pays US $20 for the import permit. For instance, importer
of frozen chips, Bright Choice Company, faced no obstacles as far as importing and trading in
frozen chips was concerned.
All the evidence suggests that there is a favorable environment in the Eastern and Central Africa
Region for regional integration in trade for goods, services, capital and labor. Therefore,
promoting trade in frozen chips in the ECA region is justifiable and is an untapped potential.
4.6 Marketing channels of chips in the ECA countries The marketing channel of chips in the ECA countries is simple since chips processing is not a
developed industry. The simple marketing channels of chips are presented in three different
scenarios as follows depending on the source of chips.
4.6.1 Scenario 1: Retail outlets as a source of chips
The most common scenario of chips marketing channel in the ECA countries is flow of chips from
retail outlets to consumers. Retail outlets (mostly hotels, bars & restaurants and mobile box
retails) process and prepare ready-to-eat chips themselves and directly serve to consumers.
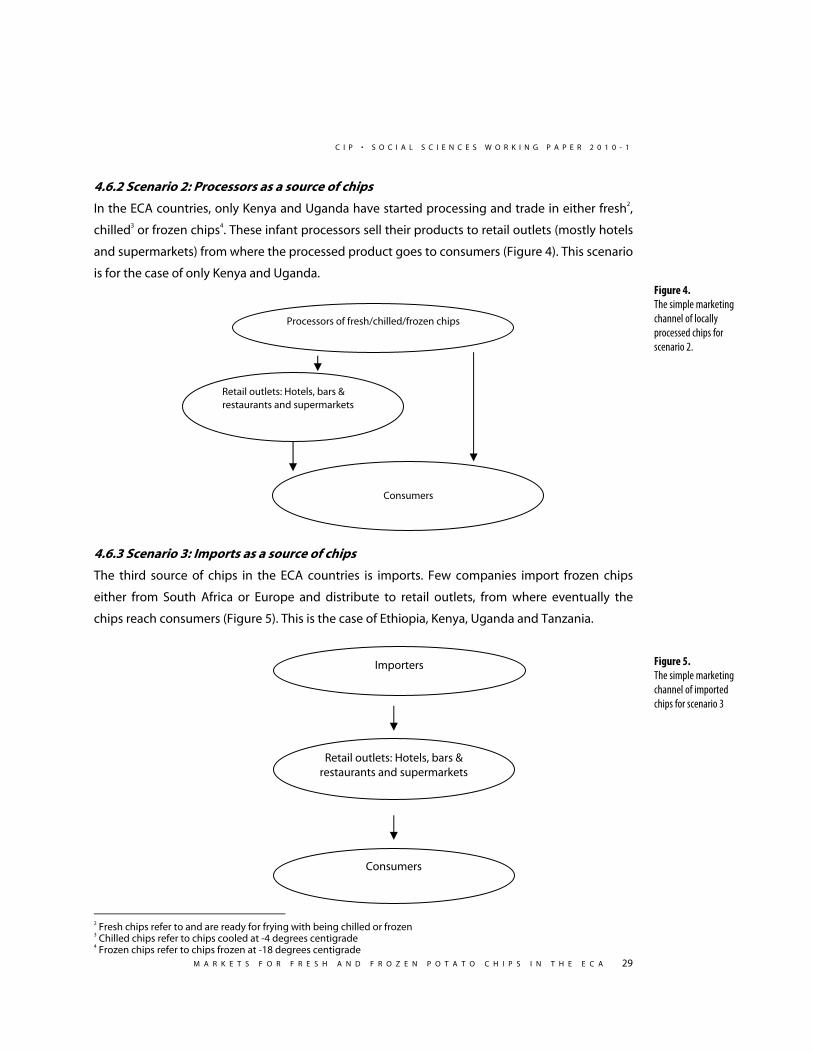
C I P • S O C I A L S C I E N C E S W O R K I N G P A P E R 2 0 1 0 - 1
M A R K E T S F O R F R E S H A N D F R O Z E N P O T A T O C H I P S I N T H E E C A
29
4.6.2 Scenario 2: Processors as a source of chips
In the ECA countries, only Kenya and Uganda have started processing and trade in either fresh2,
chilled3 or frozen chips4. These infant processors sell their products to retail outlets (mostly hotels
and supermarkets) from where the processed product goes to consumers (Figure 4). This scenario
is for the case of only Kenya and Uganda.
4.6.3 Scenario 3: Imports as a source of chips
The third source of chips in the ECA countries is imports. Few companies import frozen chips
either from South Africa or Europe and distribute to retail outlets, from where eventually the
chips reach consumers (Figure 5). This is the case of Ethiopia, Kenya, Uganda and Tanzania.
2 Fresh chips refer to and are ready for frying with being chilled or frozen 3 Chilled chips refer to chips cooled at -4 degrees centigrade 4 Frozen chips refer to chips frozen at -18 degrees centigrade
Figure 4. The simple marketing channel of locally processed chips for scenario 2.
Importers
Retail outlets: Hotels, bars & restaurants and supermarkets
Consumers
Figure 5. The simple marketing channel of imported chips for scenario 3
Processors of fresh/chilled/frozen chips
Retail outlets: Hotels, bars & restaurants and supermarkets
Consumers

C I P • S O C I A L S C I E N C E S W O R K I N G P A P E R 2 0 1 0 - 1
30 M A R K E T S F O R F R E S H A N D F R O Z E N P O T A T O C H I P S I N T H E E C A
4.7 Demand trends of chips The study revealed that the demand for chips is increasing in the eastern and central African
countries. Sixty three percent of the retail outlets in the ECA countries reported that the annual
demand for chips is steadily increasing over years. The increase in demand is especially high in
retail outlets (88%) in Ethiopia (Table 21). The demand in Tanzania is also showing a net
increment as evidenced by 47% of retail outlets. In other countries, the annual demand is either
variable or stable. None of the ECA countries reported a decrease in demand for chips.
Table 21. Annual demand trends of chips consumption in retail outlets of ECA countries.
Steadily increasing Variable, but mostly increasing Stable Country n % n % n %
Tanzania 25 47 10 19 18 34 Kenya 27 36 33 44 16 20 Rwanda 46 45 56 55 0 0 Ethiopia 104 88 2 2 12 10 Burundi 13 17 20 27 22 29
Some of the major cross-cutting reasons that contributed to the increasing demand of chips in
the ECA countries are the following:
1. Increasing urbanization and urban population
Urbanization and urban population are constantly increasing in the ECA region. Evidence by
UNFPA indicates that the first three African countries that recorded the highest rate of
urbanization are Burundi, Rwanda and Uganda. According to the State of Uganda Population
Report 2007, the growth rate for cities in 2005/6 was 15.4 per cent (Glenna, 2007). Because of
increasing urbanization and the corresponding expansion of service sectors, the consumers'
taste is also changing towards consuming value added products, such as Chips.
Urban population of Africa accounted for 40% in 2004 and it will be 60% in 20 years from
now (Seyfu, 2004). According to recent evidence, the urban population growth rate of Africa
is averaging almost 5% per annum. This creates an increasing demand for food, including
chips. Urban population in the age groups below 30 accounts for more than 70% of the
population and this category demands chips more than the older age categories.
2. Increasing tourism industry
Tourism industry is increasing over the years in the ECA region. According to World Tourism
Industry statistics, the growth of tourism industry in SSA was the highest in 2004. In all of
Africa, the tourism industry grew by an estimated 10 percent, significantly more than the
C I P • S O C I A L S C I E N C E S W O R K I N G P A P E R 2 0 1 0 - 1
M A R K E T S F O R F R E S H A N D F R O Z E N P O T A T O C H I P S I N T H E E C A
31
global average of 5.5 percent (World Tourism Industry, 2005). Especially Mozambique and
Kenya were the fastest growing tourism destinations in 2005.
3. Affordable prices of chips
Youngsters like chips since its price is affordable as compared to prices of most other food
items. Chips are sold on the road sides and in kiosks in various packs that can be sold for as
low as less than half a dollar, which is suitable for people of various income groups.
4. Increasing incomes of urban households
Income of urban population is increasing from year to year in Africa. The phenomenon of
increasing urbanization and tourism industry is closely linked to increasing income of urban
households. This contributes to the increasing demand of value added products, such as
chips. According to the report on the context of urban development, SSA, the economic
growth that has taken place in recent years in Africa is mainly urban-based (The Urban
Transition in SSA, 2007).
In all of the ECA countries, the most distinctly observable source of new growth in demand is
from processed potato market in the form of chips. In urban areas, especially in big cities and
towns, chips are a common menu item in restaurants. These restaurants include those found
in hotels, independent restaurants and especially franchised-type fast food restaurants. In
towns that have influx of tourists, hoteliers use menus that are familiar to the visiting tourists
and this includes chips. Demographic trends show that urban growth rates are especially
high and that this growth will continue into the future and these markets will become ever
larger and more important. It is also important to note that urban areas are also home to
most of the economically upper and middle-income families with sufficient incomes to afford
higher value processed potato products like chips. The increasing number of hotels and
restaurants also indicates an expected increase in potato consumption in cities and other
urban centers. For instance, potato consumption in Nairobi grows at a rate of 17% per
annum.
4.8 Future prospects and potentials of regional trade in frozen chips 4.8.1 Scenario analysis
The prices of imported frozen chips are very high compared to prices of domestically processed
chips with the price increments ranging from 198% in Tanzania to 632% in Kenya (Table 22). The
high price for imported frozen chips ensues mainly from high transaction costs involved from the
point of processing to point of consumption.

C I P • S O C I A L S C I E N C E S W O R K I N G P A P E R 2 0 1 0 - 1
32 M A R K E T S F O R F R E S H A N D F R O Z E N P O T A T O C H I P S I N T H E E C A
Table 22. Price comparisons of domestically processed and imported chips in ECA countries.
Country Locally processed chips (USD/kg) Imported chips (USD/kg) % increase Kenya 0.77 5.64 632 Uganda 0.84 3.37 301 Ethiopia 1.22 4.00 228 Tanzania 1.86 5.55 198
The big price gap between domestically processed and imported chips creates a good
opportunity for the emergence of domestic processors and regional trade in frozen chips in the
ECA countries. In general, the following major conditions favor emergence of the potential
regional trade in frozen chips among the ECA countries:
1. Low Transaction Costs
Transaction costs of domestic processors will be relatively low and the prices will accordingly
be lower than imported ones provided that they are able to process and supply acceptable
quality of frozen chips.
2. Promising demand for domestically processed frozen chips
Domestically processed frozen chips are demanded in the market. For instance, Njoro
Canning in Kenya processes and supplies acceptable quality frozen chips to supermarkets at
a price that is about 80% lower than that for imported frozen chips. According to the views of
Uchumi and Nakumatt supermarkets, Njoro Canning frozen chips are cleared/sold faster than
imported frozen chips. No complaints were received from customers on the quality of Njoro
Canning frozen chips.
3. Favorable trade environment in the ECA region
There are no trade restrictions between East and Southern African countries because of
COMESA trade agreement. COMESA has 19 member states, including all of the countries
covered in this study with the exception of Tanzania. According to the information from
COMESA Secretariat (Chanthunya, 2004), COMESA trade liberalization program states that
the main objective of trade liberalization is to create a single economic space among its
member countries in which there is free movement of goods, services, capital and labor. This
is achieved through instruments such as tariff reduction and removal of non-tariff barriers.
Moreover, the principle of free trade regime in COMESA is non-discriminatory. It means same
treatment of like products from all member countries and same treatment of foreign like
product as domestic product. There is also a “Zero-tariff” rule on goods from COMESA
countries and no “Non-tariff barriers” on COMESA goods. All these evidence suggests the
existence of favorable environment for trade among the COMESA countries.

C I P • S O C I A L S C I E N C E S W O R K I N G P A P E R 2 0 1 0 - 1
M A R K E T S F O R F R E S H A N D F R O Z E N P O T A T O C H I P S I N T H E E C A
33
4. Potentially adequate and sustainable supply of the raw material
Since ECA countries are potentially high producers of potatoes, there can be adequate and
sustainable supply of the raw material, as far as the required attributes for quality of potatoes
for chips making are maintained. The area under potato is also indicating a tremendous
increase over time. For instance, in Ethiopia, the area under potato increased by about 400%
in the early 2000s as compared to the 1980s (Agajie et al, 2002). Some evidence in Africa such
as FAO statistics of 2002, also support that the area under potato in SSA has increased by
about 250% in 2001 as compared to the area coverage in 1993. Among the SSA sub-region,
the share of area under potato in the ASARECA region accounted for 71%. According to
FAOSTAT database, potato production is also estimated to be growing at a rate of 10% per
annum in the ASARECA region and this ensures availability of adequate supply for the raw
material. The statistics also indicate that the growth in area under potato in SSA is highest as
compared to the area under other crops, such as wheat, rice, maize, sweet potato, cassava
and yams. The fast growth for the area of potato was because commercially oriented farmers
are responding to increased demand from growing urban centers. Moreover, subsistence
oriented farmers are responding to ever shrinking farm sizes. This is because, revenue from
potatoes is generally 10 times greater than grains, and energy per hectare per month from
potatoes is five times that of grains. Policy makers have also noticed and believed potato
exports as a potential source of foreign exchange. In the ASARECA member countries, this
quantity of raw material means that about 900,000 tons of chips can be produced in the
whole of ASARECA member countries. All the evidence supports that there is a reliable and
adequate potential of potato supplies for processing industries.
5. Economic feasibility of investments in chips processing
Economic profitability analyses of chips processing in ECA countries indicate that chips
processing is a rewarding, lucrative and remunerative investment. For instance, an economic
profit ranging from USD 11.00 to 126.00 per 100 kg of potatoes was obtained from chips
processing in different ECA countries.
These opportunities suggest the potential trade in frozen chips that can be created between
ECA countries. In the short run, there is a possibility for Njoro Canning to penetrate markets
of neighboring countries, such as Ethiopia, Uganda, Tanzania, Rwanda and others.
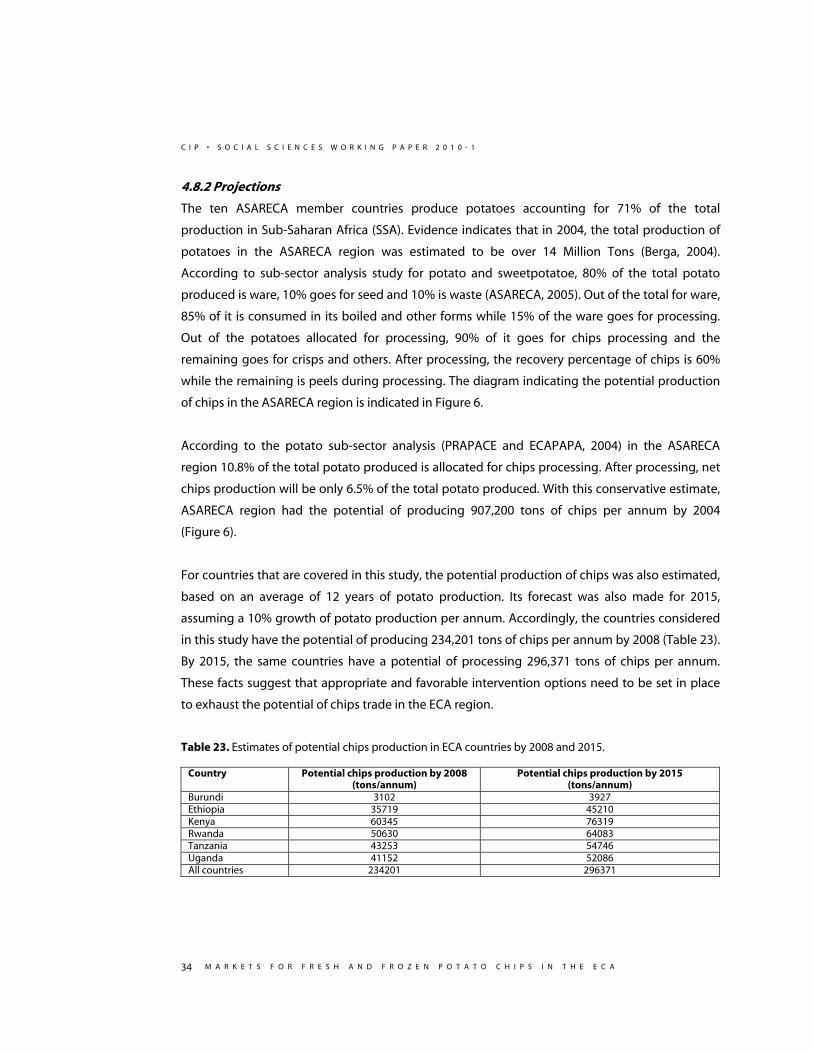
C I P • S O C I A L S C I E N C E S W O R K I N G P A P E R 2 0 1 0 - 1
34 M A R K E T S F O R F R E S H A N D F R O Z E N P O T A T O C H I P S I N T H E E C A
4.8.2 Projections
The ten ASARECA member countries produce potatoes accounting for 71% of the total
production in Sub-Saharan Africa (SSA). Evidence indicates that in 2004, the total production of
potatoes in the ASARECA region was estimated to be over 14 Million Tons (Berga, 2004).
According to sub-sector analysis study for potato and sweetpotatoe, 80% of the total potato
produced is ware, 10% goes for seed and 10% is waste (ASARECA, 2005). Out of the total for ware,
85% of it is consumed in its boiled and other forms while 15% of the ware goes for processing.
Out of the potatoes allocated for processing, 90% of it goes for chips processing and the
remaining goes for crisps and others. After processing, the recovery percentage of chips is 60%
while the remaining is peels during processing. The diagram indicating the potential production
of chips in the ASARECA region is indicated in Figure 6.
According to the potato sub-sector analysis (PRAPACE and ECAPAPA, 2004) in the ASARECA
region 10.8% of the total potato produced is allocated for chips processing. After processing, net
chips production will be only 6.5% of the total potato produced. With this conservative estimate,
ASARECA region had the potential of producing 907,200 tons of chips per annum by 2004
(Figure 6).
For countries that are covered in this study, the potential production of chips was also estimated,
based on an average of 12 years of potato production. Its forecast was also made for 2015,
assuming a 10% growth of potato production per annum. Accordingly, the countries considered
in this study have the potential of producing 234,201 tons of chips per annum by 2008 (Table 23).
By 2015, the same countries have a potential of processing 296,371 tons of chips per annum.
These facts suggest that appropriate and favorable intervention options need to be set in place
to exhaust the potential of chips trade in the ECA region.
Table 23. Estimates of potential chips production in ECA countries by 2008 and 2015.
Country Potential chips production by 2008 (tons/annum)
Potential chips production by 2015 (tons/annum)
Burundi 3102 3927 Ethiopia 35719 45210 Kenya 60345 76319 Rwanda 50630 64083 Tanzania 43253 54746 Uganda 41152 52086 All countries 234201 296371

C I P • S O C I A L S C I E N C E S W O R K I N G P A P E R 2 0 1 0 - 1
M A R K E T S F O R F R E S H A N D F R O Z E N P O T A T O C H I P S I N T H E E C A
35
14, 000, 000 tons of potato produced in the early 2000s in ASARECA region
80% goes for ware which is 11,200,000 tons of
potatoes
10% goes for seed 10% is waste
85% of ware is used as boiled form
15% of ware is used for processing which is: 1,680,000
tons of potatoes
90% of it is used for chips making, which is:
1,512,000 tons of potatoes
10% of it is used for crisps, etc making
60% is chips, which is 907200 tons of chips that can be produced from 10 ASARECA member countries
40% is peels
90,720 tons of chips can be potentially produced from the ASARECA member countries
Figure 6. Potential of chips processing in the ASARECA region.

C I P • S O C I A L S C I E N C E S W O R K I N G P A P E R 2 0 1 0 - 1
36 M A R K E T S F O R F R E S H A N D F R O Z E N P O T A T O C H I P S I N T H E E C A
4.9 Cross-cutting problems in chips processing and trade in the ECA region The following cross-cutting problems were identified in processing and marketing of chips in all
the study countries.
1. Unavailability and un-sustainable supply of quality potato for processing into
chips
Availability of sufficient amounts of potatoes that meet the required quality attributes
such as high dry matter content, medium to large size, white to crème color and oval or
elongated shape is generally limited in all the ECA countries. Because of seasonal nature
of production, their supply is also irregular and unsustainable. Potato commonly
available at the market is very poor in quality and does not fulfill the most important
quality attributes required for chips processing. Poor quality of potatoes results in high
losses (about 40% on average) and poor quality of chips and other products. It is mainly
because of this problem that countries are importing frozen chips to meet customers’
demands for quality chips. This has forced spending of hard currency by the countries on
imports of frozen chips.
2. Lack of adequate knowledge and skills on chips processing, storage and frying
techniques
Lack of knowledge and skills of chips processing, packaging, frying, storing, additives,
preservatives and others is significant in all the countries. The processors, retail outlets
and households practice chips processing mostly by trial and error. Information is lacking
on dimensions of chips (length, width, etc), type and quantity of oil to be used, suitable
equipment, packaging, the duration fresh chips should be stored in refrigerators, types
and amounts of additives and preservatives, etc. As a result, the quality of chips
processed is mostly poor even though consumers still by them. Considerable proportion
of chips is not sellable and this limits the market. For instance, crisps processors in
Ethiopia described that it is because of lack of knowledge in the above areas that they
did not yet start processing of chips.
3. Non-existence and unawareness of standards for chips processing
Retail outlets of high standards and processors complained non-existence or
unawareness on the quality standards for chips. They do not have idea about how
quality chips should look like. Especially customers of high class retail outlets (such as
hotels and bars & restaurants) demanded quality chips for health concerns. This problem
has forced the use of poor quality chips and the resulting low prices.

C I P • S O C I A L S C I E N C E S W O R K I N G P A P E R 2 0 1 0 - 1
M A R K E T S F O R F R E S H A N D F R O Z E N P O T A T O C H I P S I N T H E E C A
37
4. Absence or limited availability of enterprises engaged in processing and selling
of ready-to-cook chips
The reason why most of the retail outlets are processing chips by themselves is because
of lack of companies that processes and sell ready-to-fry frozen chips. Even though there
is a processor of frozen chips in Kenya, it cannot meet the demand of chips in the
country. Availability of enterprises specialized in processing, packaging and selling of
ready-to-fry frozen chips would potentially increase the demand and growth of the chips
industry.
5. Poor knowledge of chips by customers
The retail outlets, especially low standard ones that did not yet start processing of chips
said they had never received requests for chips from their customers. This implies that
considerable proportion of the population is lacking awareness about chips.
C I P • S O C I A L S C I E N C E S W O R K I N G P A P E R 2 0 1 0 - 1
38 M A R K E T S F O R F R E S H A N D F R O Z E N P O T A T O C H I P S I N T H E E C A
5. CONCLUSION AND RECOMMENDATIONS
5.1 Conclusions
1. Commercial chips processing enterprises are either absent or not yet well established in the
six study countries. These sectors are in their infant stages in Kenya and Uganda, and not yet
started in Ethiopia, Tanzania, Rwanda and Burundi.
2. According to the existing data, retail outlets such as hotels, bars and restaurants play major
roles in chips trade by practicing own processing in their premises. In the six countries high
standard hotels, especially two stars and above, and high class bars and restaurants
themselves process and trade in ready-to-eat chips. The processed ready-to-eat chips are
mostly fried and consumed within that retail outlet premises based on orders of their
customers.
3. The overall quantity of chips processed and marketed in the retail outlets and processing
sectors is still very low in all the study countries, but there is variability among them.
4. The lack or unsustainable supply of potatoes that fulfills the required quality attributes for
chips processing was reported to be a major problem in all of the ECA countries. Even
though few varieties are available that are relatively better for chips processing, their supply
is very limited, unsustainable and seasonal.
5. The demand for chips is increasing from year to year in the ECA region due to growing
urbanization, increasing tourism industry, and the change in food habits.
6. ASARECA region has a huge potential of potato production, including the countries where
this study was conducted. In this region, potato production grows at a rate of 10% per
annum. This implies that the potential to sustainably supply raw material, potatoes, for chips
processing exists.
7. In all the study countries, processors of potato products, retail outlets and household
consumers emphasized that there is lack of adequate knowledge and skills in the processing
and frying techniques of chips.
8. All the six study countries lack established quality standards for chips processing. As a result,
chips that are prepared by processors, retail outlets and individual households have variable
qualities and standards. Even in the same package, it is common to see different qualities of
chips in terms of length, thickness, crispiness, color and other merits.
9. In all the study countries, there are favorable conditions on trade tariffs, investments and
inter-regional trade in general. All these countries are members of either COMESA or East
African Community (EAC) or both.
10. The cold store and transportation chains are not well developed in the ECA countries, as a
result there is less trade in frozen chips in the region. The cold store chain available is limited
C I P • S O C I A L S C I E N C E S W O R K I N G P A P E R 2 0 1 0 - 1
M A R K E T S F O R F R E S H A N D F R O Z E N P O T A T O C H I P S I N T H E E C A
39
to companies that import frozen chips and retail outlets that store and distribute frozen chips
to consumers.
11. Among the study countries, four of them (Kenya, Uganda, Ethiopia and Tanzania) import
frozen chips to meet demands of high class retail outlets and high income urban households.
12. Chips processing is observed to be an economically feasible and remunerative investment as
evidenced by case studies of four countries: Tanzania, Burundi, Ethiopia and Rwanda.
Scenario analyses and projections indicate that trade in chips is a promising business sector
in the ECA region.
5.2 Recommendations 5.2.1 Major intervention options
Different intervention options for research, extension, development and policy need to be
implemented in a participatory and integrated approach to overcome the cross-cutting
constraints and strengthen trade in chips in the ECA region. Intervention options include:
1. Limited supply of quality potato varieties for processing into chips.
Promote the existing varieties of potato that are relatively good for processing through
various methods, such as fliers, public media, manuals, posters and others
Research should focus on generating potato varieties that possess attributes for chips
processing demanded by the market.
Establish ware potato producers association and link them to markets to ensure
sustainable supply. These associations should be from different agro-ecologies in each
country with different seasons of potato production.
2. Lack of adequate knowledge and skills on chips processing, storage and frying techniques.
Promote available information and training on improved chips processing, packaging,
frying, and storage techniques to retail outlets, processors and households. This could be
achieved through mass media, such as radio, TV and news papers and print media, such
as fliers, manuals, recipes, posters and other relevant materials.
Research needs to be strengthened in generating improved chips processing
technologies as per the needs and quality standards of each country. Beneficiaries
should be involved in the research processes from planning to consumption stages.
3. Non-existence and unawareness of standards for chips processing:
C I P • S O C I A L S C I E N C E S W O R K I N G P A P E R 2 0 1 0 - 1
40 M A R K E T S F O R F R E S H A N D F R O Z E N P O T A T O C H I P S I N T H E E C A
Develop country standards on potato chips according to consumer preferences and
existing policy scenarios. These standards should take into consideration available
regional and international standards for potato chips as reference.
Harmonize country standards and establish regional potato chips standards to promote
inter-regional trade in frozen chips.
Promote the established country and regional standards to create awareness
4. Absence or limited availability of enterprises engaged in processing and selling of ready-to-fry
chips:
Encourage and strengthen existing processors (in the case of Kenya and Uganda). This
can be achieved through promotion of their products and exempting them from taxes
until they are well established. This will help them to register and sell their products
formally.
Promote investments in chips processing. This could be achieved through dissemination
of available baseline information on access and availability of quality raw materials,
increasing demand for chips, profitability of chips processing, the possibility of regional
trade, favorable investments and trade conditions in the region and other aspects.
5. Poor knowledge of chips by customers
Promote chips through electronic and print media
Conduct market promotion by giving sample chips free of charge for a limited time as
compliments for customers.
5.2.2 Stakeholders involvement and their major roles
Stakeholder involvement is vital for joint planning, implementation, and monitoring and
evaluation of the interventions. It is important for cost and responsibility sharing and avoiding re-
inventing the wheel by organizations as a result of doing the same thing without proper
communication among themselves. The key stakeholders that need to create partnerships and
common platforms to overcome the major problems and strengthen chips processing sub-sector
are the following with some of their roles:
1. The National Agricultural Research Institutes (NARIs)
Creating strong links between research institutes and processors. Processors should
be considered one of the key stakeholders in the course of research. For instance,
involving the processors in needs assessment and variety tasting for processing

C I P • S O C I A L S C I E N C E S W O R K I N G P A P E R 2 0 1 0 - 1
M A R K E T S F O R F R E S H A N D F R O Z E N P O T A T O C H I P S I N T H E E C A
41
qualities, inviting them in experience sharing forums and the like. Other
stakeholders, such as supermarkets, hotels and other retail outlets, farmers, traders,
transporters and middlemen should also be involved where necessary.
Research institutes should give priority in generating and providing quality potato
varieties for chips processing. For instance, Ethiopia, Uganda and the rest of the ECA
countries could adopt processing varieties, known as Kenya Faulu and Tigoni, from
Tigoni Research Center, KARI-Kenya. They can incorporate these varieties in their
research agenda at adaptation trial stage rather than at early stages of breeding. The
same thing could be done to disseminate other varieties with good processing traits
such as Victoria and Rutuku from Uganda and Kinigi from Rwanda, as more
processing varieties are being researched upon.
Demonstrate the processing technologies to the beneficiaries and create their
awareness in a systematic and pragmatic approach
Verify economic viability of chips processing and assess their social and cultural
acceptability
Monitor and evaluate linkages between stakeholders for the smooth functioning of
the integration
Provide technical backstopping for the stakeholders
2. The Bureaus of Agriculture/Departments of Extension
Transfer the knowledge and skills of potato production and processing technologies
via appropriate mechanisms
Incorporating processing technologies in its regular extension program and
disseminate to wide ranges of beneficiaries
Help in organizing seed and ware potato producers to ensure sustainable and
adequate supply of raw material for the processors.
Provide technical backstopping for the stakeholders
Create strong links with processors and producers of potato
3. The policy sector
Establish standards for potato products, especially chips.
Create favorable conditions for the infant processors to help them get credit services

C I P • S O C I A L S C I E N C E S W O R K I N G P A P E R 2 0 1 0 - 1
42 M A R K E T S F O R F R E S H A N D F R O Z E N P O T A T O C H I P S I N T H E E C A
Create enabling conditions for the informal processors to be exempted from taxes
until they are well established in their business and then encourage them to be
registered and operate formally.
Facilitate potato producers to be organized formally, for instance, in the form of
"Seed and Ware Potato Producers Unions" and help them obtain legal entity and
provide technical backstopping, such as auditing, training and others.
Help the potential frozen chips processors in finding markets for export, especially in
COMESA member countries.
4. Development Organizations, such as NGOs, Regional and International Organizations
Help the potential processors in creating enabling conditions for financial services,
such as Micro Finance Institutions, capacity building, organizing processors, linking
processors to retail outlets, transfer of chips processing technologies through
appropriate routes to technology transfer such as pamphlets, posters, mass-media,
etc.
Regional and International organizations (ASARECA programs, CIP and others) could
help in technical backstopping and capacity building (such as, organizing
experience sharing visits, on-the-job trainings, stakeholder consultations, etc.).
Regional and International Organizations could also help in providing competitive
grant funds for research and extension works that target strengthening potential
chips processing sector.
Transferring findings of the study through websites, publications, organizing
workshops and other relevant forums.

C I P • S O C I A L S C I E N C E S W O R K I N G P A P E R 2 0 1 0 - 1
M A R K E T S F O R F R E S H A N D F R O Z E N P O T A T O C H I P S I N T H E E C A
43
6. REFERENCES
Aartappels. 2010. Processing Industry. http://www.potatoes.co.za/processing-industry.aspx#
Agajie Tesfaye, Chilot Yirga, Gebre Medhin Wolde Giorgis, Mesfin Haile and Endale Gebre.
2002. Potato production, marketing and utilization systems in Ethiopia: the case of East and West
Shewa zones.
ASARECA. 2005. The potato and sweetpotato sub-sector analysis: A review of sub-sector status,
constraints, opportunities and investment priorities.
Berga Lemaga. 2004. PRAPACE Annual Report. A paper presented on PRAPACE Planning and
Steering Committee. 16 - 17 February 2004. Mukono. Uganda.
Berga, L. and Nsumba, J. 2005. PRAPACE Annual Report for the Period October 2003 to
September 2004.
Charles, C. 2001. The potential for agro-industrialization and trade of potatoes in Uganda:
Implications for research and development.
Chanthunya, C.L. 2004. Common Market for Eastern and Southern Africa: The COMESA Trade
Regime. Trade, Customs and Monetary Affairs. COMESA Secretariat.
East African Community Trade Policy. 2001. Economic Analysis Paper #2.1.
FAO Home Page: www.faostat.org
Global AgriSystem. 2005. Potato Frozen French Fries. Global AgriSystem PVt. Ltd.
http://mpstateagro.nic.in/Project Reports pdf/POTATO FROZEN FRENCH FRIES.pdf
Glenna, 2007. http://www.allafrica.com/stories/200707090876.html
Kabira, J.N. 2002. Linking were potato growers with processors of French-fries in Nakuru district,
Kenya.

C I P • S O C I A L S C I E N C E S W O R K I N G P A P E R 2 0 1 0 - 1
44 M A R K E T S F O R F R E S H A N D F R O Z E N P O T A T O C H I P S I N T H E E C A
Kirumba, W., Kinyae, P.M. and Macharia, M. 2004. Irish potato survey, Ministry of
Agriculture/GTZ-PSDA, Nairobi.
NL EVD International. 2009. Feasibility of an integrated French fries production chain in Sudan.
NL Agency Ministry of Economic Affairs.
Okoboj, G. 2001. The marketing potential of potatoes in Uganda and market opportunities for
Rwanda. IITA.
Okoboj, G. 2001. The potato production and marketing in Kenya and the marketing potential for
Rwanda. IITA.
PRAPACE and ECAPAPA. 2004. The potato and sweetpotato sub-sector analysis: A review of
sub-sector status, constraints, opportunities and investment priorities. A report submitted to
ASARECA, 62p. Seyfu. 2004. Focusing on real challenges and trends in Agricultural Research in the
ASARECA region. A paper presented on PRAPACE Planning and Steering Committee. 16 - 17
February 2004. Mukono, Uganda.
Urban Transition in Sub-Saharan Africa. 2007. The Context of Urban Development In Sub-
Saharan Africa.
World Food Programme Home Page: www.wfp.org
World Tourism Industry. 2005. Global statistics on tourism industry for 2005.
Zhang L., Guenthner, J.F, Dwelle, R.B. and Foltz, J.C. 2009. U.S. opportunities in China’s frozen
French fry market. American Journal of Potato Research. ISSN. 1099-209X (Print) 1874-9380
(Online). 76(5). 297 – 304.

International Potato CenterApartado 1558 Lima 12, Perú • Tel 51 1 349 6017 • Fax 51 1 349 5326 • email [email protected]
CIP’s MissionThe International Potato Center (CIP) works with partners to achieve food securityand well-being and gender equity for poor people in root and tuber farming andfood systems in the developing world. We do this through research and innovationin science, technology and capacity strengthening.
CIP’s VisionOur vision is roots and tubers improving the lives of the poor.
CIP is supported by a group of governments, private foundations, and internationaland regional organizations known as the Consultative Group on InternationalAgricultural Research (CGIAR).www.cgiar.org


