Worldwide Harmonized Heavy Duty Emissions Certification ... · Worldwide Harmonized Heavy Duty...
22
1 UNITED NATIONS Informal document No. 04 (46th GRPE session, 19-23 May 2003, Agenda item 1.2) Worldwide Harmonized Heavy Duty Emissions Certification Procedure Final Summary 15th WHDC, Geneva, 21 May 2003
Transcript of Worldwide Harmonized Heavy Duty Emissions Certification ... · Worldwide Harmonized Heavy Duty...
1
UNITED NATIONS
Informal document No. 04(46th GRPE session,19-23 May 2003,Agenda item 1.2)
Worldwide Harmonized Heavy DutyEmissions Certification Procedure
Final Summary15th WHDC, Geneva, 21 May 2003
2
ContentUNITED NATIONS
ECE - GRPE
WHDC
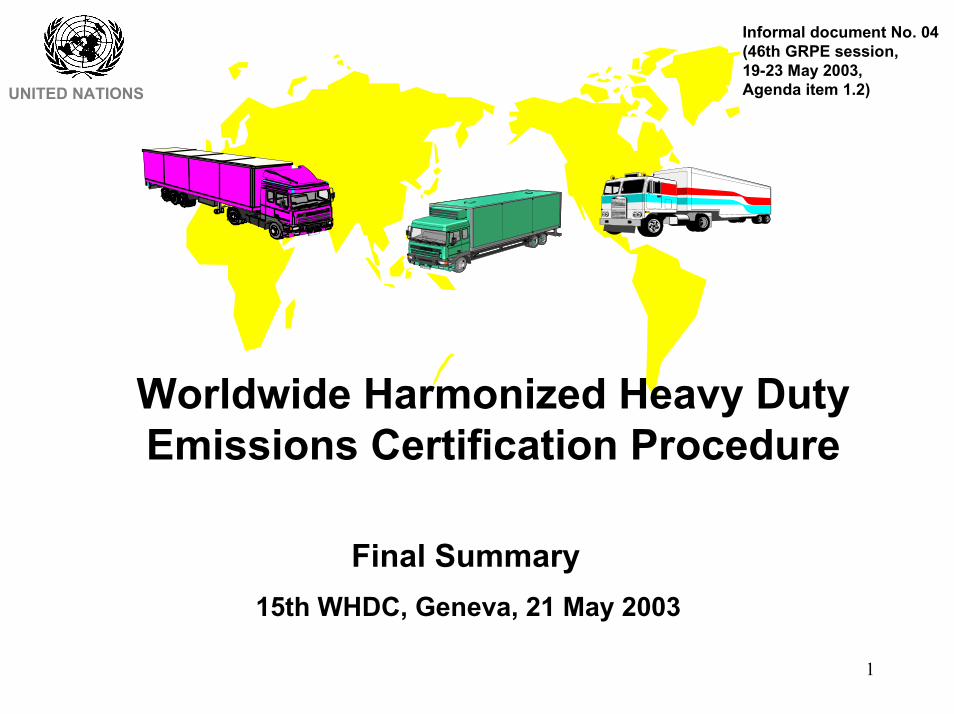
• Basic test cycle development– Vehicle cycle (WVTC)– Drivetrain model– Engine test cycles WHTC and WHSC
• Development of ISO procedures– Emissions measurement– Engine family
• Test cycle validation step 1• Development of WHTC version 2• Development of more robust test cycle denormalization procedure• Final test cycles WHTC and WHSC• Further work
– Test cycle validation step 2– Draft GTR– Round robin test
3
History of EventsUNITED NATIONS
ECE - GRPE
WHDC
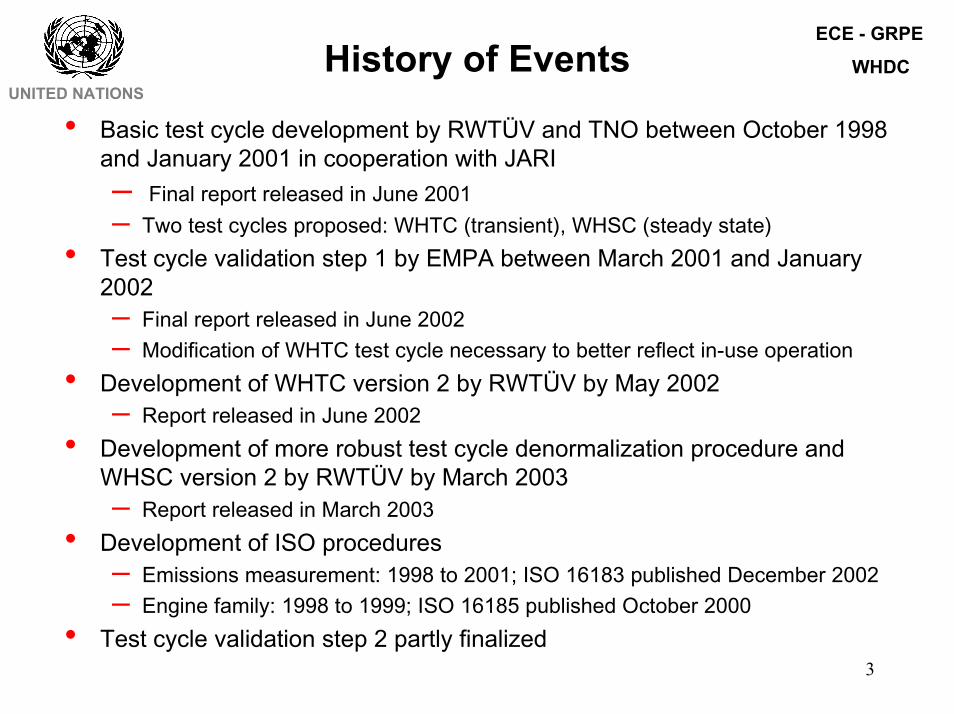
• Basic test cycle development by RWTÜV and TNO between October 1998and January 2001 in cooperation with JARI– Final report released in June 2001– Two test cycles proposed: WHTC (transient), WHSC (steady state)
• Test cycle validation step 1 by EMPA between March 2001 and January2002– Final report released in June 2002– Modification of WHTC test cycle necessary to better reflect in-use operation
• Development of WHTC version 2 by RWTÜV by May 2002– Report released in June 2002
• Development of more robust test cycle denormalization procedure andWHSC version 2 by RWTÜV by March 2003– Report released in March 2003
• Development of ISO procedures– Emissions measurement: 1998 to 2001; ISO 16183 published December 2002– Engine family: 1998 to 1999; ISO 16185 published October 2000
• Test cycle validation step 2 partly finalized
4
Test Cycle Development ApproachUNITED NATIONS
ECE - GRPE
WHDC
A three-step approach was chosen to achieve maximum representativity:
Step 1: Creation of various vehicle reference cycles, including all real-lifeinfluences in a representative way � Far too long for laboratorytesting.
Tool: “Classification matrix” for identification of most importantinfluences on engine operation of HD vehicles
Step 2: Compression of reference cycles to laboratory size vehicle testcycle of approx. 30 minutes using approved statistical methods
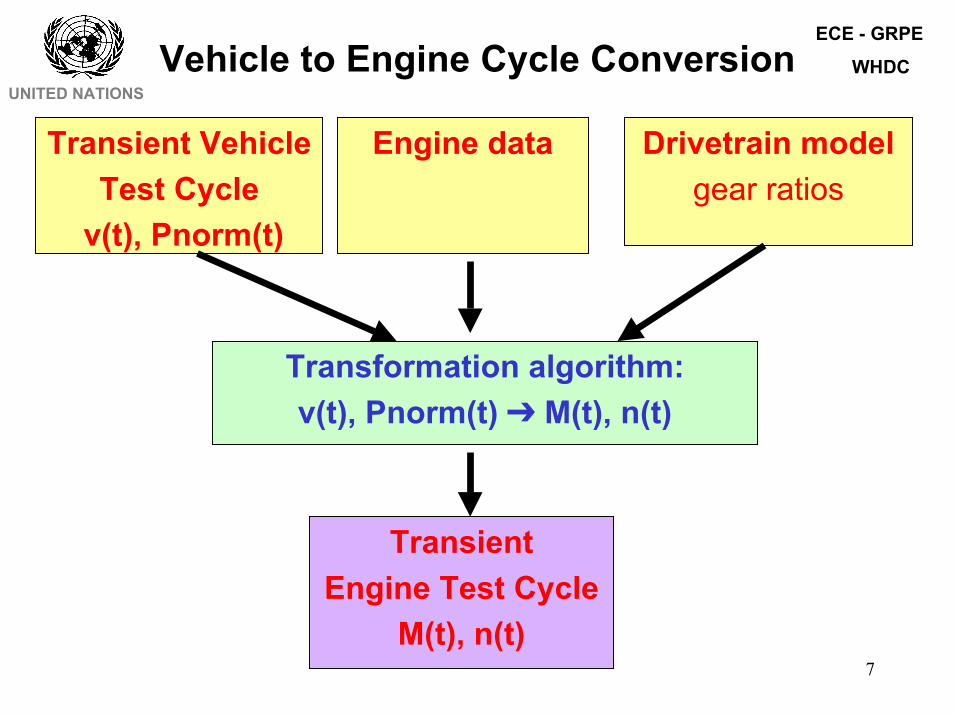
Step 3: Transformation of v(t), Pnorm(t) pattern of vehicle cycle into nnorm(t),Mnorm(t) pattern of engine cycle
Tool: Drivetrain model and transformation algorithm
5
Basic Test Cycle DevelopmentUNITED NATIONS
ECE - GRPE
WHDC
• Conducted by RWTÜV and TNO between October 1998 and January2001 in cooperation with JARI
• Based on data from 65 engines• Novel statistical approach for development of a representative transient
vehicle cycle (WTVC)• Conversion of vehicle cycle WTVC into normalized reference engine
cycles– Introduction of fixed representative drivetrain model covering 4.6 to 40 ton
vehicles– Development of transformation algorithm with WTVC, specific engine data
and drivetrain model as input– Development of Worldwide Harmonized Reference Transient Cycle (WHTC)– Development of Worldwide Harmonized Reference Steady State Cycle
(WHSC) with weighting factors and speed/load distribution based on WHTC– Development of denormalization formula to convert the normalized reference
engine test cycles WHTC and WHSC into actual engine test cycles• Final report released in June 2002
6
Worldwide Transient Vehicle CycleUNITED NATIONS
ECE - GRPE
WHDC
-20
-10
0
10
20
30
40
50
60
70
80
90
100
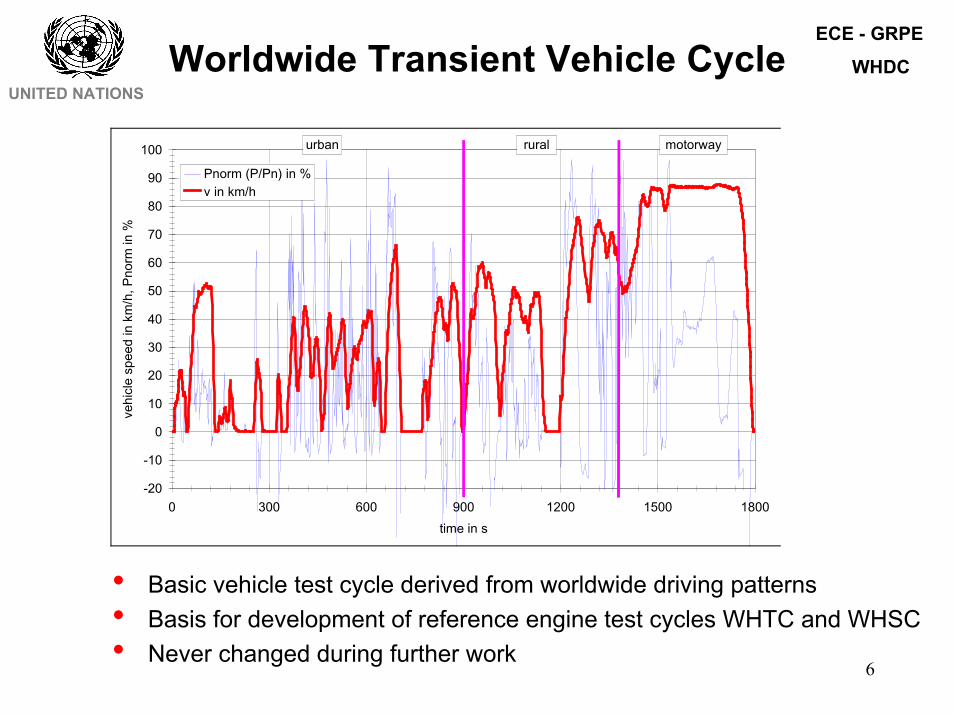
0 300 600 900 1200 1500 1800time in s
vehi
cle
spee
d in
km
/h, P
norm
in %
Pnorm (P/Pn) in %v in km/h
urban rural motorway
• Basic vehicle test cycle derived from worldwide driving patterns• Basis for development of reference engine test cycles WHTC and WHSC• Never changed during further work
7
Vehicle to Engine Cycle ConversionUNITED NATIONS
ECE - GRPE
WHDC
Transient VehicleTest Cycle
v(t), Pnorm(t)
Engine data Drivetrain modelgear ratios
Transformation algorithm:v(t), Pnorm(t) � M(t), n(t)
TransientEngine Test Cycle
M(t), n(t)
8
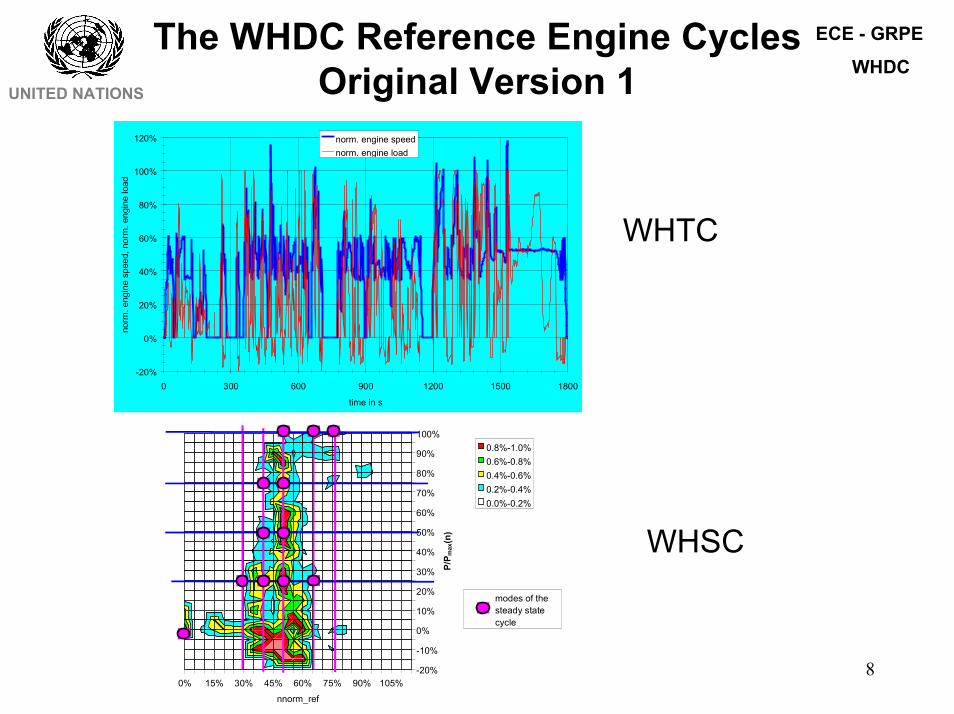
The WHDC Reference Engine CyclesOriginal Version 1UNITED NATIONS
ECE - GRPE
WHDC
-20%
0%
20%
40%
60%
80%
100%
120%
0 300 600 900 1200 1500 1800
time in s
norm
. eng
ine
spee
d, n
orm
. eng
ine
load
norm. engine speednorm. engine load
0% 15% 30% 45% 60% 75% 90% 105%-20%
-10%
0%
10%
20%
30%
40%
50%
60%
70%
80%
90%
100%
nnorm_ref
P/P m
ax(n
)0.8%-1.0%0.6%-0.8%0.4%-0.6%0.2%-0.4%0.0%-0.2%
modes of the steady state cycle
WHTC
WHSC
9
Development of ISO ProceduresEmissions MeasurementUNITED NATIONS
ECE - GRPE
WHDC
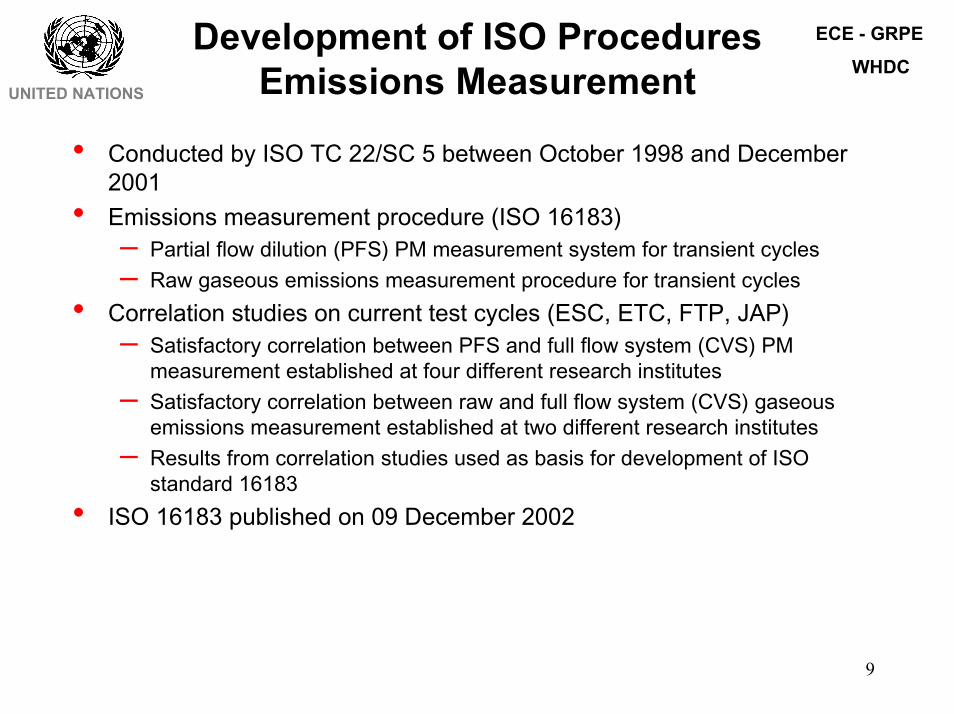
• Conducted by ISO TC 22/SC 5 between October 1998 and December2001
• Emissions measurement procedure (ISO 16183)– Partial flow dilution (PFS) PM measurement system for transient cycles– Raw gaseous emissions measurement procedure for transient cycles
• Correlation studies on current test cycles (ESC, ETC, FTP, JAP)– Satisfactory correlation between PFS and full flow system (CVS) PM
measurement established at four different research institutes– Satisfactory correlation between raw and full flow system (CVS) gaseous
emissions measurement established at two different research institutes– Results from correlation studies used as basis for development of ISO
standard 16183• ISO 16183 published on 09 December 2002
10
Evaluation of Partial Flow Dilution(PFS) vs. Full Flow Dilution SystemsUNITED NATIONS
ECE - GRPE
WHDC
0,00
0,02
0,04
0,06
0,08
0,10
ESC ETC FTP JAP
Test Cycle
PM [g
/kW
h]
CVSPartialWithout Trap
0,00
0,01
0,02
0,03
ESC ETC FTP JAP
Test Cycle
PM[g
/kW
h]
CVSPartialWith Trap
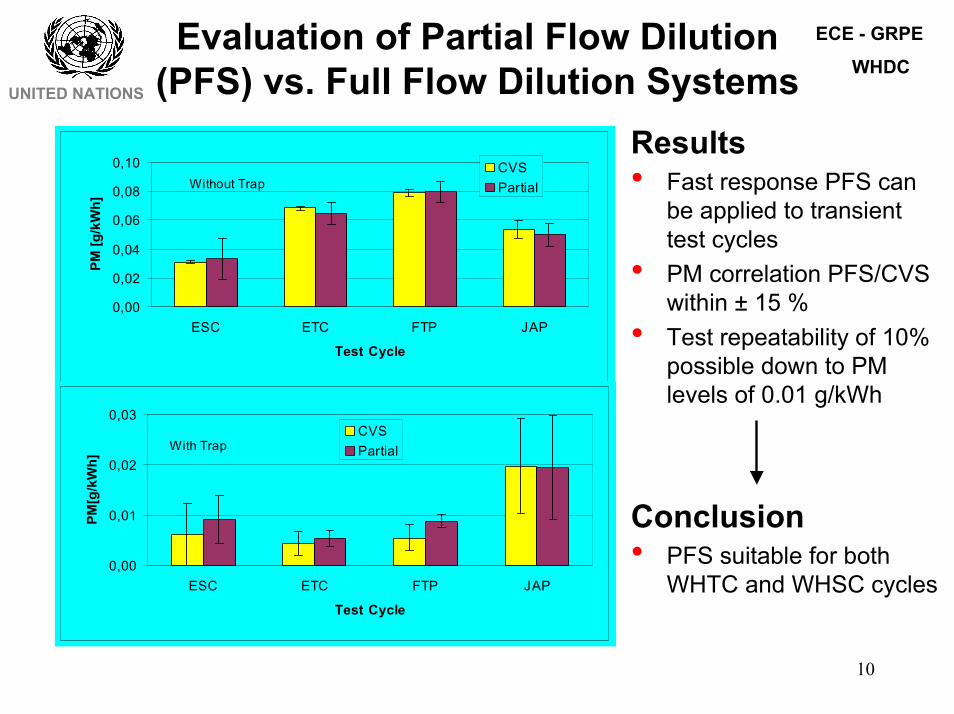
Results• Fast response PFS can
be applied to transienttest cycles
• PM correlation PFS/CVSwithin ± 15 %
• Test repeatability of 10%possible down to PMlevels of 0.01 g/kWh
Conclusion• PFS suitable for both
WHTC and WHSC cycles
11
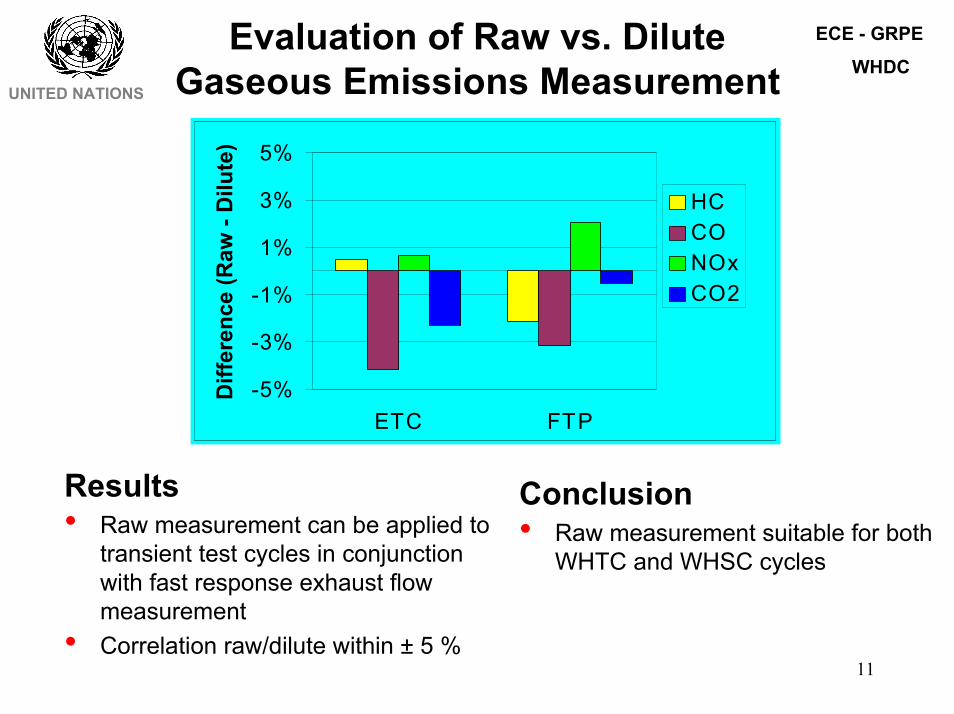
Evaluation of Raw vs. DiluteGaseous Emissions MeasurementUNITED NATIONS
ECE - GRPE
WHDC
-5%
-3%
-1%
1%
3%
5%
ETC FTP
Diff
eren
ce (R
aw -
Dilu
te)
HCCONOxCO2
Results• Raw measurement can be applied to
transient test cycles in conjunctionwith fast response exhaust flowmeasurement
• Correlation raw/dilute within ± 5 %
Conclusion• Raw measurement suitable for both
WHTC and WHSC cycles
12
Development of ISO ProceduresEngine FamilyUNITED NATIONS
ECE - GRPE
WHDC
• Conducted by ISO TC 22/SC 5 between October 1998 and December 1999• Development of ISO standard 16185 was based on existing regulations
– ISO standard 8178-7 (nonroad engines)– US regulation CFR 40 part 86– EU Directive 1999/96/EC
• Improvement of existing engine family concepts with respect to SI engines,alternate fuels, aftertreatment system and electronically controlled engines
• Engine family– a grouping of engines with similar exhaust emission characteristics
• Parent engine– the representative of the family with comparatively high exhaust emission
characteristics• Member of the family
– any engine of the family except for the parent engine• Aftertreatment system
– device for reduction of exhaust emissions externally fitted to the engine, likecatalysts, but not integral engine parts, like EGR
• ISO 16185 published on 15 October 2000
13
Test Cycle Validation Step 1UNITED NATIONS
ECE - GRPE
WHDC
• Conducted at EMPA between March 2001 and January 2002• Results:
– In terms of cycle work, the WHDC test cycles represent typical in-useoperation of commercial vehicles
– Due to the denormalization formula, the engine speed range on the WHDCtest cycles is relatively narrow and mostly towards the low side of the range
– The driveability of the WHTC on the test bench is good; compared to thecurrent cycles, an improvement is obvious
– The operation of the WHSC on the test bench is an improvement over theESC, especially in terms of particulate sampling time
– The agreement between full and partial flow dilution system was good in thisprogram, especially, if the reproducibility of different full flow systems in around robin test is taken into account
– The raw gas measurement generally showed a good agreement to the dilutedmeasurement; for CO, the correlation was acceptable with respect to the COemission standard
14
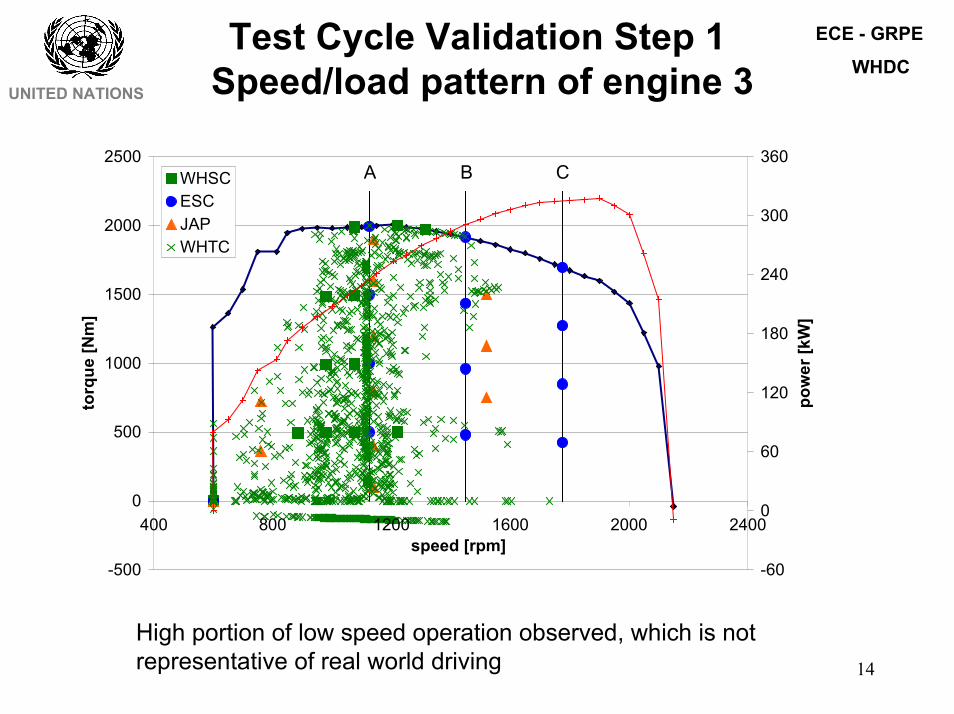
Test Cycle Validation Step 1 Speed/load pattern of engine 3UNITED NATIONS
ECE - GRPE
WHDC
-500
0
500
1000
1500
2000
2500
400 800 1200 1600 2000 2400speed [rpm]
torq
ue [N
m]
-60
0
60
120
180
240
300
360
pow
er [k
W]
WHSCESCJAPWHTC
A B C
High portion of low speed operation observed, which is notrepresentative of real world driving
15
Test Cycle Validation Step 1Correlation to CVS Full FlowUNITED NATIONS
ECE - GRPE
WHDC
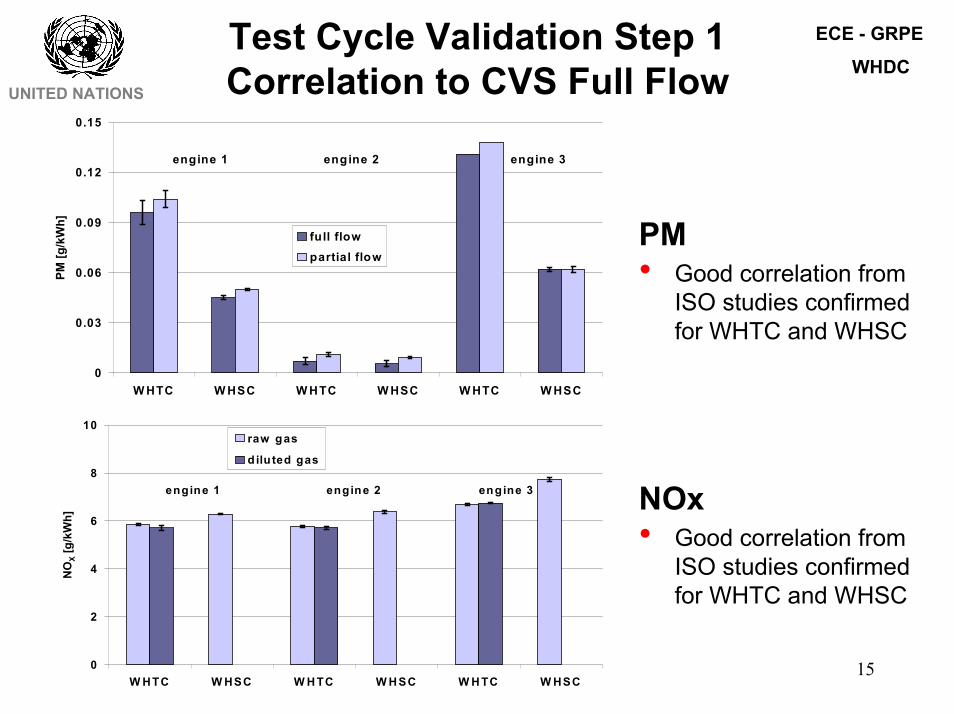
0
0.03
0.06
0.09
0.12
0.15
W HTC W HSC W HTC W HSC W HTC W HSC
PM [g
/kW
h]
fu ll flowpartial flow
engine 1 engine 2 engine 3
0
2
4
6
8
10
W HTC W HSC W H TC W H SC W H TC W HSC
NO
X [g
/kW
h]
raw gas
dilu ted gas
engine 2engine 1 engine 3
PM• Good correlation from
ISO studies confirmedfor WHTC and WHSC
NOx• Good correlation from
ISO studies confirmedfor WHTC and WHSC
16
Development of WHTC Version 2UNITED NATIONS
ECE - GRPE
WHDC
• Background:– Based on WHDC validation step 1, engine speed range is too low– Reason is definition of preferred speed n_pref within denormalization formula– This leads to too low engine speeds in cases, where the torque is maximum for
a wide engine speed range and n_pref as the lower limit of this range is close ton_low
– In these cases, both reference speeds are close to idling speed and thedenormalization results in extreme low test speeds of the WHTC compared toreal world operation
• Solution:– New definition of preferred speed with n_pref being the centre of the speed
range between the minimum speed, where the engine torque is 90% ofmaximum torque, and the maximum speed, where the engine torque is 90% ofmaximum torque
– Since the approximation of the drivetrain model was based on the previousdefinition for n_pref, the normalized speeds of the WHTC were recalculated
– The engine database for this recalculation was increased, substantially• The result is a slightly modified reference cycle and a new denormalization
formula
17
Comparison of Old vs. New WHTCfor One Specific EngineUNITED NATIONS
ECE - GRPE
WHDC
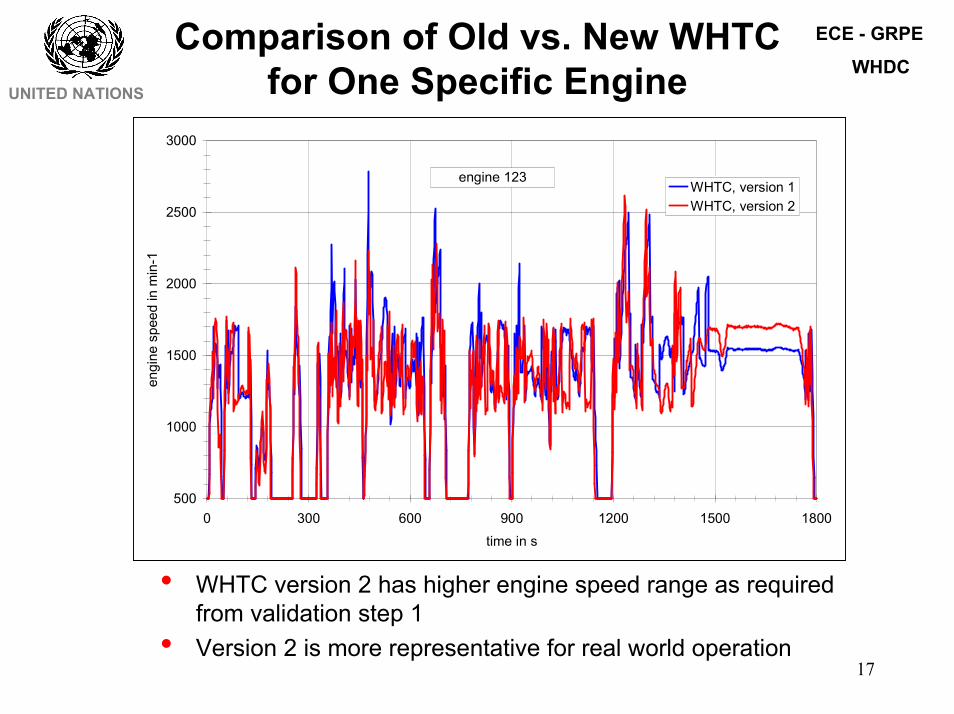
• WHTC version 2 has higher engine speed range as requiredfrom validation step 1
• Version 2 is more representative for real world operation
500
1000
1500
2000
2500
3000
0 300 600 900 1200 1500 1800time in s
engi
ne s
peed
in m
in-1
WHTC, version 1WHTC, version 2
engine 123
18
Development of More RobustDenormalization ProcedureUNITED NATIONS
ECE - GRPE
WHDC
• Background:– New denormalization procedure not robust enough against variations in torque
curve design– Reason is the potential of electronically controlled engines to influence torque
curve design so as to produce a wide range of n_pref and consequently ofactual engine test cycles
– This can lead to torque curve design tampering in order to influence the testspeeds in a way to operate the engine on the test cycle outside the typical realworld operation
• Solution:– New definition of preferred speed with n_pref being the engine speed where the
integral of the torque curve from idling speed is 51% of the whole integral fromidling speed to n95h and n95h is the highest engine speed where the poweroutput is 95% of rated power
– This definition is more robust against possible torque curve design tampering offuture engines
– The new definition is an important contribution to the cycle bypass provisionsrequested from the WHDC group
• The WHTC reference cycle version 2 remains unchanged
19
Consequences for the WHSCUNITED NATIONS
ECE - GRPE
WHDC
� Since the WHTC version 2 is based on a new reference engine and sincethis resulted in slight differences in engine speed and torque pattern, thecorresponding steady state cycle WHSC needed also to be amended.
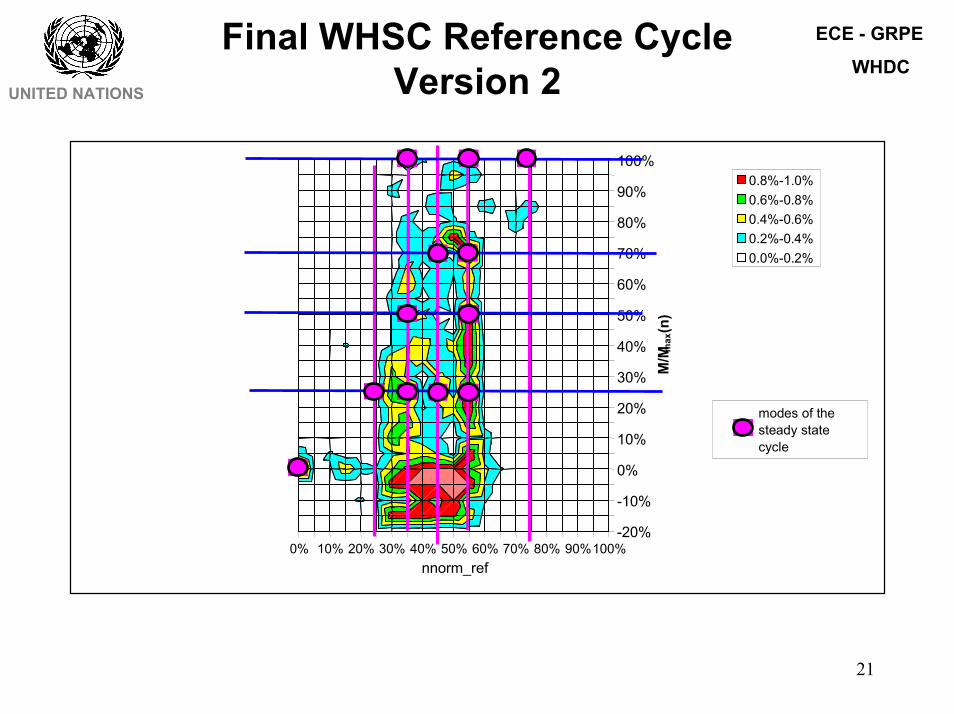
� This amendment was based on the same approach as used for the WHSCversion 1. The normalized engine speed/load points were based on thejoint frequency distribution of the WHTC. An appropriate weighting factorwas established for the motoring section in accordance with the WHTC butwith zero emissions/power.
� The finally chosen measurement points form a compromise betweenrepresentativity and the demands of steady state measurement, especiallywith respect to particulates.
20
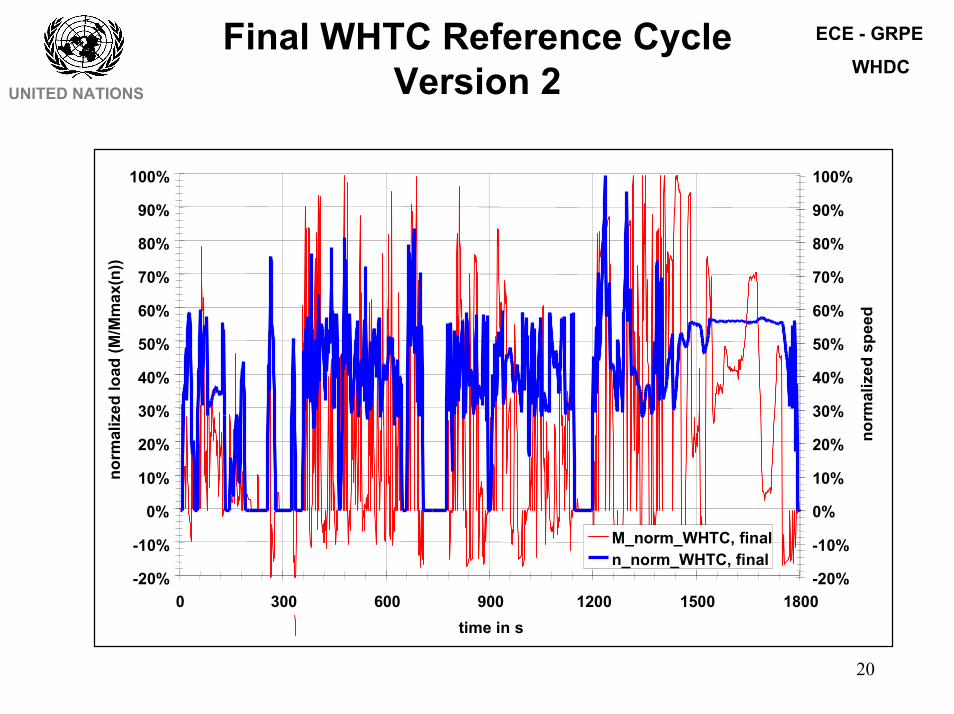
Final WHTC Reference CycleVersion 2UNITED NATIONS
ECE - GRPE
WHDC
-20%
-10%
0%
10%
20%
30%
40%
50%
60%
70%
80%
90%
100%
0 300 600 900 1200 1500 1800time in s
norm
aliz
ed lo
ad (M
/Mm
ax(n
))
-20%
-10%
0%
10%
20%
30%
40%
50%
60%
70%
80%
90%
100%
norm
aliz
ed s
peed
M_norm_WHTC, finaln_norm_WHTC, final
21
Final WHSC Reference CycleVersion 2UNITED NATIONS
ECE - GRPE
WHDC
0% 10% 20% 30% 40% 50% 60% 70% 80% 90%100%-20%
-10%
0%
10%
20%
30%
40%
50%
60%
70%
80%
90%
100%
nnorm_ref
M/M m
ax(n
)
0.8%-1.0%0.6%-0.8%0.4%-0.6%0.2%-0.4%0.0%-0.2%
modes of the steady state cycle
22
Summary and ConclusionsUNITED NATIONS
ECE - GRPE
WHDC
• General applicability of WHTC and WHSC cycles demonstrated duringvalidation step 1
• Development of test cycles WHTC and WHSC finalized with modifiedversion 2
• Upgraded denormalization procedure introduced• Use of partial flow dilution systems and raw gaseous emissions
measurement for transient cycles proven and described in ISO 16183• First draft GTR on WHDC test cycle (technical annexes) to be
submitted at May 2003 GRPE session• Additional validation studies under evaluation or starting soon
including gas engines, but no further modification of test procedureexpected
• Ongoing WHDC activities– evaluation of further emissions validation (step2) by August 2003– further development of draft GTR by January 2005– Coordination and evaluation of round robin test program (10/2003 to
06/2005)