World Food System Challenges and Opportunities: … World Food System Challenges and Opportunities:...
43
1 World Food System Challenges and Opportunities: GMOs, Biodiversity, and Lessons from America’s Heartland By Charles M. Benbrook, PhD. 1 Abstract Most people accept that world food production must grow at a steady pace in order to meet the twin challenges of population growth and economic development. Nearly all productive land is already growing food and water resources accessible to agriculture are, if anything, shrinking. Intensification of production emerges as the most promising option. Different paths to intensification, with vastly different consequences, are now competing for public and private sector research and development dollars. The rising prominence of the private sector in setting R+D priorities and shaping farming systems is shifting emphasis from problem-solving and societal needs to preserving and creating high profit margins on proprietary technologies. Biotechnology and the integration of the seed and pesticide industries are expanding private sector options for exploiting intellectual property. Some significant on-farm economic, R+D, and ecological consequences are already apparent and deserve more attention, especially within the farm community. Two biotechnologies now used on thousands of Illinois farms, herbicide tolerant and Bt-transgenic plant varieties, will be assessed to provide real world context for discussion of the consequences of current efforts to intensify agricultural production. Over time changes in technology, profitability, and consumer preferences may change the clientele, and the private organizations and institutions willing and able to exercise leadership in directing the flow of public and private investment capital within the U.S. food system. A. Sustainable Agriculture within the Global Food System Sustainable agricultural and food systems must – • Provide a reasonable rate of return to farmers to sustain farm families, agricultural infrastructure, and rural communities; 1 Paper presented January 27, 1999 as part of the University of Illinois World Food and Sustainable Agriculture Program. Much of the analytical work reported in this paper was made possible by a grant to the Consumer Policy Institute, Consumers Union from the Wallace Genetic Foundation. The views expressed herein are the author’s alone. Dr. Benbrook lives in Sandpoint, Idaho and can be reached at [email protected], or by calling 208-263-5236.
Transcript of World Food System Challenges and Opportunities: … World Food System Challenges and Opportunities:...
1
World Food System Challenges and Opportunities: GMOs,Biodiversity, and Lessons from America’s Heartland
By
Charles M. Benbrook, PhD.1
Abstract
Most people accept that world food production must grow at a steady pace inorder to meet the twin challenges of population growth and economic development.Nearly all productive land is already growing food and water resources accessible toagriculture are, if anything, shrinking. Intensification of production emerges as the mostpromising option. Different paths to intensification, with vastly different consequences,are now competing for public and private sector research and development dollars.
The rising prominence of the private sector in setting R+D priorities and shapingfarming systems is shifting emphasis from problem-solving and societal needs topreserving and creating high profit margins on proprietary technologies. Biotechnologyand the integration of the seed and pesticide industries are expanding private sectoroptions for exploiting intellectual property. Some significant on-farm economic, R+D,and ecological consequences are already apparent and deserve more attention, especiallywithin the farm community.
Two biotechnologies now used on thousands of Illinois farms, herbicide tolerantand Bt-transgenic plant varieties, will be assessed to provide real world context fordiscussion of the consequences of current efforts to intensify agricultural production.Over time changes in technology, profitability, and consumer preferences may change theclientele, and the private organizations and institutions willing and able to exerciseleadership in directing the flow of public and private investment capital within the U.S.food system.
A. Sustainable Agriculture within the Global Food System
Sustainable agricultural and food systems must –
• Provide a reasonable rate of return to farmers to sustain farm families, agriculturalinfrastructure, and rural communities;
1 Paper presented January 27, 1999 as part of the University of Illinois World Food andSustainable Agriculture Program. Much of the analytical work reported in this paper wasmade possible by a grant to the Consumer Policy Institute, Consumers Union from theWallace Genetic Foundation. The views expressed herein are the author’s alone. Dr.Benbrook lives in Sandpoint, Idaho and can be reached at [email protected], or bycalling 208-263-5236.
2
• Assure a reasonable rate of return to public and private providers of farm inputs,information, services and technologies;
• Meet society’s food needs;• Preserve and regenerate soil, water and biological resources upon which
production depends, and avoid adverse impacts on the environment;• Increase productivity and yields at least in step with growth in demand; and• Adhere to social norms and expectations in terms of fairness and equity,
regulations, food safety, and ethical treatment of workers, animals and othercreatures sharing agricultural landscapes.
Agricultural systems and technology become unsustainable for a variety ofreasons, but loss of profitability is almost always the most immediate. When anagricultural system or technology becomes unsustainable, agriculture evolves throughchanges in ownership or management, or by an infusion of technology, capital or newenterprises. It has done so for decades, and in some countries, for centuries. All toooften in the U.S. in recent decades, the only thing that really changes is that energetic andambitious managers willing to accept lower returns per bushel find the capital to expand,maintaining their income only by expanding their acreage base.
One of the tragic dimensions of recent changes in U.S. agriculture is that forcesbeyond the control of producers can drive even the best operators, with generations ofhard-won equity in a farm, off the land. Hundreds if not thousands of Illinois hogproducers may not make it through the winter. Their loss will be the state’s loss, andanother undeserved opportunity for vertically integrated corporate hog farms andprocessors to expand their market share and drive up profit margins when supply fallsand prices recover, as they surely will.
On conventional and sustainable farms alike since the 1980s, the slide towardunsustainability has typically been triggered by excessive optimism and misguidedinvestments when prices are high, or changes in market conditions or policy that triggersignificant price swings. In some regions the ravages of bad weather and flooding, or adecision to close a processing plant or livestock auction, have taken a toll. But nowanother generic pitfall is emerging -- poor judgement in the selection and use ofagricultural technologies. For two reasons this new source of instability may rise inprominence in the years ahead.
First, increasingly serious economics surprises and setbacks. Many emergingbiotechnologies are more expensive to bring to market. The costs of creating andprotecting intellectual property are already high and bound to rise, as are the stepsrequired in overcoming regulatory hurdles. Many new technologies cost more per acre atthe grower level and require more management, information, and skill to use to bestadvantage. When they fail, they tend do so more profoundly than past technologies,imposing greater losses on growers. And some biotechnologies will constrain marketingoptions – the last thing farmers need as input suppliers, the grain trade, and processorscompete to gain a larger share of the consumer food dollar, often at the expense of farm-level profit margins.

3
Second, a growing array of sources of genetic, ecological and biologicalinstability. Both the nature of many new technologies and how they are being marketedare setting the ecological foundation for trouble. The pesticide treadmill is giving way tothe technology package treadmill. But now, instead of just destabilizing the interactionsof pests, beneficials and crops, technology packages are throwing crop genetics andphysiology into the mix, as well as the potential for a new generation of highly mobileecological problems.
Instances of erratic performance will no doubt continue to plague some transgenicvarieties. Problems arising in areas where transgenics are used will occasionally moveonto surrounding farms where the technology may not have been used. Sorting out whocaused what, the magnitude of losses and who must pay will be costly and contentious.These costs will be factored into per acre expenditures in one way or another. Who willbear the economic burden of these costs and risks remains unclear, but recentdevelopments suggest most companies will be aggressive, arguing that problems arosebecause of bad weather or management shortcomings. Hence, farmers are likely to bearthe burden of proving harm and causality, a burden not always easy to sustain near thefrontiers of agricultural biotechnology, as some farmers are learning.
Meeting Global Food Needs
According to the FAO over two billion people suffer from deficiencies inmicronutrients and close to a billion people remain undernourished, yet farmersworldwide struggle with low prices caused by over-production. What gives?
Dietary deficiencies and hunger persist because of poverty, politics, and thedesign of food systems, not because of a lack of production. In the developing worldnatural resource degradation continues to worsen as more and more people try to surviveon less and less land. The number of people living in harm’s way -- flood plains, beneathor on steep hillsides, in arid regions -- is growing, exposing countries and ecosystems tonew sorts of natural calamity.
Gus Speth, then the outgoing Administrator of United Nations DevelopmentProgram (UNDP), gave a compelling “swan song” speech in October 1998 before theNational Press Club in Washington, D.C. Since the early 1970s I have known Gus andadmired his energy and optimism. He accomplished much during his seven yearsrunning UNDP. I was interested in how he would recap his experiences and "lessonslearned" with UNDP and so listened intently to the speech, which was, in a word,depressing.
The statistics Gus rattled off described the scale and scope of deprivation andhopelessness around the world, and the slippage in society’s capacity to make ameaningful difference in the lives of so many people. He pointed to many promisingdevelopment efforts and praised the toughness and spirit of the poor, but chided theAmerican public and Congress for turning its back on the rest of the world in a time of
4
clearly growing need. He also warned of the consequences if recent trends are not soonreversed. These include rising costs of humanitarian and peacekeeping efforts, politicalunrest, global environmental decay, terrorism, and a loss of moral authority.
Speth noted that for some 3 billion people, strong and deeply set forces willcontinue to degrade quality of life and erode the chances for sustainable development,despite greater wisdom and commitment among those working to promote development.Our discussion tonight of how the global food system, technology, and the agriculturalsciences can better help meet the needs of the world’s poor must be grounded in thissobering context. The first key step in solving a problem is understanding its source.
We need to acknowledge that growing more corn and soybeans in Illinois is notgoing to do much in overcoming hunger among the world’s poor. Those calling for moreproduction in America as the only way to feed the world do so sincerely but fail toproperly diagnose the roots of hunger. No wonder some proposed solutions miss themark.
Different Visions of and Paths to “Intensification”
Last month in North Carolina I debated Dr. Dennis Avery, one of the speakersinvited to this podium during your symposium two years ago. At the 1998 SoutheastVegetable Expo, we focused on technology, the environment, food safety and global foodsystem challenges. We agreed that demand for food will continue rising and thatintensification of production must bear most of the brunt in meeting demand growth. Butwe described very different notions of what “intensification” means, and where and howit can best be achieved.
Dennis favors more specialization and bigger factory farms. He favors morebiotechnology and chemical use in farming, and he believes our farming systems arebasically on the right course. He does see problems on the horizon in two areas – tradeand regulation. On the trade front he wants more and on regulation, less. Unshackle theproductive power of high-yield American agriculture and soon, according to Dennis,there will be a Big Mac on every table and more room for wildlife, or so the story goes.
I think of food system “intensification” as the process whereby more calories andnutrients are delivered to people per acre in production. If America, or the developedworld, truly wishes to overcome world hunger we could accomplish a lot by changing ourdiets, especially if we also were willing to increase direct and indirect support fordevelopment and economic opportunity. Nutrition experts point out that a bushel oflegumes or grains consumed directly by people in bread, pasta or other foods, instead ofby livestock, would support about eight times the human population. I wonder whatpercent of Illinois’s annual crop harvest humans directly consume – well less than 5percent I bet.
Contrary to Avery’s assertion, we do not need to become a nation of vegans tomake a difference. If one-quarter of Illinois soybeans were consumed directly by people

5
instead of by poultry and hogs, think of the changes in the supply and price of soybean-based protein products. But such changes in our food system are unimaginable to mostpeople, and hence not worth thinking about.
American agriculture has never been comfortable with nor rewarded thoseinclined to think outside the box, whether in academia or industry. Most scientific andcommercial breakthroughs have come from specialization and reductionism. As a resultwe suffer from a sort of “big picture” myopia.
The day may come when limited thinking will begin to undermine the inclinationto innovate that runs so strong in American agriculture. There are many paths tointensification in agriculture yet only a few receive meaningful institutional and financialsupport. Different paths are likely to lead to different outcomes. No one path will workeverywhere nor meet all needs. For sound ecological and economic reasons, the nationwill benefit from multiple agricultural intensification choices and the knowledge andability to choose wisely among them. Finding how to do so is one of the land grantsystem’s most daunting contemporary challenges.
I have studied the linkages between technology, policy, economics and theenvironment during most of my career. It is clear to me that the role of traditional farmpolicy is greatly diminished, that the private sector now largely controls the selection oftechnologies that are reaching farmers, and that the discipline of the open market is beingundermined by industry consolidation and vertical integration. Most farmers seem toaccept, if not welcome these changes. Down the road if views within the farmcommunity change, will farmers still have ways to compel the system to shift gears?
How will the University of Illinois, a great land grant university, engage the farmcommunity, consumers, environmentalists and the private sector in distinguishingbetween sustainable and unsustainable paths to intensification? And second, how willthe university help the U.S. and global food systems steer away from one by consciouslychoosing the other?
B. Technology and Sustainable Agriculture
“When I started farming 23 years ago we didn’t use the most powerfulchemicals on the market, we didn’t flood the land with fertilizer, and we stillmade a good living. I felt that I was in control of my operation. Our grossrevenue to expense ratio was 3 to 1. Today, we are on the cutting edge, usingGMOs, changing crop varieties almost yearly, using chemicals as if we farmed inEurope, and our revenue to expense ratio has dropped to 1.25 to 1, on a good year,just enough to pay the grocery bill.”
Lloyd FearRed River Valley, Manitoba@g Worldwide Correspondent
6
Lloyd Fear’s January 13, 19992 commentary cuts to the core of grower concernsabout technology. Is the nature of technology changing? For decades new technologyhas nearly always been welcomed on the farm as laborsaving, problem solving andincome generating. In the last decade technology has become a mixed bag. It too oftencreates unforeseen problems and seems designed principally to accommodatespecialization and bigness.
Some farmers sense that they have climbed on a treadmill and that the harder theyrun, the faster they must go to just stay even. Lloyd Fear notes that the more technologyhelps farmers increase production, the softer prices become, especially as governmentspull out of the supply management business in deference to the need of the grain trade formaximum volumes and unconstrained price movement. Among the implications ofchanges underway in farming, Lloyd Fear believes that the “farmer is in an industrywhere his fortunes and future are being dictated by others with little thought to the impactof their actions.”
So tonight let’s do a “little thinking” about technology, what is driving it, andimplications for farmers, consumers, and the country. I will make five major points –
• Biotechnology is fundamentally changing the nature of technological change,and in due course may reconfigure the economic, cultural and ecologicalgenome of the farm community.
• Past agricultural science and technology revolutions have been largely publicsector financed and driven, and for the most part, responsive to farmer-needs.The biotechnology revolution is private sector and corporate profit-driven.
• For at least another generation the real prices of most farm commodities arelikely to remain flat, or at best rise modestly. Input industry and processingsector growth, debt-service and profits will have to come from somewhere.Expect further pressure on farm profits.
• Biotechnology is driving change at all levels of agriculture and at anunprecedented rate. The law of unintended consequences is likely to havemany field days. The pace of change will bring upon rural America and ourfood system selection pressures unlike any in the past.
• If current trends continue, farmers and society may be able to do relativelylittle in shaping these changes, the genie is out of the bottle.
2 Commentary appears on the Successful Farming website “@g World Wide” at(http://www.agworldwide.com).

7
Evaluating the Impacts of Biotechnology
Methods to project the various impacts of emerging biotechnologies are neededfor many purposes. Which emerging biotechnologies deserve public support? When is itworth taking a gamble with a commercial application in the face of uncertain health orecological risks? Which biotechnologies are likely to improve farm profit marginswithout imposing offsetting indirect costs?
Assessments of biotechnology should evolve from the principles and concepts ofecology and evolutionary biology rather than mechanistic, input-output, dose-responsemodels. Conventional approaches to risk assessment pay little heed to adaptive forcesand evolutionary biology. This needs to change since synergism between plant health,stress, genetic adaptation, and changes in biodiversity will trigger many unintendedconsequences.
It is also important to question who will benefit from various applications ofbiotechnology. Clearly the pesticide and seed industries are bullish on biotechnology, areflection of expectations that they will benefit from the opportunity to offer farmersgenetically engineered seeds and production inputs. Many academic scientists workingon molecular genetics are also clearly eager to apply their skills in creating new plants.
In fact, all the public and private institutions of agriculture, both the USDA andEPA, the farm press and the private sector have, for all intents and purposes, embracedbiotechnology as the wave of the future. For better or worse the row crop farmers of theMidwest are now riding that wave.
The Roots of Technological Change
Each generation of farmers has to deal with a set of yield, production and profitconstraints. These include emerging and well-established pests, and maintaining andhopefully building soil quality. Ideally, the focus if R+D is on the generation of newtechnologies to overcome these problems.
Illinois farming systems have grown more productive per acre throughintegration, over many years, of a series of new technologies. Farmers will becomemore productive and prosperous in the years ahead if they are able to wisely chooseamong expanding technological options and are not overwhelmed by anti-competitiveforces in the marketplace.
Farmers make a series of decisions each year that determine what will be grown,where and how. These decisions and how skillfully they are carried out join the weatherand market prices in determining income from farm operations. They include –

8
• Farming Enterprise Design -- (1) whether to specialize in crops, livestock, ormanage a mixed system; and (2) mix of crops and crop rotations, hencedefining the farm’s mix of marketable commodities.
• Selection of Genetics – complex tradeoffs arise in choosing between highyield potential, resistance to pests and stress, and output traits. Theemergence of GMOs requires farmers to weigh new factors and tradeoffs inchoosing varieties.
• Agronomic Systems – choices span tillage and planting systems, fertilizationmethods, weed and other pest management practices, soil and waterconservation practices, and harvest timing and methods. Some decisions –adoption of no-till – forego certain options and heighten reliance on certaintechnologies and inputs.
Some decisions have long-run consequences – whether to diversity into livestock,or specialize in grain production, the purchase of no-till planting equipment or a secondcombine. Other decisions must be made quickly as a season unfolds and may, or may notimprove profits in a given year. Examples include whether a second pass is needed witha cultivator or how much nitrogen to apply.
Technological innovation – the kind farmers welcome and society has beenwilling to support -- occurs when a farmer is able to make these interconnected decisionsin a way which, on average over several years, increases yields more so than costs, orreduces costs more so than yields, while either improving or leaving unchanged theenvironmental and resource base impacts of farming operations.
In the last two decades there has been relatively little change in many aspects offarming system design in Illinois. Corn and soybeans dominate the landscape and havefor years. Most farms specialize in crop or livestock production and the trend towardlarge-scale operations seems, if anything, to be gaining momentum. The effort to find aviable third crop for corn-soybean rotations is no one’s priority; far too little R+Dfunding is committed, over the long haul, to the development of new crops and morediverse rotations and farm enterprises, a task only public sector investment can tackle.
Accordingly, innovation in farm system design appears not likely to be a majorsource of change, despite great potential to improve the performance of Midwesternfarms. A third crop might largely solve the problem with several corn insects. Bringingcattle and alfalfa back into the Midwest could help improve the performance of farmingsystems in many ways, as reported in the important November 1998 paper by Dr. LaurieDrinkwater and colleagues in Nature magazine (Drinkwater, et al., 1998). The papershows that crop rotations including legumes and cover crops combined with agronomicpractices favoring biodiversity can markedly improve the efficiency of nitrogen andcarbon cycles, thereby helping to meet U.S. obligations in the Kyoto Protocols. Suchsystems can, moreover, sustain high yield levels and lessen nitrogen losses togroundwater by over 50 percent compared to conventional systems. But with nitrogen

9
priced so low and no rewards for lessening losses to the environment, sustainable farmingsystems remain at a competitive disadvantage. A provocative “News and Views” pieceby University of Minnesota ecologist David Tilman accompanies the Drinkwater et al.paper and begins by saying –
“It is not clear which are greater – the successes of modern high-intensityagriculture, or its shortcomings.” (Tilman, 1998).
After reviewing why conventional agricultural systems have become so “leaky”and describing the technological foundations for the Green Revolution, Tilman goes on tosay –
“…a greener revolution is needed – a revolution that incorporatesaccumulated knowledge of ecological processes and feedbacks, disease dynamics,soil processes and microbial ecology.”
I agree, but do not see such a greener revolution on the horizon because those nowdriving technological change in agriculture have little to do with ecology and limitedinterest in probing the environmental dimensions of farming system performance, beyondovercoming regulatory hurdles. Most academics raising ecological questions withincolleges of agriculture are not given the institutional support needed to make sustainedprogress. Some pursue these issues at considerable risk of professional consequences.
What Drives Technological Change in Agriculture?
During the 20th century most major technological changes have emerged fromresearch carried out within the land grant university system and USDA in response tonatural resource, farming system, genetic or biological constraints. The private sectoralways played a vital supporting role in making new technologies commercially viableand delivering them to farmers. But until recently the needs of farmers and society as awhole have largely driven the public R+D agenda, and hence have shaped the nature ofmost emerging technologies.
The polarity has clearly shifted since the early 1980s. Agricultural R+Dpriorities and investments are now responding to the opportunity to increase historicalrates of return on private sector investment. Private companies have always and willalways work to make a profit, as farmers also work to earn profits. Profits keep thesystem vibrant and investment capital flowing into agriculture. But new issues arearising because technology and industrial restructuring are fundamentally shifting the“terms of trade,” and hence the relative economic performance and power across sectorsin the food system. In the past, seed, farm machinery and pesticide manufacturersdepended directly on a healthy farm sector to assure that their customers would return tothe marketplace every year, and agribusiness supported policies that helped keep farmersin business and eager to increase productivity. But now, across many fronts, inputsuppliers, processors and integrators are getting more directly involved in the

10
management and control of farms, and blurring the line between farm and agribusinessincome, profit, decision-making, and risks.
Public sector investment in the agricultural sciences and public institutions haslagged far behind need and even further behind private sector willingness to invest in newbiotechnologies. Shrinking public research budgets have forced land grants to carry outwork of interest to the private sector. In many public institutions, scientists are nowactively encouraged to pursue partnerships, private grant funding, and royalty income bytargeting research toward patentable discoveries of likely interest to the private sector.
In addition, a growing share of the research effort in the land grant system isproblem or crisis driven and short-term, quick-fix oriented, as opposed to focusing ondiscovering the genetic or biological basis for inherently more productive and profitablefarming systems over the long-run. The near-term problems demanding attention oftenarise from the combination of chemical technologies and homogenous, large-scaleproduction systems. As we train students and conduct research to better address thebiological and resource-base miscues of current production systems, we fail to pursuescience that might open up wholly new avenues to improved farming systems andtechnologies that are inherently more productive, profitable and sustainable.
In the world of biotechnology, the land grant system is now struggling with a dualrole. The system has been and remains a major developer and promoter ofbiotechnology. But second, it is also the only public institution with the expertise andability to project and understand the myriad potential adverse ecological, biological andeconomic consequences of biotechnology. How will land grant universities reconcilethese dual roles? How well it does so will no doubt influence the degree to which thesystem remains largely public or becomes increasingly private.
C. Herbicide Tolerant Plant Varieties
Roundup Ready soybeans, other herbicide-tolerant varieties and Bt-transgenicsclearly comprise the first wave of the biotechnology revolution. After just two years ofwidespread commercial use, over one-third of U.S. soybean acreage will be planted toRoundup Ready varieties in crop season 1999 – a remarkable and unprecedented changein weed management system technology.
Given how fast Roundup Ready beans have gained marketshare, one might inferthat farmers have recently been plagued by serious problems managing weeds insoybeans. But actually in the 1980s and the 1990s the range of soybean weedmanagement systems and technologies has exploded.
Ridge tillage, no-till, banding, improved cultivators, newly registered post-emergent herbicides and new planting systems gave farmers many new options. Thechemical toolbox is overflowing – more than two-dozen new active ingredients have beenregistered in several families of chemistry. The first herbicide-tolerant soybeans wereplanted on a commercial scale in 1996. The problem for farmers seeking herbicide-based

11
solutions has become the complexity of choices and compatibility with soil types,varieties, and farming systems, along with containing cash costs.
Why the rush to develop and market RR soybeans? My guess is that in the mid-1980s Monsanto business managers recognized in biotechnology a way to extend highprofit margins from Roundup sales beyond the end of patent protection in the year 2000.They knew the price of Roundup would come down as other manufacturers entered themarket, a process that has already begun. But by developing and marketing RoundupReady plant varieties, Monsanto could, in effect, transfer high profits from sale of thechemical to “seed plus technology packages” accompanied by a technology fee.
Indeed, the announcement a few weeks ago that Monsanto is lowering the price ofRoundup but increasing the Roundup Ready technology fee is consistent with such anoverall plan.
Evaluating Weed Management Systems
Three criteria should be applied in judging weed management systems andtechnology3 –
• Long-term Effectiveness -- the scope and difficulty of weed managementchallenges over time.
+ The goal should be lower weed seed density and fewer outbreaks overtime.
• Robustness -- the ability to respond to unexpected conditions and shifts inweed pressure.
+ The goal is more and better tools to deal with whatever problemsemerge; in short, greater system resiliency.
• Weed Management System Costs.+ The goal is lower weed management costs per bushel produced and as apercent of net crop income.
Applying these criteria in evaluating Roundup Ready beans is a reasonablystraightforward exercise. When first introduced, Monsanto promised that RoundupReady soybeans would greatly simplify weed management. Just plant, spray once andrelax for the rest of the season. If the technology had lived up to this early billing, itwould have satisfied the first two criteria. But in the field, nature’s proclivity to adapthas made things much more complicated and the future uncertain for users of thistechnology.
Two weed scientists in Iowa, Dr. Bob Hartzler and Dr. Doug Buhler, have studiedone reason -- weed emergence patterns. They have found, not surprisingly, that different
3 I thank Dr. Matt Liebman, Iowa State University, for suggesting these criteria.

12
weeds emerge at different points during the season (see this and other excellent weedmanagement resources on the Iowa State University Extension weed management site at<http://www.weeds.iastate.edu/mgmt/qtr98-4/emergencepatterns.htm>; and Buhler, et al.,1997). Use of an over-the-top non-residual systemic herbicide like Roundup willgenerally work well in managing the weeds that have recently germinated, but will missweeds that germinate either earlier or later. Growers planting RR soybeans have, as aresult, three choices –
• Apply early to avoid early-season yield losses from fast growing grasses,possibly suffering yield losses from late season weeds;
• Delay applications until most weeds have germinated, risking loss of yield toearly weeds; or,
• Apply Roundup twice or more, and/or a residual herbicide at planting or whenRoundup is applied.
Most are choosing the third option, since there is a very low tolerance amonggrowers for either weeds in fields or yield losses.
The emergence of tolerant and/or resistant weeds is a second mechanism likely toundermine the long-term effectiveness of Roundup Ready soybean systems. Indeed it isalready happening. Researchers have documented glyphosate resistance in a rye grassspecies. Tolerant populations of waterhemp, sometimes called pigweed, are emergingacross the Corn Belt. This particular species of weed is highlighted in the 1998 edition ofthe Weed Control Manual as the most worrisome “Up and Coming Weed” bothnationwide and in the North Central region (Meister, 1998). Reasons why include theemergence of resistance to triazine and ALS herbicides and its ability to withstandRoundup applications (for an up to date overview by Iowa weed scientist Bob Hartzler,see <http://www.weeds.iastate.edu/mgmt/qtr98-4/roundupfuture.htm>).
Because of resistance and weed shifts, Roundup Ready soybeans clearly flunk thefirst criterion since weed management problems are already getting worse on farmsrelying on Roundup Ready technology. Much evidence, ecological theory, and practicalpest management experience suggests such problems will worsen on farms that continueto rely mostly on Roundup Ready varieties. The combination of Roundup Ready beansand Roundup Ready corn in a rotation will further torque the ecology of weedpopulations and will eventually bring on the loss of commercial viability of thistechnology.
The second criterion involves the robustness of weed management systems – thecapacity of farmers to respond to unexpected circumstances, whether brought on byweather, the evolution of a new weed biotype, or a change in tillage systems. On thiscriterion, Roundup Ready systems get a passing grade because the systems do not forcefarmers to forego most other weed management options. Farmers can still choose to

13
apply other herbicides. Early season cultivation remains an option, as does diversifyingrotations and use of cover crops.
Cost is the final criterion and the one most likely to limit adoption. Coverage inthe farm press makes it clear that Roundup Ready systems offer farmers modest potentialto reduce costs per bushel IF everything works well – i.e., there is no yield drag and oneapplication of Roundup is sufficient in managing weeds. When a second application ofRoundup is added, or another herbicide, the economic advantage largely disappears.
In parts of the Midwest the costs of Roundup Ready soybean systems have takenoff. At a recent field day the Adair County Soybean Association released its projectionof the costs of a "total" Roundup Ready system4 in 1999 --
• Burndown with Prowl, 2,4,-D and Roundup Ultra, $19.40 per acre.
• June spray with 2 pints/acre Roundup Ultra and adjuvants, $15.31.
• July respray with 1 pint Roundup Ultra, $9.06.
• Seed cost per acre (includes $5.00 technology fee), $25.00.
Even after the recent price discounts announced by Monsanto, the full RoundupReady system will cost an amazing $68.77 per acre in 1999, about 50 percent more thanthe cost of seed plus weed management systems in the Midwest in recent years, as shownin Table 1.
Many farmers have been willing to accept such increases in costs in return for theperceived advantages in managing weeds. But with crop prices heading down, severalnew herbicides gaining registration, and growing evidence of a yield drag, farmers willbegin to look elsewhere for weed management options. Monsanto is already taking stepsto preserve its marketshare by lowering the cost of technology, and further pricereductions can be expected in the future. How this will play out for farmers and theseed-pesticide industry remains to be scene.
Table 1 shows clearly that soybean chemical costs – the vast majority forherbicides -- jumped dramatically between 1988 and 1990 in the Corn Belt region. Overthe last decade, soybean seed plus chemical costs have risen $20.07 per acre, or 80percent. Total costs rose just 22 percent over the same 10-year period.
The impact of the higher per acre cost of Roundup Ready and other herbicide-tolerant soybeans begins to show up in the 1997 data; note the 25 percent increase in seedprices from 1996 to 1997 – I believe, the largest annual jump in history. Increases inherbicide costs account for about one-third, and seeds two-thirds of the total increase inseed plus chemical expenditures.
4 Contact Dean Stormer, Adair County Soybean Association for details at 515-337-5436.

14
As a percent of variable costs, herbicide expenditures have risen from 24 percentto 36 percent over the past decade. Seed plus chemical costs rose from 47 percent to 61percent over the same period.
Since 1975, seed plus chemical costs have doubled per bushel harvested – risingfrom $0.53 per bushel harvested to $1.06. The share of the a farmer’s income per acredevoted to seed and chemical expenditures has risen over 50 percent since 1975 -- from10.8 percent in 1975 to 16.3 percent in 1997.
In the next few years, seed plus herbicide costs are bound to rise further.Everyone expects that a higher percentage of soybean acres will be planted to GMOvarieties and that most farmers doing so will need to apply two or three applications oftwo or more herbicides. Weed shifts, resistance and aggressive marketing programs will
1975 1980 1985 1988 1990 1992 1994 1996 1997Production Expenditures
Seed $8.09 $8.09 $13.82 $12.60 $13.52 $13.30 $14.65 $16.11 $20.12Chemicals 8.68 12.24 12.90 12.78 21.51 24.59 25.63 26.16 28.33
Seed+Chemicals 16.77 20.33 26.72 25.38 35.03 37.89 40.28 42.27 48.45 Other 16.23 29.87 28.85 28.09 32.27 33.15 33.75 36.27 30.41
Total variable 33.00 50.20 55.57 53.47 67.30 71.04 74.03 78.54 78.86 Total Cash Expenses $68.50 $104.32 $101.06 $105.03 $111.14 $115.67 $123.04 $131.58 $128.15
Yield (bushels) 31.52 33.19 38.01 27.46 37.59 39.35 43.96 38.43 45.75 Harvest Period Price $4.91 $7.62 $4.83 $7.54 $5.87 $5.24 $5.34 $6.91 $6.51
Gross Value of Production $154.76 $252.91 $183.59 $207.05 $220.65 $206.19 $234.75 $265.55 $297.83Total Costs $125.28 $205.16 $182.37 $196.46 $200.79 $210.27 $226.35 $241.19 $249.58Net Income $29.48 $47.75 $1.22 $10.59 $19.86 ($4.08) $8.40 $24.36 $48.25
Chemicals as Percent of Total Variable Costs 26.3% 24.4% 23.2% 23.9% 32.0% 34.6% 34.6% 33.3% 35.9%
Chemicals as Percent of Total Costs 6.9% 6.0% 7.1% 6.5% 10.7% 11.7% 11.3% 10.8% 11.4%
Chemical Expenditures per Bushel $0.28 $0.37 $0.34 $0.47 $0.57 $0.62 $0.58 $0.68 $0.62
Seed and Chemicals as Percent of Variable Costs 50.8% 40.5% 48.1% 47.5% 52.1% 53.3% 54.4% 53.8% 61.4%
Seed and Chemicals as Percent of Total Costs 13.4% 9.9% 14.7% 12.9% 17.4% 18.0% 17.8% 17.5% 19.4%
Seed and Chemicals per Bushel $0.53 $0.61 $0.70 $0.92 $0.93 $0.96 $0.92 $1.10 105.9%
Seed Expenditures as a Percent of Gross Income 5.2% 3.2% 7.5% 6.1% 6.1% 6.5% 6.2% 6.1% 6.8%
Chemical Expenditures as a Percent of Gross Income 5.6% 4.8% 7.0% 6.2% 9.7% 11.9% 10.9% 9.9% 9.5%
Seed plus Chemical Expenditures as a Percent
of Gross Income 10.8% 8.0% 14.6% 12.3% 15.9% 18.4% 17.2% 15.9% 16.3%
Table 1. Soybeans -- Seed and Chemical Production Expenses in Corn Belt States, 1975-1997
Source: Returns and cost of production data series from the National Agricultural Statistics Service, USDA. Calculations by Benbrook Consulting Services.

15
work together in unpredictable ways driving further change in weed managementsystems.
Table 2 presents the same data on corn seed and weed management costs. Just asthe case with soybeans, seed costs started to increase at a rate well above historical trendsbetween 1995 and 1997, corresponding to the increases in R+D expenditures and the firstreleases of herbicide-tolerant varieties and Bt-transgenics. Over the last two decades,seed and chemical costs as a percent of production costs have risen marginally, but costshave almost doubled per bushel. Costs as a percent of gross income have grown about 50percent since 1975.
For a variety of reasons, the costs of seed corn plus weed management are alsolikely to rise sharply in the next few years. Consider the implications of one just-announced corn program, sure to serve as a model for future soybean programs. AgrEvoand Novartis are offering a “guaranteed” corn weed control for farmers plantingAgrEvo’s Liberty-Link corn who also buy and apply Novartis’ Dual Magnum II (S-metalochlor + benoxacor) or Bicep II (S-metalochlor + benoxacor + atrazine) herbicide.
That’s up to four active ingredients in managing weeds after planting a varietythat supposedly makes weed control easier. Offering guarantees as a marketing ploy hasbeen strongly criticized in the past for establishing unreasonable expectations amongfarmers, ratcheting up cash expenditures, and encouraging excessive herbicide use, whichcan trigger resistance and other problems. Despite some progress in recent years inconstraining the scope and expense of herbicide guarantee programs, some companiesenvious of Monsanto’s successes with Roundup Ready varieties are bound to offerfarmers a range of incentives to switch to their “technology package.” Monsanto alsocontinues to carry out an aggressive marketing campaign that earned the company two ofthe four “Herbicide Advertising Hall of Shame” awards given out by Iowa StateUniversity Extension weed management experts(http://www.weeds.iastate.edu/weednews/adhallofshame.htm>).
Higher weed management costs, weed shifts and resistance are not the onlyproblem that may evolve from widespread planting of herbicide-tolerant crops.Research shows that changes in soil microbial communities caused by Roundup and otherlow-dose herbicides can both increase the vulnerability of beans to Pythium and reducethe uptake of phosphorous (Forlani et al., 1995). And research continues into the causeof this year's serious die-back problems in Missouri.

16
Lessons Learned
There is clearly much left to learn about how herbicide-tolerant varieties willchange agricultural systems, pest pressure, crop physiology, and soil health. Midwesternfarmers are “learning by doing.”
There are strong linkages forged by immutable laws of nature between weedmanagement systems, reliance on and the costs of technology, and the impacts of weedmanagement on yields, the environment and profitability. Three are inescapable.
• First, count on nature to find ways to evolve around any weed managementsystem that rests upon one or a few closely related weed managementpractices or technologies.
• Second, the key to keeping weed management systems effective and costsdown is to diversify the systems over time and space.
1975 1980 1985 1988 1990 1992 1994 1996 1997Production Expenditures
Seed $9.51 $14.66 $18.84 $19.21 $20.70 $21.96 $22.19 $27.38 $29.60Chemicals 12.13 15.13 20.29 22.59 24.88 23.91 25.52 28.66 28.07
Seed+Chemicals 21.64 29.79 39.13 41.80 45.58 45.87 47.71 56.04 57.67 Other 59.39 89.47 96.19 81.41 89.29 85.54 89.69 102.07 102.15
Total Variable 81.03 119.26 135.32 123.21 134.87 131.41 137.40 158.11 159.82 Total Cash Expenses $131.00 $186.81 $199.09 $168.89 $184.30 $173.37 $184.89 $212.20 $208.89
Yield (bushels) 91.80 98.50 121.96 77.19 122.71 135.77 145.46 132.12 134.92 Harvest Period Price $2.49 $3.04 $2.09 $2.56 $2.16 $2.01 $2.02 $2.78 $2.50
Gross Value of Production $228.58 $299.44 $254.90 $197.61 $265.05 $272.90 $293.83 $370.85 $341.26Total Costs $189.11 $268.41 $281.32 $261.33 $299.89 $296.26 $313.35 $362.39 $357.67Net Income $39.47 $31.03 ($26.42) ($63.72) ($34.84) ($23.36) ($19.52) $8.46 ($16.41)
Chemicals as Percent of Total Variable Costs 15.0% 12.7% 15.0% 18.3% 18.4% 18.2% 18.6% 18.1% 17.6%
Chemical Expenditures per Bushel $0.13 $0.15 $0.17 $0.29 $0.20 $0.18 $0.18 $0.22 $0.21Seed Expenditures as
Percent of Total Variable Costs 11.7% 12.3% 13.9% 15.6% 15.3% 16.7% 16.1% 17.3% 18.5%
Seed Expenditures per Bushel $0.10 $0.15 $0.15 $0.25 $0.17 $0.16 $0.15 $0.21 $0.22
Seed and Chemicals as Percent of Variable Costs 26.7% 25.0% 28.9% 33.9% 33.8% 34.9% 34.7% 35.4% 36.1%
Seed and Chemicals as Percent of Total Costs 11.4% 11.1% 13.9% 16.0% 15.2% 15.5% 15.2% 15.5% 16.1%
Seed and Chemicals per Bushel $0.24 $0.30 $0.32 $0.54 $0.37 $0.34 $0.33 $0.42 $0.43
Seed and Chemical Expenditures as Percent of
Gross Income 9.5% 9.9% 15.4% 21.2% 17.2% 16.8% 16.2% 15.1% 16.9%
Table 2. Corn -- Seed and Chemical Production Expenses in Corn Belt States, 1975-1997
Source: Returns and cost of production data series from the National Agricultural Statistics Service, USDA. Calculations by Benbrook Consulting Services.

17
• Third, relying on genetic changes to deal with management problems can poseunexpected drains on system productivity.
Last, it now seems clear that the major driving force behind efforts to developherbicide tolerant varieties was the desire to hold onto or create higher profit marginsfrom the sale of proprietary herbicides. While an understandable strategy for thecompanies pursuing it, the larger question is whether it will deliver benefits to farmersand society as a whole.
D. Evolving Insect Pest Management Challenges
New insect and weed management problems in the corn-soybean rotation arisethrough one of several mechanisms from selection pressures inherent in common row-crop agricultural systems. Each new challenge reflects the success of adaptive forces thatwill, in the years ahead, work to undermine the effectiveness of emerging technologies.
Cost-effective use of pest management technology, regardless of its genesis,depends upon the degree to which it helps diversify and complicate the challenges facedby pest species within farm fields. Many technologies once heralded as majorinnovations have failed because of agriculture’s tendency to rely on technology tosimplify and homogenize systems rather than to diversify them.
To correct the underlying problem, farmers need to look at their farms and fieldsthrough the lens of evolutionary biology. Farmers will either learn to manage selectionpressure or will continue to be managed by it.
Turning selection pressure into a positive force will pose many new challengesfor land grant scientists and farmer-networks. A new generation of diagnostic tools areneeded. The chemical cues governing soil microbial interactions with roots andpathogens will need to be isolated, along with threshold levels that seem associated withdisease suppressive or conducive soils. Others will then need to work on the discovery ofgenetic, biopesticide and cultural practices that can help trigger resistance mechanismssooner and more effectively.
Evolutionary Biology in Action
The most important recent change in insect pressure in the Midwest has arisenfrom the behavioral adaptation of the Western corn rootworm (WCR) to the long-effective corn-soybean rotation. This simple, moneymaking rotation has been one of thegreat success stories in the world of cultural pest management practices, reducing corninsecticide use by half, lessening water quality problems and reducing grower cash costs(for a solid overview, see Gray et al., 1998). On continuous corn in the 1990s, 90percent or more of corn acres are treated with a soil insecticide while less than 15 percentof rotated corn has been treated.
18
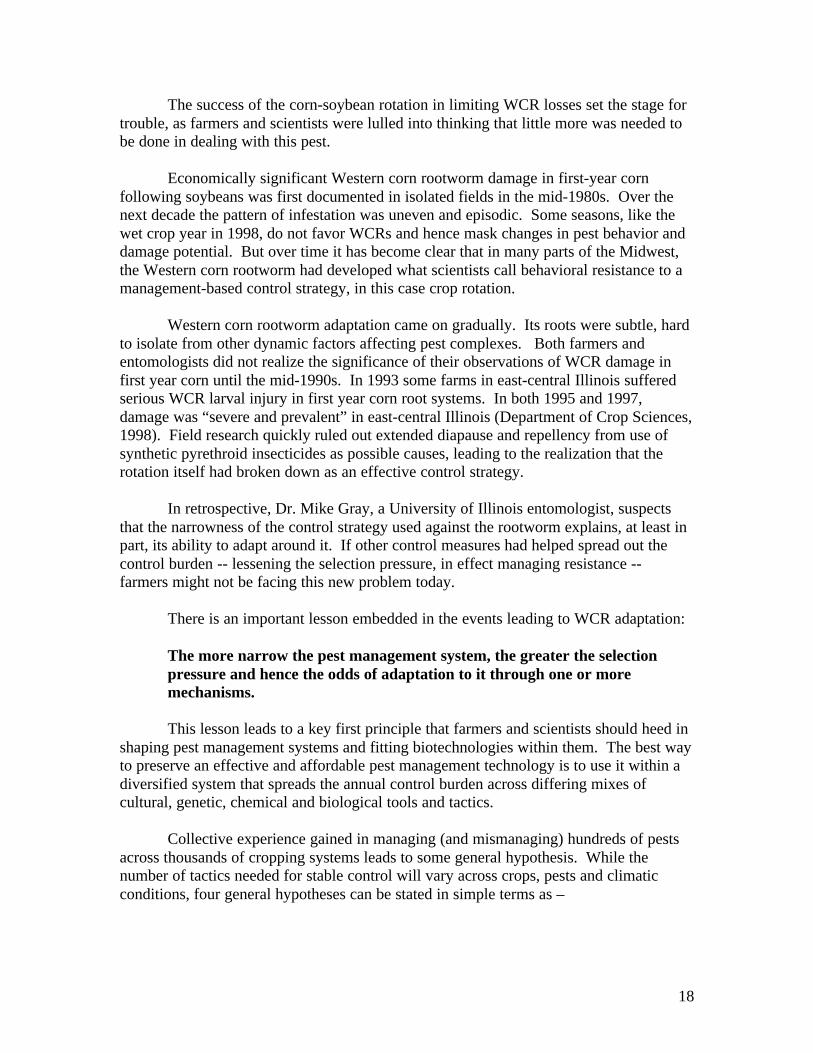
The success of the corn-soybean rotation in limiting WCR losses set the stage fortrouble, as farmers and scientists were lulled into thinking that little more was needed tobe done in dealing with this pest.
Economically significant Western corn rootworm damage in first-year cornfollowing soybeans was first documented in isolated fields in the mid-1980s. Over thenext decade the pattern of infestation was uneven and episodic. Some seasons, like thewet crop year in 1998, do not favor WCRs and hence mask changes in pest behavior anddamage potential. But over time it has become clear that in many parts of the Midwest,the Western corn rootworm had developed what scientists call behavioral resistance to amanagement-based control strategy, in this case crop rotation.
Western corn rootworm adaptation came on gradually. Its roots were subtle, hardto isolate from other dynamic factors affecting pest complexes. Both farmers andentomologists did not realize the significance of their observations of WCR damage infirst year corn until the mid-1990s. In 1993 some farms in east-central Illinois sufferedserious WCR larval injury in first year corn root systems. In both 1995 and 1997,damage was “severe and prevalent” in east-central Illinois (Department of Crop Sciences,1998). Field research quickly ruled out extended diapause and repellency from use ofsynthetic pyrethroid insecticides as possible causes, leading to the realization that therotation itself had broken down as an effective control strategy.
In retrospective, Dr. Mike Gray, a University of Illinois entomologist, suspectsthat the narrowness of the control strategy used against the rootworm explains, at least inpart, its ability to adapt around it. If other control measures had helped spread out thecontrol burden -- lessening the selection pressure, in effect managing resistance --farmers might not be facing this new problem today.
There is an important lesson embedded in the events leading to WCR adaptation:
The more narrow the pest management system, the greater the selectionpressure and hence the odds of adaptation to it through one or moremechanisms.
This lesson leads to a key first principle that farmers and scientists should heed inshaping pest management systems and fitting biotechnologies within them. The best wayto preserve an effective and affordable pest management technology is to use it within adiversified system that spreads the annual control burden across differing mixes ofcultural, genetic, chemical and biological tools and tactics.
Collective experience gained in managing (and mismanaging) hundreds of pestsacross thousands of cropping systems leads to some general hypothesis. While thenumber of tactics needed for stable control will vary across crops, pests and climaticconditions, four general hypotheses can be stated in simple terms as –

19
1. A pest management system that relies predominantly on one tactic isinherently vulnerable. The more generations of a pest in a season, and the longerthe pest is subject to selection pressure from a single tactic, the greater the oddsthe pest will adapt around the tactic and adapt quickly.
2. Systems that spread control in a given crop cycle over two substantiallydifferent tactics remain vulnerable, but to a lesser degree. Two unrelated tacticsused together in a given year will be more effective, in most circumstances, thantwo tactics used in isolation, one the first crop cycle, another during the second.Two different sets of two unrelated tactics in successive crop cycles will furthertip the odds in favor of farmers and sustainability, and may be essential in the caseof insects with multiple generations per season (i.e., most damaging species).
3. Systems with three or more distinct but significant control tactics arelikely to be sustainable in the hands of good managers who act upon the first signsof trouble by further diversifying and complicating the tactics mixed withinintegrated control systems. By “significant,” I mean a control tactic that in someyears can be effective alone and which rarely fails when combined with anothermajor tactic.
4. In all pest management systems, there is a minimal degree ofredundancy in control tactics below which the odds of adaptation steadilyimprove toward certainty, as well as a degree of redundancy above whichadaptation becomes unlikely and easily managed if it begins to appear.
Testing these hypotheses and establishing the thresholds noted in the fourthhypothesis should become an important focus of land grant pest managementprofessionals. Imagine how helpful such information would have been in 1986 whenproblems first arose with the Western corn rootworm in first-year corn. If Illinoisentomologists had known then that insects like the WCR are likely to adapt around acultural control tactic when it is the sole tactic used, they might have realized morequickly what was happening in the field and how to avoid it becoming a stable, state-wide problem.
In 1999 Illinois entomologists are struggling, among other things, to deal with theprospect of resistance emerging to Bt-transgenic corn. The same knowledge about thelinkages between the diversity of pest management systems and their resiliency would bevery helpful in designing hopefully effective resistance management plans.
WCR and Biotech Drive Change in Corn Insect Pest Management Systems
Now that a new strain of the WCR has emerged, farmers and university IPMspecialists have no choice but to manage it with the tools currently available. Theresponse of Illinois agriculture to this new pest is an intriguing test of the system,

20
conventional wisdom and openness to new technologies. The test is even moresignificant given the big push behind Bt-transgenics to manage European corn borers, aswell as the rush to market seed genetically engineered to resist WCR.
While WCR levels were way down in 1998 because of the cool, wet spring,scientists warn that they will be back when conditions turn more favorable. By 1998 theuniversity had developed new scouting techniques and thresholds to determine whetherWCR levels in a soybean field were high enough to threaten the next year’s corn crop.Working with consultants, coops and grower groups, university specialists quicklydisseminated information on pheromone trap-based scouting techniques for use insoybean fields, along with economic thresholds for WCR adults caught in traps placed insoybean fields. Apparently the word got around. I have been told that Illinois corngrowers almost single-handedly exhausted the world’s supply of Pherocon AM yellowsticky traps last summer.
Tables 3, 4, 5 show corn insecticide use in Illinois in 1991, 1994, and 1997.Organophosphate insecticides accounted for 70, 80 and 60 percent of the acres treated in1991, 1994 and 1997. This family of chemistry accounted for over 96 percent of thepounds applied, and virtually all the toxicity units – a measure of the mammalian toxicityof pesticides applied (Benbrook et al., 1996). Chlorpyrifos was the most widely usedproduct, accounting for about one-third of acres treated. While rising in recent years anda major cause of concern over environmental impacts, corn insecticide use is a fraction ofwhat it once was. Use peaked in the mid-1970s at over 30 million pounds per year –more than seven-times today’s level.
Use was stable in 1995 and 1996 but began to rise in 1997 as a result of lossesincurred in 1996 in east central Illinois (see Table 5). Acres treated and pounds appliedrose over 15 percent, with the biggest jump in chlorpryifos use. Illinois entomologistsreport substantially greater use in 1998. While some have raised concerns over theimpact of the Food Quality Protection Act on the availability of OP insecticides for cornproduction, such fears are premature since OP residues hardly ever show up in corn-based products from field use. (Post-harvest uses of insecticides in stored corn is morelikely to lead to residues than field use). If corn insecticide use rises to the point that
Active IngredientPercent Acres
Treated
Acres Treated
Pounds Applied
Pounds per Acre Treated
Chronic Toxicity Units
Toxicity Units per
Acre Treated
terbufos 7 784,000 839,000 1.07 1,678,000,000 2,140 chlorpyrifos 11 1,232,000 1,427,000 1.16 475,661,910 386fonofos 5 560,000 662,000 1.18 33,100,000 59tefluthrin 3 336,000 47,000 0.14 940,000 2.8permethrin 3 336,000 63,000 0.19 667,800 2.0Totals 3,248,000 3,038,000 2,188,369,710
OPs as Percent of Total 79.3% 96.4% 99.9%
Table 3. Insecticide Use on Corn in Illinois in 1991 Ranked by Toxicity Units per Acre Treated (11.2 Million Acres Planted)

21
water resources are contaminated, the FQPA will no doubt become an issue sinceexposures through drinking water must be taken into account in determining acceptablelevels of exposure. (For a review of the FQPA and the status of implementation efforts,see the Consumers Union FQPA website, http://www.ecologic-ipm.com).
The FQPA may have a more direct impact on soybean sector. The USDA has justreleased the results of its 1997 Pesticide Data Program residue monitoring. For the firsttime, USDA carried out a special survey of residues in soybeans. Surprisingly, over 80percent of the 159 samples tested had residues of chlorpryifos and 53 percent containedmalathion. These residues almost surely are the result of post-harvest use, but will getEPA’s attention because of the potential space within the OP risk cup that would need tobe reserved to cover these residues. It is also likely that some buyers in Asia will monitorU.S. soybeans more closely for OP residues, especially when the beans are destined fordirect human consumption.
Active IngredientPercent Acres
Treated
Acres Treated
Pounds Applied
Pounds per Acre Treated
Chronic Toxicity Units
Toxicity Units per
Acre Treated
terbufos 7 812,000 971,000 1.20 1,942,000,000 2,392 chlorpyrifos 11 1,276,000 1,318,000 1.03 439,328,940 344 phorate 1 116,000 177,000 1.53 35,400,000 305 fonofos 3 348,000 322,000 0.93 16,100,000 46 tefluthrin 4 464,000 56,000 0.12 1,120,000 2 permethrin 5 580,000 58,000 0.10 614,800 1
Totals 3,596,000 2,902,000 2,434,563,740 OPs as % of Total 71.0% 96.1% 99.9%
Table 4. Insecticide Use on Corn in Illinois in 1994 Ranked by Toxicity Units per Acre Treated (11.6 million Acres Planted)
Active IngredientPercent Acres
Treated
Acres Treated
Pounds Applied
Pounds per Acre Treated
Chronic Toxicity Load
Tox Units per Acre Treated
terbufos 4 448,000 1,117,000 2.49 2,234,000,000 4,987 chlorpyrifos 16 1,792,000 2,105,000 1.17 701,659,650 392 tebupirimfos 2 224,000 22,000 0.10 11,000,000 49 tefluthrin 4 448,000 57,000 0.13 1,140,000 2.5 permethrin 9 1,008,000 105,000 0.10 1,113,000 1.1 cyfluthrin 2 224,000 1,000 0.00 4,000 0.02
Totals 4,144,000 3,407,000 2,948,916,650 OPs as % of Total 59.5% 95.2% 99.9%
Table 5. Insecticide Use on Corn in Illinois in 1997 Ranked by Toxicity Units per Acre Treated (11.2 Million Acres Planted)

22
Managing Corn Insects with Transgenics
The other big changes in corn insect pest management are occurring as a result ofthe introduction of Bt-transgenic varieties that overcome attack by second generationEuropean corn borer. When first introduced, Monsanto and other companies marketingBt-corn varieties acknowledged the possibility of resistance but argued that the high-doseexpression of the Bt toxin, coupled with a 5 percent refugia planted to traditionalvarieties, would preclude the emergence of resistance.
New science and field experience have confirmed the lack of a solid science basesupporting key assumptions that underlie the Bt-transgenic resistance management plans(RMPs) accompanying transgenic crops released to date:
• Bt endotoxin expression under field conditions is not uniform across fields or withinplants, providing some insects with a chance to avoid plant tissues delivering a lethaldose. Plus Bt expression tapers off as the season progresses and any source of stressor plant injury can lead to differential toxin levels and some non-lethal foliage, whichinsects seem able to find (a form of “behavioral resistance” first recognized by Dr.Marvin Harris of Texas A+M University).
• Two studies published in 1997 show that resistance to Bt is not as rare as previouslysuspected. Dr. Gould and colleagues reported that the frequency of the major Btresistance gene in a field population of Heliothis virescens was about 0.0015 (Gouldet al., 1997). Dr. Tabashnik and colleagues showed that the frequency of a multiple-toxin resistance allele in susceptible populations of the diamondback moth was anastonishing 0.120, evidence that resistance gene carries very little, if any, "geneticload” (Tabashnik et al., 1997a).
• Resistance will emerge quickly to multiple strains of Bt endotoxin since the resistancegene appears to be a dominant trait (Tabashnik et al., 1997a,b). Tabasnik andcolleagues found that diamondback moths “share a genetic locus at which a recessivemutation associated with reduced toxin binding confers extremely high resistance tofour Bt toxins” (Tabashnik et al, 1997b). Furthermore, data from a Florida populationof diamondback moth demonstrated similar results (Wang et al., 1997). At the 1997Entomological Society meetings in Nashville, TN, Dr. Tabashnik stated that heexpected that findings similar to his would emerge in ongoing work with severalother lepidopteran species.
• Work by Dr. Angelika Hilbeck of the Swiss Federal Research Station forAgroecology and Agriculture has shown that Bt-corn can adversely impactpopulations of key beneficial insects. In a number of trials, Dr. Hilbeck reported 60to 65 percent mortality among lacewing larvae that fed on lepidopteran larvae rearedon Bt corn. (A report on this work was presented at the 1998 Joint Meeting of the

23
Entomological Society of American and the American Phytopathological Society inLas Vegas, Nevada).
Managing Resistance to Bt
Conventional wisdom has changed rapidly in the world of Bt resistancemanagement. Just a few years ago the companies introducing Bt-transgenic seedsdownplayed the prospect of resistance and submitted to the EPA reams of documentationand modeling that supported the efficacy of the high-dose plus refugia strategy.
Most university experts had little to contribute as EPA reviewed Monsanto’s Bt-corn resistance management plan, since they had not been granted access to any seed ordetailed information on the technology until the year commercial introduction began.The few that had been granted access to seed or had helped develop the technology wereconstrained by secrecy agreements and/or conflicts of interest.
Development, testing, and wide scale introduction of a major new technology innear-total secrecy is a new development that undermines some of the corrective“feedback” loops that have helped make our system of technology developmentreasonably reliable. Hearing no science-based objections from the public, EPA assumedthat no one had uncovered any problems and that hence, problems were not likely toemerge. The veil of secrecy now surrounding agricultural technology developmentefforts raises an important public policy issue. EPA regulations and rule-makings dependheavily on informed and disinterested public comment to assure thoroughness andbalance, since EPA cannot maintain “critical mass” in all areas of commerce it isresponsible for regulating. When scientists are unwilling to share data, are constrained inwhat they can report, and/or have no opportunity to study new technology, publicinstitutions and regulators have to fly blind for a period of time.
Beginning in about 1993 a small number of public interest groups started to voicestrong concerns about Bt-transgenics. In 1996 the Consumer Union (CU) book PestManagement at the Crossroads set forth the arguments why EPA should withdraw theconditional registrations granted to Bt-transgenics and called upon the agency to place amoratorium on any further approvals until proven, science-based and enforceableresistance management plans were in place. Since release of the book, CU has submittedseveral technical assessments on the risks associated with Bt-transgenics (copies can bereviewed in the genetic engineering section of the PMAC website, athttp://www.pmac.net/ge.htm).
As new Bt-varieties reached farmers, a growing number of academic scientistsstarted to assess the likelihood of resistance. Evidence mounted that the concerns werereal and that decisive steps were needed, and soon, to preserve the effectiveness of Btagainst a wide range of key Lepidopteran insects. Just in recent weeks, Monsanto andother companies have agreed to the need for at least a 25 percent refugia in the Corn Belt,and a 50 percent refugia requirement in the south, where Bt-corn and cotton are oftengrown in close proximity. While details remain sketchy on these plans, this unexpected

24
decision by Monsanto is evidence that they feel there is, in fact, a cause for preventiveaction.
Other companies are being even more direct. An incentive program has just beenannounced by Novartis. Growers that buy the appropriate share of Bt- and non-Bt seedswill qualify for a cash incentive. More such offers are bound to follow.
E. The Role of Genetics and Breeding in Enhancing Productivity
The 1979 Pioneer Hi-Bred Annual Report explains that a hybrid must go througha 5-year staged release program to gain a commercial variety number. “Most of the19,000 experimental hybrids will fall short of performance standards and many will bediscontinued after the first year of testing. Perhaps only 5 to 8 will reach and survive thefifth year of testing, and be released for production and sale.”
On its webpage today, under “Research Highlights” in corn/maize, Pioneer nowreports that:
“Every year, Pioneer maize researchers around the world evaluate about130,000 new experimental hybrids. These hybrids enter a four to five-generationtesting cycle…The top 10 percent – 13,000 – (make it to the next round ofdevelopment and testing). And finally, from about 130,000 original candidates,only about 15 to 20 hybrids ‘graduate’ to commercial status.”
The odds of a hybrid reaching the farmer have accordingly dropped from aboutone in 3,000 in 1979 to one in 7,500 today. As the science and art of genomics develops,it is likely the number of hybrids screened will increase and the odds of success willcontinue to decline, although the scope of genetic assessment will surely expand and intime the efficiency of breeding efforts will improve.
Since 1970 Pioneer Hi-Bred’s investment in corn breeding has risen steadily fromless than $10 million per year supporting some 150 scientists to about $150 million in the1990s, supporting 550 scientist years (Cassman and Duvick, 1999). Accordingly it isclear that it is taking more and more effort to sustain the 1.5-bushel average yield gainper acre that breeders have historically delivered.
How have breeders helped farmers increase yields? Dr. Don Duvick, formerresearch director of Pioneer Hi-Bred, has participated in a study of the performance of 36widely grown and successful hybrids released between 1934 and 1991, including someopen pollinated varieties. The research team found that the genetic yield potential ofmaize hybrids has increased 74 kg/ha/year, a little over 1 bushel per acre, according to alarge number of trials carried out in 1991-1994. According to Duvick, “Maximum yieldpotential per plant has neither increased nor decreased during the past 70 years, asmeasured on non-stressed plants grown at very low densities (1 plant/m2).” (Duvick,1997).

25
Cassman and Duvick cite other evidence to support the conclusion that the yieldpotential of hybrids under optimal conditions has not risen for decades. For example, thetop irrigated corn yields achieved by contest winners in Nebraska plateaued at just over300 bushels per acre decades ago and have changed little since.
Accordingly, the ability to perform well at high plant populations per acreaccounts for most of the corn yield increases since the 1940s. Over time higher yieldingvarieties were improved in their ability to resist root lodging, premature death and stalkrot, second generation European corn borer, and other stresses associated with highdensity planting (Duvick, 1997). Several other traits have not changed over time – plantheight, grain moisture at harvest, resistance to first generation European corn borer, andgrain percent oil. Duvick also points out that breeders have pushed yields up about asmuch as possible through the manipulation of a number of traits including tassel size,grain protein percent, and upright leaf habit. He sees potential for future yield increasesin heightening resistance to European corn borers, heat and drought tolerance, and abilityto perform well in even denser plantings.
Pioneer Maize Breeding Priorities
So where is Pioneer focusing now in its efforts to deliver greater value to itscustomers? The goals of its corn-breeding program are outlined on the company’sexcellent website5:
• “Develop hybrids with greater than five percent yield performance advantage.• Reduce crop losses, grower input costs and risk through genetically
engineered insect, disease and herbicide resistance into maize.• Create more value and new uses for maize…• Use available, appropriate technologies that result in improved products for
customers.”
One of the best indicators of seed company research and breeding priorities is toreview the featured characteristics of newly released varieties. Pioneer’s website featuresseven new Bt-transgenic corn hybrids in 1998. They range in CRM values and resistanceto gray leaf spot and brittle stalk. A visit to the “Products, Performance, & Info” sectionof Pioneer’s website provides perspective how these newly released varieties augment theoverall Pioneer corn seed product line. Any corn grower in northern Illinois with accessto the Internet can easily find detailed performance characteristics on both existing andnew varieties recommended by Pioneer for the North Illinois region.
Table 6 summarizes the 23 varieties listed under “Illinois North Corn Products.”Of these varieties, 10 include the YieldGuard Bt-transgenic gene and three are herbicidetolerant. The table notes 20 value-added attributes across the 23 varieties, 13 of whichare pest management related, or 65 percent. The focus on pest management related traits
5 Goals and highlights of maize research can be found athttp://www.pioneer.com/usa/research/corn_maize_research.htm.

26
is likely to persist for some time. The page announces that imidazolinone-Bt transgenicvarieties are in final testing in 1999 and will be available in the year 2000.
The North Illinois grower using a corn-soybean rotation also will find seven newsoybean varieties featured on the Pioneer website – six of them Roundup Ready.Thirteen of a total 20 soybean varieties offered are herbicide tolerant – 11 to glyphosateand two to sulfonylurea herbicides. One variety, 92B83, is resistant to both.
Based on recent Pioneer varietal introductions and those from other seedcompanies, it is clear that introducing the Bt gene and herbicide tolerance has become animportant breeding objective. It is also clear that Bt and herbicide tolerant genes havenow been introduced into such a significant portion of the corn and soybean germplasm
CRM Bt GeneLiberty
LinkImi-Resistant High Oil Waxy
White Food Corn
Corn Products
35N05 105 X X35A19 1043563 10334T14 110 X X34R07 109 X34K78 108 X34K77 10734G82 107 X34F80 110 X34E 79 1103489 10833Y09 113 X33G27 113 X33G26 11233A14 113 X32J49 114 X
Specialty Corn
34R54 108 X34P93 111 X34H98 108 X33A63 115 X32H39 114 X
High Oil
34K82 108 X X34K79 108 X
Totals 10 2 1 2 3 2
Pest Management Related
Table 6. Variety Characteristics of the 23 Pioneer Seed Corn Products Offered Farmers in North Illinois, 1999
Speciality Traits

27
that many farmers will have little choice but to continuing planting these varieties, atleast for the next few years. What is not clear, but warrants further attention, are theconsequences in terms of the overall focus and direction of breeding efforts.
For a variety of reasons including high cost, emergence of resistance to Bt, weedshifts, and/or problems exporting to Europe, some farmers may seek out varieties notincluding genetically engineered traits. The capacity of the seed industry to respond tosuch demand is another key question. Seed companies introducing GMO varieties alsomaintain non-GMO breeding lines and varieties, in part to hedge their bets and to have asupply of seed to sell to Europe and other markets not wanting GMO-seed. If and asdemand grows for non-GMO seed, the industry should be able to quickly respond to it.
And a key pragmatic question -- What portion of future year yield increases andproductivity gains will fail to materialize because of the heavy focus in the 1990s onintroducing the Bt gene and herbicide tolerance?
Seed and Pesticide Industry Consolidation: Impacts on Research andGrower Profit Margins
For decades the private sector has dominated breeding activity in crops like maizethat benefit from crossbreeding. In the case of corn and most hybrids, achieving higheryields reliably has been the dominant goal driving private sector plant breeding.
Traditionally, the public sector was largely responsible for improvement of self-pollinating crops, where the focus has often been resistance to diseases and insects. Withpassage of plant variety protection laws in the 1970s, commercial breeding activity has
1975-1979
1980-1984
1985-1989
1990-1994 1995-1997
1975-1997
Average Yield in Period (bushels) 99.96 104.80 114.11 121.85 127.75 114.00 Average Annual Yield Increase in Period 1.09 0.97 1.86 1.55 1.97 1.45 Average Harvest Price in Period $2.25 $2.63 $1.94 $2.15 $2.67 2.32
Value of Average Annual Increase in Grower Income Attributed to Genetic Improvement (60 percent) $1.47 $1.53 $2.17 $2.00 $3.15 2.01
Average Annual Increase in Seed Expenditures $0.60 $1.20 $0.50 $0.30 $2.47 0.87
Grower Return to $1.00 Increase in Seed Expenditures $2.46 $1.27 $4.33 $6.66 $1.28 2.30
Table 7. Grower Returns to Corn Seed Expenditures: Corn Belt States, 1975-1997
Source: Calculations by Benbrook Consulting Services. Annual data on corn production, yield and expenditures from the costs of production data series compiled by the Economic Research Service, USDA.

28
increased. According to Duvick, the increase in private funding for breeding hastriggered declines in public sector support “almost in inverse ratio to the increase inprivate activity” (Duvick, 1998).
In the 1989 report “Investing in Research,” the NRC’s Board on Agricultureestimated total seed industry research expenditures in 1986 at $170 million, about 7percent of total private sector research in the food and agricultural industries. In contrast,the pesticide industry invested an estimated $695 million, or 28 percent of total privateR+D.
As noted before, the integration of the seed and pesticide industries has beendriven predominantly by the opportunity to use genetic engineering to preserve profitmargins for proprietary pest management technology. Many questions have been raisedabout the long-term consequences of these fundamental changes in industry structure forfarmers, the environment and the country as a whole.
There is some evidence already of one impact of changes in corporate structure --seed plus pesticide technology packages appear to be eroding the traditionally high rateof return farmers have enjoyed from investments in improved hybrids.
For decades the rule of thumb has been that the seed industry has delivered $3.00of added income for every additional dollar spent on hybrid seed. Corn cost ofproduction, yield, and price data comes close to supporting this general rule of thumbover the period 1975 through crop season 1997. As shown in Table 7, the averagegrower return to an additional dollar spent on hybrid corn seed was $2.30. From 1985through 1994 the return was well above $3.00 for each additional dollar spent.
Table 7 and Table 8, which presents the same data on soybeans, include a criticalassumption. In estimating the financial return to breeding, it is necessary to determinewhat portion of yield increases are attributed to breeding in contrast to more intensiveinput use, better equipment and more timely, accurate planting, and other managementfactors. Based on the literature, I used 60 percent in these tables, a figure on the low-endof the range of available estimates. Those that believe breeding has been the dominantforce between yield growth argue for a figure closer to 80 percent. If one were to accept80 percent as the portion of yield enhancement attributed to breeding, the return to anadditional $1.00 spent on corn seed over the last 23 years would be $3.05.
Over the last 23 years, average Corn Belt yields rose from an average of about 95bushels in the 1970-1975 period to 128 bushels per acre, about 1.5 bushels per year.Using average market prices in each five-year period, I calculated the average annualreturn to increased expenditures on seed by corn farmers, based on USDA data coveringthe Corn Belt region. In the period 1975-1979, yields rose on average 1.09 bushels peryear, earning for farmers $2.45 more in income. I assumed that genetic enhancementaccounted for 60 percent of the yield growth, and hence multiplied the increase in incomeof $2.45 by 0.6, producing the estimated return to the grower of $1.47 per acre. During

29
this same period, farmers spent an average of $0.60 more on seed each year. Thus, foreach additional $1.00 spent farmers received $2.46 in added income.
The return to expenditures on corn seed rose sharply in the 1985-1995 period,reaching over $6.50 for every dollar spent in the period 1990-1994. But in 1995, theaverage annual increase in seed costs jumped some eight-fold to $2.47, reducing thereturn to $1.28 for each additional dollar spent on seed.
A much different picture emerges in a review of grower expenditures on soybeanseed. Over the past 23 years, farmers have clearly not benefited nearly as greatly fromadditional money spent on soybean seed. For each additional $1.00 spent, farmers havereceived about $0.35 in return. Yields have risen just marginally since the mid-1970swhile expenditures on seed about doubled between 1975 and 1996, rising from $8.14 peracre to $16.87. In 1997, the price of soybean seed took off, rising about 25 percent to$20.12, largely as a result of the widespread introduction of new herbicide-tolerantvarieties. I am sure costs continued upward in 1998 and that average expenditures on theorder of $25.00 per acre are now common (about the cost of RR soybeans).
It remains to be seen how much more farmers will be willing to pay for theperceived weed management advantages associated with planting herbicide tolerantvarieties. The industry has recently announced almost across the board reductions in theprice of herbicides and seed-pesticide “technology packages,” so apparently mostcompanies are not eager to test the ceiling in farmer willingness to pay under the presentmarket conditions.
Why the big jump in both corn and soybean seed prices beginning in the mid-1990s?
First, the integration of the seed and pesticide industries has been costly.Competition for seed company assets across the historically larger and more profitablepesticide industry has driven up the value of seed companies by at least 50 percent in amatter of a few years. Inflated stocks have inflated appetites for capital and income.Accordingly, industry integration has required a greater share of grower-income toservice debt and deliver an acceptable rate of return to shareholders. In addition, in thelast few years seed companies have increased the portion of income devoted to researchfrom the historic industry average of 5 percent to 8 percent of sales to 12 percent to 15percent (NRC, 1990; Duvick, 1998). Since the seed industry used to operate at muchlower profit margins than the pesticide industry, financing this increase in R+Dexpenditures has placed upward pressure on prices on seed and/or technology fees.

30
Second, since the mid-1990s a growing portion of the focus of breeders has beendevoted to the introduction of either herbicide tolerant or Bt genes into elite germplasmand top-selling hybrids. This has increased the costs of developing, patenting, obtainingthe rights to use, and defending intellectual property.
For each seed company and across the industry as a whole, there are no publiclyavailable data to settle the issue of whether the work required to introduce herbicidetolerance and Bt genes was, in effect, added on top of ongoing efforts to increase yieldsand productivity, or whether there were tradeoffs. To the extent the attention of breedersshifted, there will likely be lesser annual yield gains for the foreseeable future, at leastcompared to what they otherwise might have been.
Why? Because plant genetic enhancement is a deliberate process requiringcareful empirical study of thousands of crosses in tens of thousands experimental plotsand fields trials. The rush to market genetically engineered seeds may have compelledsome seed companies to cut corners and market varieties before breeders had adequatetime to assure all necessary traits were fully expressed, such as resistance to common
1975-1979
1980-1984
1985-1989
1990-1994
1995-1997
19971975-1997
Average Yield in Period (bushels) 44.20 39.40 42.40 45.80 45.00 45.75 43.40 Average Annual Yield Increase in Period* 1.10 (0.96) 0.60 0.68 (0.27) 0.02 0.03 Average Illinois Harvest Price in Period $6.21 $6.76 $5.97 $5.92 $6.97 $6.51 $6.37
Average Seed Expenditures per Year** $8.14 $9.55 $13.18 $13.75 $16.87 $20.12 $12.30
Average Increase in Annual Seed Expenditures $0.28 $0.73 $0.11 $0.62 $4.01 $0.38
Value of Average Annual Increase in Grower Income Attributed to Genetic Improvement (60 percent) $4.10 ($3.89) $2.15 $2.42 ($1.12) $0.07 $0.13
Grower Return to $1.00 Increase in Seed Expenditures ($13.81) $2.96 $21.19 ($1.79) $0.02 $0.35
Table 8. Grower Returns to Soybean Seed Expenditures: Illinois, 1975-1997
* Average increase in the 1975-1979 period is based on an average yield in 1972-1974 of 38.7 bushels, i.e. (44.2-38.7)/5.** Data on seed expenditures are from the U.S. Department of Agriculture, and reflect Corn Belt States.
Source: Data on Illinois soybean yields and seasonal prices are from the FBFM website, and are based on Illinois Agricultural Statistics Service data. To access the FBFM site, go to http://agec182.agecon.uiuc.edu/results.htm. Calculations by Benbrook Consulting Services. Annual data on soybean production, yield and expenditures from the costs of production data series compiled by the Economic Research Service, USDA.

31
pathogens. With breeders focusing on traits related to pest management and herbicidecompatibility, they were not able to pursue other crosses with greater potential to increaseyield.
Third, pesticide industry profit expectations and margins are different from theseed industry. In order to win and hold customers, the hybrid seed industry has tried toassure that the farmer earns, on average, $3.00 for every extra dollar spent on seed. Inorder to keep yields rising and grower returns high, the seed industry has had to operateon about 12 percent to 15 percent margins, and has invested about half of its profits backinto research and field breeding activities (Duvick, personal communication). Forexample, in 1987, Pioneer Hi-Bred spent $49.9 million on research, or 5.9 percent ofgross sales and over 50 percent of operating profits (NRC, 1989). That year, DeKalbdevoted a remarkable 86 percent of profits to research (NRC, 1989).
The pesticide industry, on the other hand, invests more heavily in research andincurs much higher regulatory compliance costs. Manufacturers often earn 30 percent to50 percent profit margins on sales of proprietary chemicals (for a general overview of theherbicide industry, see U.S. Department of Commerce, 1985). The herbicide Roundup(glyphosate) is a notable example. This one product has accounted for over halfMonsanto’s total profits in some years, and has generated income on the order of $300million plus on sales over $1 billion.
Net income from herbicides, mostly alachlor (Lasso) and glyphosate (Roundup),accounted for 59 percent to 85 percent of Monsanto’s net income in 1981-1983, butrepresented only 18 to 21 percent of total corporate sales (Department of Commerce,1985). Even after supporting R+D expenditures falling between 12 to 16 percent of sales,net returns of 10 to 15 percent of sales are common in the pesticide industry (Departmentof Commerce, 1985; current data on corporate profits from the Fortune 500 website).This data suggest operating profits on the order of 20 to 30 percent – at least double thosecommon in the seed industry during the 1970s through the mid-1990s. Clearly, ifpesticide manufacturers priced their new products the way Pioneer prices seed, theeconomics of row-crop agriculture would be more favorable to farmers.
Yet the profit expectations of the pesticide industry appear poised to dominate themarketing and pricing decisions covering the sale of seed and pesticides. If this trendcontinues, input suppliers will wind up with a greater share of the profits associated withthe production of a bushel of corn or soybeans.
Plant Breeding Research Focus
Merging the seed and pesticide industries also will change the criteria used inallocating research dollars. In most instances, companies will have the opportunity tochoose between developing new genetic or chemical solutions to emerging, or old pestproblems. In many instances, they will offer farmers both resistant varieties andpesticides. In some cases applications of proprietary chemicals will be required to triggeror otherwise take advantage of novel genetic traits introduced into GMO plants.

32
The two major goals driving industry R+D today are exploiting seed-pesticidelinkages and developing value-added output traits like higher oil or protein content. Bothtypes of technologies will make farmers more dependent on other sectors of the foodsystem, on the one hand for inputs and pest management technology, and on the other inthe marketing arena. Experience suggests that both these trends are likely to enhance theeconomic power and profitability of the input and processing sectors at the expense offarmers. This should, in turn, attract more capital and investment in these sectors – whichhistorically has been a good thing. But as stated earlier, there are new concerns.
The U.S. food system is already highly integrated and becoming more so. Theperformance of the whole system depends on the capacity of each sector to respond tochallenges and market opportunities, and to innovate. The chronically poor economicreturns to the farm production sector, wide swings in prices, profits, and debt load, thebacking off of public sector investment in science critical to farmers, and disinvestmentin farm level natural resource management all suggest that the farm production sector isemerging as the weakest link in the system. To some the logical solution is for strongerparts of the system to simply take over production responsibilities. This is, indeed whatappears to be happening in some parts of agriculture.
Farmers need the help of agricultural economists in understanding the longer-termconsequences of these trends, especially any changes that limit their access to markets orthe role of open competition within markets in setting prices. How will farmers retain ashare of the “value added” from specialty traits in cases where only one company has thetechnology to do the processing and marketing of the final product? In preparing for thispaper I searched several land grant university websites and found next to nothing on thesekey topics.
There are other reasons to worry about changes in the seed industry. Cases mayemerge where companies forego the chance to breed resistance into a variety since higherprofits can be earned by continued sale of a pesticide. While breeders have focusedsingle-mindedly on increasing yields in the past, in the future their priorities are likely tobe shaped at least to some degree by the need to create synergy between a company’spesticide and seed products portfolio.
The willingness of the seed industry to change breeding objectives may alsoemerge as a constraint to progress in agricultural innovation and productivity. Beforelong, the focus of corn breeders may need to begin a steady shift from just increasingyields through more dense plantings to also preserving net per acre income by reducingcosts more so than yields. Such a gradual evolution in breeding priorities will meangreater focus on using genetics to tighten the efficiency of key root system-soil-nutrientcycle-plant health linkages, and also has great potential in reducing environmentalproblems.
Consider the multiple consequences of a change in policy that in turn triggers theneed for a basic shift in breeding priorities. Suppose that the nation’s commitment to

33
reduce carbon emissions leads to a willingness of government to support efforts toenhance terrestrial storage of carbon. Will corn farmers be able to compete withforesters? Suppose a consensus emerges that changes in breeding objectives -- forexample, selecting for fuller, deeper root system architecture -- are needed for cornproduction to cost-effectively compete with forestry in enhancing soil carbon levels.Who will pay (and how) for bigger root systems? How will the integrated seed-pesticideindustry respond if changing root architecture is seen as incompatible with other goalsmore directly linked to industry profitability?
Biotechnology has great potential to enhance the capacity of breeders to producegenetically improved varieties. It is legitimate and important to question whether aportion of potential societal benefits may be foregone because they are judged “notcompatible” with steps seen as necessary to maximize future industry profits. This wouldbe a classic case of market failure, where actions taken by a private company, acting inthe best interest of its stockholders leave the nation less well off.
Experience also shows that the bigger and more profitable an industry becomes,and the companies within it, the more difficult time government has in changingcorporate behavior if and when conflicts arise between private profits and public needs.This does not bode well for the future role of plant genetics, for years one of the publicplus private sector’s most reliable tools for problem-solving and productivityimprovement. New efforts and priorities, and heightened investments in the privatesector is just part of the problem. The other is the retreat of the public sector from ameaningful, sustained and competitive role in the development of agriculturaltechnology.
F. U.S. Agriculture, Inc and the Structure and Profitability of the U.S. Food System
The emergence of biotechnology has both been driven by and fueled pesticide andseed industry consolidation. Across the food chain, companies are merging and industry-lines are blurring. On both the input and food processing and marketing sides, the U.S.food system is rapidly becoming more concentrated and integrated. Despite the rate ofchange in production agriculture, the scope and pace of structural change in the basicproduction sector is clearly much less than in the input and processing/marketing sectors.
Why are most industries going through such rapid structural change? Annualreports, Wall Street experts and CEOs all emphasize the need to stay competitive, financeincreasingly large R+D expenditures, and keep up with the expectations of customershere and abroad. But there are other reasons at play in the U.S. food system:
• In some industries it is cheaper to buy the competition and its proprietarytechnology than to fight it out in the marketplace -- and in patent court.

34
• The ability to increase profit margins to finance mergers, cover debt and payfor higher R+D expenditures requires a taming of competitive forces that tendto reduce profit margins.
• Mergers and vertical integration accommodate a higher order of specializationand provide greater control over pricing at all stages and levels.
• Combining seed and pesticide manufacturing within a single company offersnew options to extend patent-like profit margins beyond the expiration ofpatents, and perhaps indefinitely.
What are the implications for farmers and rural communities? A look at thestructure and performance of the basic industries that comprise the U.S. food systemprovides some inkling of further changes on the horizon.
An Overview of the U.S. Food System
Throughout this chapter, all data are either from USDA reports accessible on theInternet, especially the “Statistical Indicators” tables from the January-February 1999issue of the Economic Research Service periodical Agricultural Outlook, or from“Company Profiles” accessible on the Fortune 500 website.
The U.S. gross national product in 1997 was $8,103 billion. Food expendituresaccounted for $781 billion, or about 9.6 percent of GNP.
Consumers spent $380 billion on food consumed at home and $298 billion onfood away from home, for a total of $678 billion. Government and others spent another$103 billion on food.
The U.S. food system is composed of a set of input industries, farm operations,food processing and marketing companies, the retail sector, and restaurants and foodservice. Each sector strives to maximize its own profitability and economic security bymaximizing its share of the consumer food dollar. Some sectors also benefit byexpanding export sales, but across the whole food system, international trade is a mixedblessing – exports reduce domestic supplies, keeping production and prices higher thanthey would otherwise be, but trade also places a ceiling above prices and is driving pricesdown for many commodities from oats to apple juice.
But in general within the U.S. agricultural system, one sector’s gain is typicallyanother sector’s loss, and in recent years farm profits have been squeezed while othersectors have enjoyed steady growth and for some companies, exceptional profitability.In 1997 Farmland Industries earned profits equal to 21.9 percent of revenues and thecompany grew 18.4 percent annually between 1987 and 1997. Two major pesticidecompanies grew at 17.6 and 14.4 percent in the last decade, with returns to investorsaveraging around 30 percent.
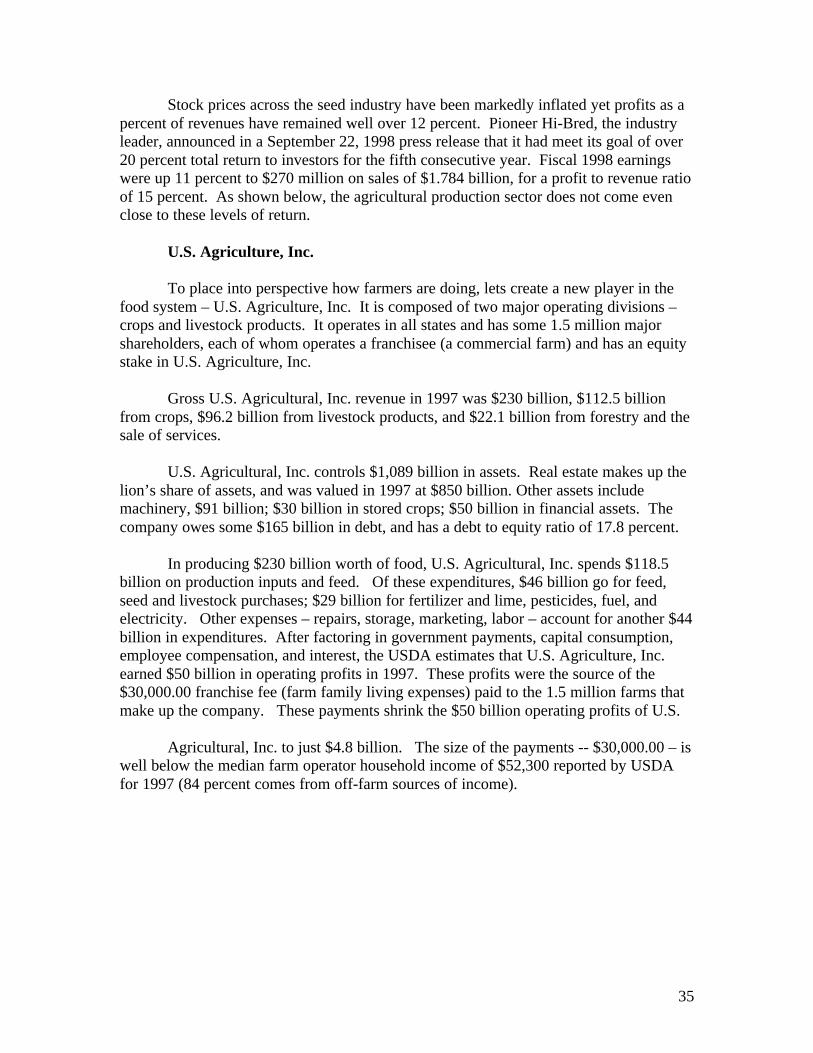
35
Stock prices across the seed industry have been markedly inflated yet profits as apercent of revenues have remained well over 12 percent. Pioneer Hi-Bred, the industryleader, announced in a September 22, 1998 press release that it had meet its goal of over20 percent total return to investors for the fifth consecutive year. Fiscal 1998 earningswere up 11 percent to $270 million on sales of $1.784 billion, for a profit to revenue ratioof 15 percent. As shown below, the agricultural production sector does not come evenclose to these levels of return.
U.S. Agriculture, Inc.
To place into perspective how farmers are doing, lets create a new player in thefood system – U.S. Agriculture, Inc. It is composed of two major operating divisions –crops and livestock products. It operates in all states and has some 1.5 million majorshareholders, each of whom operates a franchisee (a commercial farm) and has an equitystake in U.S. Agriculture, Inc.
Gross U.S. Agricultural, Inc. revenue in 1997 was $230 billion, $112.5 billionfrom crops, $96.2 billion from livestock products, and $22.1 billion from forestry and thesale of services.
U.S. Agricultural, Inc. controls $1,089 billion in assets. Real estate makes up thelion’s share of assets, and was valued in 1997 at $850 billion. Other assets includemachinery, $91 billion; $30 billion in stored crops; $50 billion in financial assets. Thecompany owes some $165 billion in debt, and has a debt to equity ratio of 17.8 percent.
In producing $230 billion worth of food, U.S. Agricultural, Inc. spends $118.5billion on production inputs and feed. Of these expenditures, $46 billion go for feed,seed and livestock purchases; $29 billion for fertilizer and lime, pesticides, fuel, andelectricity. Other expenses – repairs, storage, marketing, labor – account for another $44billion in expenditures. After factoring in government payments, capital consumption,employee compensation, and interest, the USDA estimates that U.S. Agriculture, Inc.earned $50 billion in operating profits in 1997. These profits were the source of the$30,000.00 franchise fee (farm family living expenses) paid to the 1.5 million farms thatmake up the company. These payments shrink the $50 billion operating profits of U.S.
Agricultural, Inc. to just $4.8 billion. The size of the payments -- $30,000.00 – iswell below the median farm operator household income of $52,300 reported by USDAfor 1997 (84 percent comes from off-farm sources of income).

36
An overview of U.S. Agricultural, Inc.’s performance is presented in Table 9.Table 10 presents a sector-by-sector overview of basic financial data on food system-related companies listed among the Fortune 500 and the Global Fortune 500. U.S.Agricultural, Inc. is included in this table as the production sector.
The data on assets, market value, revenues and profits are rough since the Fortune500 clearly does not include all companies in each sector. I estimated sector-wide assets,revenue and profits by calculating averages from the companies for which performance
1997Gross Sales ($Billion)
Crops 112.5Livestock 96.2Other 22.1
Total Income 230.8$
Plus Net Government Transactions 0.1
Expenditures
Percent of Total
ExpendituresSeeds 6.7 5.7%Pesticides 8.8 7.4%Fertilizer 10.9 9.2%Feed 25.2 21.3%Livestock 13.8 11.6%Fuel and Oil 6.2 5.2%Electricity 3 2.5%
Other intermediate expenses 43.9 37.0%
Total Production Expenses 118.5$ 100.0%
Gross Value Added 112.3$ Minus Capital Consumption 19.5
Net Value Added 92.8
Minus -- Rent to nonoperators 13.2Debt Service 13.7
Labor 16Net Income 49.8$
Minus Franchise Fee (Family Living Expenses -- 1.5 million commercial farms, $30k per) 45
Net Return to Shareholders 4.8$
Table 9. U.S. Agriculture, Inc. Income and Expenditures, 1997

37
data was available. The estimates correspond reasonably well with USDA data on thesize of various sectors, and on financial performance data reported in the business andfinancial press. I hope to be able to carry this analysis forward in the next few years, andchallenge some of the students in the agricultural economics department to considerdoing a thesis on the size, performance, and profit of Illinois Agriculture, Inc. in light ofthe structural changes occurring in the input and food processing industries.
Table 10 leads to a number of conclusions about the relative economic strength ofU.S. Agriculture, Inc. relative to other food system sectors –
• The production sector’s profits to assets ratio is about one-tenth that of theseed and pesticide industries, and less than one-twentieth of the other moreprofitable sectors.
• Profit as a percent of revenue is much lower than the two sectors dealingdirectly with production agriculture.
• The assets of the food processing industry are enormous -- about one-third ofthe production sector -- but the economic return to processing sector assetsand revenues is much higher than U.S. Agriculture, Inc.'s.
Implications
The lack of profitability in the production sector is and could continueundermining the ability of farmers to invest in changes in farming systems, soil and water
Sector AssetsMarket Value
Revenue Profits Assets Market Value
Revenues
($Billion) ($Billion) ($Billion) ($Billion)
Seeds 22 33 6.7 0.804 3.7% 2.4% 12.0%
Pesticides and Drugs 36 71 24.1 1.43 3.9% 2.0% 5.9%
U.S. Agriculture, Inc. 1,088 1,632 230.8 4.8 0.4% 0.3% 2.1%
Food Processing 329.5 638.9 429.9 30.1 9.1% 4.7% 7.0%
Retail 140 239.6 319.9 14.8 10.6% 6.2% 4.6%
Food Service, Restaurants 62.3 123.6 297 10 16.1% 8.1% 3.4%
Profits as a Percent of --
Table 10. Rough Estimates of the Size and Performance of the Basic Sectors in the U.S. Food System, Late 1990's

38
resource enhancement, buildings and machinery, and will continue to fuel trends towardspecialization and growth in average farm size. These trends further increase growerdependence on other sectors and may set the stage for ecological and biologicalproduction setbacks on a scale never experienced before.
Growth, debt service, merger activity and return to investors in the seed pluspesticide and the food processing industries will require annual revenue increases on theorder of 5 to 15 percent per year. A significant portion of these additional revenues willhave to come from capturing a larger share of the “value added” in the production sector.
The relative economic size and performance of the sectors within the U.S. foodsystem affect the comparative ability of each sector to influence media coverage, publicattitudes and public policy. It also influences relative access and control overinformation, expertise, markets and capital, as well as ability to shape and makeinvestments in new technology, information and services. For these and other reasons,the slipping influence of the production sector is likely to continue relative to other, moreprofitable sectors.
G. Some Conclusions and Future Challenges
In a perfect world public sector science should focus on diagnosing problems andcreating the knowledge base needed to solve problems with minimal drain on scarce“system” resources – especially the time and management focus of farmers, soil andwater quality, expenditures on inputs, and the attention of plant breeders.
As the private sector has exerted more and more dominance in advancing newtechnologies, the public sector has had to invest a growing share of its resources inevaluating and responding to the challenges posed by integrating private sectortechnologies into ongoing farming systems.
Exclusive reliance on any single pest management technology tends to triggershifts in pest species composition or the evolution of resistance through one or moremechanisms. In general, the greater the selection pressure across time and space, thequicker and more profound the evolutionary response.
Pest management systems should spread the control burden across at least twoand preferably three distinct control tactics. Any technology that lessens the ability offarmers to diversify pest management is likely to trigger adaptive responses that raisecosts and yield instability.
Unique Role of Crop Genetics and Breeding
The selection and breeding of improved varieties has and will continue tocontribute to technological innovation by relaxing one or more yield constraints, bymaking it possible to grow more plants per acre, and by enhancing desirable features ortraits of harvested commodities.

39
Genetic capital is limited – both the time and effort of breeders and thegermplasm they draw upon in plant improvement. Like any scarce resource, the effortsof breeders should be strategically allocated where it, and only it, can raise yields andprofit potential most significantly.
To maximize gains in agricultural productivity, breeders and plant geneticistsneed to focus their efforts on overcoming those problems and constraints that can not becost-effectively overcome though other means.
Roots of Technological Change
Positive technological change tends to occur reliably when farmers are able to –
• Solve problems, raise attainable yield levels, improve environmental quality,and/or lower costs by changing the mix of farming activities – enterprise type,rotations, conservation systems.
• Reduce over time the frequency and severity of pest problems and/or increasethe cost-effectiveness of control measures utilized.
• Manage evolutionary processes to enhance productivity, rather than beingreactive when adaptive forces shift problems, undermine once effectivepractices, or pose new constraints on yields.
• Increase realistically attainable yields by improving soil quality or adoption ofimproved genetics.
Technological innovation can often be achieved most cost-effectively throughmanagement changes that alter biological processes and interactions. As a source ofinnovation, American agriculture is under-utilizing farm system design change. Indeed,in some regions, farm system changes have become a negative force, undermining yieldsand natural resource productivity because of over-reliance on chemical solutions tobiological problems stemming from management choices.
Innovation can come from incorporation of new genetics and inputs that allowfarmers to more effectively manage biological processes and ecological interactions. Butinputs and genetics must be utilized in ways that limit the capacity of soil organisms andpests to adapt to whatever new selection pressures arise within a farming system.
The most valuable technological innovations make it possible to alter farmingsystems in ways that eliminate or relax, at least in most years and circumstances,otherwise common yield constraints or threats to production.
Technological change that solves one problem but in the process creates another,or causes long-run costs to rise, is not innovation. The impacts of technologies are often

40
determined by the broader systems within which they are used. Technologies thatpromise to short-circuit the need to carefully manage systems often contain the seeds oftheir own demise.
Over time the tools of biotechnology will unlock the incredible complexity of thelinkages between genes, organisms, plant growth, and the environment. The impacts ofbiotechnology will be determined by how it is used to exploit this knowledge.
Diversity in rotations, tillage and planting systems, soil fertility and qualityenhancement efforts, pest management systems, and income generating activities isinherently good for a host of reasons. It is disadvantageous for a few reasons that can beovercome by community-level innovations in the sharing of machinery, labor, andtransportation/processing infrastructure.
Technologies that expand grower-choice will, in general, help farmers capture abigger share of per acre gross income. Technologies that narrow choice will help otherscapture and hold a larger share of gross income from farming activities. Hence theimpact of new technology on the diversity of farm operations should be a key evaluationcriterion.
Farmers wishing to contain costs and preserve degrees of freedom should follow ahierarchy of interventions beginning with management system changes, progressingthrough the purchase and use of inputs, and finally to changes in crop and/or animalgenetics, if available. When these responses fail to solve problems, farmers either haveto accept slippage in system performance and financial returns or make morefundamental changes in farming system design and enterprise mix.
The agricultural research community should assume responsibility for perfectingand applying a set of “Leading Indicators” of the health of Illinois agriculture. It shouldapply the indicators retrospectively and identify threshold values for indicators beyondwhich farming system stability and sustainability might be jeopardized.
When the value of a given indicator is moving in the wrong direction, especiallywhen it approaches a critical threshold value, the research community should engagefarmers, policy-makers, scientists and the private sector in understanding why andidentifying ways to reverse slippage.
Impacts of Biotechnology on the Farm Sector and Society
Technology fees and contracts will remain a key part of the process for farmerswishing to plant genetically modified seed.
Companies developing herbicide tolerant plants will try to shift as much per acrecost as possible from the herbicide onto the seed via seed costs and/or technologycharges. With increasing frequency, price reductions for herbicides will be limited togrowers purchasing technology packages.

41
The scope of the technology contracts will likely expand. Whenever possible,they will continue to require farmers to buy the company’s brand of inputs and willforbid farmers from keeping or selling the seed. Contracts in the future may well specifyother agronomic and pest management requirements.
Contracts governing the planting of “value added” varieties are likely to addressadditional issues, especially in cases where one or a few companies have the technologyto process the crop and take advantage of the value-added trait. Such contracts may settarget harvest dates and delivery schedules, impose new quality specifications, possiblylinked to price, and stipulate other conditions governing the sale and handling of theharvested crop. These provisions could change the distribution of production andmarketing risks, and might limit technological choice on the farm.
The integration of the seed and chemical industries appears destined to accelerateincreases in per acre expenditures for seeds plus chemicals, delivering significantly loweraverage returns to growers.
A new set of criteria may come to govern the identification of priorities withinseed plus pesticide companies. In cases where a company projects a higher profit marginfor a chemical versus genetic solution, or vice versa, the range of options offered tofarmers may narrow, at least from that company. This could have long-run consequencesfor costs, innovation and sustainability, depending on how other companies are able andwilling to respond.
Public willingness to invest in the agricultural sciences, education and technologydevelopment is a function of what the public believes it is getting from its investments.Recent trends in biotechnology and changes in the structure and financial performance ofagricultural input and processing industries may transform attitudes among bothconsumers and farmers regarding whom is benefiting from publicly funded science andeducation activities. Such a shift in attitudes will trigger the need for new partnerships toprovide leadership and political support for public research and extension programs.
Bibliography
Cassman, K.G., and D. Duvick, 1999. “Post-Green Revolution Trends in Yield Potentialof Temperate Maize,” Preliminary draft for paper presented at the Agronomy Society ofAmerica Annual Meeting, Baltimore, Maryland. (Full manuscript in press).
Department of Crop Sciences, University of Illinois, 1998. “Insect Information: WesternCorn Rootworm,” is accessible athttp://www.aces.uiuc.edu/~ipm/field/corn/insect/wcr.html along with extensiveinformation on the other corn insects, population levels, and pest management tools.

42
Drinkwater, L.E., Wagoner, P, and M. Sarrantino, 1998. “Legume-based croppingsystems have reduced carbon and nitrogen losses,” Nature, Vol. 396: 262-265.
Duvick, Donald, 1998. “Crop Varieties and Biodiversity,” Background document forCAST Issue Paper, “Benefits of Biodiversity to Agriculture.”
Duvick, Donald, 1997. “What is Yield?,” in G.O. Edmeades, B. Banziger, H.R.Mickelson and C.B. Pena-Valdivia Eds., Developing Drought and Low N-Tolerant Maize,Proceedings of a Symposium, March 25-29, 1996, El Batan, Mexico, CIMMYT, Mexico,D.F.
Gould, F., Anderson, A., Summerford, D., Heckel, D., Lopez, J., Micinski, S., Leonard,R. and M. Laster, 1997. “Initial frequency of alleles for resistance to Bacillusthuringiensis toxins in field populations of Heliothis virescens,” Proceedings of theNational Academy of Sciences, 94: 3519-3523.
Gray, M., Levine, E., O’Neal, M., Spencer, J., Isard, S., and K. Steffey, 1998. “Croprotation and western corn rootworm, Diabrotica virgifera virgifera LeConte, managament:have we lost a pest management tool in the eastern corn belt?”, in Proceedings, SixthAustralasian Applied Entomological Research Conference.
Forlani, G., Mantelli, M., Branzoni, M., Nielsen, E., and F. Favilli, 1995. “DifferentialSensitivity of Plant-Associated Bacteria to Sulfonylurea and Imidazolinone Herbicides,”Plant and Soil, Volume 176: 243-253. The Netherlands.
National Research Council, Board on Agriculture, 1989. Investing in Research: AProposal to Strengthen the Agricultural, Food, and Agricultural System, NationalAcademy Press, Washington D.C.
Tabashnik, B., Liu, Y.B., Finson, N., Masson, L. and D.G. Heckel, 1997a. “One gene indiamondback moth confers resistance to four Bacillus thuringiensis toxins,”Proceedings of the National Academy of Sciences, 94: 1640-1644.
------------------------------, Malvar, T., Heckel, D.G., Masson, L., Ballester, V., Granero,F., Mensura, J.L. and J. Ferre, 1997b. “Global variation in the genetic and biochemicalbasis of diamondback moth resistance to Bacillus thuringiensis," Proceedings of theNational Academy of Sciences, 94: 12780-12785.
Tang, J.D., Gilboa, S., Roush, R.T. and A.M. Shelton. 1997. Inheritance, stability, andfitness of resistance to Bacillus thuringiensis in diamondback moth (Lepidoptera:Plutellidae). Journal of Economic Entomology, 90: 732-741.
Tilman, D., 1998. “The greening of the green revolution,” Nature, Vol. 396: 211-212.

43
U.S. Department of Commerce, Office of Chemicals and Allied Products, InternationalTrade Administration, 1985. A Competitive Assessment of the U.S. Herbicide Industry,U.S. Government Printing Office, Washington, D.C.