World Energy Scenarios l 2016 · scenario called Hard Rock, ... New Delhi, Paris and Washington DC....
138
IN COLLABORATION WITH ACCENTURE STRATEGY AND PAUL SCHERRER INSTITUTE THE GRAND TRANSITION World Energy Scenarios 2016 l
-
Upload
nguyenkhanh -
Category
Documents
-
view
214 -
download
1
Transcript of World Energy Scenarios l 2016 · scenario called Hard Rock, ... New Delhi, Paris and Washington DC....

IN COLLABORATION WITH ACCENTURE STRATEGY AND PAUL SCHERRER INSTITUTE
THE GRAND TRANSITION
World Energy Scenarios 2016l
2
ABOUT THE WORLD ENERGY COUNCILThe World Energy Council is the principal impartial network of energy leaders and practitioners promoting an affordable, stable and environmentally sensitive energy system for the greatest benefit of all.
Formed in 1923, the Council is the UN-accredited global energy body, representing the entire energy spectrum, with over 3,000 member organisations in over 90 countries, drawn from governments, private and state corporations, academia, NGOs and energy stakeholders. We inform global, regional and national energy strategies by hosting high-level events including the World Energy Congress and publishing authoritative studies, and work through our extensive member network to facilitate the world’s energy policy dialogue.
Further details at www.worldenergy.org and @WECouncil
ABOUT WORLD ENERGY SCENARIOS THE GRAND TRANSITIONScenarios are plausible and challenging alternative futures. In producing the World Energy Scenarios the World Energy Council collaborated with Accenture Strategy and the Paul Scherrer Institute to explore likely futures for the Grand Transition—a world of lower population growth, radical new technologies, greater environmental challenges, and a shift in economic and geopolitical power—looking to 2060.
This report presents three exploratory scenarios—Modern Jazz, Unfinished Symphony, and Hard Rock—that provide users with a common language for thinking and talking about current events. These scenarios provide energy leaders with an open, transparent, and inclusive framework to think about a very uncertain future, and thus assist in the shaping of the choices they make.
Over a period of three years, the scenarios were built by a network of more than 70 members, from over 25 countries, and quantified with a global multi-regional energy system model. Feedback was also gathered at the Council’s Energy Leaders’ Dialogues and at 14 workshops around the world, ensuring the inclusion of key insights from leaders of the industry, politics, economics, environment, technology, and science.

3
PREFACE
The World Energy Council has produced a set of plausible explorative scenarios which build on previous Jazz and Symphony scenarios and set out three potential pathways for the energy sector. All three scenarios highlight potential shortfalls in terms of the balance of the Energy Trilemma, which calls for a simultaneous pursuit of secure, affordable and environmentally sound energy policies. However, one scenario in particular presents difficult conclusions for many. “Hard Rock” illustrates a path defined by a fragmented world with low global cooperation. Only positive leadership stemming against this “lowest common denominator” approach will produce outcomes with regards to climate change, energy access and global growth supported by robust energy security that can deliver on the UN defined Sustainable Development Goals (SDGs).
Our latest scenarios illustrate that a successful Grand Transition for the energy sector will require unprecedented global political and economic collaboration. Leaders and society need to embrace new realities and strive for continued innovation while maintaining stable investment frameworks. There will be intense pressure on the three dimensions of the Energy Trilemma as individual countries aim to improve energy security, expand energy equity and reduce carbon emissions. If we are unable to address these challenges, the Grand Transition could result in low growth, an inward looking future and with a stagnating energy sector.
In a time of unprecedented uncertainty, at the beginning of a Grand Transition that requires profound rethinking the Council views its scenarios as an important contribution for our dialogue among global energy leaders, innovators, investors, policy makers and society at large. The challenge ahead is immense: we need enabling policies and trade frameworks to deliver integrated, effective and efficient infrastructures, innovative urban planning solutions and adequate resilience responses. In order to succeed, leaders and society have to rethink the energy contract, find new ways to avoid deadlocks and allow for timely decisions.
We look forward to dialoguing with you on the basis of Modern Jazz, Unfinished Symphony, and Hard Rock to ensure we achieve the best possible understanding of the new realities and use it to develop the most adequate tools to manage these and deliver sustainable energy for all.
Marie-José Nadeau Chair, World Energy Council
Christoph Frei Secretary General, World Energy Council

4
FOREWORD
This is a difficult time for the energy industry. Many of the new signals emerging—disruptive digitalisation, the commitment to decarbonisation and desire, in some countries, for a more national focus—indicate that new frameworks for thinking are needed. We cannot banish uncertainty but we can offer to stimulate thinking of what might be certain and uncertain, and where the new opportunities and risk exposures might be.
The three scenarios developed are Modern Jazz, which represents a ‘digitally disrupted,’ innovative, and market-driven world. Unfinished Symphony, a world in which more ‘intelligent’ and sustainable economic growth models emerge as the world drives to a low carbon future, and a more fragmented scenario called Hard Rock, which explores the consequences of weaker and unsustainable economic growth with inward-looking policies.
These three scenarios are a set of plausible and challenging energy futures with a time horizon to 2060. They are designed to illuminate how enterprise strategies and government policies, initiated in the period to 2030, will play out over the longer period.
The 2016 World Energy Scenarios are the product of a three year process. Developed by World Energy Council members from across the globe, and produced with our collaborators Accenture Strategy and the Paul Scherrer Institute.
The process began with expert interviews with energy leaders, several workshops focused on framing the energy problematique and then building the scenario narratives and quantification. The central tool used for quantification was the Paul Scherrer Institute’s global multi-regional energy system model. The iteration between development of the narratives and the quantification provided the foundation for a powerful set of scenarios.
The scenarios were not framed or built by a central team rather they were the outcome of a series of workshops around the world. These took place in Beijing, Buenos Aires, Cartagena, Johannesburg, London, Manila, New Delhi, Paris and Washington DC. Those present who shaped the scenarios were members of the World Energy Council, many active in the Scenarios Study Group. And a wide range of experts, for example Arup on urban innovation, who provided advice and insights across a wide range of pertinent topics shaping the future of energy, from technology and economics, to societal, environmental and geopolitics. This was complemented by strong country and regional contributions. I would like to thank all those around the world who contributed to the success of the workshops. I do not have the space to identify all by name, but I would like to mention a few: Bosse Anderson, Jorge Bacher, Sudhanshu Bansal, Jean-Paul Bouttes, Francois Dassa, Fabien Derreal, Mauricio Garrón, Antonio Augusto Gonçalves, Mikhel Harm, Yanbing Kang, Jose Antonio Vargas Lleras, James Marshall, Jean-Eudes Moncomble, Filipe Mota da Silva, Volkmar Pflug, Amanda Quintero, Hans-Wilhelm Schiffer, Ashutosh Shastri, Oskar Sigvaldason, Brian Statham, Renata Szczerbacki, Jean-Michel Trochet, Rob Whitney, Barry Worthington and Yufeng Yang.

5
The ability to incorporate the wide range of perspectives from multiple sources was only possible with effort from a talented core team. I would like to thank all members of the World Energy Scenarios team who have contributed to this project. This includes from Accenture Strategy, Melany Vargas, who co-authored the report, Arthur Hanna, Richard Kho and Serge Younes who provided trenchant commentary; from the Paul Scherrer Institute, Tom Kober, who led the modelling, and from the World Energy Council’s secretariat Karl Rose, who co-facilitated the workshops and provided unique insights, Seijin Kim and Christoph Menzel, who provided invaluable support, and Zulandi van der Westhuizen who contributed to the start-up of the project.
The launch of the World Energy Scenarios report in Istanbul is not the end, but rather the start of a process of contributing to the development of global and regional energy agendas and working with teams regionally to envisage the meaning of this work locally. Additionally, this work can be used to challenge enterprises to rethink their business models, the robustness of existing strategies and policies, or offer a starting point to develop new ones.
We hope you find these scenarios to be stimulating!
We each have learned something from this process, what struck me was:
• The markedly different views across the world as to what constitutes ‘Business as Usual” and where we might be going to—there is no consensus!
• How difficult it is to fully envisage the power of new technologies, impact of digitalisation, and their social consequences, and
• Meeting the 2°C limit requires not only high carbon prices, an enduring commitment across countries, but a scale of energy transformation, in such a short time, that seems to be without precedent. Can we do it?
Finally, I take full responsibility for any omissions or inaccuracies in the report.
Ged Davis Executive Chair, World Energy Scenarios

6
Preface 3
Foreword 4
EXECUTIVE SUMMARY 8
Key findings 8
Implications for the energy sector 9
Recommendations 12
THE ‘GRAND TRANSITION’ 13
The Role of the World Energy Scenarios 14
Factors that Shaped World Energy: 1970-2015 15
Factors that will Shape World Energy: 2015-2060 19
What scenarios best explore the ‘Grand Transition’? 29
THE WORLD TO 2060 32
Introduction 33
Modern Jazz 34
Unfinished Symphony 53
Hard Rock 73

7
COMPARATIVE SUMMARY 90
Introduction 91
Efficiency 91
Mix of Resources 94
Carbon emissions 96
Adaptation and Resilience 99
Energy Trilemma 102
Energy, Water and Food 107
APPENDIX 109
List of Tables and Figures 110
Glossary 113
References 115
Data Tables 117
Methodology 131
Acknowledgements 134
Officers of the World Energy Council 136
Patrons of the World Energy Council 136

8
WORLD ENERGY COUNCIL | SCENARIOS
EXECUTIVE SUMMARY Disruptive trends are emerging that will create a fundamentally new world for the energy industry.
KEY FINDINGS
Since 1970, the world has seen rapid growth in energy demand, mainly satisfied by fossil fuels. The future will be different. Disruptive trends are emerging that will create a fundamentally new world for the energy industry, characterised by lower population growth, radical new technologies, greater environmental challenges, and a shift in economic and geopolitical power. These underlying drivers will re-shape the economics of energy. We call this uncertain journey into the new world of energy – The Grand Transition.
Over the past three years, the World Energy Council has explored the likely futures and outcomes for the Grand Transition. Our findings indicate:
THE WORLD’S PRIMARY ENERGY DEMAND GROWTH will slow and per capita energy demand will peak before 2030 due to unprecedented efficiencies created by new technologies and more stringent energy policies.
DEMAND FOR ELECTRICITY will double to 2060. Meeting this demand with cleaner energy sources will require substantial infrastructure investments and systems integration to deliver benefits to all consumers.
THE PHENOMENAL RISE OF SOLAR AND WIND ENERGY will continue at an unprecedented rate and create both new opportunities and challenges for energy systems.
DEMAND PEAKS FOR COAL AND OIL have the potential to take the world from “Stranded Assets” to “Stranded Resources”.
TRANSITIONING GLOBAL TRANSPORT forms one of the hardest obstacles to overcome in an effort to decarbonise future energy systems.
LIMITING GLOBAL WARMING to no more than a 2°C increase will require an exceptional and enduring effort, far beyond already pledged commitments, and with very high carbon prices.
GLOBAL COOPERATION, SUSTAINABLE ECONOMIC GROWTH, AND TECHNOLOGY INNOVATION are needed to balance the Energy Trilemma.
The Grand Transition is built on three new exploratory and metaphorically named scenarios looking to 2060: Modern Jazz, Unfinished Symphony, and Hard Rock.These scenarios provide energy leaders with an open, transparent, and inclusive framework to think about a very uncertain future.
Building on the World Energy Council’s previous scenarios, Modern Jazz represents a ‘digitally disrupted’, innovative, and market-driven world. Unfinished Symphony is a world in which more ‘intelligent’ and sustainable economic growth models emerge as the world drives to a low carbon future. The Council has also introduced an emerging and more fragmented scenario called Hard Rock, which explores the consequences of weaker and unsustainable economic growth with inward-looking policies. All three scenarios have then been quantified using a global, multi-regional energy system model to verify and visualise the findings.
1
234567

THE GRAND TRANSITION
9
Many lessons can be learned from the Modern Jazz, Unfinished Symphony, and Hard Rock scenarios. Each of these scenarios contributes to the debate on how environmental goals, energy security, and energy equity can best be achieved, taking into account a broad range of industry and policy structures.
IMPLICATIONS FOR THE ENERGY SECTOR
THE WORLD’S PRIMARY ENERGY DEMAND GROWTH will slow and per capita energy demand will peak before 2030 due to unprecedented efficiencies created by new technologies and more stringent energy policies.
Since 1970, demand for energy has more than doubled. New technologies to 2060 will keep energy demand growth moderate relative to historical trends, and will help to enable industrialised economies to transition more quickly into service and sustainability-led growth. Efficiency gains will be made through the deployment of more efficient energy resources, combined with the effect of digital technologies that will help to enable smart grids, smart buildings, smart homes and offices, and smart cities. Advanced manufacturing, automation, telecommuting, and other technologies also will disrupt traditional energy systems.
As a result, final energy consumption to 2060 grows 22% in Unfinished Symphony, 38% in Modern Jazz, and 46% in Hard Rock. Primary energy demand to 2060 grows just 10% in Unfinished Symphony, 25% in Modern Jazz, and 34% in Hard Rock. Per capita primary energy demand peaks before 2030 with a maximum annual per capita usage of energy reaching 1.9 TOE.
Energy intensity will decline three times faster in Modern Jazz and Unfinished Symphony. Substantial efficiencies will be gained through the deployment of solar and wind electricity generation capacity. Conversion rates for these renewable energy sources are much higher than those for fossil fuel plants, meaning less energy will be needed from the primary source.
DEMAND FOR ELECTRICITY will double to 2060. Meeting this demand with cleaner energy sources will require substantial infrastructure investments and systems integration to deliver benefits to all consumers.
Technology-enabled urban lifestyles demand more electricity. The growth of the middle class, rising incomes, and more electricity-enabled appliances and machines contribute to electricity demand doubling to 2060. Electricity reaches 29% of final energy consumption in Unfinished Symphony, 28% in Modern Jazz, and 25% in Hard Rock. Electricity generation investment to 2060, in these scenarios, ranges from US$ 35-43trillion (based on 2010 market exchange rate).
New cleaner generation is needed to meet climate targets and utility business models are pushed to the limits by stringent policies and shifting consumer demands. The industry must find a way to navigate shifting dynamics. More stringent regulatory requirements for a low-carbon future will force companies everywhere to make significant changes in their business models or face collapse. This change is particularly pronounced for utilities who must respond quickly to changing demand patterns.
Modern Jazz sees the emergence of three models to manage renewable energy penetration and distributed systems: Utility-scale Low Carbon Energy Producers, Distribution Platform Optimizers, and Energy Solution Integrators. Unfinished Symphony sees highly integrated models and funding mechanisms to allocate the system costs of renewables to avoid zero-marginal cost destruction. Hard Rock sees an assortment of models that work well in a unique local context.
1
2

10
WORLD ENERGY COUNCIL | SCENARIOS
THE PHENOMENAL RISE OF SOLAR AND WIND ENERGY will continue at an unprecedented rate and create both new opportunities and challenges for energy systems.
Growth in non-fossil energy sources will dominate electricity generation to 2060, driven by solar and wind capabilities. The steep reductions in the technology learning curve seen in the last decade continue through to 2060 across the three scenarios and are most strongly observed in Modern Jazz and Unfinished Symphony where cost reductions are greater than 70% for the period.
Solar and wind energy account for only 4% of power generation in 2014, but by 2060 it will account for 20% to 39% of power generation. In Unfinished Symphony, strong policy supported by hydro and nuclear capacity additions will allow intermittent renewables to reach 39% of electricity generation by 2060. Large-scale pumped hydro and compressed air storage, battery innovation, and grid integration provide dependable capacity to balance intermittency. Modern Jazz sees intermittent renewables reach 30% of generation enabled by distributed systems, digital technologies, and battery innovation. For both resources (solar and wind), the largest additions will be seen in China, India, Europe, and North America. With less capacity for infrastructure build-out, Hard Rock sees the lowest penetration, with solar and wind generation reaching 20% by 2060.
Other non-fossil fuels, such as hydro and nuclear, will continue to grow. Regionally, there will be greater differences, for example, with hydro being particularly important in Africa and nuclear in East Asia (especially China), and both remaining significant to regional power companies.
DEMAND PEAKS FOR COAL AND OIL have the potential to take the world from “Stranded Assets” to “Stranded Resources”.
Fossil fuel share of primary energy has shifted just 5% in the last 45 years from 86% in 1970 to 81% in 2014. To 2060, the momentum of new technologies and renewable energy generation results in the diversification of primary energy. Fossil fuel share of primary energy will fall to 70% by 2060 in Hard Rock, 63% in Modern Jazz, and 50% in Unfinished Symphony.
Coal peaks before 2020 in Modern Jazz and Unfinished Symphony. Unfinished Symphony achieves the most drastic changes with 2060 supplies falling to 724 MTOE. An emphasis on energy security means Hard Rock sees a higher reliance on coal, and peaking in 2040 at 4,044 MTOE. The biggest driver of variance is the degree to which China and India utilise coal to 2060.
Oil peaks in 2030 in Modern Jazz at 103 mb/d and at 94 mb/d in Unfinished Symphony. Despite growing demand for transport fuels, new technologies and competition from alternatives drive diversification and lead demand to slow beyond 2030. Hard Rock sees status quo transport systems dominate. As a result, oil sees a peak and plateau of about 104 mb/d between 2040 and 2050. Unconventional oil reaches 15-16mb/d in Modern Jazz and Hard Rock. MENA remains the dominant oil producer to 2060 in all three scenarios.
The rate of natural gas growth varies broadly across the three scenarios. Modern Jazz sees the rise of LNG and the largest role for natural gas. Technology developments continue in unconventional gas led by North America and later Argentina, China, and Australia. Hard Rock also sees growth driven by unconventionals, but lower gas trade and reduced technology transfer make resources more expensive. Stringent emissions mandates in Unfinished Symphony mean gas grows more slowly.
Demand peaks for coal and oil have the potential to take the world from stranded assets predominantly in the private sector to state-owned stranded resources and could cause significant stress to the current global economic equilibrium with unforeseen consequences on geopolitical agendas. Carefully weighed exit strategies spanning several decades need to come to the top of the political agenda, or
3
4

THE GRAND TRANSITION
11
the destruction of vast amounts of public and private shareholder value is unavoidable. Economic diversification and employment strategies for growing populations will be a critical element of navigating the challenges of peak demand.
TRANSITIONING GLOBAL TRANSPORT forms one of the hardest obstacles to overcome in an effort to decarbonise future energy systems.
The diversification of transport fuels drives disruptive change that helps to enable substantial reductions in the energy and carbon intensity of transport. Oil share of transport falls from 92% in 2014 to 60% in Unfinished Symphony, 67% in Modern Jazz, and 78% in Hard Rock. Advances in second and later third generation biofuels make substantial headway in all three scenarios, ranging from 10% of total transport fuel in 2060 in Hard Rock, 16% in Modern Jazz, and 21% in Unfinished Symphony.
Disruption is also created by electricity in personal transport systems. A growing global middle class drives the light-duty vehicle fleet to grow 2.5 to 2.7 times to 2060. Modern Jazz and Unfinished Symphony see rapid penetration of electric and hybrid plug-in vehicles globally which reflect 26% to 32% of the light duty vehicle fleet in 2060. Hybrid petroleum vehicles reflect another 24% to 31% share of the fleet.
Progress is made through differing mechanisms. In Modern Jazz, consumer preferences and growing availability of vehicle charging infrastructure through distributed energy systems drive penetration of alternative transport solutions. Conversely, in Unfinished Symphony, government support schemes and integrated city planning result in fewer overall vehicles and penetration of alternative transport solutions, especially in urban areas. Hard Rock sees less infrastructure build-out and therefore less penetration of alternative fuels.
LIMITING GLOBAL WARMING to no more than a 2°C increase will require an exceptional and enduring effort, far beyond already pledged commitments, and with very high carbon prices.
Substantial reduction in carbon intensity drives carbon emissions to peak between 2020 and 2040 across the three scenarios. Still, to reach global climate targets, the world needs an exceptional and enduring effort on top of already pledged commitments, and coordinated global action at unprecedented levels, with meaningful carbon prices. These characteristics are most apparent in Unfinished Symphony where the world comes closest to meeting climate targets. Joint strategic planning efforts, unseen over the last decades, drive global carbon emissions in 2060 to fall 61% below 2014 value.
In Modern Jazz, the deployment of new technologies creates efficiencies and enables continued reductions in the learning curves of solar and wind. Global carbon emissions fall by 28% from 2014 to 2060. A fragmented global economic and political system means Hard Rock sees an overall emissions increase of 5% to 2060, despite lower upward pressure from economic growth. Without global commitment, reductions in carbon and energy intensity for Hard Rock are less than half of what is seen in the other two scenarios.
In all three scenarios, the carbon budget is likely to be broken in the next 30 to 40 years. Modern Jazz and Hard Rock exceed the 1,000 GtCO₂ carbon budget in the early 2040s and Unfinished Symphony exceeds the budget before 2060.
GLOBAL COOPERATION, SUSTAINABLE ECONOMIC GROWTH, AND TECHNOLOGY INNOVATION are needed to balance the Energy Trilemma.
Each scenario emphasises one of the three dimensions of what World Energy Council calls the Energy Trilemma. This definition applies to the energy sustainability of three core dimensions: Energy Security, Energy Equity, and Environmental Sustainability. Modern Jazz and Unfinished Symphony both provide
5
6
7

12
WORLD ENERGY COUNCIL | SCENARIOS
models for sustainable economic growth and technology innovation. Modern Jazz achieves the highest energy equity. Unfinished Symphony demonstrates the importance of global cooperation in achieving environmental sustainability. Hard Rock demonstrates how, when economic growth comes under pressure and social tensions increase, governments tend to lower consideration of global impacts and focus on domestic energy security.
RECOMMENDATIONS
The world is on the cusp of change. The energy industry is facing decades of transformation. The challenge to the world’s industry leaders is to maintain the current integrity of energy systems worldwide while steering towards this new transformed future. This requires new policies, strategies and the consideration of novel and risky investments. Each scenario provides insight into high impact areas of consideration for industry leaders and highlights areas for action:
• Reassess capital allocations and strategies
• Target geographies and new growth markets in Asia, MENA and Sub-Saharan Africa
• Implement new business models that expand the energy value chain and exploit the disruption
• Develop decarbonisation policies
• Address socioeconomic implications of climate change policies
Leaders are faced with important decisions in the context of high political, financial, technological and social uncertainty about the future of energy. The decisions taken in the next 5 to 10 years, in response to these and other implications, will have profound effects on the development of the energy sector in the coming decades.
The differing outcomes across the three scenarios provide leaders with short-term signals. These signals are invaluable to the robust development of medium and long-term enterprise strategies, government policies, investment and divestment decisions. For example, leaders may want to explore what assets in their portfolio may become stranded assets by 2030 or 2040 in Modern Jazz, Unfinished Symphony or examine Hard Rock realities.
These scenarios can also be applied to assess the consequences of climate change policies and to consider the robustness of portfolios for large-scale infrastructure investments, such as power plants for the period to 2060. In exploring these and other complex decisions, the Modern Jazz, Unfinished Symphony, and Hard Rock Scenarios provide energy leaders with an open, transparent, and inclusive framework to think about a very uncertain future.

1313
Chapter oneThe ‘Grand Transition’

14
WORLD ENERGY COUNCIL | SCENARIOS
1.1 THE ROLE OF THE WORLD ENERGY SCENARIOS
The World Energy Council aims to provide a wide range of insights into the current status and future of the world’s energy industry through its four flagship studies. These are:
• The Issues Monitor, covering current issues identified by energy executives
• World Energy Trilemma Index, examining country energy policy performance and trade-offs
• World Energy Resources, highlighting developments in energy resources and technologies
• The World Energy Scenarios, providing insights based on views of possible futures for the energy industry, developed with partners Accenture Strategy and the Paul Scherrer Institute
Scenarios are used in strategy development to consider potential implications of future events and possible responses to them. They give strategy developers a common language for thinking and talking about current events, as well as a shared framework for exploring critical uncertainties and facilitating more successful decisions. With the World Energy Scenarios, we hope to change the way energy decision makers frame their strategic problems and thus shape the choices they make (see Box for more on scenarios).
WHAT ARE SCENARIOS?The practice of developing and using scenarios emerged as a way to give decision makers collaborative foresight that can underpin their strategy and policy in an uncertain world.
Scenarios use rigorous research and analysis to map out possible contrasting future worlds. They identify significant events, dominant actors, and their motivations; and they convey how those future worlds function. Scenarios are a tool that can help us to better understand what the future might look like and the likely challenges of living in it. Scenarios work in part because they force us to reflect on the assumptions we make about the world, address critical uncertainties, and widen our perspectives on what we need to consider in developing successful strategy and policy.
Decision makers can use scenarios to think about aspects of the future that most worry them—or to discover which aspects should worry them—and to explore the ways these might unfold. Because many variables can determine what actually will happen, scenario builders create several scenarios. These scenarios all address the same important questions and all include those aspects of the future that are likely to persist, but each one describes a different way in which the uncertain aspects of the future could play out.

THE GRAND TRANSITION
15
1.2 FACTORS THAT SHAPED WORLD ENERGY: 1970-2015
The World Energy Scenarios examine the future of energy to 2060. This is a sufficiently long period to explore fundamental changes in the industry’s structure and how the industry conducts itself. In this section, we look at the historical drivers of global energy supply and demand over a similar time period, 1970 to 2015. Doing so is important, because the way we interpret history shapes the way we see the present and is a starting point for considering the future. Additionally, this exercise, establishes a benchmark against which we can gauge the magnitude of change the world may experience to 2060.
We begin by looking at the most significant factors that shaped world energy’s performance and how the interaction of four key drivers influenced energy outcomes:
• Population and labour force growth
• New technologies and productivity
• Environmental priorities
• International governance and geo-political relationships
Figure 1 illustrates how a series of smaller trends have converged to shape these factors and hence energy outcomes.
Figure 1: Factors that shaped world energy
Source: Accenture Strategy
Sub-Saharan
Africa New geographic demand centers
Machine Learning
Autonomous Everything
New Market Entrants
Digital Energy Storage
GrowingMiddleClass
MassConsumption
Geo-PoliticalTensionsGlobal
Institutions
MENA
Latin America
OECD
Regional Policies
Migrant CrisisEnergy Supply
Climate Change
Public Perception
New Competition
(Solar, Wind,
Battery, HC)
Distributed Systems
EconomicReform
DevelopingCountries
EnergyDrivers
Environ-mentalPriorities
Globalisation
TechnologyDevelopment
New Tech & Productivity
InternationalGovernance
Rise of China and Asia
Investment
Market Fragmentation
Russia
E�ciency
EV
New Market Entrants
New technologies and productivity
Population and labour force growth
Environmental priorities
International governance and geo political relationships
Population & Labour
Force
Source: Accenture Strategy
FIGURE 1: FACTORS THAT SHAPED WORLD ENERGY

16
WORLD ENERGY COUNCIL | SCENARIOS
1.2.1 POPULATION AND LABOUR FORCE GROWTHThe period of 1970 to 2015 was one of remarkable world economic growth—Gross World Product (GWP) grew 4.4 fold, or 3.3% p.a.1 High population growth, from 3.7 billion (bn) people in 1970 to 7.4bn in 20152, and rapid growth in the labour force, at 1.7% p.a., was complemented with a high rate of productivity growth3.
During this time, the Organisation of Economic Development and Cooperation (OECD) experienced a drive towards mass consumption and a rapidly growing middle class. From the 1980s, non-OECD countries—most notably, China and India—enjoyed similar rapid population growth and economic expansion. The Chinese economic reform of the late 1970s and the liberalisation of the Indian economy in the 1980s and 1990s led to a surge in economic development at annual rates not seen before. The result has been a large emerging middle class, striving for the energy-intensive lifestyle of OECD countries. The impact on energy demand in China, for example, has been dramatic: Annual increases frequently exceeding 10% p.a. drove a comparable need for rapid supply expansion.
1.2.2 NEW TECHNOLOGIES AND PRODUCTIVITYUnderpinning economic growth has been a historically high level of productivity—1.7% p.a. through the period. Significant factors in this performance are the widespread use of technology and high levels of investment. In some countries, such as China, this has averaged greater than 40% of GDP in the past three decades4.
Such technologies included industrial technologies and, from the 1980s, new information, computational and communication tools. The rapid rise in the use of the internet from 1990 and smartphones in the past decade has enabled developing and emerging economies to leapfrog traditional development pathways and experience more rapid economic transition. These latter technologies have encouraged connectedness and helped accelerate the drive towards globalisation, for better or for worse. Notably, export-oriented manufacturing economies developed rapidly in China, India and the rest of developing Asia, much faster than was the case for OECD countries.
The doubling of population and fast economic growth increased energy demand 2.6 fold during the period, much of it led by non-OECD countries. As per capita annual incomes reach around $30,000, countries experienced economic maturity and a decline in energy demand per capita (see Figure 2). At a global level, energy demand has gradually decoupled from GWP growth: Energy intensity declined by 0.9% p.a. between 1970 and 20145. This is partly due to a shift in GWP towards services and the maturing of demand in OECD countries. But technology improvements, such as combined cycle gas turbines, upgrading of inefficient older plants and higher efficiencies in end-use, also are significant factors.
1 The Conference Board, Total Economy Database (TED), 2016
2 UN Population Division, 2016
3 The Conference Board, Total Economy Database (TED), 2016
4 The Conference Board, Total Economy Database (TED), 2016
5 International Energy Agency Statistics, 2016

THE GRAND TRANSITION
17
6 International Energy Agency Statistics. 2016
7 BP Statistical Review of World Energy, 2016
Figure 2: Energy Use and Income Per Capita (1990-2015)
0
10
20
30
40
50
60
702-
3
3-4
4-5
5-7
7-9
9-13
13-1
6
16-2
0
20-2
6
26-3
0
30-3
5
35-4
0
40-4
5
45-5
0
50-5
5
Ener
gy U
se p
er C
apita
(BO
E)
GDP Per Capita, PPP (Current Thousand International Dollars)
China
India
Japan
Germany
S Korea
US
Energy Use Per Capita (1990 – 2015)
Source: IMF, World Bank, BP Conversions, Accenture AnalysisSource: IMF, World Bank, BP Conversions, Accenture Analysis
FIGURE 2: ENERGY USE AND INCOME PER CAPITA (1990-2015)
Several technological advancements across the energy value chain have increased global energy demand. Consumers’ desire for more environmentally friendly modes of transportation increases the need for electrification. Furthermore, while consumers increasingly look for more efficient technologies to reduce energy consumption, such as smart thermostats or connected buildings, global demand for electricity is expected to increase in concert with expanding urbanisation. Gasification is also an increasingly significant trend. City fleets, long-haul trucking and inland marine vessels will be behind most of the growth in the use of natural gas as a transportation fuel. With the recent treaty between OECD countries to restrict the use of bunker fuels within 200 miles of members’ coastlines, the marine sector is reconsidering its fuel needs. Consumers, organisations and countries increasingly want cleaner, lower-carbon-intensive energy of all types to meet their needs.
During the period, the global economy has decarbonised at around 1.1% p.a.6, due to the decline in the share of fossil fuel in primary energy from 94% to 86%7, as well as the growing share of gas among fossil fuels, which has lower greenhouse gas (GHG) emissions compared with oil and especially coal.
1.2.3 ENVIRONMENTAL PRIORITIESSince the 1970s, environmental concerns have risen sharply on national and global agendas. Sustainable development moved to the fore in the late 1980s (the Brundtland Commission reported in 1987) as did climate change, with the founding of the Intergovernmental Panel on Climate Change in 1988. COP1 was held in 1995, and the Kyoto Protocol negotiated in 1997. While not all countries were prepared to commit, many successfully reduced emissions and continued progress in decarbonisation via nuclear power developments, reduced coal use (partly due to gas substitution) and, more recently, the deployment of renewable energy projects and the use of more efficient vehicles and thermal power technologies.

18
WORLD ENERGY COUNCIL | SCENARIOS
At COP21 in 2015, governments signed up to limit “the increase in the global average temperature to well8 below 2°C above pre-industrial levels and to pursue efforts to limit the temperature increase to 1.5°C above pre-industrial levels”. How, when and if these commitments are addressed will have a significant impact on the future of energy demand and the energy mix.
During the period of 1970 to 2015, public health issues related to the energy industry also had a high profile. Lead in petrol, nitrous oxides emissions from diesel-fuelled vehicles, fine particulates from coal-burning, and the domestic use of solid fuels in rural areas have raised the public’s awareness of the energy industry’s impact on health. The public in many countries have grown wary of nuclear power due to a small number of high-profile accidents.
1.2.4 INTERNATIONAL GOVERNANCE & GEO-POLITICAL RELATIONSHIPSThe evolution of international governance structures and the nature of state rivalry have a significant impact on economic and energy policies and the pattern of energy trade. The current international governance structure was established in 1945 with the founding of the United Nations. The UN’s charter enshrined the veto rights of the five permanent members of the Security Council: China, France, Russia, the United Kingdom, and the United States. The UN has since grown to more than 190 members (with many new members having gained independence) and now encompasses a flotilla of institutions addressing global issues.
Economic institutions were shaped in the 1970s. The leaders of the G7 have met since 1977 and, in 2008, meetings began among the leaders of the G20.9 Still, with a high probability that a substantial share of economic growth between now and 2060 will happen outside of the G20, leaders continue to search for a representative structure that can effectively reflect the new economic and political realities of a ‘globalising world’.
Geopolitical relationships between major energy consumers and major energy suppliers have also evolved from a long history. The cold war in the 1970s and 1980s highlighted the division and rivalry between the Soviet Union and the USA, Western Europe, Japan and allies. Although the cold war ended in 1990, the rivalry continues today in new ways, creating a new set of challenges.
Relationships with the Middle East have been shaped by the oil embargoes of the 1970s. The resurgence of the Gulf Coast Consortia (GCC) and Organization of the Petroleum Exporting Countries (OPEC) in recent years dampened the growing trend of a diversifying supplier landscape. Unconventional gas from North America and Australia was making strong progress towards penetrating global markets. The development of new frontiers in hydrocarbons will be heavily influenced by OPEC production. Tensions and war in the Middle East will also shape global diplomatic and economic relationships, as in recent years’ regional conflicts have become more global in impact.
Africa has emerged as the next potential major supplier of natural resources. Almost 30% of global oil and gas discoveries made in the past five years have been in Sub-Saharan Africa (SSA), reflecting growing potential for the development of African economies.
8 UNFCCC COP21 Agreement Report, 2016, Article 2, pg. 22
9 G20 members represent around 85 per cent of global gross domestic product, over 75 per cent of global trade, and two-thirds of the world’s population. The members of the G20 are: Argentina, Australia, Brazil, Canada, China, France, Germany, India, Indonesia, Italy, Japan, Republic of Korea, Mexico, Russia, Saudi Arabia, South Africa, Turkey, United Kingdom, United States, European Union.
THE GRAND TRANSITION
19
1.2.5 ENERGY POLICIES AND THE ROLE OF THE STATEIn most countries, national energy policies have shaped major decisions on energy and still do so today. These policies, of course, reflect energy resource endowments and energy needs. The role of the state in running energy enterprises has evolved in many directions across energy sectors. For example, in 1970 virtually all electricity companies were state run, but this changed in the 1990s as many governments pursued liberalisation. However, the private oil companies that dominated the international oil industry in 1970 have been progressively eclipsed by the state-run national oil companies (NOCs). Yet we also in recent years have seen the rise of smaller independent operators (especially in NAM) that offer a new model for exploration, production and midstream assets. The role of private versus state-owned enterprises in energy developments will continue to shift over the next 45 years10.
Against this backdrop of ever-evolving priorities and business models, one universal aspiration remains: to provide energy systems that are simultaneously affordable, stable and environmentally sensitive. Addressing this “energy trilemma”—supporting affordable energy access, energy security and environmental sustainability of providing energy11—requires decision makers in government and business to strike a delicate balance between individual country and business goals and world energy goals.
1.3 FACTORS THAT WILL SHAPE WORLD ENERGY: 2015-2060
The energy system features in the past 45 years provide a baseline to compare what could come in the next 45 years—the world energy scenarios time horizon. However, one must look beyond historical trends when considering the factors that will shape the future. We began the process to identify these factors with a series of executive interviews.
1.3.1 EXPERT INSIGHTSWe asked a range of energy experts for their views on the issues that would shape the future of energy. Many were surprised at the pace of change in the past three years—in particular, the US shale revolution, solar technology advancements and cost reductions, the shifting geopolitics within the Middle East, and the evolution of distributed generation and distributed systems. They also described solar, e-mobility, smart grids, storage, and digitalisation as the most disruptive technologies that could invalidate existing business models, and potentially entire systems, in both power and transport. Additionally, they identified a number of key drivers as critical to the future of energy systems. These include handling complexity and uncertainty, demographics, global economy, climate change, market structures and technology innovation. These issues became a focus of the early research into possible energy futures.
This research provided the foundation for a process, involving energy leaders and a broad variety of economic and industry experts from every region around the world, which enabled the framing, building, affirmation and regional deepening of the scenarios in more than a dozen workshops, and their subsequent modelling and quantification. The result was a refinement of ideas through a rigorous process to isolate the most critical elements that will shape the future of energy.
10 Crude oil prices have been shaped by OPEC over the period, with prices either significantly higher or lower than long-term average prices—exhibiting the form of a ‘roller coaster’. This pattern may well persist going forward. IEA was established in 1974 to assist OECD countries with mitigating the risks to supply security. IEA’s energy analysis role has widened to include energy policy and climate change.
11 These issues of energy equity, security and environmental impact are central to integrated policy and are reflected in the The World Energy Council’s trilemma analyses.

20
WORLD ENERGY COUNCIL | SCENARIOS
1.3.2 WHAT IS PREDETERMINED – THE ‘GRAND TRANSITION’?In futures analysis, it is useful to distinguish between elements that are relatively forecastable over the scenarios horizon—in this case, to 2060—and those that are important yet uncertain. It is from these elements that one can identify and construct appropriate scenarios. We first look at what is relatively predictable—that is, predetermined—before we examine the critical uncertainties around which we will build our assessments of the future.
Even looking out as far as 2060, not everything is unpredictable. A number of strong trends must be considered regardless of scenario. Collectively these trends imply a fundamentally new context for the world energy system. If anything, beyond 2060 these trends will be stronger, not weaker. We call the journey to this new world the Grand Transition.
The Grand Transition takes us into a world of:
• Much lower population and global labour force growth
• A range of new powerful technologies
• A greater appreciation of the planet’s environmental boundaries
• A shift in economic and geopolitical power towards Asia
We look at these elements in more detail.
1.3.2.1 Population and labour force growthThe world’s population has doubled from 3.7bn people in 1970 to 7.4bn in 201512. According to the UN, in its medium variant forecast, global population growth will continue to slow due to lower fertility rates. By 2060, population is expected to reach around 10.2bn.
This slowing growth will translate into much lower labour force growth than we have seen in the past 45 years, as well as actual contraction of labour forces in countries such as China, Japan, South Korea, Russia and much of EUR. As societies age and labour force growth averages only 40% of the historical rate, many societies will have to fundamentally change their structure (see Figure 3). Negative impacts will follow on economic growth rates, investment and consumption patterns, which will have consequences for the energy sector.
Figure 3: World Labour Force Growth (% p.a.)
Source: Total Economy Database, UN Med Variant Population Forecast, Accenture Analysis
1.7%
1970-2015
0.7%
2015-2060
FIGURE 3: WORLD LABOUR FORCE GROWTH (% P.A.)
Source: Total Economy Database, UN Med Variant Population Forecast, Accenture Analysis
12 UN Population Division, 2016

THE GRAND TRANSITION
21
1.3.2.2 New technologiesNew technologies—including the full diffusion of information, sensing and communication technologies, automation, more productive resource technologies, and health technologies—will have the potential to reshape economic and social options. The pace at which these new technologies develop continues to accelerate at an exponential rate whilst technology costs tumble and the technologies become ubiquitous. Furthermore, the combinatorial effect of these technologies is creating the environment for fundamental change. For example, fully driverless Electric Vehicles (EVs) are fast becoming a reality. The combinatorial effect of battery technology, GPS, machine learning and analytics have created the right environment to accelerate what was previously seen as niche development or a longer-term change.
As these technologies mature, combine and are deployed across the economy, in the broadest sense we will see major changes in the energy industry, including:
• Smart cities, in a world that is 70% urbanised by 206013
• Automation, artificial intelligence and robotics
• Workforce of the future and digital productivity
• Energy efficiency and demand side behaviour
• Automated, zero carbon, mass transit innovation
• Wind and solar, and integrated grid/storage
• Electric vehicles (EV)
In short, the dominant technologies that will drive the energy industry in the Grand Transition will be very different from those employed during the past 45 years.
1.3.2.3 Environment – Planetary boundariesThe energy industry’s environmental priorities will be shaped by choices the public, informal networks and governments make with respect to ensuring the integrity of planetary boundaries. Of the nine areas identified by scientists14, (see Figure 4) four are of particular concern at the global level: climate change, biodiversity loss and species extinction, biogeochemical flows (phosphorus and nitrogen cycles) and land-system change (for example deforestation). At the regional level, concern is growing over freshwater use and availability—for example, across parts of Africa and India.
13 World Urbanization Prospects: The 2014 Revision, Highlights (ST/ESA/SER.A/352). United Nations, Department of Economic and Social Affairs, Population Division (2014).
14 A safe operating space for humanity, Johan Rockström et al, Nature Vol 461, 24 September 2009.

22
WORLD ENERGY COUNCIL | SCENARIOS
Figure 4: Planetary Boundaries
Source: A safe operating space for humanity, Johan Rockström et al, Nature
Biosphere integrity
BII
E/MSY
P
N
Climate change
Novel entitles
Stratospheric ozone depletion
Land-system change
Atmospheric aerosol loading
Ocean acidification
Freshwater use
Biogeochemical flows
In zone of uncertainty (increasing risk)
Beyond zone of uncertainty (high risk) Below boundary (safe)
FIGURE 4: PLANETARY BOUNDARIES
Source: A safe operating space for humanity, Johan Rockström et al, Nature
These challenges remind us how new technologies can empower and encourage individuals to address environmental concerns—and that the environmental agenda going forward will be much wider than we currently envisage. The same is true of the options—not just mitigation, but also widespread adaptation and building appropriate resilience into infrastructure. In the Grand Transition, managing environmental challenges will be a central policy concern.
1.3.2.4 Shift in power towards AsiaBetween 2040 and 2050, Asia will surpass NAM and EUR combined in global power, based upon GDP, population size, military spending, health, education, governance and technological investment.
Today, about a third of the world’s middle class consumption takes place in Asia, a share that will double by 2060. China will probably have the largest economy, surpassing that of the United States (US) around 2030. Meanwhile, the economies of EUR, Japan, and Russia likely will continue their slow relative declines.
Emerging economies such as China, India and those in the Middle East are now in the midst of a highly energy-intensive stage of their economic development as they make substantial investments in infrastructure. The choices Asia makes particularly with respect to economic, energy and climate change policies, will be central to global development in the Grand Transition.
In sum, the Grand Transition takes us into a new world with new economic, geopolitical and environmental realities, but also with the technologies and tools to tackle our problems. But not everything is predictable and much that will determine the future context for energy is uncertain. We now turn to these matters.
THE GRAND TRANSITION
23
1.3.3 WHAT IS UNCERTAIN – PATHWAYS THROUGH THE GRAND TRANSITION? There is much we do not understand about the energy sector’s trajectory and how the energy industry would work in the new world described above. In particular, the outcome of the following uncertainties will be critical in determining the specifics of the future world of energy:
• Pace of innovation and productivity
• Evolution of international governance and geo-political change
• Priority given to sustainability and climate change
• The selected ‘tools for action’—the balance between the use of markets and state directive policy
We explore each of these in more detail.
1.3.3.1 The pace of Innovation and ProductivityProductivity15 is about “working smarter” rather than “working harder”. It reflects our ability to produce more output by using new ideas, technological innovations and new business models to more effectively combine inputs. Productivity is expected to be the main driver of economic growth and well-being to 2060.
Perhaps the biggest challenge is to grow economies and income while ensuring jobs growth. But the essential fact is that productivity growth destroys jobs—the productivity paradox—unless adequate approaches to educate, retrain and employ are in place. To complicate matters further, a fierce debate rages over the outlook for future productivity growth between the techno-pessimists and techno-optimists.
The techno-pessimists16 believe the recent slowdown in productivity is permanent and the types of innovations that took place in the first half of the 20th century (electrification and the internal combustion engine, to name two prominent ones) are far more significant than anything that has taken place since then (such as ICT), or likely will transpire in the future.
The techno-optimists believe the rate of technological progress has not slowed and the IT revolution will continue to transform frontier economies. Increasing digitalisation of economic activities has unleashed four main innovative trends:
• Improved real-time measurement of business activities
• Faster and cheaper business experimentation
• More widespread and easier sharing of ideas
• Ability to rapidly replicate innovations, allowing accelerated scaling-up
Impacts of these trends, while significant for each individually, are strongest when trends combine.
15 Paul Krugman, the Nobel Laureate, noted in 1994: “productivity isn’t everything, but in the long run it is almost everything”. (p.11 ‘The Future of Productivity’, OECD 2015)
16 Gordon, R. (2012), “Is U.S. Economic Growth Over? Faltering Innovation Confronts the Six Headwinds”, NBER Working Papers, No. 18315. And Gordon, R. (2015), The rise and fall of American Growth, Princeton University Press.

24
WORLD ENERGY COUNCIL | SCENARIOS
Advances in information and communication technologies and enhanced computing power have the potential to fuel future productivity growth by making advances in basic science more likely.
Furthermore, as the most important factor determining economic growth, productivity will be a key determinant in shaping the energy sector’s size and scope. Recognizing the views of both the optimists and pessimists have some degree of credibility, we envisage a broad range of feasible outcomes for global productivity for the period 2015 to 2060: 1.0% to 2.6% p.a., compared with 1.7% p.a. for the period 1970-2015.
Figure 5: Global Productivity Growth % p.a. (1970-2060)
Source: TED Database, UN Medium Variant Forecast, WEC/Accenture Analysis
1.7%
Actuals1970-2015 2015-2060
1.0%
Low
2.6%Future range
Hi
FIGURE 5: GLOBAL PRODUCTIVITY GROWTH % P.A. (1970-2060)
Source: TED Database, UN Medium Variant Forecast, The World Energy Council/Accenture Analysis
1.3.3.2 Changing power blocs – the evolution of international governance and geo-political change?Figure 6 highlights the US National Intelligence Council’s17 view of the relative power of the most influential nations going forward. As shown here and discussed earlier, we face a pre-determined shift in geopolitical power towards non-OECD countries—primarily China and India.
However, going forward it is uncertain what form and focus state rivalry will take, and whether a collaborative international governance structure that serves the needs of all in the 21st century can be built.
The most positive tailwind going forward would be a collaborative approach by the main powers to strengthen international governance structures to cope with the transition of economic and geopolitical power. Supporting this would be a strong approach to managing security matters and economic growth, enhanced by increased trade flows and technology transfer. Additionally, a broad-based agreement would be in place to address other collective issues, such as climate change.
17 Global Trends 2030 (2012), US National Intelligence Council.

THE GRAND TRANSITION
25
Figure 6: Global Power Index
Source: Global Trends 2030 (2012), US National Intelligence Council.
0
5
10
15
20
25
20102015
20252030
20352040
20452050
Japan
Russia
India
EU
US
China
Index
Source: Global Trends 2030 (2012), US National Intelligence Council
FIGURE 6: GLOBAL POWER INDEX18
But headwinds could emerge, particularly if the shift in power is seen as a threat and aggressive rivalry leads to nationalist policies that inhibit economic growth and technology transfer.
This raises some key questions that cannot easily be answered: Will international governance be integrated or fractured? Will the transition be ‘smooth’ or ‘bumpy’? We believe there is value in examining the following range of possibilities:
• Broad-based international governance, covering security, economic and environmental matters.
• Economics-focused international governance ensuring that capital markets, technology transfer and trade continue to function well.
• Fractured and weak international system that cannot address global challenges.
The international governance system that emerges will significantly shape economic, energy and climate change policies.
18 Note the NIC’s Global Power Index is based on an expanded approach which includes the traditional measures: GDP, population size, military spending, and technology, now increased to include: health, education and governance.

26
WORLD ENERGY COUNCIL | SCENARIOS
1.3.3.3 Sustainability and Climate ChangeThe priority the public and governments assign to the wide range of environmental issues is open to question. However, if we are to meet carbon emission targets without hampering economic growth in the long-run, the energy sector must significantly decarbonise.
Governments’ commitments to COP21 are not substantial enough to stay within the 1000Gt CO₂ carbon budget necessary for keeping the temperature below 2°C, the upper limit mentioned in the Paris Agreement. In fact, the current country pledges imply a 2.7°C rise. Keeping the temperature increase below the 2°C target will require annual global carbon emissions-reduction rates of a minimum 3% p.a., far beyond any historical experience. As Figure 7 indicates, large amounts of fossil fuels will need to stay in the ground or require carbon capture and underground storage technologies. Much of this would be coal, a special challenge in Asia where coal is a base fuel for power generation.
Notably, the importance of adaptation has become part of the agenda in many countries given the increasing number of extreme weather events that affect critical infrastructures today.
Figure 7: Climate Change Challenge
Source: Accenture Strategy Energy Institute - IPCC
Fossil fuel proven reserves and carbon intensity
0.5
900700
4.0
2000.0
0
2.5
100 500
Proven reserves (Gtoe)
Area = GtCO2 emission potential
Fuel carbon intensity (tCO2/toe)
1.5
400
3.0
4.5
600
3.5
2.0
300 800
1.0 1 000GtCO2
Total CO 2 fro
m
proven reserves:
2800Gt
Gas
Oil
Coal
FIGURE 7: CLIMATE CHANGE CHALLENGE19
Source: Accenture Strategy Energy Institute – IPCC
The energy sector’s decisions will be fundamental to a successful transition. But will the sector that ultimately emerges adequately consider all of the challenges or only focus on parts of the problem? The tailwinds that support rapid decarbonisation are technology learning curves that bring the cost of renewables closer to fossil fuel parity—as seen with solar, and the development of economic carbon, capture and storage options, supported by the public. Many decarbonisation technologies, in many countries, offer co-benefits to security and public health. Additionally, as adaptation becomes a key focus, it will be important to appreciate the benefits of building resilience into infrastructure. However, headwinds—such as the high cost of climate-friendly technologies, as well as concerns over affordability, equity and access—could slow developments. Weak economic development could limit investments and the ability to subsidise technologies.
19 The carbon budget analysis done for the purposes of exploring potential futures, a simplified approach has been taken. Only carbon emissions are accounted for in calculating the 1000 GtCO₂ budget. When other greenhouse gases (GHGs) are taken into account, the budget is reduced further.

THE GRAND TRANSITION
27
1.3.3.4 Tools for actionThe key tools for enabling change are state directives and markets. All states have a mixture of both. Even strong market economies like the USA have a wide range of regulations—for example, anti-trust policies and environmental standards. But what is the right balance between directives and markets going forward? And what are the best government incentives for citizens and other economic players?
Some see the answer in ideological terms, contrasting central planning against ‘free markets’. However, the experiments with centrally planned economies in the 20th century, such as in the Soviet Union, have been largely ineffective in responding to consumers’ needs. Successful transformation into a managed market economy, as in China, required a number of exceptional circumstances, including the strong commitment by Chinese leaders to market reforms and the encouragement of state-owned firms to abide by market incentives20.
Others point to the role of state indicative planning as a useful guide for private (and state) investment. This can be useful in the development stage of economies. Both cultural factors and country experience shape choices when determining the balance between state planning/directives and markets.
In the current debate on the environmental and social factors shaping energy policy, there is a clear difference between those who take a socio-political perspective and those who see choice as predominantly a techno-economic matter. As illustrated in Table 1, each perspective includes two very distinct and coherent bodies of tools. One focuses on taxes and subsidies; the state’s role in research, regulation, and education; national planning; and state-run companies and public investment. In contrast, the markets-focused perspective is concerned with competition, corporate vision and planning, and private investment in R&D, innovation and training. A set of public-private enterprises is emerging, but such organizations remain limited.
States (Governments) Markets (Businesses)
Taxes and subsidies Competition (Cost efficiency)
Public R, D&D Private R, D&D
Regulation Innovation
Education Training
National and sector planning Corporate vision and planning
Public investment Private investment
State companies (Monopoly) Private corporations
Public-private enterprises
Source: The World Energy Council
TABLE 1: SELECTED ‘TOOLS FOR ACTION’ FOR STATES AND MARKETS
20 Paradoxes of China’s Economic Boom’, Martin King Whyte, Harvard University, The Annual Review of Sociology, 2009.
28
WORLD ENERGY COUNCIL | SCENARIOS
Going forward which set of tools will dominate, and what will be the consequences for the energy sector? Will it be possible for those holding contrasting perspectives to exchange information and viewpoints to reach a common understanding of the problem, if not common solutions?
The tailwinds that would strengthen the role of state directives would be strong public support for addressing environmental and social concerns. States’ enunciation of clear vision and policy direction can help create solidarity. Headwinds can occur when strong state actions lead to unproductive investment (i.e., ‘picking the wrong winners’), ineffective and costly subsidies and bureaucratic failure, including corruption.
The tailwinds encouraging markets are efficient investment, high levels of innovation, productivity and reduced costs. Markets can respond quickly to consumer needs. Headwinds are the risks of creating inequity, short-sighted decision-making and market failure (for example, by being too concentrated).
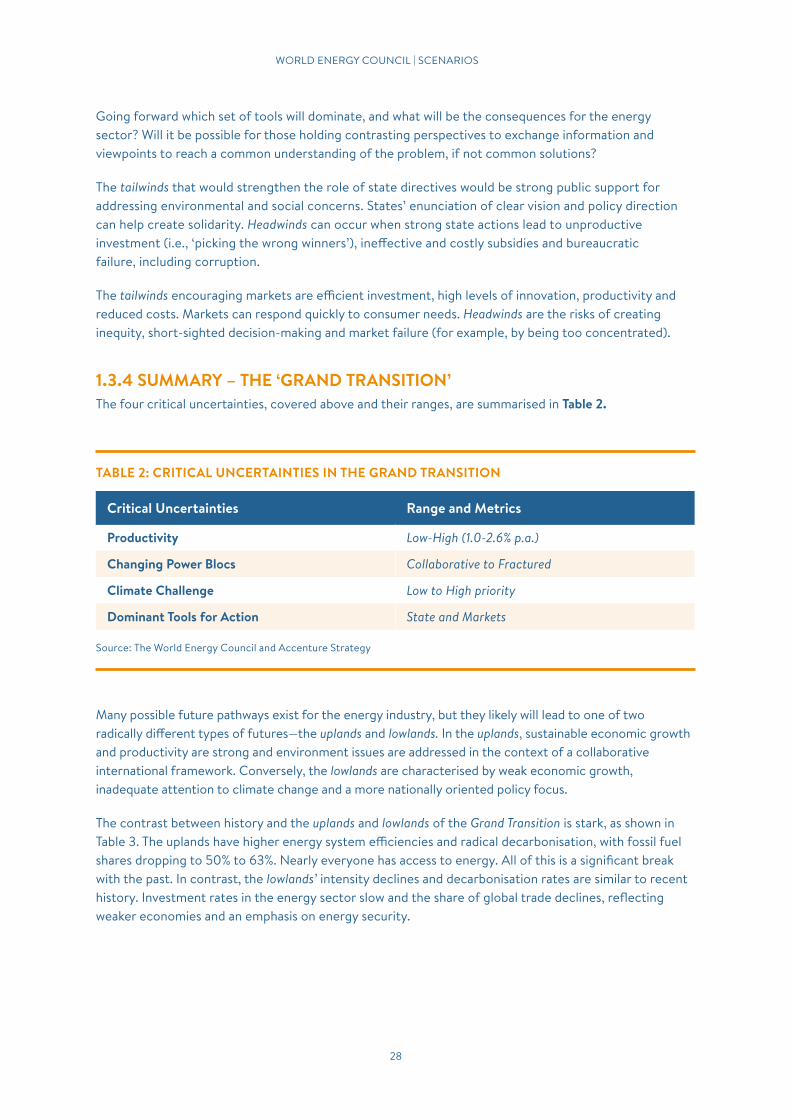
1.3.4 SUMMARY – THE ‘GRAND TRANSITION’The four critical uncertainties, covered above and their ranges, are summarised in Table 2.
Critical Uncertainties Range and Metrics
Productivity Low-High (1.0-2.6% p.a.)
Changing Power Blocs Collaborative to Fractured
Climate Challenge Low to High priority
Dominant Tools for Action State and Markets
TABLE 2: CRITICAL UNCERTAINTIES IN THE GRAND TRANSITION
Source: The World Energy Council and Accenture Strategy
Many possible future pathways exist for the energy industry, but they likely will lead to one of two radically different types of futures—the uplands and lowlands. In the uplands, sustainable economic growth and productivity are strong and environment issues are addressed in the context of a collaborative international framework. Conversely, the lowlands are characterised by weak economic growth, inadequate attention to climate change and a more nationally oriented policy focus.
The contrast between history and the uplands and lowlands of the Grand Transition is stark, as shown in Table 3. The uplands have higher energy system efficiencies and radical decarbonisation, with fossil fuel shares dropping to 50% to 63%. Nearly everyone has access to energy. All of this is a significant break with the past. In contrast, the lowlands’ intensity declines and decarbonisation rates are similar to recent history. Investment rates in the energy sector slow and the share of global trade declines, reflecting weaker economies and an emphasis on energy security.

THE GRAND TRANSITION
29
Challenges 1970-2015Grand Transition 2015-2060
Uplands Lowlands
Energy Intensity Decline 0.9% p.a. 2.4-2.7% p.a. 0.5-0.9% p.a.
Carbon Intensity (Decarbonisation) 1.1% p.a. 3.9-4.7% p.a. 0.9-1.2% p.a.
Fossil Fuel Share of Primary Energy 86% to 81% 50-63% 65-70%
Electricity Share of Final Energy 9% to 18% 27-29% 24-26%
% Internationally traded Energy 22% 15-16% 12-13%
No. of people without access to electricity 1.1bn 0.0-0.5bn 0.5-1.0bn
Source: The World Energy Council, Paul Scherrer Institute, Accenture Strategy
TABLE 3: CHALLENGES FACED BY ENERGY LEADERS IN THE GRAND TRANSITION
1.4 WHAT SCENARIOS BEST EXPLORE THE ‘GRAND TRANSITION’?
There is an infinite number of pathways through the Grand Transition. Which are the best alternate routes that are most instructive and challenging for energy leaders?
Of the four critical uncertainties, three are important drivers of possible sustainable economic growth: productivity, climate change policy and outcomes, and international governance in the face of shifting power to Asia. The last uncertainty—the dominant tools for action, markets or state direction—is of special importance for energy leaders. While one may see the choice of tools for action as limited to a simple dichotomy, states vs. markets, both are needed: an efficient regulation designed by states and efficient resource allocation as an outcome of market forces. The real question is how to best design efficient policy instruments to provide appropriate incentives for economic actors and citizens.
The scenarios selected to elucidate the challenges facing energy leaders are exploratory routes through the Grand Transition, rather than extremes. They are neither utopias nor dystopias, nor are they normative—that is, designed to meet a future goal. Rather, they span a range of plausible pathways.
We have chosen two scenarios that explore the uplands of the Grand Transition, each with a different set of dominant tools—one that uses predominantly state directives and the other predominantly markets. Also, the type and application of technologies are the main differentiators across the scenarios: Technologies that maximize comfort and benefits for individuals are contrasted with large-scale applications for the use and provision of public goods.
The third scenario explores the lowlands of weaker and unsustainable economic growth and investment driven by inward-looking policies. There is a patchwork of policies and new technologies that are predominantly the result of coping strategies from various groups and stakeholders.

30
WORLD ENERGY COUNCIL | SCENARIOS
Figure 8: The Grand Transition and Three Scenarios
High success (“Uplands”)
Low success (“Lowlands”)
How successful is the world in achieving sustainable economic growth?
What are dominant ‘tools for action’?
Market
State Policies
Patchwork of state policies and markets
Critical uncertainties
Pre-determined
Unfinished Symphony
Modern Jazz
Hard Rock
Grand Transition
• Slowing population growth
• Range of new technologies
• Appreciation of new planetary boundaries
• Shift in power to Asia
FIGURE 8: THE GRAND TRANSITION AND THREE SCENARIOS
Source: The World Energy Council
The three scenarios that have been selected, illustrated in Figure 8, are titled Modern Jazz, Unfinished Symphony and Hard Rock21. Each scenario describes the development of a possible future energy system at the global and regional level. We outline a broad description and the key features of the three scenarios below.
1.4.1 MODERN JAZZThe outcome in 2060 is a world with a diverse set of resilient and lower-carbon energy systems. A highly complex and competitive market landscape drives efficiency, innovation, open access to information and rapid deployment of new technologies. Key features are:
• The world is highly productive, with fast economic growth and strong technological development.
• Digitalisation changes not only the way people work, but also the way they live, and has a transforming impact on global governance and political systems
• Politics are characterised by rapidly changing loyalties and coalitions; new political movements come and go in rapid succession and media become decisive opinion leaders
• New lifestyles are adopted, facilitated by pervasive, smart and seamless integration of new technologies, especially by younger generations (digitally connected elites)
• The economic and geopolitical shift to Asia is handled well
• Sustainability is addressed with technology innovation and new business models
• Energy costs are reduced due to developments on the energy supply side and the mid-stream, and there is greater access to energy for all.
21 The scenario names reflect use of musical genre to give a sense of the mood of each scenario. Thus each of these musical titles evoke a sense of the world described. For example, for Modern Jazz, we can quote that “Jazz (is) the music of boundless individualism... and the music of the collective.” And for Unfinished Symphony, ‘You can’t play a symphony alone, it takes an orchestra to play it.” And finally Hard Rock is an expression of strength of spirit in facing hard times.

THE GRAND TRANSITION
31
1.4.2 UNFINISHED SYMPHONYBy 2060, the world is “ticking on the same clock” and has shifted to a resilient, integrated, global low-carbon energy system. There is global unified action on security, environmental and economic issues, and global institutional and national governments support enabling technologies. Key features are:
• Moderate to fast economic growth, sustainable and more evenly distributed, with high levels of infrastructure investment
• Emergence of new societal goals and behaviours of ‘shared economy’ models that lead to significantly reduced energy demand
• Significant re-balancing of global wealth through consumer taxes and transfer of technologies from North to South
• Support for a broad-based international governance structure covering security, environmental and energy matters
• An extensive network of fiscal incentives such as green subsidies and carbon pricing, with global standardization across sectors
• Strong technological innovation in large-scale, integrated solutions that drive efficiencies and reduce carbon emissions, although there is more to do to address climate change targets.
1.4.3 HARD ROCKThe outcome in 2060 is a fractured world, with a diverse set of economic, energy and sustainability outcomes. Nationalist interests prevent countries from collaborating effectively on a global level, with limited attention to addressing climate change. Technologies are mandated based on availability of local resources. Key features are:
• Economic growth is slower due to low productivity growth and an aging population with slow growth in labour force
• Poverty and inequity rise, weakening the social fabric
• Ineffective international policies refocus priorities and a strong North-South divide leads to political conflicts and occasional armed conflicts
• Self-centred and nationalistic behaviours prevail, based on widespread fear that people will become losers in an ever-increasing battle for resources and wealth.
• Large-scale domestic energy solutions are driven by security concerns: for example, hydro, nuclear and fossil fuels
• There is underinvestment in energy systems and weakening resilience
• Commodity prices are volatile, with periods of shortage and peak prices followed by underinvestment and recession
• Regional coping strategies start to emerge and differentiate winners from losers, and there are pockets of best-practice solutions to the energy trilemma.
In the next chapter, we review each of the three scenarios in detail.

32
Chapter twoThe World to 2060

THE GRAND TRANSITION
33
2.1 INTRODUCTION
A new environment is emerging for world energy systems, creating both challenges and opportunities for global leaders, as laid out in The Grand Transition. Leaders face lower employment growth driven by a decline in population, radical progression of new technologies, greater environmental challenges and a shift in economic and geopolitical power towards Asia. Such trends could result in a variety of potential futures depending on how the world approaches economic growth and productivity, the climate challenge and international governance via the use of policy and market mechanisms.
Exploring alternative futures along each of these dimensions generates three distinct scenarios: Modern Jazz, Unfinished Symphony and Hard Rock. The following section explores these scenarios in more detail and how divergence across the critical uncertainties could affect energy systems. Figure 9 summarises the pre-determined elements and critical uncertainties laid out in The Grand Transition.
Figure 9: Summarizing The Grand Transition (Image)
Factors that shaped world energy 1970 to 2015
Pre-determined elements
Population /Workforce Growth
New Technologies
Planetary Boundaries
Shifts in power
Pre-determined elements 2015 to 2060
• Global population grew 2x
• 1.7% p.a. growth in employment
• Global population grows 40%
• 0.7% p.a. growth in employmentDemographics favour developing economies
• Combinatorial e�ect of newtechnologies is disruptive
• Productivity varies from 1.0-2.6% p.a.
• Technology helps to enable productivity growth rate of 1.8% p.a.
• Water stress in high risk regions
• 1,000 GtCO2 to 2,100 to avoid 2°C
• Societal values support climate action
• Four planetary boundaries already crossed
• 1,900+ GtCO2 consumed
• 2030: India is most populous country
• 2035-45: China is the world’slargest economy
• Rapid growth of non-OECD countries
• Growing role for global institutionse.g. UNFCCC, IMF, WTO and G20
Modern Jazz Critical uncertainties
Productivity and economic growth
Tools for action
Climate challenge
International governance
Unfinished Symphony Hard Rock
• Open economies
• Digital boost
• Free markets
• Enabling policies
• New business models
• Local support
• Global mandates
• Unified action
• Consumer driventechnology adoption
• Technology support
• Strong global cooperation
• Regional integration
• Complex globalisation
• Shifting hubs
• Growing global connections
• Intelligent growth
• Circular economies
• Climate focused policy
• Global policy convergence
• Domestic growthand expertise
• Local content emphasis
• Security focused policy action
• Lower GDP growth
• Energy securitydrives renewables
• Fragmented politicaland economic systems
• Power balancingalliances
FIGURE 9: SUMMARISING THE GRAND TRANSITION
34
WORLD ENERGY COUNCIL | SCENARIOS
2.2 MODERN JAZZ
“JAZZ ISN’T METHODICAL, BUT JAZZ ISN’T MESSY EITHER” – NAT WOLF
Modern Jazz is a competitive world shaped by market mechanisms and a highly complex and fast-paced economic and energy landscape that is constantly changing and evolving due to rapid technology innovation. Amplified globalisation and the continued penetration of digital technologies lead to new markets across industries, driving strong productivity gains and strong economic growth.
Lifestyles are urban, mobile and highly dependent on technology. People in every region are more interconnected with each other and with their homes and offices than ever before. Open economies enable talented workers to travel easily from one innovation hub to another.
Emerging technologies are exceptionally disruptive to energy systems and lead to substantial diversification of primary energy. In transport, natural gas and EV penetration lead to a diverse fuel mix. Solar, wind and storage energy solutions increase distributed systems’ penetration in power. Technology transfer and innovation mean Africa and India can skip carbon-intensive phases of development. Utilities are forced to adapt to changing demand patterns and adopt new business models.
Policymakers, supported by the values of civil society, support an energy transition through light-touch policy intervention. In the absence of an international climate framework, carbon pricing and taxation schemes grow more slowly, from the bottom up, based on regional, national and local initiatives. However, with technology innovation, rapid improvements are possible in the economics of renewable energy and storage technologies. This leads to drastic shifts in energy and carbon intensity globally, without substantial economic disruption.
The result in 2060 is a shift to a more resilient, lower-carbon energy system. However, although carbon emissions fall to 23 GtCO₂ p.a. by 2060, the world does not limit emissions enough to meet the 1000 GtCO₂ target for 2°C and faces potential economic losses due to the impact of climate change.
2.2.1 TOOLS FOR ACTIONWith market forces dominating, private industry is the strongest actor. Technology choices and developments are driven by competitiveness, cost, and reliability. Markets emphasise individual freedom of choice and give a stronger voice to consumers, whose values drive a behavioural shift to products and services that meet a high level of environmental and social compliance. Successful companies respond with new business models and a diverse set of consumer offerings. Policymakers respond with enabling policies to account for externalities using a pro-technology, light touch approach.
THE DOMINANT TOOLS FOR ACTION IN A MODERN JAZZ WORLD ARE:
• Societal values
• Enabling policies
• New business models

THE GRAND TRANSITION
35
2.2.1.1 Societal ValuesA class of technology savvy, well-connected city dwellers comprise the global elite who push for economic policies that favour liberalisation, reduced barriers to market entry, and tax reforms. As the world’s elite increasingly come from a diverse geographical context, they are also heavily influenced by a set of values that support the spread of freedom, societal wellbeing, transparency, economic opportunity and environmental sustainability. Many are willing to opt for ‘green energy’ through their utility company, but those who can, prefer to own and operate their own clean energy systems. As a result, demand for clean energy solutions grows throughout the period. Households scale-up their investments in roof-top solar, wind and storage solutions. Community micro-grids with integrated EV charging are increasingly common.
Lifestyles are heavily technology dependent on smart phones and other digital gadgets that help people better manage energy use. These include access to Smart Meters, digitally enabled heating, ventilation and air conditioning (HVAC), and appliances that allow people to time their activities.
2.2.1.2 Enabling PoliciesPolicymakers in all regions struggle to keep up with rapidly evolving markets and business models, making it very challenging to establish robust governance frameworks on a national or global scale. Policy is characterised by rapidly changing loyalties and coalitions as new political movements quickly come and go and media become decisive opinion leaders.
National governments respond to pressure from global elites on macro-economic policies and address the biggest national challenges through emerging technologies and industry partnerships. Examples of government policies include:
• Liberalisation of gas and electricity markets
• Emissions-reduction requirements that adjust along with technology deployment
• Light-touch tax schemes for emissions and subsidy schemes for renewables
• Reductions in fossil fuel subsidies
• Industry-led RD&D and innovation supported by government partnerships
• Open borders, liberalised trade, and high global economic cooperation
2.2.1.3 New Business ModelsShifting demand centres and new technologies create rich new market opportunities, but also help to enable new market entrants that challenge traditional industry giants. Change also occurs very rapidly. As early as 2025, the majority of consumption takes place in developing economies and consumer needs and behaviours are increasingly diverse.
Leading companies adapt quickly and respond first to evolving consumer demands with more flexible and cost-effective business models. Multi-national companies with international supply chains are best positioned to bring goods and services to the world’s growing middle class. Those that target growth across regions and business lines diversify risk and reach more markets.
Reputational risk is also important as consumers demand more transparent supply chains and higher quality of service. Companies are benchmarked and rated through a variety of channels, forcing them to emphasize their core strengths and capabilities and shift to cloud-based services and new models for service delivery that heavily depend on technology to stay competitive. Core business operations and non-core-functions are enhanced via innovative partnerships, transitional business models, and digital tools, from robotic and cognitive process automation to new data and analytics enabled by the Internet of Things.

36
WORLD ENERGY COUNCIL | SCENARIOS
Figure 11: Modern Jazz % GDP Growth from 2014 to 2060
7.4%
SSA
6.2%
India
4.3%
China
4.1%
MENA
3.8%
APAC
3.3%
World
3.3%
LAC
2.0%
US
1.8%
EU31
1.8%
Russia
Figure 10: Modern Jazz Digital Disruption of Incumbent Organizations Across all Industry Sectors (logos)
Incu
mbe
nts
Disr
upto
rs
Transport Automotive Sector Shopping Hotels Banking Music
industryMobile
Communication
FIGURE 10: MODERN JAZZ DIGITAL DISRUPTION OF INCUMBENT ORGANIZATIONS ACROSS ALL INDUSTRY SECTORS
FIGURE 11: MODERN JAZZ GDP GROWTH % P.A. (2014-60)
Source: The World Energy Council and Accenture Strategy
Source: IMF, IEA, Total Economy Database, The World Energy Council, Paul Scherrer Institute, Accenture Strategy
2.2.2 PRODUCTIVITY AND ECONOMIC GROWTHA combination of factors boost productivity and economic growth in Modern Jazz. Open economies make possible global competition and growth in new geographies. The combinatorial effects of digital and technology innovation accelerate the pace of change. This ‘digital economy’ brings revolutionary change in many industries and helps upskill the workforce. Rapid change is the norm across energy, consumer goods, and manufacturing. The result is strong economic growth that averages 3.3% p.a. from 2014 to 2060. Figure 11 summarises the distribution of GDP Growth (Constant 2010 USD Market Exchange Rates (MER) from 2014 to 2060 across a selected set of regions.
THE DOMINANT DRIVERS OF ECONOMIC GROWTH IN A MODERN JAZZ WORLD ARE:
• Open economies
• Digital economies

THE GRAND TRANSITION
37
2.2.2.1 Open EconomiesWith the global elite supporting free-market policies and flagging economic growth in several regions, many nations agree to reductions in trade and migration barriers in an attempt to stimulate growth. For most, open economies grow more steadily, and globalisation boosts efficiency and productivity. Technology transfer enables developing economies to catch up more quickly. Ageing economies also benefit from a labour boost as a result of migration reform. In both developed and developing regions, wage disparity and income inequity grow as industries demand new skills from labourers and move operations to low-cost labour centres. This is mitigated to an extent by growing energy access and the rise of service economies.
2.2.2.2 Digital EconomyThe digital economy becomes the single most important driver of innovation, competitiveness and growth, and it creates huge potential for entrepreneurs and enterprises of all sizes. In particular, the number of small and medium-sized enterprises surges as consumer demands diversify, niche markets grow, and barriers to entry fall.
The digital economy boosts productivity by creating new markets, streamlining business operations, creating new skillsets in the workforce, and fostering new ways of interacting with consumers. Table 4 illustrates the potential ‘digital boost’ to 2020 GDP for a selected set of countries. The increased use of digital technology could add as much as US$1.36 trillion to the GDP of the world’s top 10 economies in 2020. That is 2.3% more than baseline forecasts for 2020 GDP22.
By 2030, the world has partially achieved its potential digital boost through the interplay of digital technologies, open economies and technology innovation. The economic momentum created by this boost is powerful and results in a sustained benefit to labour productivity and technology innovation through 2060.
Country Change to 2020 GDP (%)
Australia 2.4%
China 3.7%
France 3.1%
Germany 2.5%
Italy 4.2%
Country Change to 2020 GDP (%)
Japan 3.3%
Netherlands 1.6%
Spain 3.2%
United Kingdom 2.5%
United States 2.1%
Source: Accenture Strategy, 2015: Digital Density Index – Guiding digital transformation
TABLE 4: POTENTIAL BOOST TO GDP OF DIGITAL TECHNOLOGIES
22 Accenture Strategy, 2015: Digital Density Index – Guiding digital transformation

38
WORLD ENERGY COUNCIL | SCENARIOS
2.2.2.2.1 Labour productivityDigital technologies enable the rapid upskilling of labour and change the way people work. Open access to self-education makes it possible for anyone with a computer to keep their skills upgraded and to learn new skills quickly.
The deployment of automation and augmentation technologies such as intelligent machines dramatically shifts management roles and recasts the workforce of the future. While in many cases, automation does replace labour, many businesses find ways to ensure that automation also complements labour, raising economic outputs in ways that often lead to higher demand for workers.
High-skilled labour increasingly requires analytical reasoning, digital know-how and business acumen. In natural resources and other capital-intensive industries, people managing pipes, wires and other infrastructure increasingly interact with digital technology to monitor infrastructure and improve the system’s overall resilience.
2.2.2.2.2 Technology DisruptionBeyond 2030, funding from venture capitalists, crowd-funding and other private investors enables continued breakthrough technological research that creates new markets and reshapes traditional economic models. Competition comes from all over, with entrepreneurs who are free to engage in the process of creative destruction continually offering consumers new goods and services. The combinatorial effects of new technologies and market access create significant disruption across all industries. These trends drive strong investments in physical and digital infrastructure and force continuous transition in business models to remain profitable in a highly complex and competitive market.
The benefits to the global economy are substantial. For example, technologies such as 3-D printing and predictive analytics create efficiencies and disrupt the carbon intensity and geographic positioning of global manufacturing. Physical infrastructure also becomes more resilient as asset owners use data and algorithms to manage risks and anticipate failures.
Table 5 provides some examples of the signals seen across industries of emerging technology disruption.
Signals Examples
Automation of work Investments in artificial intelligence start-ups by venture capitalists have increased roughly 20x in the past four years
Predictable disruption 82% of executives say industry boundaries are being erased and new paradigms are emerging for every industry
Technology-enabled business models Amazon, Google, and Alibaba have had tremendous success with the technology platforms they have built to support their businesses as well as with the business models these platforms help to enable
TABLE 5: SIGNALS OF TECHNOLOGY DISRUPTION
Source: Accenture Strategy

THE GRAND TRANSITION
39
2.2.3 INTERNATIONAL GOVERNANCEWith rapid economic growth driven shaped by open economies and digital technologies, the international governance system is shaped by complex globalisation, shifts in economic dominance and a rise in global connections.
2.2.3.1 Complex GlobalisationIn a highly globalised and technology-driven world, people, goods, and money flow more rapidly than ever before across borders. Political power is increasingly diffused across nation states, local governments, industry and voters, who are not always prepared for the growing exposure to systemic risks created by an increasingly connected world. Table 6 exemplifies the systemic risks created by complex globalisation.
THE INTERNATIONAL GOVERNANCE SYSTEM IS SHAPED BY:
• Complex globalisation
• Regional transitions
Systemic Risks
Growing inequality (internal) Financial volatility Arms trafficking
Climate impacts Religious/ethnic violence Contagious diseases
Violent Terrorism Illegal migration Cyber terrorism
TABLE 6: EXAMPLES OF SYSTEMIC RISKS CREATED BY FAST-PACED GLOBALISATION
Regions with more mature political systems fare better in addressing these challenges. But the world is so connected that issues in less-mature regions spread quickly to more-robust economies. Economic and social connectivity make the public, industry, and policy leaders more supportive of global cooperation. This fosters innovative partnerships and interest from a variety of stakeholders. For example, efforts to boost access to education and health and promote RD&D in clean energy solutions increasingly involve new technologies and partnerships across global institutions, governments, industry and private investors from all over the world.
2.2.3.2 Regional TransitionsWith strong global economic growth, the rise of Asia and the decline of the OECD continue. The global migrant crisis and fragmentation in EUR bring new attention to the Middle East. The world is committed to ensuring there is a peaceful end to the wars in Syria and Iraq. Agreements between Russia, the US and NATO promote better coordination of military roles in the region and allow regional leaders to bring stability through economic and socially focused rebuilding efforts that increase employment and economic development.

40
WORLD ENERGY COUNCIL | SCENARIOS
By 2035, Asia has become the dominant economic region. China is the number-one economy in the world, the largest global manufacturer and is in transition to consumption—and services-led growth. India rises as the world’s most populous country and the third-largest economy. Asian middle-class consumption reflects two-thirds of the global market. Global financial institutions such as the WTO, IMF and World Bank are increasingly pressured to reform and better represent the diversifying global economic landscape.
By 2040, rising wages and labour costs in China and other Asian countries encourage investors to increasingly look to Africa, where wages are still relatively low. As the population of SSA surpasses the population of India, investor support from all over the world helps move the region from less technologically intensive production to capital-intensive manufacturing production as industrial activity spreads to meet growing consumer demand.
Meanwhile, the economies of EUR, Japan, and Russia continue their slow relative declines. In 2060, the US and EUR remain dominant actors, but their influence over the shape of the global economic system has declined along with the relevance of global institutions. Financing has evolved into a complex, de-centralised system as development banks, venture capitalists, industry, national and local governments collaborate to fund fit-for-purpose infrastructure projects.
Russia, the Middle East and Latin America (LAC) continue to play an important role as global suppliers of energy throughout the period, with the Middle East and North Africa (MENA) leading the way. New competition emerges from NAM but supplies hit their peaks in 2030. In all three regions, employment and economic diversification become higher priorities as demand for energy, and in particular oil, begins to slow in the second half of the period.
2.2.4 CLIMATE CHALLENGETechnology support for lower-carbon technologies varies broadly across regions; however, on a global level, there is consensus on the importance of making renewable energy sources more reliable and more widely affordable and economically competitive on an economic basis. Industry-led RD&D drives down the cost of technologies, which in turn spurs a rapid increase in new technology adoption. Additionally, continued policy support for renewable energy projects creates fiscally attractive terms for utility companies.
THE DRIVERS OF ECONOMIC DE-CARBONISATION IN A MODERN JAZZ WORLD ARE:
• Technology adoption
• Technology support

THE GRAND TRANSITION
41
Carbon intensity of GDP falls at an historically unprecedented rate of 2.8% p.a. from 2014 to 2030 and accelerates to a decline of 4.5% p.a. from 2030 to 2060, but it is not enough to counteract the upward pressure on emissions from sustained high economic growth. GDP growth drives carbon emissions to grow at a pace of 0.7% p.a. before peaking in 2030. Beyond 2030, accelerated carbon intensity reductions drive emissions to decline at 1.4% p.a. to 2060. The world exceeds the 1000 Gt CO₂ IPCC carbon budget for 2°C between 2040 and 2060 and in 2060, the world is on track for 3°C of global warming in 2100.
Figure 12 summarises the reductions in carbon intensity from 2014 to 2060, benchmarking performance against a simplified analysis of the carbon intensity reductions needed to stay below the IPCC’s 2°C target.
2.2.4.1 Technology AdoptionChanges in consumer preferences for technology affect both the energy intensity of GDP and the carbon intensity of primary energy. The biggest impacts are in power and transport systems, where the adoption of EV and smarter buildings, homes and offices boost energy efficiency. Growing investments in natural gas power generation and rapid deployment of both utility-scale and de-centralised renewables lead to substantial de-carbonisation of energy systems. The implications of this change are explored in more detail in later sections. The most disruptive technology trends are outlined in Table 5.
Systemic Risks Technology Adoption
Transport • EV penetration in transport
• Biofuels penetration in transport
• Natural gas transport in heavy freight and marine
Industry and Power • Natural gas penetration in power and industry
• Concentrated Solar, PV and storage solutions
• Electrification of processes and heating
Commercial and Residential • Connected homes, offices and commercial spaces that are more energy efficient
• Distributed energy systems
• Electrification of heating and cooking
Non-energy use • Natural gas as a chemical feedstock
TABLE 5: DISRUPTIVE TECHNOLOGY ADOPTION BY SECTOR
Figure 12: Modern Jazz Reductions in Carbon Intensity of GDP % p.a. (2014 – 2060)
2.8%
2014-30
4.5%
2030-60
3.9%
2014-60
6.0%
2014-60
Modern Jazz
Source: World Energy Council, Paul Scherrer Institute, Accenture Strategy Analysis
2DS
Source: The World Energy Council, Paul Scherrer Institute, Accenture Strategy
FIGURE 12: MODERN JAZZ REDUCTIONS IN CARBON INTENSITY OF GDP % P.A. (2014– 60)
Source: The World Energy Council, Paul Scherrer Institute, Accenture Strategy

42
WORLD ENERGY COUNCIL | SCENARIOS
The degree to which these trends unfold across regions varies. In Africa and India, for example, distributed energy systems electrify communities currently living off the grid and lead to economic transitions that skip carbon-intensive phases of development. In EUR and NAM, natural gas and EV adoption shift the carbon profile of transport. The decarbonisation of power is driven by switching from coal to gas, as well as the continued deployment of solar and wind technologies to 2060.
2.2.4.2 Technology SupportLight-touch policy support is the underlying driver for the shifts in technology adoption in developed and developing regions. Many of the OECD countries and industrialised nations continue current levels of national subsidy and taxation schemes for renewables and implement planned policies. Governments also collaborate with industry to direct capital to primary research. By 2030, high energy consumption regions start to see a growing number of carbon trading schemes with meaningful carbon prices based on national and local initiatives. These prices are passed through to customers who are increasingly aware of the carbon footprint of goods and services. For example, consumers see the cost of carbon associated with filling their tank with gasoline, right on the pump; and energy-intensive industry sees the cost of carbon clearly on their energy bill. Growing trade and economic connectedness help spread the cost of carbon around the globe, based on consumption patterns.
With a stimulus for investment in cleaner energy solutions that penalises emissions but avoids sudden economic disruption, markets schemes mature and economists can better quantify the economic value of avoiding emissions and the cost of implementing alternative energy solutions. The outcome is collaboration between national and local governments with utility companies to evolve taxation schemes, credits, subsidies and other incentives that support energy efficiency, encourage the use of renewable energy sources, and support efforts to conserve energy and lessen pollution.
2.2.5 IMPLICATIONS FOR ENERGYThe implications for energy of a Modern Jazz world are summarised in Table 7 and explored in further detail in the following sections.
Energy Implications Modern Jazz
Energy Demand • Lifestyles and economies demand more energy
• Efficiency gains keep consumption growth moderate
Market Structures • Liquid markets
• Rise of distributed energy
• Rise of LNG trade
Primary Energy Supply • Consumer-driven penetration of renewables
• Rise of gas
TABLE 7: MODERN JAZZ IMPLICATIONS FOR ENERGY

THE GRAND TRANSITION
43
2.2.5.1 Energy Demand2.2.5.1.1 Final Energy ConsumptionTotal Final Energy Consumption (TFC) grows 25% from 2014 to 2030, averaging 1.4% p.a. growth in the period. Upward pressure on consumption growth is largely driven by a rise in industrial activity, growing transport demand and an increase in energy access, which raises residential and commercial consumption. Technology developments that disrupt traditional energy systems boost efficiency. For example, advanced manufacturing such as 3-D printing reduces demand for transport. Smarter consumers and lifestyles that include EVs, more telecommuting, more efficient appliances, and connected homes and offices increase energy use efficiency as well. As a result, final consumption begins to slow drastically beyond 2030, slowing to 0.3% p.a. and settling at 12,947Mtoe in 2060. This is just 38% higher than 2014 consumption.
2.2.5.1.1.1 IndustryHigh economic productivity and growth leads to demand for heavy—and light-industry goods globally. In turn, this spurs long-term growth in industrial sector delivered energy, most of which occurs outside of NAM and EUR. Industrial demand for energy grows at a rate of 2.0% p.a. from 2014 to 2030. Beyond 2030, demand slows drastically to 0.3% p.a. as industrialised economies shift to service-led growth. Industrial activity also becomes increasingly efficient through a transition to gas and renewables for power, and through the electrification of processes and heating.
2.2.5.1.1.2 TransportRapid economic growth, open economies and freedom of mobility translate into high volumes of air traffic, freight and car-ownership. As a result, energy in transport grows at 1.2% p.a. from 2014 to 2030, before slowing to just 0.2% p.a. in the second half of the period.
Source: The World Energy Council, Paul Scherrer Institute, Accenture Strategy
Figure 13: Modern Jazz Total Final Consumption of Energy by Sector (MTOE) % Share
2014
29%
9%34%
28%
9,395MTOE
32%
10%31%
27%
2030
11,714MTOE
32%
11%31%
26%
2060
12,947MTOE
Non Energy UseResidential/Commercial TransportIndustry
FIGURE 13: MODERN JAZZ TOTAL FINAL CONSUMPTION OF ENERGY BY SECTOR

44
WORLD ENERGY COUNCIL | SCENARIOS
Demand for petroleum-based transport fuels grows at a rate of 1.0% p.a. to 2030, but demand declines at a rate of 0.5% p.a. beyond 2030 as transport fuels diversification accelerates. Growing incomes, new product and service offerings and consumer preferences heavily influence the trajectory of the light-duty vehicle fleet, which grows 2.7 times in the period to 2060, reaching 1.6bn units in 2030 and 3.0bn units in 2060.
EVs, supported by technology breakthroughs in battery technology, growing availability of distributed systems that accommodate EV charging, and continued penetration of pure-play EV manufacturers like Tesla that stimulate infrastructure projects, underpin the growth of electricity in transport. Traditional manufacturers such as Ford, GM, BMW, Nissan Volkswagen and Toyota continue to evolve their product offerings to remain competitive. By 2030, there are more than 63mn EV and hybrid EV globally. By 2060, this number rises to more than 800mn, which reflects 26% of the light-duty vehicle fleet. Hybrid petroleum vehicles account for another 29% share of the fleet. As a result, electricity in transport grows from a 1.3% share of transport fuels in 2014 to a 2.2% share in 2030 and an 8.1% share in 2060.
Diversification is also driven by biofuels, which grow more than 7.3 times from 2014 to 2060 in terms of energy units. Growth is accelerated in the second half of the period due to advances in second—and later third-generation biomass technologies developed in LAC and Asia. By 2060, biofuels capture almost 16% of transport fuel demand, up from just 2.8% in 2014 and 4.9% in 2030.
In heavy-duty freight and marine transport, concerns about the volatility of crude prices, an abundance of cheap and flexible natural gas supplies, and regional emissions standards lead to demand for CNG and LNG technology penetration. This drives natural gas shares to reach 6.5% of transport fuels by 2060. Figure 14 summarises the fuel transition in transport from 2014 to 2060.
Source: The World Energy Council, Paul Scherrer Institute, Accenture Strategy
Figure 14: Modern Jazz Transport by Fuel Source (MTOE) in Modern Jazz
2,619MTOE
3,179MTOE
3,423MTOE
2060
4% 3% 1% 92%
2014 2030
Oil Gas Biofuels Electricity Hydrogen
3% 5% 2% 90% 16%7% 8% 2% 67%
FIGURE 14: MODERN JAZZ SHARE OF FUELS IN TRANSPORT (% SHARE)

THE GRAND TRANSITION
45
2.2.5.1.1.3 Residential and CommercialWhile many people in developed regions are living in smaller homes, buying fewer and smaller vehicles, others are buying bigger homes and cars, and everyone is buying more devices to stay connected. This creates upward pressure on residential and commercial energy consumption. However, the growing availability of Smart Grids, Smart Meters, and Smart Appliances gives consumers more information and autonomy to do more with less energy and quantifies the value of investments such as LED lighting, better insulation and electric heating. As a result, residential and commercial energy demand use grows at a moderated pace of 0.8% p.a. to 2030. Beyond 2030, continued efficiency gains drive growth to slow to 0.3% p.a.
2.2.5.1.1.4 Non Energy UseDemand for fuels in non-energy use, or the use of energy as a raw input material into a process where it is not consumed as a fuel, or transformed into another fuel, grows at a pace of 1.9% p.a. from 2014 to 2030. This is driven by demand for chemicals from emerging markets such as China and India. From 2030 to 2060, as China’s and India’s economies mature, growth moderates to 0.9% p.a.
2.2.5.2 ElectricityWith improvements in quality of life, increasing technology, and rapid economic growth, lifestyles demand more electricity. Additionally, a push for efficiency drives rapid electrification of energy systems. By 2030, the electrification of the final consumption rises to 20%, up from 18% in 2014. Growth in demand for electricity averages 1.9% p.a. to 2030. New generation is dominated by natural gas, which accounts for 43% of generation growth to 2030. Wind and solar encompass 31% of new generation. Beyond 2030, demand for electricity continues to climb at a rate of 1.4% p.a. to 2060. By then, electricity generation has grown 2.0 times since 2014 and the electrification of final energy consumption has reached 28%. Wind and solar generation reflect 30% of total electricity generation.
Source: The World Energy Council, Paul Scherrer Institute, Accenture Strategy
Coal Coal with CCS Oil Gas Gas with CCS Non-Fossil
Geothermal Solar Wind Nuclear Hydro Biomass Biomass with CCS
Figure 15: Modern Jazz Electricity Generation (TWh) % Share by Resource
2014 2060
23,816TWh
48,491TWh
16%11%3% 2%
2030
32,171TWh
15%10%8%4% 3% 14%10%18%12% 5%
41% 4% 22% 33% 28% 2% 29% 41% 6% 22% 10% 60%
FIGURE 15: MODERN JAZZ ELECTRICITY GENERATION TWH % SHARE BY FUEL TYPE

46
WORLD ENERGY COUNCIL | SCENARIOS
2.2.5.2.1 Distributed systems Growing electricity demand, falling technology costs, increasing penetration of new market entrants, and new innovative financing models lead to continued momentum for distributed energy systems. The implications for utilities are substantial. The increasingly favourable economics of renewables and back-up systems reduce load, change operational complexity and reliability, erode revenues and earnings, and accelerate the pace of change overall. Figure 16 summarizes the interplay of driving forces leading to disruption by distributed energy generation.
Source: Accenture Strategy
Figure 16: Modern Jazz Cause and E�ect of Distributed Energy Systems
Implications for utlities• Reduction in load • Increasing operational complexity • Drop in revenues and earnings
Falling Technology Costs
Moderate rise in electricity prices
Shiftng Consumer Preferences
Presence of new market entrants facilitating adoption
Policy driven acceleration of trends
FIGURE 16: MODERN JAZZ CAUSE AND EFFECT OF DISTRIBUTED ENERGY SYSTEMS
In EUR and NAM, a variety of factors boost demand for renewable energy and micro-grids from residential, industrial and commercial consumers such as universities and the military. These range from shifting consumer sentiment on environmental issues to a growing desire for back-up options in the case of climate events, natural catastrophes or cyber security breaches.
In developing regions such as India and SSA, where population and economic growth drive heightened demand for electrification, modular systems that generate power close to where it is used provide new opportunities for electrifying rural regions. Distributed systems include stand-alone, as well as community mini-grids, which may be off-grid or grid connected.
With access to electricity, modern lifestyles and business activity emerge, leading to economic growth. Leapfrogging to distributed energy systems also enables economic development to occur at much lower rates of energy and carbon intensity than OECD countries. Beyond 2030, sustained economic growth and a rapid pace of development facilitate the re-integration of modular systems into centralised grid systems.

THE GRAND TRANSITION
47
2.2.5.2.2 Business Models The traditional utility model, driven by big multi-national companies, comes under pressure as increasing demand for distributed energy systems reshapes how the industry interacts with consumers. In particular, new energy technologies, non-traditional competitors, new consumer expectations, new regulatory pressures and rising costs all create substantial challenges. In response to these threats, many utilities rethink their business models in hopes of improving prospects for future growth.
Source: Accenture Strategy, 2016: Power play: Three new models for growth in the utilities industry
POWER PLAY: THREE NEW MODELS FOR GROWTH IN THE UTILITIES INDUSTRY
The following case study explores three emerging business models that utilities can pursue to unlock future growth in a world with increasingly distributed energy systems. Each model—supported by digital capabilities that provide new opportunities for growth, profitability and customer engagement—reflects a perspective on how companies might evolve to address emerging challenges in electricity markets. As no single model will work for all utility companies, and the options outlined are not mutually exclusive, organisations should consider the merits of each as they make business portfolio decisions.
Low-Carbon Energy ProducerAs society demands cleaner energy solutions and economics make it easier for new market entrants to respond to demand, a low-carbon energy utility-scale model emerges in both regulated and deregulated markets. The traditional power providers that survive the transition considerably shift their portfolios to non-fossil fuel generation assets. Some utilities are already making moves in this direction. In Germany, EON SE is spinning off its conventional and nuclear power generation businesses into a separate company—Uniper—to refocus its business on renewables, distribution networks and consumer solutions. RWE is also spinning off a new renewable subsidiary.
Distribution Platform OptimizerThe smart grid operators of today evolve to a distribution platform optimizer model. This model emphasises choosing the appropriate sources and operating practices to meet demand while providing access to third parties, encouraging adoption of interconnect standards, and accelerating interactive demand management practices. The evolution to this model helps to enable an industry shift from an ‘obligation to serve’ to a ‘commitment to optimize’ model and empowers utilities to serve as energy clearinghouses that deliver the optimal sources of supply to meet consumer demand. Some utilities are pursuing elements of this model already. For example, pilot projects are demonstrating the use of digital devices and battery storage to reduce system risks and integrate renewables on the network, or are using EVs as storage solutions. Technology breakthroughs in this area will lead the way for the transformation of distribution company operations.
Energy Solution IntegratorResidential, commercial and industrial consumers demand access to distributed systems such as micro-grids and solar-storage solutions as well as innovative digital solutions to help them efficiently manage energy in their homes and businesses. An energy solution integrator model emerges to give customers competitive choices across a variety of evolving service categories including solar products and monitoring and control solutions, as well as support for EVs. Utilities adopting this model grow by achieving greater scale and offering a broader scope of services across an extended geographic footprint. British Gas’s heating control service, dubbed Hive Active Heating™, allows customers to change their thermostat and hot water settings via a tablet, laptop or mobile device.

48
WORLD ENERGY COUNCIL | SCENARIOS
2.2.5.3 Primary EnergyTotal primary energy supply (TPES) grows at a rate of 1.0% p.a. from 2014 to 2030, reaching 16,085 MTOE. Disruption across demand sectors and the penetration of renewable energy sources in power drives down the share of fossil fuels to 79% of primary energy in the period. Energy supplies grow more slowly from 2030 to 2060, and the diversification of the primary energy mix accelerates. By 2060, TPES is 25% higher than it was in 2014, reaching 17,013 MTOE. The energy mix has shifted substantially and fossil fuel share of primary energy has fallen to 63%.
Source: The World Energy Council, Paul Scherrer Institute, Accenture Strategy
Figure 17: Modern Jazz Primary Energy Supply (MTOE) % Share (Graphs)
Source: World Energy Council, Paul Scherrer Institute, Accenture Strategy Analysis
10%3%5%1%
13,652MTOE
10%3%5%3%
16,085MTOE
16%3%8%10%
17,013MTOE
Other Renewables Nuclear Hydro BiomassCoal Oil Gas Non-Fossil
Non-Fossil Fuels Non-Fossil Fuels Non-Fossil Fuels
29% 21% 31% 19% 23% 24% 32% 21% 11% 29% 23% 37%
FIGURE 17: MODERN JAZZ PRIMARY ENERGY SUPPLY (MTOE) % SHARE
Although higher economic growth and abundant and cheap energy supplies drive TPES to increase, the world makes significant strides in reducing primary energy intensity of GDP. Many of the industrialised economies of today make the transition to consumption—and service-led growth. Technologies also make industrial activity more efficient, while growing penetration of renewables help to enable more efficient conversion. As a result, the decline of global energy intensity is 72% from 2014 to 2060, averaging 2.7% p.a. Globalisation and technology transfer also lead to a tight convergence of energy intensities across regions.
Source: The World Energy Council, Paul Scherrer Institute, Accenture Strategy
Figure 18: Modern Jazz Change in Primary Energy Intensity % p.a. (2014–60)
-5.1%
SSA
-4.0%
India
-3.8%
China
-3.4%
MENA
-2.8%
APAC
-2.7%
World
-2.6%
US
-2.5%
EEUR
-2.2%
EU31
-1.8%
LAC
Source: World Energy Council, Paul Scherrer Institute, Accenture Strategy Analysis
FIGURE 18: MODERN JAZZ CHANGE IN PRIMARY ENERGY INTENSITY % P.A. (2014–60)

THE GRAND TRANSITION
49
Source: The World Energy Council, Paul Scherrer Institute, Accenture Strategy
Figure 19: Modern Jazz Coal in TPES by Region (MTOE) % Share
3,902MTOE
2014
3,636MTOE
2030
1,832MTOE
2060
China India EUR LAC MENA NAM Other asia SSA
12%
11% 10%
52%11% 3% 8%
8% 18% 26%
53%10% 2% 3%8% 51%7% 5%
FIGURE 19: MODERN JAZZ COAL IN TPES BY REGION (MTOE) % SHARE
2.2.5.3.1 Coal Despite high economic growth and growing energy demand, especially in developing nations, the role of coal in primary energy declines at a pace of 0.4% p.a. from 2014 to 2030. Declines are seen all over the world except for India, where 288 MTOE of coal are added to the primary energy supply in the period. Growth in India is offset by declines of 350 MTOE in NAM and EUR, where coal peaks before 2020.
Coal peaks in 2020 in China at 2,080 MTOE, and declines at a rate of 2.4% from 2020 to 2060. By 2060, coal has declined by more than 1,000 MTOE in Chinese primary energy. This, coupled with continued declines in NAM, EUR and the rest of Asia, lead to a global coal decline of 2.3% p.a. from 2030 to 2060. The world settles at about 1,832 MTOE of coal in TPES in 2060. In India, where coal in primary energy peaks at 692 MTOE in 2040, coal settles at 462 MTOE in 2060. Figure 19, summarises the regional allocation of coal in global TPES in 2014, 2030 and 2060.
Coal production is dominated by China and India throughout the period, with China maintaining its position as the number-one producer of coal globally. Still, India makes significant strides, adding 400 MTOE of production from 2014 to 2060.
2.2.5.3.2 GasThe period begins with a growing diversity of fossil fuel suppliers and consumers, particularly in natural gas. Growing exports of Australian and US LNG create competition across regional gas markets, facilitating the emergence of new pricing mechanisms for gas and diffusing the power of OPEC and Russia. Markets are liquid and short-term trade continues to grow. Consumers increasingly see natural gas as a low-cost and cleaner source of power and transportation. In resource-rich regions, natural gas increasingly takes share from coal and fuel oil in power generation and as a feedstock for chemicals.
Favourable conditions lead gas in primary energy to grow at a rate of 1.9% p.a. from 2014 to 2030. Asia accounts for 49% of that growth. In China, demand grows in industrial power use and transportation. Pacific Asia (APAC) and India also see growth in power, commercial, residential and non-energy use. Outside of Asia, NAM, LAC and MENA drive growth, reflecting 25%, 7% and 4%, respectively, of global growth of gas in TPES to 2030.

50
WORLD ENERGY COUNCIL | SCENARIOS
Source: The World Energy Council, Paul Scherrer Institute, Accenture Strategy
Figure 20: Modern Jazz Gas in TPES by Region (MTOE) % Share
2,891MTOE
3,927MTOE
4,968MTOE
China India EUR LAC MENA NAM Other asia SSA
28%17% 5% 24%19% 8% 3% 8%19% 6% 14%
27% 16% 5% 26% 13% 6% 16% 11% 8% 18%
2014 2030 2060
FIGURE 20: MODERN JAZZ GAS IN TPES BY REGION (MTOE) % SHARE
Beyond 2030, China and India account for more than 50% of growth in gas consumption, with their combined primary gas demand totalling over 1,100 MTOE in 2060. Natural gas in TPES grows at 5.7% p.a. in SSA in the second half of the period, reaching 313 MTOE and driving 20% of global gas growth from 2030 to 2060. Figure 20, summarises the regional allocation of gas in global TPES in 2014, 2030 and 2060.
To 2030, MENA gas supplies grow fastest to meet demand, followed by the US and APAC. Beyond 2030, MENA dominates supply additions, reflecting 37% of growth from 2030 to 2060 and reaching 1,289 MTOE of gas production. Other Asia and China follow, reflecting 17% and 16% of growth respectively. SSA refects 11% of supply growth, which is mostly used to meet domestic demand.
RD&D and gas exploration lead to continued rapid growth of unconventional gas supplies driven by the US, Canada, Australia, Argentina, and China. Saudi Arabia joins the fray before 2030. Unconventional gas production continues to grow to 2040 peaking at just under 1,200 MTOE, and reaching 26% of total natural gas supplies in the same year. Beyond 2040, unconventional gas production declines rapidly, settling at 323 MTOE in 2060.
2.2.5.3.3 OilThe market re-balances in the face of lower oil prices via higher demand and lower supply. With the OPEC holding production levels and non-OPEC supply costs coming down, oil prices settle at an affordable equilibrium. This leads to growth of oil in TPES through 2030 at a pace of 1.1% p.a. By then, China has added 8.2 mb/d of consumption and India has added 3.6 mb/d. The transport and petrochemical sectors are the main drivers of growth, with demand for oil in aviation growing at the fastest pace to 2030.
Growth is tempered by increased competition from alternative transport fuels, which result in a move away from gasoline and diesel in light—and heavy-duty transport. This trend leads to a peak in oil in TPES in 2030 at 103 mb/d. The decline occurs rapidly to 2040 and speeds up as population and economic growth slow, averaging 0.9% p.a. from 2030 to 2060. Oil in TPES settles at 80 mb/d in 2060.
Figure 21 summarises the regional allocation of oil in global TPES in 2014, 2030 and 2060.

THE GRAND TRANSITION
51
Source: The World Energy Council, Paul Scherrer Institute, Accenture Strategy
2030 2060
Figure 21: Modern Jazz Oil in TPES By Region (mb/d) % Share
86mb/d
103mb/d
80mb/d
2014
China India EUR LAC MENA NAM Other asia SSA
18% 4%2% 13% 16% 7%3% 18% 18% 12%10% 15%
24% 11% 8% 20% 22% 10% 8% 16% 13% 12% 8% 12%
FIGURE 21: MODERN JAZZ OIL IN TPES BY REGION (MB/D) % SHARE
As the lowest-cost supplier, the MENA region is able to boost production from 29 mb/d in 2014 to 36 mb/d in 2030. However, a lower-price climate creates challenges for funding the needed upstream investments to sustain production growth in the second half of the period. As a result, in 2060, MENA production settles at 39 mb/d.
Oil production also climbs upward, in NAM and LAC, driven by unconventional liquids production. US light tight oil (LTO) leads production growth to 2030, with Argentina ramping up production beyond 2020. By 2030, production of unconventional oil reflects 14% of total oil production and totals 15 mb/d. Production peaks in 2040 at 16 mb/d as oil demand continues to fall. The decline is relatively steep, and by 2060, unconventional oil volumes have fallen back to 5 mb/d.
2.2.5.3.4 Non-Fossil FuelsThe growing use of non-fossil fuels in power and transport increases non-fossil fuels’ share of the primary energy mix. From 2014 to 2060, supply grows at 1.9% p.a., reflecting a 21% share of TPES in 2030 and a 37% share in 2060. The largest growth is in wind and solar, classified below as Other Renewables.
2.2.5.3.4.1 BiomassThe use of biomass as a fuel source rises 1.9 times in the period from 2014 to 2060, going from 1,408 MTOE in 2014 to 2,671 MTOE in 2060. Substantial pull comes from both transport and power demand. From 2014 to 2030, LAC leads the way in terms of biomass in TPES in both transport and power, driven by plentiful feedstocks that are available at low cost. EUR and SSA also see a substantial increase in biofuels supply for transport.
Beyond 2030, second-generation biomass technologies become commercially viable, led by Brazilian and Chinese technology innovation. This results in a rapid increase in biomass consumption globally to 2060. LAC sees the largest growth in biomass to 2060, followed by EUR, LAC, India and NAM. Demand growth favours supplier regions in Asia, Latin America and Africa, where the development of new technologies and export infrastructure make biomass exports to EUR and the US practical. Figure 14 presents a view of biofuels’ growth in transport to 2060, and Figure 15 contains a summary of biomass growth in electricity generation to 2060.

52
WORLD ENERGY COUNCIL | SCENARIOS
2.2.5.3.4.2 HydroThe share of hydro in primary energy remains relatively flat, yet hydro as a fuel source in TPES grows at a rate of 1.3% p.a. to 2030. Global hydro generation grows from 3,895 TWh in 2014 to 4,816 TWh in 2030. Global installed capacity of hydro rises to 1,388 GW. Growth is led by China, where capacity reaches 383 GW. Beyond 2030, the growth of hydro in TPES slows to 1.0% p.a., with newest capacity installed in Central Asia, China, LAC and SSA. By 2060, hydro generation has reached 6,558 TWh. Global installed capacity has grown to 1,858 GW. Chinese installed capacity has reached 492 GW, followed by LAC and India, where hydro capacity rises to 260 GW and 166 GW, respectively. Figure 15 summarises the role of hydro in electricity generation to 2060. With increasing investment in wind and solar, hydro represents dependable capacity, but must compete with gas generation.
2.2.5.3.4.3 NuclearNuclear in TPES grows at a rate of 1.6% p.a. to 2030. Global nuclear generation grows from 2,535 TWh in 2014 to 3,327 TWh in 2030. Global Installed capacity reaches 440 GW. Capacity additions are led by China where nuclear installed capacity reaches 63 GW by 2030. India also sees substantial growth, reaching 22 GW installed capacity in 2030. By 2060, global nuclear generation has reached 4,908 TWh and installed capacity has grown to 639 GW. China surpasses 200 GW installed capacity in 2060 and India reaches almost 60 GW in 2060. Growth in Asia offsets nuclear retirements in EU31, where capacity falls to 75 GW in 2060. In both EU31 and NAM, nuclear struggles to compete against gas and subsidised intermittent renewable additions. Figure 15 summarises the role of nuclear in electricity generation to 2060.
2.2.5.3.4.4 Other Renewables: Wind, Solar, GeothermalSolar, wind and geothermal generation grow more rapidly than any other fuel source in primary energy out to 2060, averaging 5.1% p.a. in the period, driven by solar installed capacity additions. Continued technology advances lead capital costs for PV and concentrated solar to decline by more than 75% in the period to 2060. Cost reductions are driven by entrepreneurs willing to bet on clean energy technology who foster continued investments in standardisation, modularisation, and materials science innovation.
As a result, solar electricity generation grows from 198 TWh in 2014 to 1,369 TWh in 2030, and 5,718 TWh in 2060. Installed capacity rises to more than 1,011 GW by 2030 and exceeds 4,000 GW by 2060. China accounts for the largest share of capacity additions, followed by India, EUR, and NAM. Wind generation also rises from 717 TWh in 2014 to 2,540 TWh in 2030 and 8,818 TWh in 2060. Installed capacity surpasses 1,000 GW by 2030 and 3,100 GW by 2060. The largest additions are seen in China, India, EUR, NAM and APAC. By 2060, wind and solar generation encompasses 30% of total electricity generation. Innovation in small-scale battery based storage solutions for EVs and distributed systems such as micro-grids, enable balancing of intermittent renewables in energy systems.
Geothermal generation grows 8 times in the period, reaching 1.3% share of electricity generation in 2060. Figure 15 summarises the role of wind, solar and geothermal, classified in electricity generation in 2014, 2030 and 2060.

THE GRAND TRANSITION
53
2.3 UNFINISHED SYMPHONY
“A SYMPHONY IS A STAGE PLAY WITH THE PARTS WRITTEN FOR INSTRUMENTS INSTEAD OF FOR ACTORS” –
COLIN WILSON
In Unfinished Symphony, national governments unite and take effective policy action on climate change, supported by the values of civil society and an effective system of international governance. Economic growth is moderated, but also more environmentally and socially sustainable and more evenly distributed, with high levels of infrastructure investment. Developments in energy and economic systems are ‘smarter’, resilient, and more efficient, with technology innovation leading to large-scale integrated solutions.
The period begins with EUR reeling in the face of the largest migrant crisis in the world since World War II. Leaders in policy, industry and civil society all over the world are following through the media and are awakened to the reality that a mass migration caused by climate change impacts might look much worse. Already, systemic risks such as terrorism and disease are rapidly spreading from region to region. Civil society demands more effective action from local and national governments. This creates an impetus for early action in mitigating a broad range of issues, starting with climate change.
Drastic policy changes on the global and national level push political institutions and business models to their limits as new, more stringent regulatory requirements are imposed. Many large utility companies face collapse. Surviving companies find new operating models with more sustainable environmental outcomes. Increasingly, climate benchmarks are pegged to new economic opportunities and increased employment.
Cooperation frameworks extend beyond climate change into the broader economic system. Regional and global cooperation are the driving force for accelerating knowledge transfer and standardisation, both of which enable more efficient technology transfer across regions. An extensive network of fiscal incentives emerges, such as green subsidies and carbon pricing, with first regional then global standardisation across sectors. This enables unified action on climate change, which levels the playing field for developing nations. The result is a steep transition away from fossil fuel energy sources and the rapid electrification of the global energy system. By 2060, the world is “ticking on the same clock” and has shifted to a resilient, integrated, global low-carbon energy system.
2.3.1 TOOLS FOR ACTIONWith strong global and state directive on climate and other global issues, markets are shaped by national and global policy to achieve a new equilibrium that more accurately reflects the cost of environmental and social externalities. Strong global institutional frameworks support unified action on global issues. Change at a national level is facilitated by a government focus on long-term planning that ties national targets to global governance milestones and support from a civil society that is willing to shift their behaviour. Business models adapt to meet increasingly stringent requirements for compliance with environmental and social standards.
THE DOMINANT TOOLS FOR ACTION IN UNFINISHED SYMPHONY ARE:
• Societal values
• Strong global governance
• Integrated planning
• Enabling business models
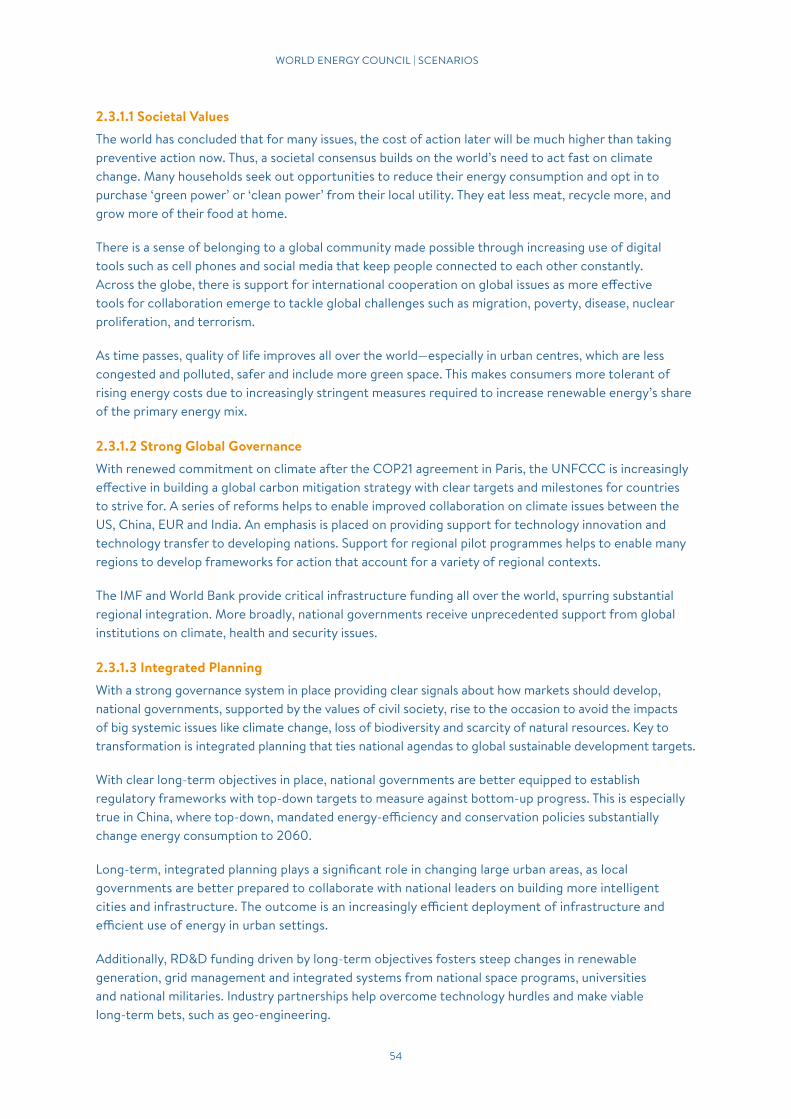
54
WORLD ENERGY COUNCIL | SCENARIOS
2.3.1.1 Societal ValuesThe world has concluded that for many issues, the cost of action later will be much higher than taking preventive action now. Thus, a societal consensus builds on the world’s need to act fast on climate change. Many households seek out opportunities to reduce their energy consumption and opt in to purchase ‘green power’ or ‘clean power’ from their local utility. They eat less meat, recycle more, and grow more of their food at home.
There is a sense of belonging to a global community made possible through increasing use of digital tools such as cell phones and social media that keep people connected to each other constantly. Across the globe, there is support for international cooperation on global issues as more effective tools for collaboration emerge to tackle global challenges such as migration, poverty, disease, nuclear proliferation, and terrorism.
As time passes, quality of life improves all over the world—especially in urban centres, which are less congested and polluted, safer and include more green space. This makes consumers more tolerant of rising energy costs due to increasingly stringent measures required to increase renewable energy’s share of the primary energy mix.
2.3.1.2 Strong Global GovernanceWith renewed commitment on climate after the COP21 agreement in Paris, the UNFCCC is increasingly effective in building a global carbon mitigation strategy with clear targets and milestones for countries to strive for. A series of reforms helps to enable improved collaboration on climate issues between the US, China, EUR and India. An emphasis is placed on providing support for technology innovation and technology transfer to developing nations. Support for regional pilot programmes helps to enable many regions to develop frameworks for action that account for a variety of regional contexts.
The IMF and World Bank provide critical infrastructure funding all over the world, spurring substantial regional integration. More broadly, national governments receive unprecedented support from global institutions on climate, health and security issues.
2.3.1.3 Integrated PlanningWith a strong governance system in place providing clear signals about how markets should develop, national governments, supported by the values of civil society, rise to the occasion to avoid the impacts of big systemic issues like climate change, loss of biodiversity and scarcity of natural resources. Key to transformation is integrated planning that ties national agendas to global sustainable development targets.
With clear long-term objectives in place, national governments are better equipped to establish regulatory frameworks with top-down targets to measure against bottom-up progress. This is especially true in China, where top-down, mandated energy-efficiency and conservation policies substantially change energy consumption to 2060.
Long-term, integrated planning plays a significant role in changing large urban areas, as local governments are better prepared to collaborate with national leaders on building more intelligent cities and infrastructure. The outcome is an increasingly efficient deployment of infrastructure and efficient use of energy in urban settings.
Additionally, RD&D funding driven by long-term objectives fosters steep changes in renewable generation, grid management and integrated systems from national space programs, universities and national militaries. Industry partnerships help overcome technology hurdles and make viable long-term bets, such as geo-engineering.

THE GRAND TRANSITION
55
Long-term objectives also facilitate regional integration, which becomes a critical driver of increasing energy access and resilient climate strategies. In the Americas, EUR, Africa, and some parts of Asia, national governments effectively establish plans that help to enable them to collaborate with their neighbours and partner with global institutions to finance critical infrastructure across borders.
The following case study explores how integrated planning is already delivering economic, social and environmental benefits in Japan.
Unfinished Symphony Yokohama City Case Study
Housing complex
PV Generation Heat plant
Low rise housing
Commercial area
AC for community PV Generation
EV Sharing for business purposes
Tower condominiums
Smart buildings
Amusement area
Residential areaIndustrial Area
Factory area
Kohoku Newtown
Minato Mirai 21 Area
Yokohama Green Valley Area
Super high-rise o�ce space
Subdivided Smart housing
CASE STUDY: YOKOHAMA SMART CITY
Yokohama Smart City in Japan is an example of how integrated planning in urban settings can boost the standard of living with more efficient and less carbon-intensive energy systems.
The local government’s objectives to cut CO₂ emissions while boosting economic growth in the city led to the development of a strategic energy plan, supported by intelligent infrastructure that includes comprehensive planning for industrial and manufacturing activity, commercial and residential, transport, and community attractions. The goal is to ensure environmentally sustainable and resilient access to energy without sacrificing quality of life. Illustrated on the right are three economic zones with clean energy-powered residential, industrial and commercial activities. The infrastructure in these zones is enhanced with a digital infrastructure that helps to enable centralised management of energy consumption.
Later sections of this paper explore how intelligent infrastructure development will play a role in sustainable economic growth.
Source: Yokohama Smart City Project, 2013

56
WORLD ENERGY COUNCIL | SCENARIOS
2.3.1.4 Enabling Business ModelsThe economics created by the regulatory environment force companies everywhere to make significant changes in their supply chains and operations. The public pushes local and national governments to hold companies accountable for adopting more sustainable practices. Over time, this leads to new business models for profitability and longevity, as leading organisations look for alternative methods that decouple growth from natural resource consumption.
More stringent carbon pricing schemes incentivise energy companies and energy-intensive industries to deploy cleaner technologies. Leading utilities strive to meet emissions targets and mandates by deploying utility-scale wind and solar. From the standpoint of cost, equity, and environmental benefits, large-scale solar is a crucial resource, and the private sector plays a critical role in bringing this technology to energy markets.
2.3.2 Productivity and Economic GrowthPolicymakers start to look beyond GDP growth to measure the effectiveness of policy actions. In developed and developing economies, policy direction that attempts to balance growth with security, environmental and social outcomes shapes a more sustainable model for economic growth. Burgeoning economies balance the desire for immediate profit with more long-term development goals.
A key to the transition to more sustainable economic growth is intelligent infrastructure and, later in the period, circular economies. This approach boosts societal wellbeing, avoids potential costs, and leads economies to grow at 2.9% p.a. from 2014 to 2060. Figure 22 summarises the distribution of GDP growth from 2014 to 2060 across a selected set of regions.
THE DOMINANT DRIVERS OF ECONOMIC PERFORMANCE IN UNFINISHED SYMPHONY ARE:
• Intelligent economies
• Circular economies

THE GRAND TRANSITION
57
Source: IMF, IEA, TED, The World Energy Council. Paul Scherrer Institute, Accenture Strategy
Figure 22: Unfinished Symphony % GDP Growth from 2014 to 2060
6.6%
SSA
5.5%
India
4.0%
China
3.5%
MENA
3.4%
APAC
2.9%
World
2.7%
LAC
1.8%
US
1.7%
EU31
1.7%
Russia
FIGURE 22: UNFINISHED SYMPHONY GDP GROWTH % p.a. (2014-60)
2.3.2.1 ‘Intelligent Economies’Long-term planning and government investments in the digitalisation of economies, via the deployment of ‘Intelligent Infrastructure’, boost global economy efficiencies and productivity. By 2030, 100 trillion sensors are attached to a range of substructures, from natural resources to production lines, warehouses, transportation networks, the electricity grid, homes, offices, stores, and vehicles. These sensors continually send data to the communications, energy and logistics internets, allowing real-time communication and analysis that helps reduce maintenance costs and provide better information about how society interacts with infrastructure and equipment. Cities and lifestyles are dramatically changed through the intelligent economy, particularly electricity systems. Smart Grids and Smart Cities significantly boost efficiency and substantially change building design and consumer behaviours. The city of Seattle Smart Buildings initiative and the case study presented on Yokohama Smart City are two examples of the emergence of intelligent economic growth in cities today.
Intelligent infrastructure is supported by policies that facilitate more efficient technology transfer and the development of global standards for privacy, data management and physical and digital trade. Consensus is reached on supply chain standards for food, standards for electrical appliances, and standardised power sockets across the globe. Market spaces are also created to harmonize data protection, copyright, and telecommunication requirements and more strongly regulate online transactions. Consumers and voters increasingly trust governments and companies to secure and use their personal data responsibly. Figure 23 demonstrates how government support of economic digitalisation and the deployment of Smart Infrastructure lead to both economic and social benefits.

58
WORLD ENERGY COUNCIL | SCENARIOS
Government—and system-driven efficiencies enhance societal wellbeing and create new opportunities for the private sector. With smarter and better-planned infrastructure, access to data is limitless. Both governments and companies can access the Internet of Things and use big data and analytics to develop predictive algorithms that accelerate efficiency gains, increase productivity and lower the marginal cost of producing and distributing physical things, including energy, to near zero.
2.3.2.2 Circular EconomyBeyond 2030, policies to control carbon emissions become increasingly stringent, pushing economic models to their limits. More and more pressure builds to develop circular business models and create circular economies. Companies can no longer focus on increasing volume and squeezing out cost through greater efficiency in supply chains, factories and operations. Instead, they concentrate on rethinking products and services from the bottom up to prepare for inevitable constraints on resource consumption. This implies eliminating waste, creating steep changes in resource productivity and, at the same time, ensuring they still meet the customer value proposition in price, quality and availability.
Source: Accenture Digital Government, pg. 7
Figure 23: Unfinished Symphony The economic impact of digitally enabled governments
Digitalisation has a positive impactThere are benefits for the economy, society and public services
Digitalisation improves economic competitiveness.
Source: Accenture Digital Government, pg. 7
Digitalisation improves society and quality of life.
Digitalisation enhances business potential and public service delivery.
0.5%
Gross domestic
product level
1% increase in digitalisation
1 point increase in digitalisation
1 point increase in digitalisation
0.13 point
Human development
index
13.67 point
Global innovation
index
FIGURE 23: UNFINISHED SYMPHONY THE ECONOMIC IMPACT OF DIGITALLY ENABLED GOVERNMENTS

THE GRAND TRANSITION
59
Source: Accenture Strategy Circular Business Models, pg 12
Unfinished Symphony Circular Business Models Case Study
C. Returning by-products
A. Resell
B. Repair/Upgrade
C. Rem
anufacture
A. Circular Supplies
Other loop
B. Waste as a resource
Product Design
Procurement
Manufacturing Logistics
Sales and marketing
End of life disposal
Wasteleakage
A. Re/Up-cycle
Share
Reverse Logistics
Product use
Circular SuppliesProvide renewable energy, bio based- or fully recyclable input material to replace single-lifecycle inputs
Resource RecoveryRecover useful resources/energy out of disposed products or by-products
Product Life ExtensionExtend working lifecycle of products and components by repairing, upgrading and reselling
Sharing PlatformsHelp to enable increased utilisation rate of products by making possible shared use/access/ownership
Product as a ServiceO�er product access and retain ownership to internalise benefits of circular resource productivity
Source: Accenture Strategy Circular Business Models, pg 12
CASE STUDY: FIVE CIRCULAR BUSINESS MODELS
In a circular economy, growth is decoupled from natural resource consumption through disruptive technology and business models based on longevity, renewability, reuse, repair, upgrade, refurbishment, capacity sharing, and dematerialisation. This case study explores five business models for circular economies. Each model has its own distinct characteristics and can be used singly or in combination to help companies achieve massive resource productivity gains and, in the process, enhance differentiation and customer value, reduce cost to serve, generate new revenue, and reduce risk.

60
WORLD ENERGY COUNCIL | SCENARIOS
2.3.3 INTERNATIONAL GOVERNANCEUnfinished Symphony is shaped by the presence of a strong global governance structure and an emphasis on diplomacy, leading to a world of increasing regional and global cooperation.
2.3.3.1 Strong Global CooperationAs the world unites around the climate issue, the inadequate representation of non OECD countries in the UN’s governance framework poses a serious threat to global cooperation. To garner support from China and India, the US and EUR agree to a substantial reform of the UN governance and funding structure. Additional seats are added to the Security Council for Asia, including a permanent seat for India, and renewed commitments are made by all members on funding UN activities.
By 2020, the US, China and EUR have agreed on appropriate regional frameworks for carbon pricing that consider the socio-economics of each region. By 2030, the UNFCCC successfully negotiates an agreement between the US, China, India and EUR that establishes a framework for India’s transition and supports technology transfer and funding for sustainable development.
Bureaucracy grows to an extent as a global governance framework is solidified, but on a national level, governments can reduce bureaucratic obstacles as more countries adopt global standards. In particular, reducing corruption and bureaucracy in the Middle East, Latin America, and SSA is critical to sustainable and productive future for these regions.
2.3.3.2 Regional IntegrationIn many regions, global trade developments focus on building regional partnerships that support increased integration of energy systems and funding for infrastructure projects. While regional integration is seen all over the world, the biggest agreements occur in EUR and Africa.
The EU us at high risk of fragmentation, torn apart by the migration crisis, the bailout of Greece and negotiations with the United Kingdom. However, policymakers in all member nations understand the need to work together on the migrant crisis. With careful planning and migration reforms, EUR policymakers regain control of border crossings and create appropriate policies for the migrants who have already entered the region. A reform in immigration and labour laws leads to a sustained boost to GDP growth from labour force growth. A renewed effort on peace building and economic development efforts in war-torn countries in the Middle East and Africa slow down migration to EUR through 2020 and the region re-emerges more unified than ever before.
The most important economic shift created through regional integration occurs later in the period, in Africa, where the 54-member countries of the African Union concurrently implement the Continental Free Trade Area and, in the process, radically change Africa’s economic trajectory. Industrial sectors benefit the most (e.g., electronics, machinery and transport equipment, chemicals, textile, metal products and processed food), thereby positively influencing Africa’s industrial development and structural transformation and fostering the build-out of substantial infrastructure in the region.
THE INTERNATIONAL GOVERNANCE SYSTEM IS SHAPED BY:
• Strong global cooperation
• Regional integration

THE GRAND TRANSITION
61
LAC also sees strong regional integration, with integration of energy infrastructure delivering a substantial contribution to the development of resilient energy systems. Encouraged and led by the example of Colombia, LAC builds capable, strong and transparent institutions. Over time, this gives rise to new values and regional vision.
2.3.4 CLIMATE CHALLENGEThe period begins with many national governments looking inward, to ensure their long-term planning helps to enable them to meet the greenhouse gas emissions mandates set at COP21. Over time, it becomes increasingly apparent that national governments alone cannot absorb the substantial financing and infrastructure build-out needed to achieve climate goals. The UNFCCC provides a framework to encourage more unified action.
All regions make great progress in abating carbon emissions and reducing the carbon footprint of lifestyles and economies. In 2060, the world is slightly off track for meeting the long-term COP21 pledge commitments, but still has the opportunity to recover through technologies and policies that drive to negative carbon emissions beyond 2060. The world exceeds the 1,000 GtCO₂ as it approaches 2060. Emissions concentrations translate roughly to a temperature rise that is slightly above 2°C in 2100.
The unprecedented progress in emissions reductions is due in large part to local support that creates an impetus for national action and global cooperation. Further facilitating unified action are a strong global governance system and the emergence of a global climate framework. The outcomes are global reductions in carbon intensity of GDP that average 4.7% p.a. from 2014 to 2060. Figure 24 demonstrates how in the second half of the period global carbon intensity reductions accelerate to the point where it must be to stay below the IPCC 2°C target.
Figure 24: Unfinished Symphony Reductions in Carbon Intensity of GDP % p.a. (2014 – 2060)
Unfinished Symphony
Source: World Energy Council, Paul Scherrer Institute, Accenture Strategy Analysis
2DS
5.6%
2014-602014-30
3.2%
2030-60
5.6%
2014-60
4.7%
Source: The World Energy Council, Paul Scherrer Institute, Accenture Strategy
FIGURE 24: UNFINISHED SYMPHONY REDUCTIONS IN CARBON INTENSITY OF GDP % P.A. (2014-60)
THE DRIVERS OF CLIMATE ACTION IN UNFINISHED SYMPHONY ARE:
• Local support
• Unified action
• Technology transition

62
WORLD ENERGY COUNCIL | SCENARIOS
2.3.4.1 Local SupportEfficiency is a primary focus for governments. Strong gains are made after COP21 through local and national policy support, and through RD&D in demand-side technologies and digital tools that increase efficiency, create smarter cities and help shift consumer behaviour. Additionally, a variety of taxation and incentive schemes for renewable energy foster continued deployment of solar and wind in all regions. Governments provide substantial support to RD&D investments directed to nuclear, hydro and CC(U)S technologies, and make progress in longer-term bets such as power-to-gas and hydrogen economies as they back long-term innovation with substantial resources.
2.3.4.2 Unified ActionAfter several years of national governments tightening emissions standards and regulatory requirements, energy and carbon intensity improve; however, the costs of action become increasingly challenging to absorb by government taxation and support schemes alone. As 2020 approaches, many of the commitments made at COP21 are off track. Industry giants also struggle to make big enough changes in their operations to meet requirements. There is consensus that the global framework for managing emissions requires more financing and binding targets that align directly to the IPCC emissions budget for 2°C.
With global commitments at risk, the UNFCCC pushes to instil caps and penalties to improve compliance with emissions-reductions requirements. Implementation is gradual and achieved through a series of agreements involving the top four emitting regions: the US, EUR, China and India. Agreements increase the funding for a transition in both developed and developing economies. Funding is partially obtained through the implementation of an interregional trading scheme that links emissions markets in EUR, Asia and the Americas based on an extended CDM. By 2030, local taxation and support schemes are directly linked to long-term emissions targets, and national governments are back on track with their UNFCCC commitments.
2.3.4.3 Technology TransitionStrong government mandates and rising carbon prices force a rapid transition in energy technologies. On the demand side, top-down mandates and technology support for intelligent infrastructure and smarter buildings, homes and offices enable consumers to use energy more efficiently. Technology support also is instrumental in deploying large-scale low-carbon energy generation. We explore the profound impact of the policy-driven technology transition on energy systems in more detail in later sections. Table 6 below outlines the most disruptive technology trends.
Sector Technology Adoption
Transport • EV penetration in light-duty segment
• Biofuels penetration in transport
• Natural gas transport in heavy freight and marine
• Low-carbon mass transit solutions
TABLE 6: DISRUPTIVE TECHNOLOGY TRANSITION BY SECTOR

THE GRAND TRANSITION
63
Sector Technology Adoption
Industry and Power • CC(U)S for coal and natural gas
• Concentrated Solar, PV and storage solutions
• Natural gas generation in power and industry
• Electrification of processes and heating
• Nuclear rise in China and India
Commercial and Residential • Connected infrastructure, homes, offices and commercial spaces that are more energy efficient
• Utility-scale solar and integrated systems
• Electrification of heating and cooking
Non-energy use • Natural gas as a chemical feedstock
Source: The World Energy Council, Paul Scherrer Institute, Accenture Strategy
Both technology transfer and financing for clean energy projects in developing regions are critical to the success of climate agreements and trading schemes. Institutional banks step in to fund sustainable infrastructure development in African and Asian countries based on regional case studies that emerge from pilot programmes. Revenues generated from carbon pricing schemes provide additional financing. Industry partnerships and NGOs facilitate technology deployment and ensure compliance with agreed pledges and alignment with UN Sustainability objectives.
2.3.5 IMPLICATIONS FOR ENERGYTable 8 summarises the implications for energy of Unfinished Symphony. We explore these in further detail in the following sections.
Energy Implications Unfinished Symphony
Energy Demand • Top-down mandates dampen consumption
• Efficiency gains keep consumption growth moderate
Market Structures • Integrated digital and physical infrastructure
• Zero-marginal cost utilities
Primary Energy Supply • Policy-driven penetration of renewables
• Gas with CCS as transition fuel
TABLE 8: UNFINISHED SYMPHONY IMPLICATIONS FOR ENERGY

64
WORLD ENERGY COUNCIL | SCENARIOS
2.3.5.1 Energy Demand2.3.5.1.1 Final Energy ConsumptionTFC grows by 19% to 2030, and plateaus to 2060, averaging 0.4% p.a. growth from 2014 to 2060. Growth is largely driven by increased delivered energy for industry and transport. Because of increased efficiencies and a top-down push for reduced energy consumption in many regions, commercial and residential consumption in the period increases only slightly.
Source: The World Energy Council, Paul Scherrer Institute, Accenture Strategy
Figure 25: Unfinished Symphony Total Final Consumption of Energy by Sector (MTOE) % Share
2030 20602014
9,395MTOE
11,147MTOE
11,417MTOE
Non Energy UseResidential/Commercial TransportIndustry
28% 29% 27% 31% 27% 30%
34% 9% 32% 10% 31% 12%
FIGURE 25: UNFINISHED SYMPHONY TOTAL FINAL CONSUMPTION OF ENERGY BY SECTOR (MTOE) % SHARE
2.3.5.1.2 IndustryA global move towards more sustainable economic growth results in a dampened outlook for industrial sector delivered energy. Industrial demand for energy grows at a rate of 1.5% p.a. from 2014 to 2030. Beyond 2030, demand flattens as increasingly stringent policies impose changes in energy-intensive industrial activity and economies shift to service-led growth. Industrial activity also becomes increasingly efficient, through a transition to gas and renewables for power, and through the electrification of processes and heating.
2.3.5.1.3 TransportSignificant breakthroughs in storage technologies, including batteries, open the door to a revolution in transit. Hydrogen-powered driverless mass transit that is affordable and available 24 hours a day, 7 days a week, becomes a commonplace service in some of the world’s mega cities. Policy mandates substantially impact consumer demand for light-duty vehicles: Car-ownership grows at a moderated pace, and the mix of car technologies is highly diverse, including biofuels, EVs, and natural gas. The light-duty vehicle fleet grows 2.5 times to 2060, reaching 1.5bn units in 2030, and 2.8bn units in 2060.
Demand for petroleum-based transport fuels grows at a moderated rate of 0.6% p.a. to 2030. Beyond 2030, demand declines at an accelerated pace, averaging a decline of 1.0% p.a. as transport fuel diversification accelerates.

THE GRAND TRANSITION
65
Source: The World Energy Council, Paul Scherrer Institute, Accenture Strategy
FIGURE 26: UNFINISHED SYMPHONY SHARE OF FUELS IN TRANSPORT (% SHARE)
Through strategic planning, emissions standards, and the build-out of smart infrastructure, the electrification of transport continues to build momentum. By 2030, more than 86mn EV and hybrid EV are on the road. By 2060, this number has grown to 913mn representing 32% of the global vehicle fleet. Petroleum-based hybrid electric vehicles comprise an additional 24% of the vehicle fleet.
Biofuels also help to substantially diversify the fuel mix, as it grows almost 9 times from 2014 to 2060. The emergence of second—and third-generation biomass technologies accelerates that growth in the second half of the period. With RD&D and government support, advances reduce the need for water and land consumption. By 2060, biofuels account for more than 21% of transport fuel demand, up from just 3% in 2014 and 8% in 2030. Figure 26 summarises the fuel transition in transport from 2014 to 2060.
2.3.5.1.4 Residential and CommercialTop-down energy mandates require increasing efficiency standards for commercial and residential buildings. Governments also subsidise a transition to more efficient appliances, lighting and HVAC solutions. Centrally managed Smart Cities that are integrated with Smart Buildings are critical to such efficiency gains. As a result, residential and commercial energy demand use grows at a moderated pace of 0.6% p.a. to 2030, flattening to 2060.
2.3.5.1.5 Non-Energy UseDemand for fuels in non-energy use grows at 1.8% p.a. from 2014 to 2030 due to demand for chemicals from emerging markets such as China and India. From 2030 to 2060, as China’s and India’s economies mature, growth moderates to 0.6% p.a.
2.3.5.2 Electricity An emphasis on energy efficiency, moderated economic growth and higher electricity prices dampen electricity demand early in the period; however, the push for efficiency also accelerates the electrification of energy systems. The electrification of the final consumption of energy grows from 18% in 2014 to 20% in 2030. Growth in demand for electricity is 1.6% p.a. to 2030, fuelled largely by new wind and solar capacity, which encompass 38% of generation growth. Natural gas accounts for 20% of growth in generation. Beyond 2030, demand for electricity slows to 1.2% p.a.
Figure 27: Unfinished Symphony Share of Fuels in Transport (% of Total Transport Demand)
206020302014
2,619MTOE
3,050MTOE
3,123MTOE
Other (Coal)
92% 87% 60%21%6% 10% 3%2%4% 8%3%3%
Oil Gas Biofuels Electricity Hydrogen

66
WORLD ENERGY COUNCIL | SCENARIOS
Source: The World Energy Council, Paul Scherrer Institute, Accenture Strategy
FIGURE 27: UNFINISHED SYMPHONY ELECTRICITY GENERATION TWH % SHARE BY FUEL TYPE
2.3.5.2.1 Integrated SystemsUtilities must respond to a more stringent policy environment by using increasingly variable sources of electricity. At the same time, consumer demand becomes more variable as well, with the penetration of smart appliances, EVs and hybrid fuel vehicles. Strong policy support for infrastructure development and high cooperation on a regional and global level allow companies to develop digitally and physically integrated grid solutions.
Smart Grids, Smart Buildings and Smart Cities are all enabled by integrated long-term planning and the rise of the ‘Intelligent Economy’ and ‘Intelligent Infrastructure’ (refer to sections 2.3.1.3 and 2.3.2.1). The integration of information networks and data systems with energy infrastructure create new opportunities for advanced coordination and control of electricity across large geographic areas. Intelligent infrastructure and smarter grids allow utilities to better manage the complexity created by the dispersed nature of renewable resources, and enable renewable energy to be captured from high-resource areas.
Connections among energy infrastructure, communications networks, and other traditional infrastructures such as water and wastewater systems are also increasingly common. As these connections evolve, energy leaders rethink the traditional paradigms of energy system planning and operation, and more resilient and more connected energy systems continue to evolve in all regions.
2.3.5.2.2 Zero marginal cost utilitiesPolicy support of renewable energy, such as feed-in tariffs and tax credits, guarantee a premium price above market value for renewable generation. Unfortunately, this results in utilities passing on to rate payers
By 2060, electricity generation has grown 1.9 times since 2014, and the electrification of final energy consumption has reached 29%. More than 39% of electricity generation comes from wind and solar power plants.Figure 26: Unfinished Symphony Electricity Generation (TWh) % Share by Resource
23,816TWh
16%11%3% 2%
2014 2030 2060
4%17%14%9%6%
30,854TWh
5%16%17%21%18%
44,474TWh
Coal Coal with CCS Oil Gas Gas with CCS Non-Fossil
Geothermal Solar Wind Nuclear Hydro Biomass Biomass with CCS
41% 4% 25% 81% 2% 2% 15%23%22% 33% 51%

THE GRAND TRANSITION
67
the cost of subsidising renewable energies, placing a short-term burden on businesses and homeowners. After the fixed costs for the installation of solar and wind are paid back, however, the marginal cost of the harvested energy is nearly zero. This means that in the mid—to long-term, utilities emerge that generate near zero marginal cost energy. In an unregulated climate, competition from a near-zero cost power generator will create losses for fossil fuel, nuclear-based generation or newer installations of renewables. In a regulated environment, it creates a revenue challenge for the low-cost generator.
The effect of near-zero marginal cost operators is countered by growing system costs associated with renewables. These include storage and back-up solutions, balancing, grid connection, extension and reinforcement costs. The approach to allocating system costs influences the degree to which the zero-marginal cost effect distorts energy markets. In many markets, utility companies are pushed towards bankruptcy. Those that survive respond through industry consolidation to create economies of scale, and through financial restructuring that allows flexible strategies for regulated and unregulated markets.
2.3.5.3 Primary EnergyElectrification of energy use and the rapid deployment of renewables lead to substantial shifts in primary energy supplies. TPES growth slows to 0.7% p.a. from 2014 to 2030, reaching 15,291 MTOE. Fossil fuels also experience a substantial shift in share, falling to 74% of primary energy in the period. Slowing population growth and high carbon prices mean supply growth is flat in the second half of the period. By 2060, TPES is just 10% higher than it was in 2014, and the share of fossil fuels in primary energy has fallen to 50%.
Source: The World Energy Council, Paul Scherrer Institute, Accenture Strategy
Figure 28: Unfinished Symphony Primary Energy Supply (MTOE) % Share
20302014 2060
13,652MTOE
10%3%5%1%
Non-Fossil Fuels Non-Fossil Fuels
12%3%7%4%
15,290MTOE
Non-Fossil Fuels
19%4%13%13%
15,085MTOE
Other Renewables Nuclear Hydro BiomassCoal Oil Gas Non-Fossil
29% 21% 31% 19% 20% 23% 31% 26% 5% 24% 22% 49%
FIGURE 28: UNFINISHED SYMPHONY PRIMARY ENERGY SUPPLY (MTOE) % SHARE
As businesses develop new models to survive in a world where carbon emissions are heavily taxed, the energy intensity of economic activity drops considerably. Industrialised economies move into an era of service—and sustainability-led growth as the world increasingly embraces a circular economic model. As a result, global energy intensity declines more than 70%, averaging 2.6% p.a. from 2014 to 2060. Global energy and emissions targets and technology transfer also lead to strong convergence of energy intensities across regions.

68
WORLD ENERGY COUNCIL | SCENARIOS
Source: The World Energy Council, Paul Scherrer Institute, Accenture Strategy
Source: The World Energy Council, Paul Scherrer Institute, Accenture Strategy
Figure 29: Unfinished Symphony Change in Primary Energy Intensity % p.a. (2014–60)
-4.6%
SSA
-3.8%
China
-3.5%
India
-3.0%
MENA
-2.7%
APAC
-2.6%
World
-2.6%
US
-2.2%
EEUR
-2.2%
EU31
-1.6%
LAC
Figure 30: Unfinished Symphony Coal in TPES by Region (MTOE) % Share
2014
3,902MTOE
3,062MTOE
724MTOE
2030 2060
China India EUR LAC MENA NAM Other asia SSA
11%12%
11% 10% 9% 15% 19%
3% 52% 10%9% 6% 3%8%11%2% 54% 53%
FIGURE 29: UNFINISHED SYMPHONY CHANGE IN ENERGY INTENSITY % P.A. (2014-60)
FIGURE 30: UNFINISHED SYMPHONY COAL IN TPES BY REGION (MTOE) % SHARE
2.3.5.3.1 CoalWith the world’s largest energy consumers agreeing to take unified action on climate change, coal in TPES declines at a rate of 1.5% p.a. from 2014 to 2030. Reductions in coal are driven by China, EUR, and NAM, with global coal use in primary energy falling by 840 MTOE to 2030. Coal in China peaks before 2020, falling by 370 MTOE from 2014 to 2030.
By 2030, a global CC(U)S mandate and political pressure to reduce emissions of carbon, NOX, SOX and other pollutants dissuade utilities from investing in any new coal projects. In every region, utilities retrofit existing plants with CC(U)S technologies. As a result, coal’s decline in TPES accelerates, averaging -4.7% p.a. from 2030 to 2060. Figure 19 summarises the regional allocation of coal in global TPES in 2014, 2030 and 2060.

THE GRAND TRANSITION
69
2.3.5.3.2 OilBecause of tightening emissions standards and restrictions on carbon-emitting transport fuels, oil consumption grows moderately—0.6% p.a.—before peaking in 2030. Although demand for transport fuels continues to grow at 1.0% p.a. from 2014 to 2030, transport fuels in the period are increasingly diversified.
Oil in TPES in China rises by 5.6 mb/d, while India adds 3.1 mb/d. EUR and NAM see a decline of 2.4 mb/d in the period.
After 2030, oil in primary energy begins a slow decline that steepens substantially beyond 2040. By 2060, virtually every region except SSA and India has sharply reduced oil consumption. NAM and EUR consume 21.0 mb/d below what they consumed in 2014, while China’s demand for oil in 2060 is 0.80 mb/d below 2014 values. India adds 5.5 mb/d, while SSA adds just under 5 mb/d from 2014 to 2060.
MENA remains the dominant producer through 2040, with production flattening at 35 mb/d in 2030. Implicit carbon prices slow supply additions and drive oil prices higher, enabling producing nations to invest in diversifying their domestic economies early in the period. Stagnated demand for transport and falling capital spend in exploration and production cause a steep decline in global supplies beyond 2030. MENA maintains its position as the dominant global supplier, with oil production settling at 31 mb/d in 2060.
2.3.5.3.3 GasModerate economic growth, rising energy efficiency, and increasingly stringent emissions standards dampen growth for natural gas, which averages 1.3% p.a. from 2014 to 2030, reaching 3,554 MTOE of consumption. Asia represents 25% of demand growth, followed by Other Asia which reflects 12% of consumption growth and NAM which reflects 9% of consumption growth. EUR and India each reflect 7% of consumption growth to 2030. Beyond 2030, global demand growth flattens reaching 3,554 MTOE in 2060. Declines in consumption in the US and EUR are offset to an extent by India and China, which represent 41% of natural gas consumption growth from 2030 to 2060 as India looks to displace coal in power and China seeks to displace oil in transport. SSA also sees strong additions, reflecting 10% of gas growth in TPES from 2030 to 2060 as the region skips over coal generation in power.
Source: The World Energy Council, Paul Scherrer Institute, Accenture Strategy
Figure 31: Unfinished Symphony Oil in TPES By Region (mb/d) % Share
2014
86mb/d
94 mb/d
65mb/d
2030 2060
2014
China India EUR LAC MENA NAM Other asia SSA
18% 2% 13% 4% 16% 3% 17% 7% 17% 10% 15% 14%
24% 11% 8% 20% 22% 10% 8% 17% 13% 11% 7% 13%
FIGURE 31: UNFINISHED SYMPHONY OIL IN TPES BY REGION (MB/D) % SHARE

70
WORLD ENERGY COUNCIL | SCENARIOS
Source: The World Energy Council, Paul Scherrer Institute, Accenture Strategy
Source: World Energy Council, Paul Scherrer Institute, Accenture Strategy
Figure 32: Unfinished Symphony Gas in TPES by Region (MTOE) % Share
2014 2030 2060
3,604 MTOE
3,554 MTOE
2,891 MTOE
China India EUR LAC MENA NAM Other asia SSA
17% 28%5%
27% 16% 5%
16% 26%9%1% 4%
25% 14% 5%
16% 9%5% 16%
15% 6% 20%13%
Figure 33: Unfinished Symphony Coal-fired electricity generation (PWh)
0123456789
10
2014 2020 2030 2040 2050 2060
PWh
Coal with CCSCoal
Source: World Energy Council, Paul Scherrer Institute, Accenture Strategy Analysis
FIGURE 32: UNFINISHED SYMPHONY GAS IN TPES BY REGION (MTOE) % SHARE
FIGURE 33: UNFINISHED SYMPHONY COAL-FIRED ELECTRICITY GENERATION (PWH)
Production of gas grows fastest in Russia and China to 2030. MENA and NAM dominate growth to 2060.
2.3.5.3.4 Carbon Capture and Sequestration (CCS)The US, EU31 and China enact the world’s first-ever national carbon emissions standards that impose carbon capture and sequestration (CCS) on coal-powered generation. As emissions standards tighten, finding commercial uses for captured CO₂ becomes a higher priority for industry and governments.
Early retirement, retrofits and conversions cause significant shifts in coal and natural gas-fired power generation. All remaining coal plants are retrofitted with CC(U)S technology post 2030, and natural gas plants post 2050. By 2060, CC(U)S technology captures 4.8 GtCO₂/yr. Figure 33 and Figure 34 demonstrate how mandates for CCS diminish the role of coal in power and foster growth in gas-powered generation with CCS.

THE GRAND TRANSITION
71
Source: The World Energy Council, Paul Scherrer Institute, Accenture Strategy
Figure 34: Unfinished Symphony Natural Gas-fired electricity generation (PWh)
0123456789
10
PWh
Gas with CCSGas
Source: World Energy Council, Paul Scherrer Institute, Accenture Strategy Analysis
2014 2020 2030 2040 2050 2060
FIGURE 34: UNFINISHED SYMPHONY NATURAL GAS-FIRED ELECTRICITY GENERATION (PWH)
2.3.5.3.5 Non-Fossil FuelsThe growing use of non-fossil fuels in power and transport translates into a rising share of the primary energy mix. From 2014 to 2060, supply grows at 2.3% p.a., boosting non-fossil fuel share of TPES to 26% in 2030 and 50%. in 2060, wind and solar, classified below under Other Renewables, post the strongest growth.
2.3.5.3.5.1 BiomassThe use of biomass as a fuel source increases 2.1 times in the period, rising from 1,408 MTOE in 2014 to 2,949 MTOE in 2060. Emissions mandates accelerate growth in both transport and power generation. LAC leads in overall biomass use in TPES and in production throughout the period, driven by plentiful, low-cost feedstocks.
National emission standards continue to tighten throughout the period in every region, which sustains the growth of biomass in TPES globally to 2060. Supplies are increasingly available as second—and third-generation biomass technologies, led by Brazilian and Chinese RD&D, become commercially viable. Figure 26 illustrates biofuels growth in transport to 2060, and Figure 27 summarises biomass growth in electricity generation to 2060.
2.3.5.3.5.2 HydroThe share of hydro in primary energy rises from 3% in 2014 to just 4% in 2060, yet hydro as a fuel source in TPES grows at 1.7% p.a. to 2030. Generation rises from 3,895 TWh in 2014 to 5,109 TWh in 2030 and 7,100 TWh in 2060. Global installed capacity tops 2,000 GW in 2060. Policy support spurs growth in China, where installed hydro power generation capacity reaches 403 GW. Beyond 2030, growth slows to 1.1% p.a., with most new capacity installed in Central Asia, China, LAC and SSA. Regional integration allows hydro projects to play a significant role as a cheap storage solution and dependable capacity to balance the intermittency of wind and solar generation. By 2060, China has reached 496 GW of installed hydro capacity, followed by LAC and India, where hydro capacity rises to 277 GW and 183 GW, respectively. Figure 27 summarises the role of hydro in electricity generation to 2060.

72
WORLD ENERGY COUNCIL | SCENARIOS
2.3.5.3.5.2 NuclearBenefiting from increasing national government support for the development of non-carbon emitting fuels, nuclear in TPES grows at 2.4% p.a., reaching 13% share in 2060. Nuclear also accounts for 17% of electricity generation, or 7,617 TWh, and global installed capacity of 989 GW in 2060. More than 50% of nuclear capacity additions throughout the period are in China, reaching 158 GW in 2030 and 344 GW in 2060. India follows China, with nuclear capacity reaching 137 GW in 2060. MENA also experiences a pronounced increase after the world’s top emitters reach a carbon agreement. Nuclear grows moderately in NAM, reaching 139 GW of installed capacity in 2060, while nuclear installed capacity in the EU31 declines to 2060, with capacity settling at 95 GW in 2060, due to retirements outpacing new additions, Figure 27 summarises the role of nuclear in electricity generation to 2060.
2.3.5.3.5.3 Other Renewables: Wind, Solar and GeothermalSolar, wind and geothermal generation grow more rapidly than any other fuel source in primary energy to 2060, averaging 5.3% p.a. in the period. Continued technology advances reduce capital costs for PV and concentrated solar by more than 75% to 2060. Also driving cost reductions are the continuation of current and planned subsidy schemes and growing demand for clean energy globally. Government-financed RD&D fosters advances in standardisation, modularisation, and materials science innovation.
As a result, solar installed capacity surpasses 1,100 GW by 2030 and exceeds 4,700 GW by 2060. Generation rises from 198 TWh in 2014 to 1,694 TWh in 2030 and 7,943 TWh in 2060. China accounts for the largest share of capacity additions, followed by India, EUR, and NAM. Installed capacity of wind also grows rapidly, reaching more than 1,230 GW by 2030 and 3,400 GW by 2060. Generation rises from 717 TWh in 2014 to 2,918 TWh in 2030 and 9,326 TWh in 2060. The largest additions are in China, India, EUR and NAM.
Large installed capacity additions allow intermittent renewables to reach 15% of electricity generation in 2030 and 38% of electricity generation in 2060. Large-scale pumped hydro and compressed air storage, battery innovation and grid integration provide dependable capacity to balance intermittency.
Geothermal energy grows 14 times in the period to 2060, achieving a 2.5% share of electricity generation. Figure 27 summarises the role of wind, solar and geothermal, classified in electricity generation in 2014, 2030 and 2060.

THE GRAND TRANSITION
73
2.4 HARD ROCK
“HARD ROCK WILL ALWAYS BE HARD ROCK, BUT YOU DON’T REALLY KNOW WHAT IS ROCK—AND
WHAT ISN’T—ANYMORE… IT’S JUST KIND OF FRAGMENTED.” – ALICE COOPER
Hard Rock explores a world where the geopolitical tensions in East Asia, EUR, the US and the Middle East weaken international governance systems. Governments establish policies that balance security, social welfare and environmental concerns based on the local context and without much consideration for global impacts. This leads to stronger regional ties and an emphasis on doing things the ‘old’ way, resulting over time in a divergence in how markets and political systems develop across the Americas, EUR and Asia. Some regions are in Modern Jazz, while others are in Unfinished Symphony, and still others struggle to achieve either scenario, such as LAC and MENA.
The international governance system weakens with the decline of US and EUR economic importance. Rising nationalist policies in both regions also weaken international trade agreements. Export-oriented growth becomes less important as an economic growth strategy, which leads to stagnating global GDP growth. Consequently, national policies emphasise regional cooperation and consumption-led growth, driven by diversified local economies—which helps meet national needs while developing local markets and labour demand.
Although in many regions environmental concerns remain a priority on national agendas, weak economic performance and low international cooperation make it more challenging for the world to tackle global issues, such as climate change. On a national level, energy policy often emphasises energy security and climate concerns, which creates strong demand for solar and wind generation—broadly seen as cheap and domestic sources of power. It also creates more policy support for nuclear energy, which experiences a revival in both Asia and the OECD.
With low economic growth limiting funding capacity and without a global climate framework in place, countries struggle to cooperate on technology transfer and trade and, by extension, find it difficult to meet UN climate commitments. In some regions, tight regulation and bureaucracy frustrate private investment. As a result, fossil fuels remain the dominant source of energy to 2060 and the issue of climate is not adequately addressed. By 2060, governments are shifting their focus to infrastructure resilience and adaptation to climate impacts.
2.4.1 TOOLS FOR ACTIONIn Hard Rock, market structures and policy systems increasingly fragment and focus on local and national needs. Diversifying local economies and adapting to a new world with high geopolitical tensions become the primary focus. Security drivers and power-balancing alliances dominate global cooperation. Strong national governments, societal values and state-owned enterprises thus become the predominant tools for action.
THE DOMINANT TOOLS FOR ACTION IN HARD ROCK ARE:
• Strong national governments
• Societal values
• Local business models
• State owned enterprises

74
WORLD ENERGY COUNCIL | SCENARIOS
2.4.1.1 Strong National GovernmentsGeopolitical tensions run high as developed regions react to the global migration challenge and weaker economic performance with nationalist and protectionist policies. Political systems all over the world experience extreme pressure. Continued instability plagues LAC, MENA and some parts of SSA as well. In the EU, fragmentation and the migration crisis challenge regional cooperation. In fact, the UNHCR statistics below indicate the current crisis may only be the tip of the iceberg.
JUST HOW BIG IS THE MIGRATION CHALLENGE? IN 2015, UNHCR REPORTED:
• 65.3mn forcibly displaced people
• 21.3mn refugees fleeing wars and persecution (50% under 18)
• 2.5mn asylum requests pending, of which, 1.3mn are in EUR
Source: UNHCR
In the US, divisions in political parties strain global relationships. Developing regions are increasingly disenchanted with The Washington Consensus and instead look to the Chinese archetype of state-controlled economic growth. Shifting political systems provide substantial benefits on a national level, but lead to a lack of global cooperation which, in turn, limits global competitiveness. Dampened economic growth limits funding capacity for social programs and renewables support schemes, and governments must use top-down mandates to balance environmental sustainability, energy equity and security concerns. The result is occasional economic losses for industry.
Government RD&D investments concentrate on national interests, and some regions successfully develop breakthrough solutions to complex local issues such as the Energy, Water, and Food nexus (EWF). However, low global cooperation means some technology development happens in isolation, with many countries working on the same issues but not always collaborating to optimize outcomes. Technology areas of emphasis for RD&D include:
• Electricity and power
• Nuclear energy
• Energy, Water and Food (EWF)
• Solar and wind energy
• Quantum computing
• Cyber security

THE GRAND TRANSITION
75
2.4.1.2 Societal ValuesSocietal values are widely different across geographic and socioeconomic groups. Among young urban dwellers, communities seek to build a more sustainable and resilient future locally. With pollution continuing to negatively affect public health and growing issues with structural unemployment, the public demands more stringent regulation of industries and more requirements for creating local benefits from operations. Consumers also increasingly want products and services that are customised for local contexts.
Lower migration options and wage stagnation in the private sector make careers with NGOs and in public administration more attractive to young talent, which produces a new generation of policy leaders. Young people increasingly engage in local politics and seek strong and competent government at all levels to consider how to proactively mitigate systemic risks.
In the face of rapid demographic, technological and political changes, some groups pursue self-preservation via rather self-centred and competitive ways, increasingly pressuring governments to provide protection from perceived threats. This leads to support for nationalist and protectionist policies. In some regions, this translates into ageing populations that are less willing to tolerate the erosion of safety nets and loss of control over immigration that has accompanied unchecked globalisation. In other regions, wage stagnation and other socio-economic challenges make low-income citizens less willing to pay more to subsidise cleaner energy generation.
2.4.1.3 Local Business ModelsBusinesses must navigate increasing complexity to expand their global footprint. With growing fragmentation, each region has increasingly disparate values and, therefore, requirements for entry and their own strong governance system to enforce them. Consumers and companies also take advantage of the lack of policy coverage over e-commerce transactions to work around requirements and restrictions. Companies with sufficient resources learn to navigate the challenges and balance conflicting demands from one region to the next by allowing flexibility in local operations and adopting a new focus on local solutions. Leading multi-national companies overcome an increasingly fragmented global marketplace by:
• Engaging with local communities
• Employing and training local staff
• Developing local knowledge
• Adapting global best practices to local context
• Developing new technologies for local needs
• Tailoring customer offerings to local context
• Managing reputational risk
2.4.1.4 State-Owned EnterprisesThe period begins with governments, not private shareholders, already owning the worlds’ largest oil companies and controlling three-quarters of the world’s energy reserves. Sovereign wealth funds account for one-eighth of global investment, and that figure is rising. These trends reshape the global economy by increasingly transferring economic power and influence to the central authority of the state.

76
WORLD ENERGY COUNCIL | SCENARIOS
IN 2016, THREE OF THE TOP FIVE FORTUNE GLOBAL 500 COMPANIES WERE CHINESE ENERGY COMPANIES:
1. Walmart 2. State Grid 3. China National Petroleum 4. Sinopec Group 5. Royal Dutch Shell
THE DOMINANT DRIVERS OF ECONOMIC PERFORMANCE IN HARD ROCK ARE:
• Diversified domestic economies
• Domestic expertise
• Local content development
Source: Forbes Global 500
From 2015 to 2030, as Asian economies rise in the global economic landscape, the importance of state-owned enterprises in the global economic and energy context continues to grow in every sector from finance to electricity and water. National companies deploy technologies and drive innovation. National banks deploy capital. State enterprises bring affordable provisions and essential services to millions of people throughout the period. They also overcome issues more easily as they have direct channels to government officials to resolve political obstacles. However, state-owned enterprises also struggle with growing levels of corruption, too much political interference and control, and lower profitability.
While this results in a lower economic growth trajectory, state capitalist economies tend to weather the effects of recession and market volatility with much greater endurance than the liberal market economies of the West. State enterprises share close ties with political leaders and can react with the appropriate economic stimulus quickly through state-controlled banks.
2.4.2 PRODUCTIVITY AND ECONOMIC GROWTHA divergence in political systems and market structures across regions shapes the economics of Hard Rock, which leads to a slowdown in global economic growth. Volatility in financial markets and the threat of recession make investors wary about the future. Global cooperation and trade suffers, as does collaboration on technology innovation. Rich and poor economies struggle to develop new technologies and keep up with historical levels of productivity growth. And stagnation in technology transfer makes it difficult for developing regions to attain productivity and technology levels enjoyed by the developed world.
The drag created by a decline in global cooperation is countered by an emphasis on developing diversified national economies, building domestic expertise, and maturing local policies. This ensures continued economic growth, albeit at a moderate pace of 1.7% p.a. from 2014 to 2060.

THE GRAND TRANSITION
77
Source: IMF, IEA, Total Economy Database, The World Energy Council. Paul Scherrer Institute, Accenture Strategy
Figure 35: Hard Rock% GDP Growth from 2014 to 2060
SSA
4.8%
India
4.0%
China
2.8%
MENA
2.0%
APAC
2.0%
World
1.7%
LAC
1.4%
US
1.0%
EU31
0.6%
Russia
0.6%
FIGURE 35: HARD ROCK GDP GROWTH % P.A. (2014– 60)
2.4.2.1 Diversified Domestic EconomiesIn industrialised nations, weakened trade relationships mean governments come to terms with the reality that export-led growth is no longer a sustainable model. Many governments invest in stimulating domestic growth and diversifying local economies. State-controlled economies and state-owned enterprises fare better in this transition; however, a lack of competition due to low global cooperation and trade leads to inefficiencies in market structures.
In developing nations, employment becomes a significant driver, which gives rise to unexpected models for diversifying economic growth. For example, in some countries in SSA, the service-driven growth models of India and Singapore become increasingly viable through regional cooperation and bi-lateral relationships that may not have emerged if Western societies still dominated the global landscape.
2.4.2.2 Domestic ExpertiseWith a reduction in global cooperation, brain drain is less of an issue in regions like Africa, the Middle East, India and China, where it has historically caused a drag on economic potential. This leads to local development of expert problem solving and complex communication skills and a growing number of domestic workers who can use technology and manage people in both technical and professional settings.
However, in many industries, middle—and low-skilled labour segments are substantially disrupted. To bring cost structures down, many industries deploy technology innovation that displaces some low—and medium-skill human labour, which leads to short-term higher unemployment and stagnating wages. Society and national governments absorb much of this burden. Governments and companies that can afford it attempt to keep middle—and low-skilled labourers employed in menial jobs to reduce societal unrest and poverty. Still, the wage divide between highly skilled and medium—to low-skilled workers continues to rise, pressuring national governments to respond with social safety nets and local programmes dedicated to solving health and education gaps.
78
WORLD ENERGY COUNCIL | SCENARIOS
2.4.2.3 Local Content DevelopmentTo build local skillsets and local industry, local content development becomes increasingly important in resource-rich economies in Latin America, Africa and the Middle East. Policies impact mostly foreign companies, requiring them to employ local workers and improve the local infrastructure. The most successful local content frameworks focus on value-added job creation rather than ownership of companies, and overcome many of the hurdles in attracting foreign investment in local content that include:
• Uncertainty of future demand
• Difficult access to finance
• Poor infrastructure
• Bureaucracy
• Shortage of skilled people
• Certification process
• Capacity constraints of suppliers
As time passes, local content policies mature to produce benefits beyond infrastructure development and employment, leading to competitive national industries and attracting sophisticated partnerships with the world’s leading multinational corporations. The following case study explores a limited subset of local content models at differing stages of maturity across a variety of regions and provides examples of the opportunities that may arise as local content policies mature in Hard Rock.
Source: Accenture Strategy
Hard Rock Local Content Case Study
Outcome
Loca
l Con
tent
Pol
icy
Mat
urity
Lev
el
• Small regional gains• Small increase in employment of local labour
• Isolated actions to promote local industry
• Often leveraged by foreign companies
• Focus on local workforce employment and local infrastructure improvement
Level I
ColombiaIsolated initiatives for local industry
• Increased local medium / large suppliers• Incentives to develop new business in country and increase local competitiveness
BrazilEmerging Local Content Model
• Local content regulation established
• Local content initiatives sponsored by government and private companies in place
Level III
• Small gains for small local suppliers• More suppliers in the chain
• Local content concept defined
• Local content targets are set
• Main supply capabilities and gaps identified
Level II
NigeriaBasic Local
Content Model
• Local industry internationalisation• Competitive industry encourages development of pioneer technologies
NorwayExcellence in
National Industrial Development
• Supplier industry at world-class level
• Reduced maintenance requirements
• Employment generation and maximized income
Level IV
CASE STUDY: MATURITY LEVELS OF LOCAL CONTENT POLICIES IN PLACE
THE GRAND TRANSITION
79
2.4.3 INTERNATIONAL GOVERNANCEFragmentation in political and economic systems weaken international governance systems, resulting in trade relationships driven by both economic and energy security concerns.
THE INTERNATIONAL GOVERNANCE SYSTEM IS SHAPED BY:
• Fragmentation in political and economic systems
• Power balancing alliances
2.4.3.1 Fragmentation in Political and Economic SystemsNationalist and protectionist policies that create a climate of low global cooperation, as well as concerns about security, pose a challenge for international governance systems. The economic and policy frameworks of the Americas, EUR and Asia continue to diverge as each region looks inward to deal with growing national challenges to the authority of state. LAC faces challenges with continued divergence in political systems.
The US and EUR initially focus on addressing instability in the Middle East and stemming the flow of migrants, but this proves challenging. Over time, it becomes clear that Middle East leaders must take charge and embrace a program of meaningful and long-term political, economic and social reform to bring peace to the region. Civil wars last through 2020, and continue to spur terrorist acts and mass migration with global impacts.
Economic and political tensions in LAC, MENA and SSA counter strong intra-regional partnerships in NAM, EUR, and Asia. Within this context, national governments choose lowest cost and/or most attractive resources to promote their national agendas, increasingly investing in regional resource development and utilising selective bi-lateral relationships with a few strategic partners to ensure access to energy resources.
2.4.3.2 Power Balancing AlliancesLower economic growth and growing nationalism result in a sustained reduction in global trade and cooperation. Just after 2030, China surpasses the US to become the number-one economy and Asian markets, once the destination for over 25% of US exports, are increasingly dominated by Chinese products. China’s rise leads to increased geopolitical tensions. This creates additional incentives for the US to create a balancing coalition to contain China by strengthening its ties with EUR and Latin America and building alliances with China’s neighbours, Japan, India, and South Korea. In Latin America and Africa, China remains an important export market for resources early in the period. However, with a drive to diversify domestic economies and reduce the influence of external forces, regional alliances become increasingly important in balancing China’s influence abroad.

80
WORLD ENERGY COUNCIL | SCENARIOS
2.4.4 CLIMATE CHALLENGEWith low economic cooperation, reduced capacity for investment and an emphasis on resolving national economic and security concerns first, the climate change challenge slides down the list of priorities for national governments.
As a result, in most regions, countries do not meet the INDC commitments set at COP21. Reduced economic activity and continued deployment of renewable energy mutes progress towards climate mitigation.
The reduction in carbon intensity averages just 1.5% p.a. from 2014 to 2060, and the world surpasses its 1000 Gt budget for CO₂ between 2040 and 2060. Emissions concentrations translate to about 3°C of global temperature rise. In 2060, physical and economic destruction caused by the impacts of climate change make adaptation the primary focus.
Figure 36: Hard Rock Reductions in Carbon Intensity of GDP % p.a. (2014 – 2060)
Hard Rock
Source: World Energy Council, Paul Scherrer Institute, Accenture Strategy Analysis
2014-60
4.5%
2014-30
1.0%
2030-60
1.8%
2014-60
1.5%
2DS
FIGURE 36: HARD ROCK REDUCTIONS IN CARBON INTENSITY OF GDP
Source: The World Energy Council, Paul Scherrer Institute, Accenture Strategy
THE DRIVERS OF ECONOMIC DE-CARBONISATION IN HARD ROCK ARE:
• Lower economic activity
• Energy security
2.4.4.1 Lower Economic ActivityLower economic growth results in less energy—and carbon-intensive economic activity in the US and EU, where carbon emissions fall 1.2% and 5.5% below 2014 values by 2030 and 38% and 18.1% below 2014 levels by 2060, respectively. Reductions in these regions are offset by continued growth in carbon emissions in China and India, where economic transition into heavy industry increases emissions throughout the period. In India, population growth also drives emissions upward.
2.4.4.2 Energy SecurityWith strained trade relationships, national governments accelerate the deployment of technologies that increase energy efficiency to satisfy energy demand under strict energy security considerations. As a result, solar and wind generation—increasingly seen as cheap and domestic sources of electricity—continue to proliferate, Major growth centres such as China and India revive policy support for nuclear energy as governments seek to diversify domestic sources of supply.

THE GRAND TRANSITION
81
Sector Technology Transition
Transport • Biofuels penetration in transport
Industry and Power • Coal resilient in power in China and India
• Concentrated solar, PV, wind and storage solutions
• Some electrification of energy use
• Revival of nuclear
Commercial and Residential • More efficient appliances
Non-energy use • Natural gas as a chemical feedstock in MENA and NAM
Energy Implications Hard Rock
Energy Demand • Slower economic growth dampens energy demand
• Slower efficiency gains keep consumption growth high
Market Structures • Fragmented market structures across regions
• Business models emphasise local context
Primary Energy Supply • Security-driven penetration of renewables
• Resilience of coal in the energy mix
TABLE 9: SECURITY-DRIVEN TECHNOLOGY CHOICES
TABLE 10: HARD ROCK IMPLICATIONS FOR ENERGY
Source: The World Energy Council and Accenture Strategy
2.4.5 IMPLICATIONS FOR ENERGYHard Rock’s implications for energy are summarised in Table 10 and explored in further detail in the following sections.
2.4.5.1 Energy Demand2.4.5.1.1 Final Energy ConsumptionTFC grows by 46%, averaging 0.8% p.a. from 2014 to 2060. Growth is most rapid to 2030, averaging 1.3% p.a. in the period and reaching 11,625 MTOE. Beyond 2030, consumption growth moderates, averaging 0.6% p.a. and reaching 13,717 MTOE in 2060. Industrial consumption increases as developing nations make the transition to industrialised economies using less-advanced technologies. Also driving growth is transport, as ICE technology dominates the light-duty vehicle fleet and a lack of effective mass transit build-out leads to high demand for light-duty vehicles. Residential and commercial energy demand rises more slowly as lower economic growth slows the increase in individual energy access.

82
WORLD ENERGY COUNCIL | SCENARIOS
Source: The World Energy Council, Paul Scherrer Institute, Accenture Strategy
Figure 37: Hard Rock Total Final Consumption of Energy by Sector (MTOE)
2030 20602014
9,395MTOE
11,625MTOE
13,717MTOE
Non Energy UseResidential/Commercial TransportIndustry
28% 29%
34% 9%
28% 31%
32% 9%
28% 31%
30% 11%
FIGURE 37: HARD ROCK TOTAL FINAL CONSUMPTION OF ENERGY BY SECTOR (MTOE)
2.4.5.1.2 IndustryA global slowdown in economic growth dampens the outlook for industrial sector delivered energy. Industrial demand for energy grows at a rate of 1.7% p.a. from 2014 to 2030. Beyond 2030, demand slows to 0.5% p.a. as economic growth continues to slow and maturing economies reduce energy intensity.
2.4.5.1.3 TransportWith reduced capacity for infrastructure spend, demand for personal transport remains high to 2060. The number of cars in the world grows 2.6 times in the period, reaching 1.5bn cars in 2030 and 2.9bn cars in 2060.
Reduced capacity for infrastructure build-out and lower economic growth means transport fuels are slow to diversify. Demand for petroleum-based transport fuels grows at a pace of 1.2% p.a. to 2030, dropping to 0.1% p.a. beyond 2030 as economic growth continues to slow. The economics of transport fuels favour the penetration of biofuels over natural gas and electricity; consequently, biofuels grow to account for 10% of fuels in transport by 2060. EVs and petroleum-based hybrid vehicles encompass 10% and 31%, respectively, of the global vehicle fleet. Natural gas increases its share in heavy-duty transport, to 7% of transport fuels in 2060. Table 42 summarises the fuel transition in transport from 2014 to 2060.

THE GRAND TRANSITION
83
FIGURE 38: HARD ROCK SHARE OF FUELS IN TRANSPORT (% SHARE)
Source: The World Energy Council, Paul Scherrer Institute, Accenture Strategy
2.4.5.1.4 Residential and CommercialTop-down mandates for energy conservation prove ineffective in increasing efficiencies without the supporting infrastructure investments. As a result, residential and commercial energy demand use grows by 0.8% p.a. to 2030, despite lower economic activity. From there, demand slows to 2060, averaging 0.3% p.a.
2.4.5.1.5 Non-Energy UseDemand for fuels in non-energy use increases by 1.9% p.a. from 2014 to 2030, underpinned by demand for chemicals from emerging markets such as China and India. From 2030 to 2060, as China’s and India’s economies mature, growth moderates to 0.6% p.a.
2.4.5.2 ElectricitySlower economic growth, coupled with restricted funding capacity for infrastructure build-out, reduce electricity demand early in the period. Still, the strong momentum of economic development and growing focus on domestic energy sources and efficiency boost electricity demand to a steady 1.6% p.a. to 2030. Electrification of final energy use rises from 18% in 2014 to 19% in 2030. Growth in natural gas and coal generation account for 36% and 4% of added generation in the period, respectively. Renewable energy sources reflect 26% of growth. Beyond 2030, demand for electricity slows to 1.3% p.a. to 2060. By then, the electrification of final energy consumption has reached 25%, with 20% of electricity generation coming from wind and solar plants.
Figure 39: Hard Rock Share of Fuels in Transport (% of Total Transport Demand)
206020302014
2,619MTOE
3,256MTOE
3,904MTOE
92% 90% 78%3% 1%4% 4% 2%4% 4% 1%10%7%
Oil Gas Biofuels Electricity Hydrogen

84
WORLD ENERGY COUNCIL | SCENARIOS
Source: The World Energy Council, Paul Scherrer Institute, Accenture Strategy
FIGURE 39: HARD ROCK ELECTRICITY GENERATION TWH % SHARE BY FUEL TYPE
2.4.5.3 Business Models Utility companies are at a tipping point of change as the period begins. Clean energy technology is being adopted more aggressively as prices fall. The potential for customers to deploy distributed generation without subsidies looms large. Solar PV is reaching grid parity in many regions (with subsidies). However, with slower economic growth, technology support for renewables is declining. Utilities struggle to navigate through demand disruption and many fail to effectively engage with regulators to define new models to secure long-term viability.
In developed nations, attempts to reform pricing and establish new tariff structures are unsuccessful and grid investments are waning. Lack of funding and community resistance to building slow down infrastructure investments that are critical to improving system resilience and reliability. Increasingly, consumers who need more reliable electricity generation turn to non-exporting solar and battery systems and other micro-grid solutions. Utilities face reduced demand and struggle with an overbuilt grid, sunk capital and stranded assets on both sides of the meter.
Consumer sentiments towards renewable energy vary based on socio-economic status. As rising economic inequity becomes more apparent, a divide develops between the poor who are struggling to meet their basic needs and the wealthy who are willing to pay more for clean energy.
Broadly varying challenges across regions spawn a variety of models. Large, integrated utilities work best in some regions, such as China and EUR, while in others, such as India and SSA, distributed energy solutions deliver energy to rural communities. No one business model dominates, but the most successful companies can nimbly adjust to the needs of the local context.
Figure 38: Hard Rock Electricity Generation (TWh) % Share by Resource
4%15%15%13%7%
2060
44,914TWh
3%16%13%6%3%
2030
30,605TWh
2%16%11%3%
2014
23,816 TWh
Coal Coal with CCS Oil Gas Gas with CCS Non-Fossil
Geothermal Solar Wind Nuclear Hydro Biomass Biomass with CCS
41% 4% 22% 32% 2% 25% 18% 1% 26%33% 41% 55%

THE GRAND TRANSITION
85
Source: The World Energy Council, Paul Scherrer Institute, Accenture Strategy
Figure 40: Hard Rock Primary Energy Supply (MTOE) % Share
1% 3%
18,272MTOE
16,154MTOE
13,652MTOE
Source: World Energy Council, Paul Scherrer Institute, Accenture Strategy Analysis
2014
10%3%5%
Non-Fossil Fuels
2030
10%3%6%
Non-Fossil Fuels
2060
12%3%9%7%
Non-Fossil Fuels
Other Renewables Nuclear Hydro BiomassCoal Oil Gas Non-Fossil
29% 21% 31% 19% 24% 23% 31% 22% 17% 24% 28% 31%
FIGURE 40: HARD ROCK PRIMARY ENERGY SUPPLY (MTOE) % SHARE
2.4.5.4 Energy Commodity price volatilityAn overwhelming emphasis on security leads to a steep decline in energy trade, resulting in a substantial fall in liquidity and transparency in global markets. As a result, energy commodity prices become increasingly volatile and pricing at regional hubs sees widening differentials.
2.4.5.5 Primary EnergyPopulation growth, and slow progress on energy intensity translates into TPES growth of 34% from 2014 to 2060, averaging 0.6% p.a., reaching 16,154 MTOE in 2030 and 18,272 MTOE in 2060.
Reduced funding capacity leads to lower investment in clean energy technologies, especially in transport. Many countries find they no longer can support EV incentives and renewable energy subsidies beyond 2020, leading to higher prices and lower consumer demand for new, cleaner sources of electricity and transport. Thus, the primary energy mix remains heavily dependent on fossil fuels to meet demand. From 2014 to 2030, the share of fossil fuels falls just 2 percentage points, from 81% to 79%. Accelerated progress is made from 2030 to 2060, as lower economic growth and energy security concerns increase the focus on domestic energy production. Still, fossil fuels remain the dominant source of energy, accounting for 70% of primary energy supply in 2060.
With consumption patterns remaining status quo and developing nations following the same historical energy-intensive trajectories, the reduction of energy intensity of GDP stagnates. Final energy intensity of GDP declines at a rate of 1.0% p.a. from 2014 to 2060.

86
WORLD ENERGY COUNCIL | SCENARIOS
Source: The World Energy Council, Paul Scherrer Institute, Accenture Strategy
Source: The World Energy Council, Paul Scherrer Institute, Accenture Strategy
Figure 41: Hard Rock Change in Primary Energy Intensity % p.a. (2014–60)
Source: World Energy Council, Paul Scherrer Institute, Accenture Strategy Analysis
-2.7%
SSA
-2.3%
China
-1.5%
India
-1.3%
US
-1.2%
MENA
-1.0%
APAC
-1.0%
World
-1.0%
EEUR
-0.7%
EU31
-0.2%
LAC
Figure 42: Hard Rock Coal in TPES by Region (MTOE)
3,902MTOE
3,923MTOE
3,194MTOE
2014 20602030
China India EUR LAC MENA NAM Other asia SSA
12% 11%
11% 10%
3% 52% 7% 13%
9% 17%
3% 50% 18%2%
5% 30%
8% 36%
FIGURE 41: HARD ROCK CHANGE IN PRIMARY ENERGY INTENSITY % P.A. (2014-60)
FIGURE 42: HARD ROCK COAL IN TPES BY REGION (MTOE)
2.4.5.5.1 CoalCoal demand remains resilient in India throughout the period. Chinese demand for coal peaks in 2020, at more than 2,100 MTOE. India’s demand growth is by far the largest, adding 313 MTOE of demand from 2014 to 2030 and 272 MTOE from 2030 to 2060. Declines in EUR and NAM of nearly 686 MTOE are not enough to offset this consumption growth in Asia. As a result, coal in TPES does not peak until 2040, at 4,044 MTOE.
Energy security and affordability concerns spur growth in domestic production of coal in India and other parts of Asia. India leads the way throughout the period, adding over 700 MTOE of production from 2014 to 2060.

THE GRAND TRANSITION
87
2.4.5.5.2 OilEnergy systems remain heavily dependent on oil for transport as slower economic growth and reduced financing capacity limit infrastructure build-out for an energy transition in the transport sector. Despite slowing economic growth, oil demand increases by 1.0% p.a. to 2030, due largely to increases in gasoline demand that average 1.9% p.a. Demand for oil grows in virtually every region, with China adding 4.5 mb/d, NAM adding 3.3 mb/d, India adding 2.3 mb/d and MENA and SSA each adding 1.3 and 1.2 mb/d respectively. Oil consumption peaks between 2040 and 2050 at 104 mb/d.
In the second half of the period, SSA (7.6 mb/d), India (3.1 mb/d), and Other Asia (1.3 mb/d) drive growth. Oil in TPES in major importing regions—EUR, NAM, Japan and Korea—falls by 10 mb/d.
Source: The World Energy Council, Paul Scherrer Institute, Accenture Strategy
Figure 43: Hard Rock Oil in TPES by Region (MTOE)
103mb/d
101mb/d
86mb/d
2014 20602030
China India EUR LAC MENA NAM Other asia SSA
18% 2% 13% 4%
24% 11% 8% 20%
17% 3% 15% 6%
23% 11% 8% 17%
18% 10% 14% 9%
14% 12% 8% 15%
FIGURE 43: HARD ROCK OIL IN TPES BY REGION (MTOE)
Demand for domestic energy leads to a rise in upstream exploration in resource-rich regions. Unconventional resource development continues to grow rapidly in NAM—initially led by the US, where unconventional oil rises from 4 mb/d in 2014 to 10 mb/d in 2030. Once US production peaks in 2030, Canada drives the majority of supply growth through 2060, followed by additions from Argentina and later Russia. Production peaks in 2040 at 16 mb/d, accounting for nearly 16% of global oil production.
The Middle East remains the number-one producer and exporter of oil, with production peaking in 2030 at 41 mb/d and dropping to 39 mb/d in 2060. With low oil trade and instability in the region, national governments must invest more in national economies, which reduces financing capacity for upstream operations.

88
WORLD ENERGY COUNCIL | SCENARIOS
2.4.5.5.3 GasLow economic growth and a decline in global trade lead to moderated demand growth for natural gas. Still the share of primary energy rises to 24% in 2060. Natural gas growth in TPES averages 1.1% p.a. to 2030, led by NAM and EUR who combined add 400 MTOE of gas to TPES. China and India see moderated growth, adding below 200 MTOE to TPES. Gas supply struggles to meet demand due to trade restrictions and must compete with more affordable coal. Beyond 2030, gas growth slows substantially in TPES in EUR; NAM sees a slight decline; however, China, India, MENA and LAC continue to see significant growth in natural gas demand to 2060.
Source: The World Energy Council, Paul Scherrer Institute, Accenture Strategy
Figure 44: Hard Rock Gas in TPES by Region (MTOE)
2014 20602030
4,370MTOE
2,891MTOE
3,727 MTOE
China India EUR LAC MENA NAM Other asia SSA
17% 5%1% 28%
27% 16% 5% 1%
15% 7%1% 25%4%
29% 14% 5%
13% 10%2% 7%
24% 7%15% 22%
FIGURE 44: HARD ROCK GAS IN TPES BY REGION (MTOE)
Natural Gas production growth is seen in NAM, China and MENA to 2030. NAM supply additions reflect 40% of added supplies from 2014 to 2030. Russia struggles to boost supplies in a low-trade climate, while China and NAM invest in RD&D to ensure steady domestic supplies through 2060. China and MENA lead the way from 2030 to 2060, with MENA surpassing the US as the number one producing region in 2050. Unconventional gas production grows rapidly before peaking in 2030 at 923 MTOE, reflecting 26% of global gas production in the same year. Growth is led by production in NAM, China, Australia and Argentina. As energy demand begins to slow in the second half of the period, unconventional gas production declines rapidly, settling at just 75 MTOE in 2060.
2.4.5.5.4 Non-Fossil FuelsThe role of non-fossil fuels in TPES grows by 1.7% p.a. to 2060, resulting in a boost in non-fossil fuel share to 21% of TPES in 2030 and 30% in 2060. Wind and solar, classified below under Other Renewables, post the strongest growth.
2.4.5.5.4.1 BiomassThe use of biomass as a fuel source rises 1.5 times in the period, from 1,408 MTOE in 2014 to 2,098 MTOE in 2060. Air pollution and energy security concerns position biomass well in Europe, LAC, India, China and NAM, where it plays a significant role in TPES. The largest additions of biomass in TPES are in SSA, as policy leaders there seek to improve the quality of life for a growing population.

THE GRAND TRANSITION
89
Beyond 2030, second—and third-generation biomass technologies become commercially viable, led by Chinese RD&D. National security concerns mean many nations are keen to reduce dependency on imported oil, which results in sustained growth in biomass consumption globally to 2060. Figure 38 presents a view of biofuels growth in transport to 2060, while Figure 39 summarises biomass growth in electricity generation to 2060.
2.4.5.5.4.2 HydroThe share of hydro in primary energy remains flat at 3% from 2014 to 2060, yet hydro as a fuel source in TPES grows at 1.3% p.a. to 2030. Global hydro generation grows from 3,895 TWh in 2014 to 4,825 TWh in 2030. Global installed capacity increases to more than 1,387 GW in 2030. Policy support is responsible for growth in China, where installed hydro power generation capacity reaches 379 GW. Beyond 2030, growth slows to 1.0% p.a., with most new capacity installed in Central Asia, China, LAC and SSA. In some regions, such as NAM, integration allows hydro projects to play a role as a cheap storage solution and dependable capacity to balance the intermittency of wind and solar generation. In others, reduced funding capacity and changing climate limit growth. By 2060, global electricity generation from hydro has reached 6,573 TWh. Global installed capacity has reached more than 1,860 GW. China has reached 473 GW of installed hydro capacity, followed by LAC and India, where hydro capacity rises to 262 GW and 152 GW, respectively. Figure 39 summarises of the role of hydro in electricity generation to 2060.
2.4.5.5.4.3 NuclearWith increasing national government support for domestic energy sources, nuclear in TPES grows at 2.1% p.a., reaching 9% share of TPES in 2060. Nuclear also accounts for a 15% share of electricity generation (or 6,661 TWh) and 868 GW global installed capacity in 2060. The majority of nuclear additions throughout the period are in China, reaching 138 GW in 2030 and 351 GW in 2060. India is limited by reduced funding capacity, but still reaches 111 GW in 2060. NAM and EUR keep nuclear installations relatively flat, reaching 121 GW and 177 GW, respectively, of installed capacity in 2060. In MENA, capacity additions rise to 26 GW in 2060. Figure 39 summarise of the role of nuclear in electricity generation to 2060.
2.4.5.5.4.4 Other RenewablesAs international energy trade declines, widely fluctuating oil and gas commodity prices persuade national governments to look to renewable energy as a domestic source of electricity generation. Solar, wind and geothermal generation grow more rapidly than any other fuel source in primary energy to 2060, averaging 4.2% p.a. in the period. Continued technology advances reduce capital costs for PV and concentrated solar by 40% to 50% across regions to 2060 (the range reflects the variance across regions). Cost reductions also are driven by local RD&D projects in high-demand regions with an emphasis on large installations.
As a result, solar electricity generation grows from 198 TWh in 2014 to 793 TWh in 2030, and 3,270 TWh in 2060. Solar installed capacity surpasses 919 GW by 2030 and exceeds 2,350 GW by 2060. China accounts for the largest share of capacity additions, followed by India, NAM and EUR. Wind electricity generation grows from 717 TWh in 2014 to 1,983 TWh in 2030, and 5,608 TWh in 2060. Global installed capacity of wind also grows rapidly, reaching 839 GW by 2030 and 2,221 GW by 2060. The largest additions are in China, India, EUR and NAM. Large-scale pumped hydro storage is the main source of dependable capacity to balance intermittency, but lags due to reduced capacity for funding infrastructure projects.
Geothermal energy grows 5 times in the period to 2060, attaining a 0.9% share of electricity generation in 2060. Figure 39 summarises the role of wind, solar and geothermal, classified in electricity generation in 2014, 2030 and 2060.

90
Chapter threeComparative Summary

THE GRAND TRANSITION
91
3.1 INTRODUCTION
The previous sections discussed how the world may proceed through ‘The Grand Transition’ to 2060 and established which elements are pre-determined and which create the most uncertainty. From this discussion, we identified four dimensions to define the key points of deviation across three scenarios: Modern Jazz, Unfinished Symphony and Hard Rock. Each of these scenarios results in distinct outcomes for the future of energy, which we explored in detail for each scenario. In this next section, we also consider the future of the environment and social developments through a comparative analysis that explores how each scenario evolves across six characteristics that best highlight the differences in economic, energy and climate outcomes:
• Efficiency
• Mix of Resources
• Carbon Emissions
• Adaptation and Resilience
• Energy Trilemma
• Energy, Water and Food Nexus (EWF)
3.2 EFFICIENCY
Modern Jazz, Unfinished Symphony and Hard Rock have distinctly different economic growth trajectories, and each trajectory is uniquely shaped by the use of policy, technology, and international governance frameworks. Population—and, to differing extents, productivity and income—increase energy demand to 2060. However, economic transition and efficient technologies play the biggest role in reducing the amount of energy needed for economies and lifestyles. As a result, TPES per capita peaks before 2030 in all three scenarios.
In Modern Jazz, higher economic growth increases energy demand, but technology deployment sharply reduces energy intensity, which moderates the pace of growth. Less energy-intensive economic growth and development pathways emerge for both developed and developing economies, resulting in substantial efficiency gains in both primary and final energy consumption.
Unfinished Symphony experiences the lowest growth in energy demand due to both moderated economic growth and strong gains in energy intensity reductions. Top-down mandates and policy incentives force economies to become increasingly efficient.
As a result of slower economic growth and reduced global cooperation, Hard Rock reduces energy intensity the least to 2060. The global economic climate leads to lower technology transfer as well as less funding capacity for more efficient infrastructure and new technology implementation. Economies are also slower to overcome technology learning curves.
Figure 45 compares the per annum change seen in GDP Growth, Energy Intensity of GDP, and Primary Energy Demand from 2014 to 2060.

92
WORLD ENERGY COUNCIL | SCENARIOS
Source: The World Energy Council, Paul Scherrer Institute and Accenture Strategy
Figure 45: GDP Growth, Primary Energy Intensity, Primary Energy Demand % p.a. (2014-60)
Modern Jazz Unfinished Symphony Hard Rock
GDP Energy intensity of GDP Primary energy
3.3%2.9%
1.7%
-2.7% -2.6%
-1.0%
0.5%0.2%
0.6%
FIGURE 45: GDP GROWTH, PRIMARY ENERGY INTENSITY, PRIMARY ENERGY DEMAND % P.A. (2014-60)
3.2.1 ELECTRIFICATION OF ENERGYChanges in the energy mix enable the electrification of energy through the deployment of renewable technologies which, in turn, substantially increases efficiency across all three scenarios. Conversion rates for renewable energy sources are much higher than those for fossil fuel plants, which means less energy is needed from the primary source. Modern Jazz and Unfinished Symphony post the most impressive gains in electrification of TFC: 28% and 29%, respectively, in 2060.
The rapid installation of wind and solar plants support electrification of energy systems. In 2060, solar installed capacity ranges from 4,005 GW in Modern Jazz to 4,707 GW in Unfinished Symphony. Heavy RD&D investments in both scenarios reduce the investment cost for solar installations by more than 70% per KWh. Wind installed capacity ranges from 3,130 GW in Modern Jazz to 3,415 GW in Unfinished Symphony. Both scenarios rely on storage technology innovation to achieve these additions. Modern Jazz sees the rise of smart grid technologies for distributed energy systems with battery storage solutions. Unfinished Symphony uses smart grid technologies with grid integration and large-scale solutions such as pumped hydro to manage intermittency.
In Hard Rock, limited funding capacity leads to lower infrastructure build and slower-paced improvements in the technology learning curve. A lack of policy support and less-favourable economics mean wind and solar additions are roughly half of the volumes in Modern Jazz and Unfinished Symphony. Solar capacity reaches just 2,357 GW and wind capacity 2,221 GW in 2060. Figure 46 summarises how renewable energy sources lead to disruptive changes in electricity generation from 2014 to 2060 for each scenario.

THE GRAND TRANSITION
93
Source: The World Energy Council, Paul Scherrer Institute, Accenture Strategy
Figure 46: Global Electricity Generation (TWh)
23,816 TWh
16%11%3%
2014
2%
Modern Jazz: 2060
48,491TWh
14%10%18%12% 5%
4%15%15%13%7%
44,914TWh
Hard Rock: 2060
5%16%17%21%18%
44,474TWh
Unfinished Symphony: 2060
Coal
Geothermal
Coal with CCS
Oil Gas
Gas withCCS
Non-Fossil
Solar
Wind Nuclear
Hydro Biomass
Biomasswith CCS
41% 4% 22% 33%
2% 2% 15% 81% 18% 1% 26% 55%
6% 22% 10% 60%
FIGURE 46: GLOBAL ELECTRICITY GENERATION (TWH)
3.2.2 DIVERSIFICATION OF TRANSPORTThe diversification of transport has the biggest impact on increasing energy efficiency in transport systems. Changes in transport demand are most starkly reflected in the light-duty vehicle fleet. In all three scenarios, this fleet grows substantially from 1.1bn units in 2013, to a range of 2.8-3.0bn vehicles in 2060. In Modern Jazz and Unfinished Symphony, this growth is marked by a transition from a heavily ICE technology-dependent mix to one with diverse options that include EV, hybrid and natural gas.
Headway is made through differing mechanisms. In Modern Jazz, higher GDP per capita, consumer preferences, and growing availability of vehicle-charging infrastructure through distributed energy systems increase alternative transport solutions penetration. Conversely, in Unfinished Symphony, government support schemes and integrated city planning reduce the number of vehicles overall, as well as the penetration of alternative transport solutions, especially in urban areas. With less infrastructure build-out, Hard Rock sees less penetration of alternative fuels. Figure 47 summarises the changes in the light-duty vehicle fleet.

94
WORLD ENERGY COUNCIL | SCENARIOS
3.3 MIX OF RESOURCES
Differentiated policy mechanisms and economic growth trajectories across Modern Jazz, Unfinished Symphony and Hard Rock translate into wide variations in the mix of resources used to meet energy demand. In all three scenarios, the share of non-fossil fuel sources in primary energy increases sharply; however, the degree of penetration is strongest in Unfinished Symphony, where non-fossil fuel sources meet 50% of primary energy demand in 2060. Natural gas assumes a much larger role in Modern Jazz, while the resilience of coal dampens growth in renewable energy sources in Hard Rock. Figure 48 and Table 11 summarise the changes in the primary energy mix from 2014 to 2060 across the three scenarios.
16,085MTOE
Figure 48: Energy Mix in 2060
2014
Unfinished Symphony: 2060
13,652MTOE
10%3%5%1%
Modern Jazz: 2060
16%3%8%10%
19%4%13%13%
15,085MTOE
Hard Rock: 2060
17%
12%3%9%7%
18,272MTOE
Other Renewables
29% 31% 19%21%
5% 22% 49%24% 17% 28% 31%24%
11% 23% 37%29% Coal
Oil
Gas
Non-Fossil
Nuclear Hydro
Biomass
FIGURE 48: PRIMARY ENERGY MIX (2014-60)
Source: The World Energy Council, Paul Scherrer Institute and Accenture Strategy
Figure 47: Diversification of Light Duty Vehicle Fleet in 2010 and 2060
EV/Plug-in Hybrid Hydrogen Natural Gas Petroleum products(excludes hybrids)
Petroleum product hybrid
3.0 bncars
2.8 bncars
2.9 bncars
Modern Jazz2060
Unfinished Symphony2060
Hard Rock2060
29% 26%
34% 10% 1%
24% 32%
34% 9% 1%
31% 12%2%10%
45%
FIGURE 47: DIVERSIFICATION OF LIGHT-DUTY VEHICLE FLEET IN 2010 AND 2060

THE GRAND TRANSITION
95
Source: The World Energy Council, Paul Scherrer Institute and Accenture Strategy
16,085MTOE
Figure 48: Energy Mix in 2060
2014
Unfinished Symphony: 2060
13,652MTOE
10%3%5%1%
Modern Jazz: 2060
16%3%8%10%
19%4%13%13%
15,085MTOE
Hard Rock: 2060
17%
12%3%9%7%
18,272MTOE
Other Renewables
29% 31% 19%21%
5% 22% 49%24% 17% 28% 31%24%
11% 23% 37%29% Coal
Oil
Gas
Non-Fossil
Nuclear Hydro
Biomass
Systemic Risks Modern Jazz Unfinished Symphony Hard Rock
Non-Fossil Fuels
• Accelerated by technology innovation and supporting policies
• Accelerated by top-down mandates
• Nuclear and hydro more significant
• Driven by demand for domestic energy production
• Nuclear and hydro more significant
Oil • Demand peaks in 2030 at 103 mb/d
• Diversification of transport fuels
• Demand peaks in 2030 at 94 mb/d
• Lower demand and diversification of transport fuels
• Demand peaks between 2040-50 at 104 mb/d
• Status quo technologies
Gas • No. 2 fuel in 2030
• Growing share in transport and power
• Cheapest emissions reduction
• No. 2 fuel in 2030
• CCS mandate by 2050 depresses demand
• Trade restrictions
• Unconventional gas driven by energy security
Coal • Demand peaks before 2020
• Falls to no. 3 fuel in 2030
• Demand peaks before 2020
• Falls to no. 3 fuel in 2030
• Demand peaks in 2040
• Remains no. 2 fuel in 2030
TABLE 11: SUMMARY OF SHIFTS IN TPES BY RESOURCES
Source: The World Energy Council, Paul Scherrer Institute and Accenture Strategy

96
WORLD ENERGY COUNCIL | SCENARIOS
With the Kaya Identity, we can deconstruct the factors that influence the GHG emissions outcomes in each scenario . If we focus on CO₂ emissions from energy, we can decompose total CO₂ emissions to the product of individual factors explicitly linked to energy consumption, GDP and population as outlined in Table 12 and Equation 1.
3.4 CARBON EMISSIONS
Shifts in energy intensity and the primary energy mix substantially reduce global climate emissions in Modern Jazz and Unfinished Symphony. Hard Rock struggles to address the climate challenge.
Source: The World Energy Council, Paul Scherrer Institute, Accenture Strategy
Figure 49: Global Carbon Emissions (GtCO2/yr)
Gt CO2/ year
10
5
0
15
20
25
30
35
40
2014 2020 2030 2040 2050 2060
Modern Jazz Unfinished Symphony Hard Rock IPCC RCP 2.6
FIGURE 49: GLOBAL CARBON EMISSIONS (GTCO₂/YR)

THE GRAND TRANSITION
97
No. Kaya Variable Formula Unit of Measure
1. Energy Mix Carbon emissions/TPES GtCO₂/EJ
2. Energy Intensity TPES/GDP MJ/USD2010
3. GDP per Capita GDP/Population 1000 USD2010
4. Population Population Billions
TABLE 12: DEFINING THE KAYA IDENTITY FACTORS
EQUATION 1: KAYA INDEX
Carbon Emissions (GtCO₂) = (CO₂/TPES) × (TPES/GDP) × (GDP/POP) × POP
Source: IPCC 2016
Interpreting the performance of the three scenarios across the Kaya Identity Factors reveals just how important two factors are to the carbon emissions outcomes of Modern Jazz and Unfinished Symphony: the reduction of energy intensity of GDP and carbon intensity of primary energy. Figure 50 summarises the differences in carbons emissions reduction from 2014 to 2060 across the three scenarios. Table 13 explores the % change p.a. across the Kaya Identity factors for each scenario.
Source: The World Energy Council, Paul Scherrer Institute and Accenture Strategy
Figure 50: CO2 Emissions in 2010 and 2060 (GtCO2/yr)
32.4
2014
23.2
2060
32.4
2014
-61%-28% 5%
12.6
2060
32.4
2014
34.1
2060
Modern Jazz Unfinished Symphony Hard Rock
FIGURE 50: CO₂ EMISSIONS IN 2010 AND 2060 (GTCO₂/YR)

98
WORLD ENERGY COUNCIL | SCENARIOS
% ∆ in Kaya Identity Variables from 2014 to 2060
No. Kaya Variable Modern Jazz Unfinished Symphony Hard Rock
1. Energy Mix -1.2% -2.2% -0.5%
2. Energy Intensity -2.7% -2.6% -1.0%
3. GDP per Capita 2.5% 2.1% 0.9% p.a.
4. Population 0.7% 0.7% 0.7%
TABLE 13: KAYA IDENTIFY FACTORS % P.A CHANGE FOR EACH SCENARIO (2014-60)
Source: The World Energy Council, Paul Scherrer Institute and Accenture Strategy
From 2014 to 2060, population and economic factors increase carbon emissions in all three scenarios. These effects are by far strongest in Modern Jazz, as GDP per capita more than doubles in the period and technology-dependent lifestyles require more energy. Still, Modern Jazz achieves an overall reduction of 28% in carbon emissions from 2014 to 2060 largely by deploying technologies that strongly reduce energy intensity and the carbon intensity of TPES.
Unfinished Symphony experiences the strongest reductions in the carbon intensity of energy, averaging 2.2% p.a. from 2014 to 2060. Energy intensity also declines by 2.6% p.a. Combined, these factors cause global carbon emissions in 2060 to fall to 61% below 2014 values.
In Hard Rock, overall emissions rise by 5%, despite lower upward pressure from economic growth. Reductions in carbon and energy intensity are less than half of those in the other two scenarios.
Despite lower economic growth in Hard Rock, rapid technology innovation in Modern Jazz and coordinated policy action in Unfinished Symphony, none of the three scenarios is positioned to achieve the target defined in Article 2 of the Paris agreement to keep warming below 2°C. Modern Jazz and Hard Rock are in line for 3°C of warming in 2060 and Unfinished Symphony is headed towards warming slightly above 2. Future technology breakthroughs will be needed to stay below the 2°C threshold. These breakthroughs will require the effective deployment of both policy and market mechanisms that strike a balance between achieving sustainable economic models while delivering positive environmental and social outcomes.

THE GRAND TRANSITION
99
3.5 ADAPTATION AND RESILIENCE
3.5.1 CLIMATE CHANGE IMPACTSAdaptation to the adverse effects of warming temperatures is vital to prepare for the impacts of climate change. The frequency, severity and exposure of energy systems to extreme weather events are already increasing. Because much of the world’s current energy infrastructure is not designed to handle such extreme conditions (such as extended high temperatures, blistering “snow-mageddons” and prolonged periods of drought), current structures must be re-evaluated.
Source: World Energy Council, 2015: World Energy Perspectives: The road to resilience − managing and financing extreme weather risks, pg. 8
Figure 52: Weather's Changing Impact on Energy Infrastructure
Oil & Gas assets Tropical cyclones and hurricanes can damage assets ans reduce production rates.
Oil & Gas pipelinesThawing permafrost, floods and landslides can affect the asset itself, pipeline flow and associated revenue.
Transmission and distribution Strong winds and ice-storms can damage above ground T&D lines and affect associated revenue streams.
RenewablesStrong winds, storms and increased cloud conditions can result in equipment damage, erratic output, and lost revenue.
Thermal electricity generation Floods, storms and cyclones can damage equipment and restrict generation. Rising air and water temperatures affect thermal efficiency, with impacts on cost and revenue.
HydropowerHydropower plants are highly vulnerable to changes in the hydrologic cycle, including water stress, drought, floods, cyclones and higher temperatures. Equipment can be damaged and output reduced.
Nuclear Storms, cyclones, water stress, floods or increasing water temperatures may damage or disrupt critical equipment and affect generation output.
Source: Financing Resilient Infrastructure, pg. 8
FIGURE 51: WEATHER’S CHANGING IMPACT ON ENERGY INFRASTRUCTURE
Unfortunately, it is difficult to quantify and address the impacts of climate change, and the adaptation to it, on a global scale, as the impacts are highly regionalised and political. However, the cost of the challenge is global in scale.
These difficulties are emphasised in the global scenarios in various ways. First, in all three scenarios, there are regions in which governments cannot cover the costs of ensuring secure and reliable energy systems that meet current and future energy demand, while concurrently being able to withstand the impact of extreme weather events. In all three scenarios, climate change continues to cause significant physical, economic and reputational damage to energy companies, project developers, banks and the financial services sector through 2060. Displacement of communities due to sea-level rise becomes increasingly common, with some high-risk regions becoming uninsurable (e.g. Florida and Mississippi in the US).
Countries initially approach adaptation on a case-by-case basis, and typically develop highly localised solutions. However, Modern Jazz benefits from open markets and access to information, which help rapidly spread technologies and best practices needed to adapt to the impacts of climate change in all regions.

100
WORLD ENERGY COUNCIL | SCENARIOS
Additionally, the private sector plays a significant role in financing adaptation. Economic losses encourage insurance companies and investors to push for modelling tools that support planning and implementation of new measures for infrastructure projects. Models also make possible new methods for pricing the risks of both climate—and non-climate-related catastrophic events. Once the value of resilience is quantifiable, insurance companies and banks can step in to create unique financial vehicles to finance efforts to fill infrastructure gaps.
The Unfinished Symphony scenario, on the other hand, emphasises mitigation as a higher priority than adaptation. Yet even with strong, unified action on mitigation, the world still cannot avoid physical damage from climate—and non-climate-related events. National governments use long-term strategic planning and dynamic modelling capabilities to enable energy investments that more fully reflect extreme weather’s risks in project financing. Risk management capabilities are transformed, resulting in more robust infrastructure development and, ultimately, reductions in costs. Table 14 summarises the performance of each scenario on adaptation.
Modern Jazz Unfinished Symphony Hard Rock
Financing capacity for adaptation
High Moderate Low
Action on adaptation
High High Moderate
Actions Taken to Adapt to and/or Mitigate Climate Change Impacts
• Drives adaptation / mitigation from a local level
• Global proliferation of adaptive technology and best practices
• Private sector financing
• Drives mitigation efforts from the government level downward
• National governments drive asset and infrastructure adaptation as a part of a larger mitigation strategy
• Drives adaptation / mitigation from a local level
• Independently creates highly localised solutions
TABLE 14: ADAPTATION AND RESILIENCE PERFORMANCE
Source: The World Energy Council and Accenture Strategy

THE GRAND TRANSITION
101
3.5.2 CYBER SECURITYThe increasing interconnection and digitisation of the energy sector (including smart grids, smart devices and the growing Internet of Things) improves the industry’s operational efficiency. However, the critical role of the energy sector in the functioning of a modern economy also makes it a highly attractive target for cyber-attacks geared to disrupt operations, and intensifies the complexities of the cyber risk management landscape.
As the period begins, cyber threats (as highlighted in the 2016 World Energy Council issues monitor) are among the top concerns for energy leaders, especially in countries with high infrastructure maturity (i.e., NAM, EUR). In these regions, energy leaders increasingly recognise the importance of viewing cyber-attacks as a core threat to business continuity, and place a high degree of importance on creating an organisation-wide cyber awareness culture that extends beyond traditional IT departments.
Cyber exposures in the energy sector present particular concerns due to the potential of an attack crossing from the cyber realm to the physical world if a cyber-attacker were able to create a massive operational failure of an energy asset. Large, centralised infrastructures are particularly at risk due to the potential ‘domino’ damage that an attack on a nuclear, coal, or oil plant could cause.
In Modern Jazz and Unfinished Symphony, technology vendors play a critical role in making the energy infrastructure more resilient. Technology developers increasingly establish security standards that are built into the products they deliver, reducing the risks to remote monitoring and control systems and the vulnerability of attack within energy operations. Employee awareness of cyber vulnerabilities is a top priority in an effective cyber-security strategy.
While Unfinished Symphony governments implement increasingly stringent cyber security requirements and oblige companies to assess their own cyber practices, Modern Jazz governments see the rise of a sort of cyber insurance to help offset the potential financial losses from a cyber-attack, such as:
• The cost to restore data or upgrade systems affected
• Regulatory fines
• Costs of business interruption
• Potentially associated liability
The process of applying for cyber insurance in itself encourages good behaviour because it requires companies to assess their own cyber practices. Additionally, a clear focus on identifying the critical assets to be insured helps the market overall.
Finally, in Hard Rock, a growing discontent among society with the status quo exacerbates cyber risk, which instigates more cyber-attacks. Governments and companies increasingly recognise cyber as a core risk; however, information sharing on cyber experiences is limited amongst industry members and across sectors. A lack of information sharing reduces comprehension of the impact of cyber risks in energy companies and in the energy sector as a whole.

102
WORLD ENERGY COUNCIL | SCENARIOS
Modern Jazz Unfinished Symphony Hard Rock
Cyber Attack Vulnerability Rating
Moderate Low High
Drivers of Cyber Security
• Technology vendors increase software / hardware security standards
• Private sector drives good security behaviours and compliance through economic incentives
• Technology vendors increase software / hardware security standards
• Government drives good security behaviours and compliance through regulations and fines
• Private and public sectors work independently to develop personalised solutions
• Limited transparency regarding threats and risks
TABLE 15: CYBER SECURITY PERFORMANCE
Source: The World Energy Council and Accenture Strategy
3.6 ENERGY TRILEMMA
The World Energy Council’s definition of energy sustainability is based on three core dimensions: energy security, energy equity, and environmental sustainability. Balancing these three critical but sometimes conflicting goals is what the World Energy Council defines as the ‘energy trilemma’.
In the following section, we use the Energy Trilemma Framework to assess the performance of Modern Jazz, Unfinished Symphony and Hard Rock, using indicators for each of the energy sustainability dimensions. Figure 52 summarises the key components of The Energy Trilemma.
Source: The World Energy Council
Figure 51: The Energy Trilemma
Equity• Access to electricity• Rate of electrification
Environment• Energy intensity• CO2 emissions
Security• Depletion of non-renewable resources• Diversity of primary energy supply• Share of imports• Total energy consumption
Energy equity
Environmental sustainability
Energy security
FIGURE 52: THE ENERGY TRILEMMA
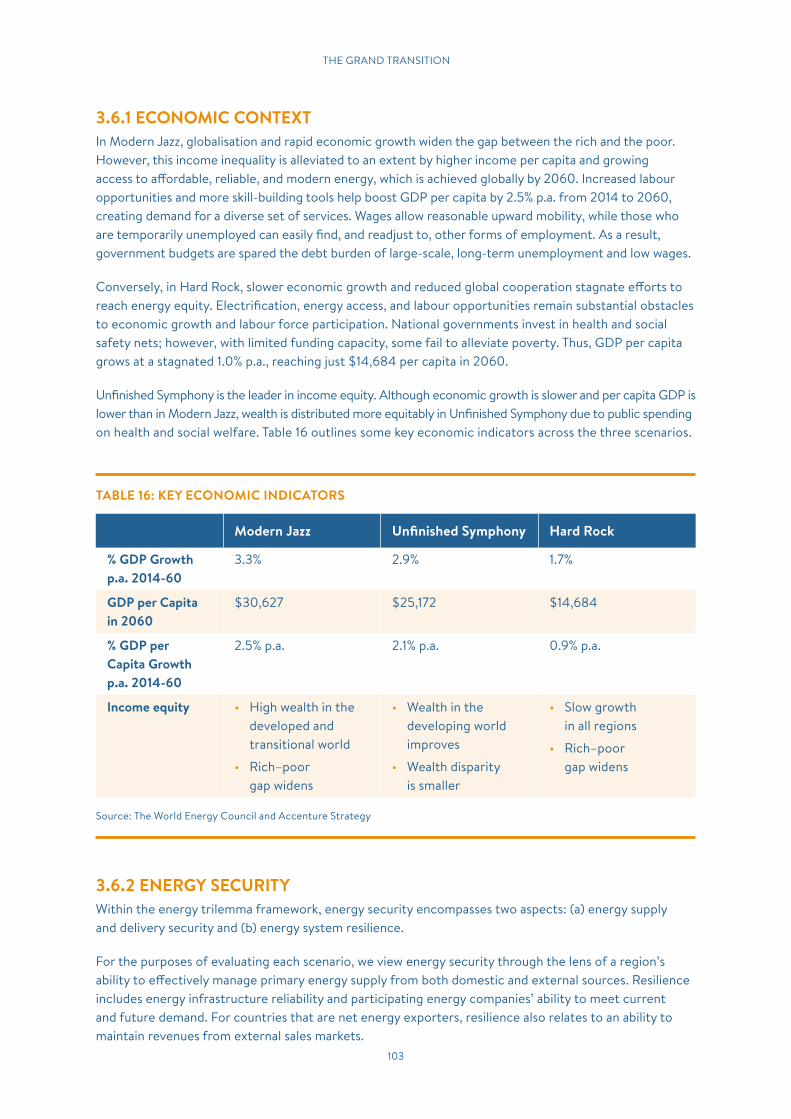
THE GRAND TRANSITION
103
3.6.1 ECONOMIC CONTEXTIn Modern Jazz, globalisation and rapid economic growth widen the gap between the rich and the poor. However, this income inequality is alleviated to an extent by higher income per capita and growing access to affordable, reliable, and modern energy, which is achieved globally by 2060. Increased labour opportunities and more skill-building tools help boost GDP per capita by 2.5% p.a. from 2014 to 2060, creating demand for a diverse set of services. Wages allow reasonable upward mobility, while those who are temporarily unemployed can easily find, and readjust to, other forms of employment. As a result, government budgets are spared the debt burden of large-scale, long-term unemployment and low wages.
Conversely, in Hard Rock, slower economic growth and reduced global cooperation stagnate efforts to reach energy equity. Electrification, energy access, and labour opportunities remain substantial obstacles to economic growth and labour force participation. National governments invest in health and social safety nets; however, with limited funding capacity, some fail to alleviate poverty. Thus, GDP per capita grows at a stagnated 1.0% p.a., reaching just $14,684 per capita in 2060.
Unfinished Symphony is the leader in income equity. Although economic growth is slower and per capita GDP is lower than in Modern Jazz, wealth is distributed more equitably in Unfinished Symphony due to public spending on health and social welfare. Table 16 outlines some key economic indicators across the three scenarios.
Modern Jazz Unfinished Symphony Hard Rock
% GDP Growth p.a. 2014-60
3.3% 2.9% 1.7%
GDP per Capita in 2060
$30,627 $25,172 $14,684
% GDP per Capita Growth p.a. 2014-60
2.5% p.a. 2.1% p.a. 0.9% p.a.
Income equity • High wealth in the developed and transitional world
• Rich–poor gap widens
• Wealth in the developing world improves
• Wealth disparity is smaller
• Slow growth in all regions
• Rich–poor gap widens
TABLE 16: KEY ECONOMIC INDICATORS
Source: The World Energy Council and Accenture Strategy
3.6.2 ENERGY SECURITYWithin the energy trilemma framework, energy security encompasses two aspects: (a) energy supply and delivery security and (b) energy system resilience.
For the purposes of evaluating each scenario, we view energy security through the lens of a region’s ability to effectively manage primary energy supply from both domestic and external sources. Resilience includes energy infrastructure reliability and participating energy companies’ ability to meet current and future demand. For countries that are net energy exporters, resilience also relates to an ability to maintain revenues from external sales markets.
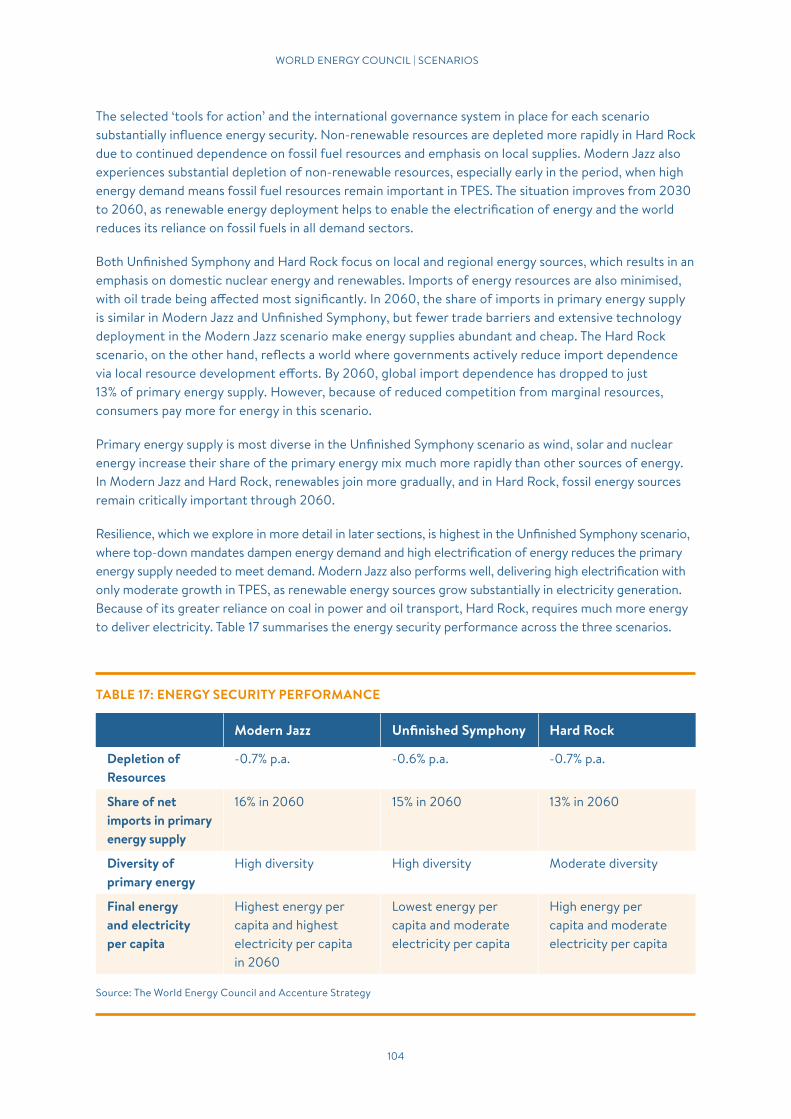
104
WORLD ENERGY COUNCIL | SCENARIOS
The selected ‘tools for action’ and the international governance system in place for each scenario substantially influence energy security. Non-renewable resources are depleted more rapidly in Hard Rock due to continued dependence on fossil fuel resources and emphasis on local supplies. Modern Jazz also experiences substantial depletion of non-renewable resources, especially early in the period, when high energy demand means fossil fuel resources remain important in TPES. The situation improves from 2030 to 2060, as renewable energy deployment helps to enable the electrification of energy and the world reduces its reliance on fossil fuels in all demand sectors.
Both Unfinished Symphony and Hard Rock focus on local and regional energy sources, which results in an emphasis on domestic nuclear energy and renewables. Imports of energy resources are also minimised, with oil trade being affected most significantly. In 2060, the share of imports in primary energy supply is similar in Modern Jazz and Unfinished Symphony, but fewer trade barriers and extensive technology deployment in the Modern Jazz scenario make energy supplies abundant and cheap. The Hard Rock scenario, on the other hand, reflects a world where governments actively reduce import dependence via local resource development efforts. By 2060, global import dependence has dropped to just 13% of primary energy supply. However, because of reduced competition from marginal resources, consumers pay more for energy in this scenario.
Primary energy supply is most diverse in the Unfinished Symphony scenario as wind, solar and nuclear energy increase their share of the primary energy mix much more rapidly than other sources of energy. In Modern Jazz and Hard Rock, renewables join more gradually, and in Hard Rock, fossil energy sources remain critically important through 2060.
Resilience, which we explore in more detail in later sections, is highest in the Unfinished Symphony scenario, where top-down mandates dampen energy demand and high electrification of energy reduces the primary energy supply needed to meet demand. Modern Jazz also performs well, delivering high electrification with only moderate growth in TPES, as renewable energy sources grow substantially in electricity generation. Because of its greater reliance on coal in power and oil transport, Hard Rock, requires much more energy to deliver electricity. Table 17 summarises the energy security performance across the three scenarios.
Modern Jazz Unfinished Symphony Hard Rock
Depletion of Resources
-0.7% p.a. -0.6% p.a. -0.7% p.a.
Share of net imports in primary energy supply
16% in 2060 15% in 2060 13% in 2060
Diversity of primary energy
High diversity High diversity Moderate diversity
Final energy and electricity per capita
Highest energy per capita and highest electricity per capita in 2060
Lowest energy per capita and moderate electricity per capita
High energy per capita and moderate electricity per capita
TABLE 17: ENERGY SECURITY PERFORMANCE
Source: The World Energy Council and Accenture Strategy

THE GRAND TRANSITION
105
Modern Jazz Unfinished Symphony Hard Rock
Population without access to electricity
• 100% of people have access to electricity by 2060
• Distributed systems fill infrastructure gap
• 0-500mn people without access to electricity
• 500mn-1bn people do not have access to electricity
GDP per Capita vs TPES/GDP
• Highest GDP per capita vs. Lowest Energy Intensity in 2060
• Moderate GDP per capita vs. Low Energy Intensity in 2060
• Low GDP per capita vs. High Energy Intensity in 2060
TABLE 18: ENERGY EQUITY PERFORMANCE IN 2060
Source: The World Energy Council and Accenture Strategy
3.6.3 ENERGY EQUITYAs the period begins, one in five people lack access to electricity, and energy leaders globally face continued population growth and pressure to increase energy production across the world to meet demand. In all three scenarios, national governments set out to achieve universal energy access, but by 2060, energy accessibility and affordability varies substantially across the three scenarios.
Strong economic growth in Modern Jazz makes funding for the UN Sustainable Development Goals readily available. Innovation in distributed solar, wind and gas solutions enable leapfrogging of infrastructure hurdles in developing economies. Support from social enterprises and wealthy entrepreneurs help spur rapid new-technology deployment in developing countries. By 2060, the world has met its goal of delivering access to affordable, reliable, sustainable and modern energy for all.
In Unfinished Symphony, while economic growth is more equitable, an emphasis on environmental sustainability and energy security stunts energy access’s progress. Top-down mandates dampen energy demand and reduce electricity consumption on a per capita basis. In Hard Rock, poor economic performance and a dearth in funding capacity for new energy projects hinders energy equity. As a result, households in rural communities still struggle to access affordable energy, and an estimated 0.5bn to 1.0bn people do not have access to reliable energy in 2060. Table 18 summarises the energy equity performance across the three scenarios in 2060.

106
WORLD ENERGY COUNCIL | SCENARIOS
Modern Jazz Unfinished Symphony Hard Rock
% ∆ in CO₂ intensity of primary energy 2014-60
-1.2% p.a. -2.2% p.a. -0.5% p.a.
CO₂ emissions (GtCO₂)
1,491 GtCO₂ from 2014 to 2060
1,165 GtCO₂ from 2014 to 2060
1,642 GtCO₂ from 2014 to 2060
Carbon Capture, Use and Storage (CCUS)
3.6 GtCO₂/yr. by 2060
4.8 GtCO₂/yr. by 2060
0.0 GtCO₂/yr. by 2060
TABLE 19: ENVIRONMENTAL SUSTAINABILITY PERFORMANCE IN 2060
Source: The World Energy Council and Accenture Strategy
3.6.4 ENVIRONMENTAL SUSTAINABILITYTwo elements define environmental sustainability: achieving efficiencies in both energy supply and demand, and developing energy supply from renewable and other low-carbon sources. While none of the scenarios mitigate carbon sufficiently to hold global temperatures well below 2°C (according to the Paris Agreement), the Unfinished Symphony Scenario makes significant strides in abating CO₂ emissions by reducing carbon emissions at rate of -1.6% p.a. throughout the period. This translates to a 61% reduction in carbon emissions from 2014 to 2060.
Modern Jazz also makes progress in mitigating carbon through energy efficiency gains and electrification. However, with rapid economic growth comes a continued growth in energy demand and, consequently, less energy system decarbonisation.
In Hard Rock, the climate issue fails to attract capital because low economic growth has reduced investment capacity. The carbon intensity of energy declines more slowly as a result of disparate standards and fragmented markets, which lead to reduced technology transfer and fewer options for industries and governments to reduce carbon emissions. Table 19 summarises the environmental performance of all three scenarios to 2060.

THE GRAND TRANSITION
107
3.7 ENERGY, WATER AND FOOD
The energy industry is the second-largest consumer of freshwater after agriculture. Water is used all along the energy value chain in primary energy production (coal, oil, gas, and biofuels) and in power generation (hydro and cooling). Due to population and energy demand growth, the world will experience greater water stress as early as 2020 in all three scenarios.
Many regions that are water stressed today will also experience significant economic development, population growth and changing consumption patterns. In urban areas, a higher concentration of people and assets will create additional pressure on existing infrastructure and resources. Figure 53 summarizes the average exposure of water users in each country to water stress and the ratio of total withdrawals to total renewable supply in a given area. A higher percentage means more water users are competing for limited supplies.
Source: The World Energy Council, 2016
Figure 53: WEC Water Stress map
Extremely high stress >80%
High stress 40 to 80%
Medium to high stress 20 to 40%
Low to medium stress 10 to 20%
Low stress <10%
Water Stress
FIGURE 53: AVERAGE GLOBAL WATER STRESS (2016)
Water stress is compounded by growing uncertainty about water availability and quality—which is driven by climate change impacts such as decreased freshwater volumes, increased ocean temperatures and more extreme weather. Less usable water capacity has a negative economic impact not only on a substantial proportion of hydropower plants and thermal electric power plants, but also industrial and agricultural sectors.

108
WORLD ENERGY COUNCIL | SCENARIOS
Governments and companies respond in substantially different ways across the three scenarios. In Modern Jazz, companies make significant RD&D investments in solving issues around energy, water and food innovation. For example, breakthrough technologies help to enable companies to produce more food with less water and energy. Supported by social enterprises and philanthropic investors, these technologies are deployed all over the world. However, the problem is not universally addressed, and millions of people must migrate to locations with improved water sources.
In Unfinished Symphony, governments respond to water stress with increasingly sound water governance systems such as well-defined water rights for competing users, water pricing and trading arrangements. Additionally, governments increasingly use technology for smart planning; for example, using modelling tools to adequately reflect energy, water and food needs in urban areas, and risks posed to food and water in energy infrastructure investment decisions. Furthermore, strong regional integration facilitates cross-border cooperation on international trans-boundary basins.
In Hard Rock, water-stressed regions are forced to ration water supplies. Local solutions vary by region, and technological innovation spurs progress in some regions. For example, in the Middle East, Saudi Aramco can transform the completion process for unconventional gas wells, drastically reducing water consumption in the process. However, because of limited trade and international cooperation, technology transfer is insufficient to deploy technologies universally, so millions of people continue to struggle with water stress throughout the period. Table 20 summarises performance on managing the EWF to 2060.
Modern Jazz Unfinished Symphony Hard Rock
Water Availability Score
Moderate High Moderate
Water Quality Score
Moderate High Moderate
Global Water Stress Score
Moderate High Moderate
Global Connectivity Rating
High global integration
Highest global integration
Low global integration
Actions taken to mitigate impacts
• RD&D and technology deployment
• Advanced risk assessment including climate and hydrological impacts
• Measures to minimise finance cost
• Regulatory framework for water governance
• Improved planning policies and regulations
• Technological innovations
• Cross-border cooperation
• Local solutions
• Local technological innovation
TABLE 20: ENERGY WATER FOOD NEXUS PERFORMANCE
Source: The World Energy Council and Accenture Strategy

109
Chapter fourAppendix

110
WORLD ENERGY COUNCIL | SCENARIOS
LIST OF FIGURES
Figure 1: Factors that shaped world energy ....................................................................................................... 15
Figure 2: Energy Use and Income Per Capita (1990-2015) .............................................................................. 17
Figure 3: World Labour Force Growth (% p.a.) .................................................................................................. 20
Figure 4: Planetary Boundaries ........................................................................................................................... 22
Figure 5: Global Productivity Growth % p.a. (1970-2060) .............................................................................. 23
Figure 6: Global Power Index ............................................................................................................................... 25
Figure 7: Climate Change Challenge .................................................................................................................. 26
Figure 8: The Grand Transition and three scenarios .......................................................................................... 30
Figure 9: Summarising The Grand Transition ...................................................................................................... 33
Figure 10: Modern Jazz Digital disruption of incumbent organizations across all industry sectors ......... 36
Figure 11: Modern Jazz GDP Growth % p.a. (2014-60) ..................................................................................... 36
Figure 12: Modern Jazz Reductions in Carbon Intensity of GDP % p.a. (2014– 60) ..................................... 41
Figure 13: Modern Jazz Total Final Consumption of Energy by Sector (MTOE) % Share ........................... 43
Figure 14: Modern Jazz Share of Fuels in Transport (% Share) .......................................................................44
Figure 15: Modern Jazz Electricity Generation TWh % Share by Fuel Type ................................................. 45
Figure 16: Modern Jazz Cause and Effect of Distributed Energy Systems ................................................... 46
Figure 17: Modern Jazz Primary Energy Supply (MTOE) % Share ................................................................... 48
Figure 18: Modern Jazz Change in Primary Energy Intensity % p.a. (2014–60) .......................................... 48
Figure 19: Modern Jazz Coal in TPES by Region (MTOE) % Share .................................................................. 49
Figure 20: Modern Jazz Gas in TPES by Region (MTOE) % Share .................................................................. 50
Figure 21: Modern Jazz Oil in TPES By Region (mb/d) % Share ....................................................................... 51
Figure 22: Unfinished Symphony GDP Growth % p.a. (2014 to 2060) ......................................................... 56
Figure 23: Unfinished Symphony The economic impact of digitally enabled governments ..................... 58
Figure 24: Unfinished Symphony Reductions in Carbon Intensity of GDP % p.a. (2014– 60) ................... 61
Figure 25: Unfinished Symphony Total Final Consumption of Energy by Sector (MTOE) % Share .......... 62
Figure 26: Unfinished Symphony Share of Fuels in Transport (% Share) ...................................................... 65
Figure 27: Unfinished Symphony Electricity Generation TWh % Share by Fuel Type ................................. 66
Figure 28: Unfinished Symphony Primary Energy Supply (MTOE) % Share .................................................67
Figure 29: Unfinished Symphony Change in Energy Intensity % p.a. (2014-60) ......................................... 68
Figure 30: Unfinished Symphony Coal in TPES by Region (MTOE) % Share ................................................ 68
Figure 31: Unfinished Symphony Oil in TPES By Region (mb/d) % Share ...................................................... 69
Figure 32: Unfinished Symphony Gas in TPES by Region (MTOE) % Share .................................................. 70
Figure 33: Unfinished Symphony Coal-fired electricity generation (PWh) ...................................................70
Figure 34: Unfinished Symphony Natural Gas-fired electricity generation (PWh) ..................................... 71

THE GRAND TRANSITION
111
Figure 35: Hard Rock GDP Growth % p.a. (2014– 60) ..................................................................................... 77
Figure 36: Hard Rock Reductions in Carbon Intensity of GDP ......................................................................80
Figure 37: Hard Rock Total Final Consumption of Energy by Sector (MTOE) ............................................ 82
Figure 38: Hard Rock Share of Fuels in Transport (% Share) .......................................................................... 83
Figure 39: Hard rock Electricity Generation TWh % Share by Fuel Type ..................................................... 84
Figure 40: Hard Rock Primary Energy Supply (MTOE) % Share .................................................................... 85
Figure 41: Hard Rock Change in Primary Energy Intensity % p.a. (2014-60) ............................................... 86
Figure 42: Hard Rock Coal in TPES by Region (MTOE) ................................................................................... 86
Figure 43: Hard Rock Oil in TPES by Region (MTOE) .......................................................................................87
Figure 44: Hard Rock Gas in TPES by Region (MTOE) .................................................................................... 88
Figure 45: GDP Growth, Primary Energy Intensity, Primary Energy Demand % p.a. (2014-60) ...............92
Figure 46: Global Electricity Generation (TWh) ................................................................................................93
Figure 47: Diversification of Light Duty Vehicle Fleet in 2010 and 2060 ..................................................... 94
Figure 48: Primary Energy Mix (2014-60) ......................................................................................................... 94
Figure 49: Global Carbon Emissions (GtCO₂/yr) ............................................................................................... 96
Figure 50: CO₂ Emissions in 2010 and 2060 (GtCO₂/yr) ..................................................................................97
Figure 51: Weather’s Changing Impact on Energy Infrastructure .................................................................. 99
Figure 52: The Energy Trilemma ......................................................................................................................... 102
Figure 53: Average Global Water Stress (2016) ............................................................................................... 107
LIST OF TABLES
Table 1: Selected ‘tools for action’ for States and Markets ............................................................................. 27
Table 2: Critical Uncertainties in the Grand Transition .................................................................................... 28
Table 3: Challenges faced by energy leaders in the Grand Transition ............................................................ 29
Table 4: Potential Boost to GDP of Digital Technologies .................................................................................37
Table 5: Signals of Technology Disruption ......................................................................................................... 38
Table 6: Examples of systemic risks created by fast paced globalisation ..................................................... 39
Table 7: Modern Jazz Implications for Energy .................................................................................................. 42
Table 8: Unfinished Symphony Implications for Energy ................................................................................. 63
Table 9: Security Driven Technology Choices .................................................................................................. 64
Table 10: Hard Rock Implications for Energy ..................................................................................................... 81
Table 11: Summary of Shifts in TPES by Resources ........................................................................................... 95
Table 12: Defining the Kaya Identity Factors ..................................................................................................... 97
Table 13: Kaya Identify Factors % P.A Change for Each Scenario (2014-60) ............................................... 98
Table 14: Adaptation and Resilience Performance ......................................................................................... 100

112
WORLD ENERGY COUNCIL | SCENARIOS
Table 15: Cyber Security Performance .............................................................................................................. 102
Table 16: Key Economic indicators .....................................................................................................................103
Table 17: Energy Security Performance .............................................................................................................104
Table 18: Energy Equity Performance in 2060 .................................................................................................105
Table 19: Environmental Sustainability Performance in 2060 .......................................................................106
Table 20: Energy Water Food Nexus Performance ......................................................................................... 107
Table 21: Modern jazz Economic Indicators ....................................................................................................... 117
Table 22: Modern Jazz Primary Energy .............................................................................................................. 117
Table 23: Modern Jazz Total Final Consumption by Sector and by Fuel Source .......................................... 118
Table 24: Modern Jazz Transport by Fuel Source ............................................................................................. 118
Table 25: Modern Jazz Power by Fuel Source ................................................................................................... 119
Table 26: Modern Jazz Carbon Emissions .......................................................................................................... 119
Table 27: Modern Jazz Coal by Region .............................................................................................................. 120
Table 28: Modern Jazz Oil by Region ................................................................................................................. 120
Table 29: Modern Jazz Gas by Region ................................................................................................................ 121
Table 30: Unfinished Symphony Economic Indicators ..................................................................................... 121
Table 31: Unfinished Symphony Primary Energy .............................................................................................. 122
Table 32: Unfinished Symphony Total Final Consumption by Sector and by Fuel Source ........................ 122
Table 33: Unfinished Symphony Transport by Fuel Source ............................................................................ 123
Table 34: Unfinished Symphony Power by Fuel Source .................................................................................. 123
Table 35: Unfinished Symphony Carbon Emissions ......................................................................................... 124
Table 36: Unfinished Symphony Coal by Region ............................................................................................. 124
Table 37: Unfinished Symphony Oil by Region ................................................................................................. 125
Table 38: Unfinished Symphony Gas by Region ............................................................................................... 125
Table 39: Hard Rock Economic Indicators ........................................................................................................ 126
Table 40: Hard Rock Primary Energy ................................................................................................................ 126
Table 41: Hard Rock Total Final Consumption by Sector and by Fuel Source ..............................................127
Table 42: Hard Rock Transport by Fuel Source .................................................................................................127
Table 43: Hard Rock Power by Fuel Source ...................................................................................................... 128
Table 44: Hard Rock Carbon Emissions ............................................................................................................ 128
Table 45: Hard Rock Coal by Region ................................................................................................................. 129
Table 46: Hard Rock Oil by Region .................................................................................................................... 129
Table 47: hard rock Gas by Region .....................................................................................................................130

THE GRAND TRANSITION
113
GLOSSARY
Acronym Definition
% percent
∆ Delta/ Change
°C Degree Celsius
APAC Pacific Asia
bn Billion
CC(U)S Carbon Capture, Use and Storage
CDM Clean Development Mechanism
CNG Compressed Natural Gas
CO₂ Carbon Dioxide
COP Conference of Parties
COP21 The twenty-first session of the Conference of the Parties
CPP Clean Power Plan
EU31 European Union + Switzerland, Iceland and Norway
EEUR Eastern Europe and Russia
EUR All of Europe and Russia
EV Electric Vehicles
EWF Energy, Water, and Food nexus
G20 Group of Twenty
G7 Group of Seven
GCC The Gulf Coast Consortia
GDP Gross Domestic Product
GHG Greenhouse Gas
GtCO2 Giga Tonnes (of CO₂)
GW Giga Watts
GWP Gross World Product
HVAC Heating, Ventilation and Air Conditioning
ICE Internal Combustion Engine
ICT Information and Communication Technologies
IEA International Energy Association
IMF International Monetary Fund
INDC Intended Nationally Determined Contributions
IoT Internet of Things

114
WORLD ENERGY COUNCIL | SCENARIOS
Acronym Definition
IPCC Intergovernmental Panel on Climate Change
IT Information Technology
LAC Latin America and Caribbean
LNG Liquefied Natural Gas
LTO Light Tight Oil
mb/d Million Barrels per Day
MENA Middle East and North Africa
Mn Million
MTOE Million Tonnes of Oil Equivalent
NAM North America
NATO North Atlantic Treaty Organization
NIMBYism Opposition by local citizens to the locating in their neighbourhood of a civic project
NOX Nitrogen Oxides
OECD Organization for Economic Cooperation and Development
OPEC The Organization of the Petroleum Exporting Countries
p.a. Per Annum
PACIASIA Pacific Asia
PPP Purchasing Power Parity
PV Photovoltaic
RD&D Research, Development and Deployment
SDGs Sustainable Development Goals
SOX Sulphur Oxides
SSA Sub-Saharan Africa
TED Total Economy Database
TFC Total Final Consumption
TPES Total Primary Energy Supply
UN United Nations
UNFCCC United Nations Framework Convention on Climate Change
USA/ The US United States of America
WTO World Trade Organization
yr. year

THE GRAND TRANSITION
115
1. Accenture Strategy, 2013: Accenture Analytics and Smart Building Solutions are helping Seattle boost energy efficiency downtown; Seattle, www.accenture.com/in-en/~/media/Accenture/Conversion-Assets/DotCom/Documents/Global/PDF/Technology_7/Accenture-Analytics-and-Smart-Building-Solutions.pdf#zoom=50
2. Accenture Strategy, 2014: Circular Advantage: Innovative Business Models and Technologies to Create Value in a World without Limits to Growth, London, www.accenture.com/t20150523T053139__w__/us-en/_acnmedia/Accenture/Conversion-Assets/DotCom/Documents/Global/PDF/Strategy_6/Accenture-Circular-Advantage-Innovative-Business-Models-Technologies-Value-Growth.pdf
3. Accenture Strategy, 2015: Digital Density Index – Guiding digital transformation: A new way for government and business leaders to understand, measure, and manage digital strategies to drive growth and competitiveness, Paris, London and Milan, www.accenture.com/t20150523T023959__w__/it-it/_acnmedia/Accenture/Conversion-Assets/DotCom/Documents/Global/PDF/Dualpub_13/Accenture-Digital-Density-Index-Guiding-Digital-Transformation.pdf
4. Accenture Strategy, 2016: Judgement calls: Preparing leaders to thrive in the age of intelligent machines, Dublin, Gurgaon and Boston, www.accenture.com/t20160413T030904__w__/in-en/_acnmedia/PDF-12/Accenture-Strategy-Workforce-Judgment-Calls.pdf#zoom=50
5. Accenture Strategy, Client Case Study: Local Content Maturity
6. Accenture Strategy, Client Case Study: Yokohama Smart City
7. Accenture, 2012: Water and Shale Gas Development: Leveraging the US experience in new shale developments, www.accenture.com/t20150527T211219__w__/it-it/_acnmedia/Accenture/Conversion-Assets/DotCom/Documents/Local/it-it/PDF_2/Accenture-Water-And-Shale-Gas-Development.pdf
8. Accenture, 2014: Digital Government- Pathways to Delivering Public Services for the Future: A comparative study of digital government performance across 10 countries, Paris, www.accenture.com/in-en/~/media/Accenture/Conversion-Assets/DotCom/Documents/Global/PDF/Industries_7/Accenture-Digital-Government-Pathways-to-Delivering-Public-Services-for-the-Future.pdf
9. Accenture, 2014: How can utilities survive energy demand disruption?: Accenture’s Digitally Enabled Grid program, www.accenture.com/t20150523T024232__w__/us-en/_acnmedia/Accenture/Conversion-Assets/DotCom/Documents/Global/PDF/Dualpub_14/Accenture-Digitally-Enabled-Grid-Utilities-Survive-Energy-Demand-Disruption.pdf
10. Accenture, 2014: Integrating Unconventionals: International Development of Unconventional Resources: If, where and how fast?, London, www.accenture.com/t20150523T024807__w__/dk-en/_acnmedia/Accenture/Conversion-Assets/DotCom/Documents/Global/PDF/Dualpub_2/Accenture-Energy-International-Development-Unconventionals.pdf
11. Accenture, 2014: Reimagining Argentina: An unconventional look towards 2035, Argentina, www.accenture.com/_acnmedia/Accenture/Conversion-Assets/DotCom/Documents/Global/PDF/Digital_3/Accenture-Reimagining-Argentina-An-Unconventional-Look-towards-2035.pdf
12. Accenture, 2014: The Electric Vehicle Challenge Electric Vehicle Growth in an Evolving Market Dependent on Seven Success Factors, Munich, www.accenture.com/mz-en/~/media/Accenture/Conversion-Assets/DotCom/Documents/Global/PDF/Industries_15/Accenture-Electric-Vehicle-Challenge.pdf
13. Accenture, 2015, The Cyber Security Leap: From Laggard to Leader, Washington DC, www.accenture.com/t20150814T113701__w__/us-en/_acnmedia/Accenture/Conversion-Assets/Microsites/iFrame/insight-cybersecurity-research-report/Accenture-Cyber-Security-Leap-2015-Report.pdf
14. Accenture, 2016: Gas Grows Up Part 1: Developing New Sources of LNG Demand, London, www.accenture.com/t20160309T024135__w__/us-en/_acnmedia/PDF-7/Accenture-Gas-Grows-up.pdf#zoom=50
15. Accenture, Sustainable Energy for All, 2015: We Commit Business for Energy Efficiency at COP21, The United States, The United Nations, www.accenture.com/t20151212T003136__w__/us-en/_acnmedia/PDF-2/Accenture-SE4All-Acn-Wecommit-Report.pdf
16. British Petroleum, 2015: BP Statistical Review of World Energy, London, www.bp.com/content/dam/bp/pdf/energy-economics/statistical-review- 2015/bp-statistical-review-of-world-energy-2015-full-report.pdf
REFERENCES

116
WORLD ENERGY COUNCIL | SCENARIOS
17. British Petroleum, 2016: BP Statistical Review of World Energy, London, www.bp.com/content/dam/bp/pdf/energy-economics/statistical-review-2016/bp-statistical-review-of-world-energy-2016-full-report.pdf
18. ExxonMobil, 2016: The Outlook for Energy: A view to 2040, Irving, cdn.exxonmobil.com/~/media/global/files/outlook-for-energy/2016/2016-outlook-for-energy.pdf
19. International Energy Agency, 2015: World Energy Outlook, Paris Cedex, www.iea.org/bookshop/700-World_Energy_Outlook_2015
20. International Energy Agency, 2016: World Energy Statistics, Paris Cedex, www.iea.org/bookshop/723-World_Energy_Statistics_2016
21. International Monetary Fund, 2016: World Economic Outlook Update: Uncertainty in the Aftermath of the U.K. Referendum, Washington DC, www.imf.org/external/pubs/ft/weo/2016/update/02/pdf/0716.pdf
22. International Monetary Fund, 2016: World Economic Outlook: Too Slow for Too Long, Washington DC, www.imf.org/external/pubs/ft/weo/2016/01/pdf/text.pd
23. Intergovernmental Panel on Climate Change (IPCC), 2016: Reports – Special Reports, www.ipcc.ch/ipccreports/sres/emission/index.php?idp=50
24. Jeremy Rifkin, 2014: The Zero Marginal Cost Society: The Internet of Things, The Collaborative Commons, & The Eclipse of Capitalism, Maryland, www.thezeromarginalcostsociety.com/
25. Paradoxes of China’s Economic Boom’, Martin King Whyte, Harvard University, The Annual Review of Sociology, 2009.
26. Power play: Three new models for growth in the utilities industry, www.accenture.com/t20151209T060859__w__/us-en/_acnmedia/Accenture/Conversion-Assets/DotCom/Documents/Global/PDF/Dualpub_17/Accenture-Power-Play-Models-Growth-Utilities.pdf#zoom=50
27. Robert Gordon, 2016: The Rise and Fall of American Growth: The U.S. Standard of Living since the Civil War, Princeton, Princeton University Press, press.princeton.edu/titles/10544.html
28. Shell International BV, 2008: Shell Energy Scenarios to 2050, The Hague, www.shell.com/content/dam/shell/static/public/downloads/brochures/corporate-pkg/scenarios/shell-energy-scenarios2050.pdf
29. The Conference Board, Inc., 2016: The Conference Board Total Economy Database (TED), New York, www.conference-board.org/data/economydatabase/index.cfm?id=27762
30. The United States National Intelligence Council, 2012: Global Trends 2030: Alternative Worlds, Washington DC, globaltrends2030.files.wordpress.com/2012/11/global-trends-2030-november2012.pdf
31. The World Bank, 2016: World Bank Open Data, Washington DC, data.worldbank.org/
32. United Nations Department of Economic and Social Affairs- Population Division, 2015: World Urbanization Prospects: The 2014 Revision, New York, United Nations, esa.un.org/unpd/wup/Publications/Files/WUP2014-Report.pdf
33. United Nations Framework Convention on Climate Change, 2016: Report of the Conference of the Parties on its twenty-first session, held in Paris from 30 November to 13 December 2015, Bonn, The United Nations unfccc.int/resource/docs/2015/cop21/eng/10a02.pdf
34. World Energy Council, 2015: World Energy Perspectives: The road to resilience − managing and financing extreme weather risks, London, World Energy Council in partnership with Marsh & McLennan Companies and Swiss Re Corporate Solutions, www.worldenergy.org/wp-content/uploads/2015/09/The-Road-to-Resilience-Managing-and-Financing-Extreme-Weather-Risk.pdf
35. World Energy Council, 2016: Issues Monitor: A Climate of Innovation – Responding to the Commodity Price Storm, London, www.worldenergy.org/wp-content/uploads/2016/03/2016-World-Energy-Issues-Monitor-Full-report.pdf
36. World Energy Council, 2016: World Energy Perspectives E-Mobility: E-Mobility- Closing the Emissions Gap, London, World Energy Council in collaboration with Accenture Strategy, www.worldenergy.org/wp-content/uploads/2016/06/E-Mobility-Closing-the-emissions-gap_full-report_FINAL_2016.06.20.pdf
37. World Energy Council, 2016: World Energy Resources: Unconventional gas, a global phenomenon, London, World Energy Council in partnership Accenture Strategy, www.worldenergy.org/wp-content/uploads/2016/02/Unconventional-gas-a-global-phenomenon-World-Energy-Resources_-Full-report-.pdf
38. World Energy Council, 2016: World Energy Trilemma: Defining Measures to Accelerate the Energy Transition, London, in Partnership with Oliver Wyman, www.worldenergy.org/wp-content/uploads/2016/05/World-Energy-Trilemma_full-report_2016_web.pdf
39. Yokohama Smart City Project, 2013, www.city.yokohama.lg.jp/ondan/english/yscp/

THE GRAND TRANSITION
117
DATA TABLES
MODERN JAZZ
Indicator 2014 2020 2030 2040 2050 2060 CAGR (2014-60)
Population (million)
7,266 7,758 8,501 9,157 9,725 10,184 0.7%
GDP (trillion USD2010 MER)
70 87 122 170 233 312 3.3%
GDP per capita (USD2010 MER)
9,686 11,178 14,322 18,539 23,966 30,627 2.5%
Car ownership (cars/1000 people)
153 146 173 203 237 278 1.3%
Primary Energy Intensity (MTOE/USD2010 MER)
194 171 132 98 72 55 -2.7%
Final Energy Intensity (MTOE/USD2010 MER)
133 122 96 73 55 42 -2.5%
Primary Energy Supply (MTOE)
2014 2020 2030 2040 2050 2060 CAGR (2014-60)
Total 13,652 14,793 16,085 16,649 16,847 17,013 0.5%
Coal 3,902 3.831 3,636 3,102 2,303 1,832 -1.6%
Oil 4,276 4,683 5,123 4,941 4,545 3,962 -0.2%
Gas 2,891 3,417 3,927 4,515 4,974 4,968 1.2%
Nuclear 659 815 856 947 1,085 1,262 1.4%
Biomass 1,408 1,415 1,580 1,768 2,106 2,671 1.4%
Hydro 334 375 413 461 515 562 1.1%
Other renewables 181 258 551 916 1,320 1,755 5.1%
TABLE 21: MODERN JAZZ ECONOMIC INDICATORS
TABLE 22: MODERN JAZZ PRIMARY ENERGY

118
WORLD ENERGY COUNCIL | SCENARIOS
Total Final| Consumption (MTOE)
2014 2020 2030 2040 2050 2060 CAGR (2014-60)
Total 9,395 10,553 11,714 12,359 12,735 12,947 0.7%
Industry 2,743 3,399 3,780 3,975 4,087 4,092 0.9%
Transport 2,619 2,804 3,179 3,317 3,359 3,423 0.6%
Residential/Commercial
3,209 3,386 3,636 3,816 3,930 3,986 0.5%
Non-energy uses 825 965 1,118 1,252 1,360 1,446 1.2%
Coal 1,072 1,303 1,288 1,184 1,064 910 -0.4%
Oil 3,749 4,117 4,530 4,377 4,085 3,648 -0.1%
Gas 1,416 1,601 1,819 2,096 2,235 2,261 1.0%
Electricity 1,701 1,968 2,353 2,790 3,214 3,649 1.7%
Heat 273 306 343 386 404 416 0.9%
Biomass & Biofuels 1,148 1,164 1,175 1,216 1,303 1,503 0.6%
Other 36 95 205 310 430 560 6.1%
Fuels in Transport (MTOE)
2014 2020 2030 2040 2050 2060 CAGR (2014-60)
Total 2,619 2,805 3,179 3,317 3,359 3,423 0.6%
Electricity 26 35 70 115 166 277 5.3%
Hydrogen 0 0 4 15 40 86 29.2%
Liquid fuels – fossil
2,419 2,577 2,843 2,819 2,635 2,297 -0.1%
Liquid fuels – biogenous
74 90 146 206 301 482 4.2%
Gaseous fuels – fossil
98 96 105 142 182 224 1.8%
Gaseous fuels – biogenous
0 7 11 19 34 56 14.0%
Other (coal) 3 0 0 0 0 0 -100.0%
TABLE 23: MODERN JAZZ TOTAL FINAL CONSUMPTION BY SECTOR AND BY FUEL SOURCE
TABLE 24: MODERN JAZZ TRANSPORT BY FUEL SOURCE

THE GRAND TRANSITION
119
Electricity Generation (TWh)
2014 2020 2030 2040 2050 2060 CAGR (2014-60)
Total 23,816 27,124 32,171 37,724 43,090 48,491 1.6%
Coal 9,697 9,468 8,960 7,358 4,152 2,634 -2.8%
Coal (with CCS) 0 0 20 119 338 665 NA
Oil 1,033 765 560 442 350 274 -2.8%
Gas 5,155 6,731 9,292 11,949 14,241 10,610 1.6%
Gas (with CCS) 0 0 0 81 762 4,853 NA
Nuclear 2,535 3,170 3,327 3,681 4,219 4,908 1.4%
Hydro 3,895 4,371 4,816 5,382 6,003 6,558 1.1%
Biomass 493 692 1,069 1,340 1,880 2,421 3.5%
Biomass (with CCS)
0 0 0 10 33 153 NA
Wind 717 1,316 2,540 4,257 6,433 8,818 5.6%
Solar 198 482 1,369 2,746 4,068 5,718 7.6%
Geothermal 77 129 210 323 481 638 4.7%
Other 15 0 8 36 127 239 6.2%
TABLE 25: MODERN JAZZ POWER BY FUEL SOURCE
TABLE 26: MODERN JAZZ CARBON EMISSIONS
Carbon Emissions 2014 2020 2030 2040 2050 2060 CAGR (2014-60)
CO₂ emissions (GtCO₂/yr)
32.4 34.5 35.8 34.1 29.7 23.2 -0.7%
CO₂ capture (GtCO₂)
0.0 0.0 0.0 0.1 1.0 3.6 NA
CO₂ per capita (tCO₂)
4.46 4.4 4.2 3.7 3.1 2.3 -1.5%
CO₂ intensity (kgCO₂/USD2010)
0.46 0.4 0.3 0.2 0.1 0.1 -3.9%

120
WORLD ENERGY COUNCIL | SCENARIOS
Coal by Region (MTOE)
2014 2020 2030 2040 2050 2060 CAGR (2014-60)
Total 3,902 3,831 3,636 3,102 2,303 1,832 -1.6%
China 2,017 2,080 1,919 1,681 1,239 937 -1.7%
India 377 502 665 692 593 462 0.4%
Europe 454 357 290 208 148 145 -2.4%
Latin America 32 22 20 13 7 3 -5.3%
Middle East and Northern Africa
14 10 9 6 1 3 -3.6%
North America 462 399 276 172 84 56 -4.5%
Other Asia 438 373 368 243 149 132 -2.6%
Sub Saharan Africa 107 88 89 88 82 94 -0.3%
Oil by Region (mb/d)
2014 2020 2030 2040 2050 2060 CAGR (2014-60)
Total 86 94 103 99 91 80 -0.2%
China 11 14 19 17 14 12 0.2%
India 4 5 7 8 9 9 1.9%
Europe 18 17 16 15 13 10 -1.3%
Latin America 7 7 8 8 8 6 0.0%
Middle East and Northern Africa
9 10 11 11 11 9 0.0%
North America 20 23 22 18 15 11 -1.4%
Other Asia 15 16 16 17 16 15 -0.1%
Sub Saharan Africa
2 2 3 4 6 8 3.2%
TABLE 27: MODERN JAZZ COAL IN TPES BY REGION
TABLE 28: MODERN JAZZ OIL IN TPES BY REGION

THE GRAND TRANSITION
121
Gas by Region (MTOE)
2014 2020 2030 2040 2050 2060 CAGR (2014-60)
Total 2,891 3,417 3,927 4,515 4,974 4,968 1.2%
China 155 238 322 475 692 703 3.3%
India 43 71 114 196 307 415 5.0%
Europe 818 961 939 917 915 887 0.2%
Latin America 142 165 220 294 350 379 2.2%
Middle East and Northern Africa
459 449 495 570 563 530 0.3%
North America 771 926 1,032 1,046 915 792 0.1%
Other Asia 480 579 746 894 1,013 949 1.5%
Sub Saharan Africa
24 26 60 121 217 313 5.7%
TABLE 29: MODERN JAZZ GAS IN TPES BY REGION
UNFINISHED SYMPHONY
Indicator 2014 2020 2030 2040 2050 2060 CAGR (2014-60)
Population (million)
7,266 7,758 8,501 9,157 9,725 10,184 0.7%
GDP (trillion USD2010 MER)
70 84 114 152 199 256 2.9%
GDP per capita (USD2010 MER)
9,686 10,871 13,396 16,602 20,473 25,172 2.1%
Car ownership (cars/1000 people)
153 144 167 194 224 258 1.1%
Primary Energy Intensity (MTOE/USD2010 MER)
194 172 134 100 76 59 -2.6%
Final Energy Intensity (MTOE/USD2010 MER)
133 123 98 76 58 45 -2.3%
TABLE 30: UNFINISHED SYMPHONY ECONOMIC INDICATORS

122
WORLD ENERGY COUNCIL | SCENARIOS
Primary Energy Supply (MTOE)
2014 2020 2030 2040 2050 2060 CAGR (2014-60)
Total 13,652 14,499 15,291 15,178 15,095 15,085 0.2%
Coal 3,902 3,509 3,062 2,058 1,063 724 -3.6%
Oil 4,276 4,589 4,671 4,378 3,862 3,261 -0.6%
Gas 2,891 3,375 3,554 3,637 3,822 3,604 0.5%
Nuclear 659 848 1,123 1,413 1,683 1,959 2.4%
Biomass 1,408 1,532 1,835 2,145 2,564 2,949 1.6%
Hydro 334 381 438 488 553 609 1.3%
Other renewables 181 265 609 1,059 1,548 1,980 5.3%
Total Final Consumption (MTOE)
2014 2020 2030 2040 2050 2060 CAGR (2014-60)
Total 9,395 10,360 11,147 11,513 11,585 11,417 0.4%
Industry 2,743 3,297 3,489 3,545 3,518 3,444 0.5%
Transport 2,619 2,738 3,050 3,183 3,196 3,123 0.4%
Residential/Commercial
3,209 3,374 3,513 3,609 3,617 3,543 0.2%
Non-energy uses 825 951 1,096 1,177 1,254 1,307 1.0%
Coal 1,072 1,189 1,022 833 643 440 -1.9%
Oil 3,749 4,055 4,169 4,005 3,614 3,072 -0.4%
Gas 1,416 1,567 1,813 1,937 1,984 2,003 0.8%
Electricity 1,701 1,902 2,258 2,625 2,977 3,328 1.5%
Heat 273 296 324 350 336 311 0.3%
Biomass & Biofuels
1,148 1,252 1,361 1,463 1,619 1,751 0.9%
Other 36 99 201 302 412 511 5.9%
TABLE 31: UNFINISHED SYMPHONY PRIMARY ENERGY
TABLE 32: UNFINISHED SYMPHONY TOTAL FINAL CONSUMPTION BY SECTOR AND BY FUEL SOURCE

THE GRAND TRANSITION
123
Fuels in Transport (MTOE)
2014 2020 2030 2040 2050 2060 CAGR (2014-60)
Total 2,619 2,738 3,050 3,183 3,196 3,123 0.6%
Electricity 26 35 63 117 184 321 5.6%
Hydrogen 0 1 7 21 53 88 29.2%
Liquid fuels – fossil
2,419 2,480 2,644 2,577 2,331 1,878 -0.5%
Liquid fuels – biogenous
74 127 222 329 451 617 4.7%
Gaseous fuels – fossil
98 91 106 123 146 178 1.3%
Gaseous fuels – biogenous
0 5 8 16 31 41 13.2%
Other (coal) 3 0 0 0 0 0 -100.0%
Sub Saharan Africa
24 26 60 121 217 313 5.7%
Electricity Generation (TWh)
2014 2020 2030 2040 2050 2060 CAGR (2014-60)
Total 23,816 26,216 30,854 35,453 39,843 44,474 1.4%
Coal 9,697 8,791 7,741 4,483 547 86 -9.8%
Coal (with CCS) 0 0 95 530 981 982 NA
Oil 1,033 651 381 241 133 76 -5.5%
Gas 5,155 6,362 7,014 6,927 4,486 822 -3.9%
Gas (with CCS) 0 0 82 1,227 4,414 6,694 NA
Nuclear 2,535 3,299 4,367 5,496 6,546 7,617 2.4%
Hydro 3,895 4,440 5,109 5,695 6,447 7,100 1.3%
Biomass 493 710 1,187 1,663 2,150 2,339 3.4%
Biomass (with CCS) 0 0 0 30 77 169 NA
Wind 717 1,320 2,918 4,928 7,431 9,326 5.7%
Solar 198 501 1,694 3,760 5,802 7,943 8.4%
Geothermal 77 142 262 448 735 1,111 6.0%
Other 15 0 5 24 93 210 5.9%
TABLE 33: UNFINISHED SYMPHONY TRANSPORT BY FUEL SOURCE
TABLE 34: UNFINISHED SYMPHONY POWER BY FUEL SOURCE

124
WORLD ENERGY COUNCIL | SCENARIOS
TABLE 35: UNFINISHED SYMPHONY CARBON EMISSIONS
Carbon Emissions 2014 2020 2030 2040 2050 2060 CAGR (2014-60)
CO₂ emissions (GtCO₂/yr)
32.38 32.6 31.1 25.8 18.1 12.6 -2.0%
CO₂ capture (GtCO₂)
0.0 0.0 0.1 0.8 3.2 4.8 NA
CO₂ per capita (tCO₂)
4.46 4.2 3.7 2.8 1.9 1.2 -2.8%
CO₂ intensity (kgCO₂/USD2010)
0.46 0.4 0.3 0.2 0.1 0.0 -4.7%
Coal by Region (MTOE)
2014 2020 2030 2040 2050 2060 CAGR (2014-60)
Total 3,902 3,509 3,062 2,058 1,063 724 -3.6%
China 2,017 1,912 1,648 1,158 602 384 -3.5%
India 377 407 456 349 212 141 -2.1%
Europe 454 340 264 136 82 76 -3.8%
Latin America 32 23 18 12 4 2 -5.9%
Middle East and Northern Africa
14 10 9 1 1 0 -8.4%
North America 462 387 291 168 68 54 -4.5%
Other Asia 438 348 304 179 69 41 -5.0%
Sub Saharan Africa
107 82 71 56 26 25 -3.1%
TABLE 36: UNFINISHED SYMPHONY COAL IN TPES BY REGION

THE GRAND TRANSITION
125
Oil by Region (mb/d)
2014 2020 2030 2040 2050 2060 CAGR (2014-60)
Total 86 92 94 88 78 65 -0.6%
China 11 14 16 15 12 10 -0.2%
India 4 5 7 8 9 9 2.0%
Europe 18 17 16 14 11 8 -1.6%
Latin America 7 7 7 7 6 5 -0.8%
Middle East and Northern Africa
9 9 10 10 8 7 -0.7%
North America 20 23 21 17 13 9 -1.8%
Other Asia 15 15 15 14 13 11 -0.7%
Sub Saharan Africa
2 2 3 3 5 7 2.8%
TABLE 37: UNFINISHED SYMPHONY OIL IN TPES BY REGION
Gas by Region (MTOE)
2014 2020 2030 2040 2050 2060 CAGR (2014-60)
Total 2,891 3,375 3,554 3,637 3,822 3,604 0.5%
China 155 221 318 415 647 563 2.8%
India 43 71 134 226 295 340 4.6%
Europe 818 984 910 890 828 736 -0.2%
Latin America 142 160 190 209 212 220 0.9%
Middle East and Northern Africa
459 443 502 490 482 459 0.0%
North America 771 924 894 714 618 522 -0.8%
Other Asia 480 549 556 604 605 568 0.4%
Sub Saharan Africa
24 23 48 89 135 196 4.7%
TABLE 38: UNFINISHED SYMPHONY GAS IN TPES BY REGION

126
WORLD ENERGY COUNCIL | SCENARIOS
HARD ROCK
Indicator 2014 2020 2030 2040 2050 2060 CAGR (2014-60)
Population (million)
7,266 7,758 8,501 9,157 9,725 10,184 0.7%
GDP (trillion USD2010 MER)
70 77 93 110 129 150 1.7%
GDP per capita (USD2010 MER)
9,686 9,923 10,901 12,004 13,239 14,684 0.9%
Car ownership (cars/1000 people)
153 145 169 197 229 268 1.2%
Primary Energy Intensity (MTOE/USD2010 MER)
194 193 174 155 137 122 -1.0%
Final Energy Intensity (MTOE/USD2010 MER)
133 137 125 113 102 92 -0.8%
TABLE 39: HARD ROCK ECONOMIC INDICATORS
Primary Energy Supply (MTOE)
2014 2020 2030 2040 2050 2060 CAGR (2014-60)
Total 13,652 14,865 16,154 17,012 17,654 18,272 0.6%
Coal 3,902 3,932 3,923 4,044 3,524 3,194 -0.4%
Oil 4,276 4,578 5,044 5,180 5,176 5,139 0.4%
Gas 2,891 3,392 3,727 3,811 4,231 4,370 0.9%
Nuclear 659 840 994 1,160 1,391 1,713 2.1%
Biomass 1,408 1,498 1,631 1,742 1,960 2,098 0.9%
Hydro 334 377 414 459 511 563 1.1%
Other renewables 181 248 422 615 859 1,195 4.2%
TABLE 40: HARD ROCK PRIMARY ENERGY

THE GRAND TRANSITION
127
Total Final Consumption (MTOE)
2014 2020 2030 2040 2050 2060 CAGR (2014-60)
Total 9,395 10,543 11,625 12,473 13,155 13,717 0.8%
Industry 2,743 3,367 3,592 3,850 4,041 4,221 0.9%
Transport 2,619 2,786 3,256 3,562 3,729 3,904 0.8%
Residential/Commercial
3,209 3,427 3,669 3,808 4,001 4,053 0.5%
Non-energy uses 825 962 1,108 1,253 1,384 1,539 1.4%
Coal 1,072 1,468 1,482 1,501 1,523 1,552 0.8%
Oil 3,749 3,973 4,409 4,581 4,636 4,615 0.5%
Gas 1,416 1,540 1,740 1,935 2,013 2,132 0.9%
Electricity 1,701 1,939 2,229 2,608 2,974 3,357 1.5%
Heat 273 285 279 279 296 287 0.1%
Biomass & Biofuels
1,148 1,240 1,303 1,311 1,368 1,319 0.3%
Other 36 97 183 258 344 456 5.6%
Fuels in Transport (MTOE)
2014 2020 2030 2040 2050 2060 CAGR (2014-60)
Total 2,619 2,786 3,256 3,562 3,730 3,904 0.9%
Electricity 26 32 59 86 111 151 3.9%
Hydrogen 0 1 4 13 22 41 27.1%
Liquid fuels – fossil
2,419 2,556 2,917 3,051 3,075 3,041 0.5%
Liquid fuels – biogenous
74 83 135 196 289 383 3.7%
Gaseous fuels – fossil
98 102 139 214 230 281 2.3%
Gaseous fuels – biogenous
0 3 0 1 3 7 9.1%
Other (coal) 3 8 1 1 0 0 -12.4%
Other 36 97 183 258 344 456 5.6%
TABLE 41: HARD ROCK TOTAL FINAL CONSUMPTION BY SECTOR AND BY FUEL SOURCE
TABLE 42: HARD ROCK TRANSPORT BY FUEL SOURCE

128
WORLD ENERGY COUNCIL | SCENARIOS
Electricity Generation (TWh)
2014 2020 2030 2040 2050 2060 CAGR (2014-60)
Total 23,816 26,728 30,605 35,559 40,191 44,914 1.4%
Coal 9,697 9,096 9,684 10,922 9,491 8,199 -0.4%
Coal (with CCS) 0 0 0 0 0 0 NA
Oil 1,033 974 733 585 488 421 -1.9%
Gas 5,155 6,501 7,740 8,680 10,984 11,781 1.8%
Gas (with CCS) 0 0 0 0 0 0 NA
Nuclear 2,535 3,267 3,864 4,510 5,411 6,661 2.1%
Hydro 3,895 4,395 4,825 5,361 5,958 6,573 1.1%
Biomass 493 667 844 1,066 1,389 1,870 2.9%
Biomass (with CCS)
0 0 0 0 0 0 NA
Wind 717 1,264 1,983 2,946 4,063 5,608 4.6%
Solar 198 472 793 1,262 2,037 3,270 6.3%
Geothermal 77 91 133 194 301 418 3.7%
Other 15 0 8 32 68 113 4.5%
Carbon Emissions 2014 2020 2030 2040 2050 2060 CAGR (2014-60)
CO₂ emissions (GtCO₂/yr)
32.38 34.4 36.2 37.2 35.7 34.1 0.1%
CO₂ capture (GtCO₂)
0.0 0.0 0.0 0.0 0.0 0.0 NA
CO₂ per capita (tCO₂)
4.46 4.4 4.3 4.1 3.7 3.3 -0.6%
CO₂intensity (kgCO₂/USD2010)
0.46 0.4 0.4 0.3 0.3 0.2 -1.5%
TABLE 43: HARD ROCK POWER BY FUEL SOURCE
TABLE 44: HARD ROCK CARBON EMISSIONS

THE GRAND TRANSITION
129
Coal by Region (MTOE)
2014 2020 2030 2040 2050 2060 CAGR (2014-60)
Total 3,902 3,932 3,923 4,044 3,524 3,194 -0.4%
China 2,017 2,162 1,945 1,935 1,448 1,159 -1.2%
India 377 486 690 876 938 962 2.1%
Europe 454 396 350 298 209 158 -2.3%
Latin America 32 26 23 18 11 9 -2.7%
Middle East and Northern Africa
14 11 11 10 2 2 -4.5%
North America 462 335 268 197 117 72 -4.0%
Other Asia 438 422 519 555 593 580 0.6%
Sub Saharan Africa
107 95 116 154 206 253 1.9%
TABLE 45: HARD ROCK COAL IN TPES BY REGION
Oil by Region (mb/d)
2014 2020 2030 2040 2050 2060 CAGR (2014-60)
Total 86 92 101 104 104 103 0.4%
China 11 12 15 16 15 15 0.7%
India 4 4 6 7 8 9 1.9%
Europe 18 17 18 17 16 16 -0.3%
Latin America 7 7 8 9 8 9 0.6%
Middle East and Northern Africa
9 10 11 12 12 12 0.5%
North America 20 24 24 21 18 14 -0.8%
Other Asia 15 16 17 18 19 19 0.4%
Sub Saharan Africa
2 2 3 4 7 10 3.8%
TABLE 46: HARD ROCK OIL IN TPES BY REGION
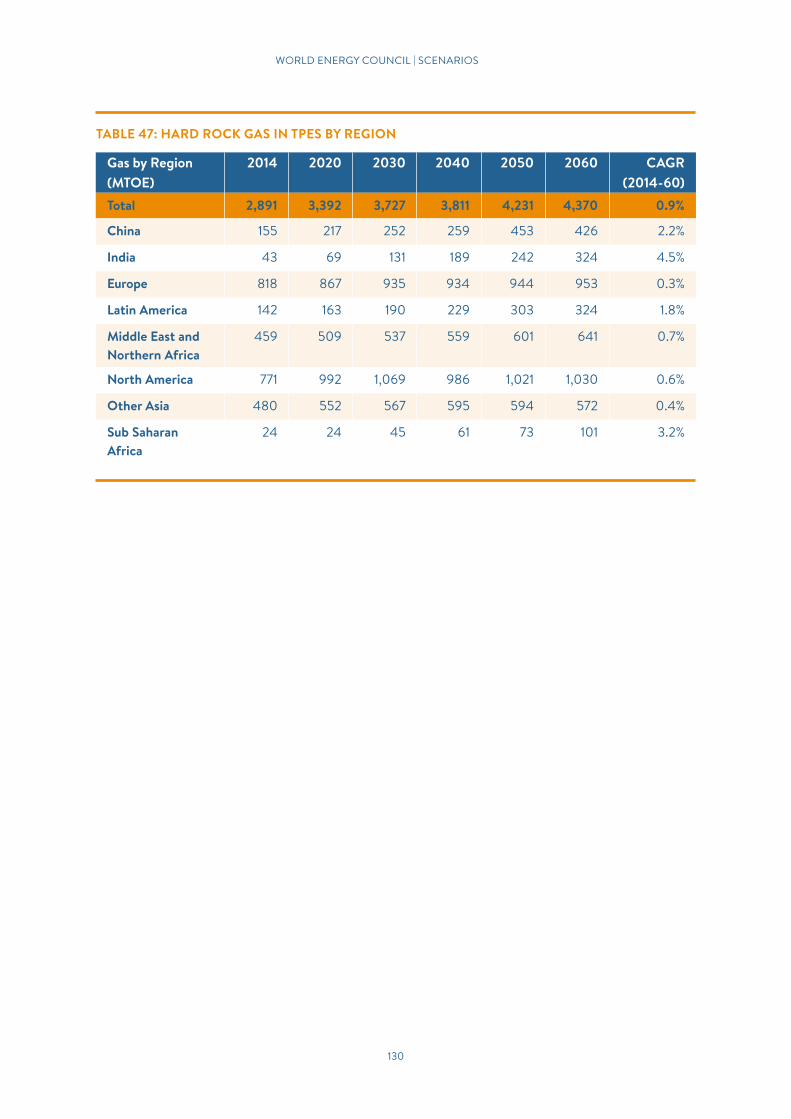
130
WORLD ENERGY COUNCIL | SCENARIOS
Gas by Region (MTOE)
2014 2020 2030 2040 2050 2060 CAGR (2014-60)
Total 2,891 3,392 3,727 3,811 4,231 4,370 0.9%
China 155 217 252 259 453 426 2.2%
India 43 69 131 189 242 324 4.5%
Europe 818 867 935 934 944 953 0.3%
Latin America 142 163 190 229 303 324 1.8%
Middle East and Northern Africa
459 509 537 559 601 641 0.7%
North America 771 992 1,069 986 1,021 1,030 0.6%
Other Asia 480 552 567 595 594 572 0.4%
Sub Saharan Africa
24 24 45 61 73 101 3.2%
TABLE 47: HARD ROCK GAS IN TPES BY REGION

THE GRAND TRANSITION
131
METHODOLOGY
PROCESSMethodology
1 Agree on Critical Trends 2
Define Alternative Dynamics 3 Develop
Distinct Scenarios
45
Develop Dynamic
ModelDefineModel Inputs
6Run Model & Analyze Outputs
20 executive interviews, three exploratory workshops, text analytics
Scenario framing workshops supported by expert insights from 100+ global experts
Two Scenario building workshops and eight regional workshops to test ideas
Refinement of trends and mapping to energy drivers
Historical analysis and benchmarking to quantify key input drivers
GMM MARKAL modelling supported by robust quality control process
1
2
3
4
5
6
THE ENERGY SYSTEM MODEL GLOBAL MULTI-REGIONAL MARKAL – AN OVERVIEW
The scenarios were quantified using the Global Multi-Regional MARKAL (GMM) energy system model. GMM is a tool used to quantify and enrich the scenario storylines developed by the World Energy Council. GMM’s detailed technology representation enables the model to provide a consistent and integrated representation of the global energy system, accounting for engineering and technical factors in the quantification of long-term energy transitions. The model is driven by input assumptions reflecting the scenario storylines and applies an optimization algorithm to determine the least-cost long-term configuration of the global energy system from a global social perspective with perfect foresight.
GMM belongs to the family of MARKAL (MARKet ALlocation) type of models, where the emphasis is on a detailed representation of energy supply, conversion and energy end-use technologies (i.e. a so-called “bottom-up” model). GMM is a technologically detailed cost-optimization model that has been developed by the Energy Economics Group at the Paul Scherrer Institute (PSI) over a number of years (Rafaj, 2005; Gül et al., 2009; Densing et al., 2012, Turton et al, 2013, Panos et al. 2015, Panos et al. 2016). The World Energy Council joined as a model partner to support continued development and dissemination of the model with the goal of improving transparency, accessibility and credibility of global energy scenario modelling. In this regard, the Council and PSI have developed GMM into a fully open source model available to all Council members (subject to licensing). Such tools do not seek to model directly the economy outside of the energy sector, which is represented as a set of exogenous inputs to the model based on a coherent scenario storyline.
GMM is applied to identify the least-cost combination of technology and fuel options to supply energy services using a market-clearing optimization algorithm. This algorithm simultaneously determines equipment investment and operating decisions, and primary energy supply decisions for each region

132
WORLD ENERGY COUNCIL | SCENARIOS
represented in the model to establish equilibrium between the cost of each energy carrier, the quantity supplied by producers, and the quantity demanded by consumers. Additional information about the model and its methodology can be found at the Paul Scherrer Institute’s website23.
GeographiesPSI’s model contains 15 world regions. For the purpose of this report, the World Energy Council highlights eight world regions, which have the biggest impact on the energy sector, shown in figure below. Major countries are modelled as separate regions: Brazil, China, the European Union24, India, Russia, and the USA. Aggregated regions include: Eastern Europe25 and Russia; South and Central Asia (excluding India); the developed far East (Japan, Korea and Taiwan); Australia together with New Zealand; other Latin America together with the Caribbean (excluding Brazil and Mexico); the Middle East together with North Africa; Canada together with Mexico; and Southeast Asia and the Pacific. For each region, scenario assumptions influence the dynamics of demand and supply technologies (cost, efficiencies, availability). The regional and technology differentiation leads to a large-scale optimization model with approximately over 200,000 equations.
THE 8 WORLD REGIONS FOR THE GRAND TRANSITION NARRATIVE
23 PSI provides a fundamental view on methodology used and tools on their website: www.psi.ch/eem/methods-and-tools
24 including Croatia (which joined in year 2013), together with Iceland, Norway and Switzerland
25 Albania, Armenia, Belarus, Bosnia and Herzegovina, Georgia, Macedonia, Moldavia, Serbia, Turkey, Ukraine
Calibration of energy demands, technologies and energy resource potentialsThe GMM model is calibrated to recently published statistics for the year 2010. This calibration covers current demands for each energy subsector, the technology and fuel shares, and estimates on current costs and efficiencies of technologies. A primary source used for much of the calibration of fuel production and consumption is the IEA’s Energy Balances (IEA 2015a). To ensure a better representation of developments since 2010 (up to the year 2013), the model uses additional statistics for recent years for which reliable data are available (EIA, 2015; BGR, 2016; IEA, 2015b; see Turton et al., 2013 for further references).
North America (NAM)
China Region
India
Middle East & North Africa
(MENA)
Other Asia incl. Australia, Japan,
South Korea
Europe (EU31, Eastern Europe
incl. Russia)
Latin America & Carribean (LAC)
Sub-Saharan Africa (SSA)
THE GRAND TRANSITION
133
ReferencesBGR (2016): Reserves, Resources and Availability of Energy Resources 2015 – Annual report. Federal Institute for Geosciences and Natural Resources, Hannover, Germany. (BGR: Bundesanstalt für Geowissenschaften und Rohstoffe), www.bgr.bund.de/EN/Themen/Energie/Downloads/energiestudie_2015_en.html
Densing M., Turton H., Bäuml G. (2012): Conditions for the successful deployment of electric vehicles – a global energy system perspective, Energy, 47, p.137–149 (2012) [joint work with Volkswagen AG]
Gül T., Kypreos S., Turton H. and Barreto L. (2009): An energy-economic scenario analysis of alternative fuels for personal transport using the Global Multi-regional MARKAL model (GMM). Energy, 34, p. 1423–1437.
Rafaj, P. (2005): Analysis of Policies Contributing to Sustainability of the Global Energy System Using the Global Multi-regional MARKAL Model (GMM). PhD No. 16122, ETH Zurich, Switzerland.
International Energy Agency, 2015a): Extended world energy balances – year 2010. IEA/OECD Library, Paris, www.iea.org/statistics/topics/energybalances/
Turton, H., Panos, V., Densing, M., Volkart, K. (2013): Global Multi-regional MARKAL (GMM) model update: disaggregation to 15 regions and 2010 recalibration. PSI Report, Paul Scherrer Institute, Switzerland, ISSN: 1019-0643, forthcoming.
U.S. Energy Information Administration, 2015: EIA International Energy Statistics, Washington, www.eia.gov/cfapps/ipdbproject/IEDIndex3.cfm
Global Energy Observatory, 2015: Global Energy Observatory, Los Alamos (USA), globalenergyobservatory.org/
International Energy Agency, 2015b: IEA Electricity Information Statistics Database, Paris, www.iea.org/statistics/relateddatabases/electricityinformation/
Major sources for renewables potentialsPanos E., Turton H., Densing M., Volkart K. (2015). Powering the growth of Sub-Saharan Africa: The Jazz and Symphony scenarios of World Energy Council, Energy for Sustainable Development, Vol. 26, pp. 14-33, Elsevier doi:10.1016/j.esd.2015.01.004 ISSN 0973-0826
Panos E., Densing M., Volkart K. (2016). Access to electricity in the World Energy Council's global energy scenarios: An outlook for developing regions until 2030, Energy Strategy Reviews, Vol. 9, pp. 28-49, Elsevier doi:10.1016/j.esr.2015.11.003

134
WORLD ENERGY COUNCIL | SCENARIOS
ACKNOWLEDGEMENTS
The project team would like to thank the individuals who informed the project’s approach, supplied information, provided ideas, and reviewed drafts. Their support and insights have made a major contribution to the development of the report.
WORLD ENERGY COUNCIL SCENARIO STUDY GROUP Gerald Davis (Executive Chair)
(Note: organised by countries’ alphabetical order)
Djallal Boucheneb, Algeria; Walid Kremia, Algeria; Francisco Galtieri, Argentina; Horst Adlassing, Austria; Stephan Sharma, Austria; Simonetta Naletto, Belgium; William D'haeseleer, Belgium; Angelica da Silva Sobral Mussel Martins, Brazil; Antonio Augusto Gonçalves, Brazil; Bruno Carneiro Leao, Brazil; Paulo Cesar Fernandez, Brazil; Andrew Pietrewicz, Canada; Dan Hoornweg, Canada; Graham Campbell, Canada; Jatin Nathwani, Canada; Oskar Sigvaldason, Canada; Yvan Cliché, Canada; Carlos Arredondo Orozco, Colombia; Mónica Montoya, Colombia; Fabien Derreal, France; Francois Dassa, France; Jean-Eudes Moncomble, France; Richard Lavergne, France; Thomas Huerre, France; Csaba Marton, Germany; Hans-Wilhelm Schiffer, Germany; Volkmar Pflug, Germany; Monish Bhuyan, India; Shruti Sehgal, India; Sudhanshu Bansal, India; James Carton, Ireland; Chiara Dalla Chiesa, Italy; Claudio Dicembrino, Italy; Marco Gazzino, Italy; Maria Carolina Serra, Italy; Ryo Fukushima, Japan; Rob Whitney, New Zealand; Olawole Oyewole, Nigeria; Japhet Edward Miano Kariuki, Philippines; Ayed Al-Qahtani, Saudi Arabia; Cosimo Mauro, Spain; Maria Teresa Nonay, Spain; Pedro Luiz de Oliveira Jatoba, Spain; Santiago Mariño Cisa, Spain; Bosse Andersson, Sweden; Cansu Karaca, Turkey; Ashutosh Shastri, United Kingdom; Elena Mariotti, United Kingdom; Filipe Mota da Silva, United Kingdom; Jean-Michel Trochet, United Kingdom; Barry Worthington, United States of America; Amanda Quintero, Venezuela
Stuart Neil (Senior Director, External Affairs and Communications, World Energy Council)
WORLD ENERGY COUNCIL STUDIES COMMITTEEBrian Statham, South Africa (Chair); William D’haeseleer, Belgium; Claudia Cronenbold, Bolivia; Eduardo Correia, Brazil; Jing Ding, China; Bin Wei, China; Qinhua Xu, China; Yaxiong Zhang, China; Li Zhu, China; Jean-Paul Bouttes, France; Rauno Rintamaa, Finland; Jeanne Ng, Hong Kong; B P Rao, India; Nastaran Rahimi, Iran; Alessandro Costa, Italy; Carlo Papa, Italy; Hardiv Situmeang, Indonesia; Atsushi Noda, Japan; Arturo Vaca, Mexico; Jan Antonczyk, Poland; Ioan Dan Gheorghiu, Romania; Ayed Qahtani, Saudi Arabia; Maria Sunér Fleming, Sweden
ACCENTURE STRATEGY CONTRIBUTORSAmanpreet Talwar (Strategy Analyst, Energy Strategy, Accenture Strategy); Justin Feldman (Strategy Analyst, Energy Strategy, Accenture Strategy); Christopher Hairel (Business Strategy Sr. Manager, Energy Strategy, Accenture Strategy); Nuri Demirdoven (Managing Director, Energy Strategy, Accenture Strategy)

THE GRAND TRANSITION
135
PAUL SCHERRER INSTITUTE − CONTRIBUTORS
Tom Kober (Head Energy Economics Group, Paul Scherrer Institute); Evangelos Panos (Post-doctoral Researcher, Energy Economics Group, Paul Scherrer Institute); Kathrin Volkart (PhD Student, Energy Economics Group, Paul Scherrer Institute); Stefan Hirschberg (Head of Laboratory for Energy Systems Analysis / Energy Divisions, Paul Scherrer Institute)
The views expressed in this report are those of the World Energy Council and do not necessarily reflect those of PSI or the Energy Economics Team.
OTHER CONTRIBUTORSAlan Thomson (Director, Global Leader Energy Systems, Arup); Paula Kirk (Director, Global Distributed Energy Leader, Arup); Stephen Cook (Associate Director, Arup); Yanbing Kang (Director, Energy Sustainability Centre, Energy Research Institute – NDRC), Yufeng Yang (Director, Energy System Analysis Centre, Energy Research Institute – NDRC)
PROJECT TEAMChristoph Frei (Secretary General, World Energy Council); Gerald Davis (Executive Chair, World Energy Scenarios, World Energy Council); Karl Rose (Senior Director, Scenarios and Policies, World Energy Council); Brian Statham (Chair, Studies Committee, World Energy Council); Arthur Hanna (Senior Managing Director, Energy Strategy, Accenture Strategy); Muqsit Ashraf (Senior Managing Director, Energy Strategy, Accenture Strategy); Richard Kho (Managing Director, Energy Strategy, Accenture Strategy); Serge Younes (Director, Utilities Strategy and Sustainability, Accenture Strategy)
LEAD AUTHORSMelany Vargas (Business Strategy Manager, Energy Strategy, Accenture Strategy); Gerald Davis (Executive Chair, World Energy Scenarios, World Energy Council)
PROJECT MANAGEMENTMelany Vargas (Business Strategy Manager, Energy Strategy, Accenture Strategy); Seijin Kim (Director, Special Projects and Flagships, World Energy Council); Christoph Menzel (Project Manager, Scenarios and Resources, World Energy Council); Zulandi van der Westhuizen (Deputy Director, Resources and Scenarios, World Energy Council)

136
WORLD ENERGY COUNCIL | SCENARIOS
MARIE-JOSÉ NADEAU Chair
YOUNGHOON DAVID KIM Co-chair
MATAR AL NEYADI Vice Chair – Special Responsibility Gulf States/Middle East
NUER BAIKELI Vice Chair – Asia
KLAUS-DIETER BARBKNECHT Vice Chair – Finance
LEONHARD BIRNBAUM Vice Chair – Europe
OLEG BUDARGIN Vice Chair – Responsibility for Regional Development
JOSÉ DA COSTA CARVALHO NETO Chair – Programme Committee
JEAN-MARIE DAUGER Chair – Communications & Strategy Committee
HASAN MURAT MERCAN Vice Chair – 2016 Congress, Istanbul
BONANG MOHALE Vice Chair – Africa
SHIGERU MURAKI Vice Chair – Asia Pacific/South Asia
O.H. (DEAN) OSKVIG Vice Chair – North America
BRIAN A. STATHAM Chair – Studies Committee
JOSÉ ANTONIO VARGAS LLERAS Vice Chair – Latin America/Caribbean
CHRISTOPH FREI Secretary General
Accenture Strategy
Bloomberg New Energy Finance
Electricité de France
Emirates Nuclear Energy Corporation
ENGIE
GE Power
Hydro-Québec
Korea Electric Power Corp.
Marsh & McLennan Companies
Masdar
Oliver Wyman
PricewaterhouseCoopers
Siemens AG
Swiss Re Corporate Solutions
Tokyo Electric Power Co.
VNG – Verbundnetz Gas AG
OFFICERS OF THE WORLD ENERGY COUNCIL
PATRONS OF THE WORLD ENERGY COUNCIL

THE GRAND TRANSITION
137
World Energy Scenarios, published by the World Energy Council (2016) in collaboration with Accenture Strategy and Paul Scherrer Institute.
Copyright © 2016 World Energy Council. All rights reserved. All or part of this publication may be used or reproduced as long as the following citation is included on each copy or transmission: ‘Used by permission of the World Energy Council’. www.worldenergy.org
World Energy Council, Company Limited by Guarantee No. 4184478
Registered in England and Wales No. 4184478, VAT Reg. No. GB 123 3802 48 Registered Office 62–64 Cornhill, London EC3V 3NH, United Kingdom
ISBN: 978 0 946121 57 1

Algeria
Argentina
Armenia
Austria
Bahrain
Belgium
Bolivia
Botswana
Brazil
Bulgaria
Cameroon
Canada
Chad
Chile
China
Colombia
Congo (Dem. Rep.)
Côte d’Ivoire
Croatia
Cyprus
Czech Republic
Denmark
Ecuador
Egypt (Arab Rep.)
Estonia
Ethiopia
Finland
France
Germany
Ghana
Greece
Hong Kong, China
Hungary
Iceland
India
Iran (Islamic Rep.)
Iraq
Ireland
Israel
Italy
Japan
Jordan
Kazakhstan
Kenya
Korea (Rep.)
Kuwait
Latvia
Lebanon
Libya
Lithuania
Luxembourg
Malaysia
Mexico
Monaco
Mongolia
Morocco
Namibia
Nepal
Netherlands
New Zealand
Niger
Nigeria
Pakistan
Paraguay
Peru
Philippines
Poland
Portugal
Qatar
Romania
Russian Federation
Saudi Arabia
Senegal
Serbia
Singapore
Slovakia
Slovenia
South Africa
Spain
Sri Lanka
Swaziland
Sweden
Switzerland
Syria (Arab Rep.)
Tanzania
Thailand
Trinidad & Tobago
Tunisia
Turkey
Ukraine
United Arab Emirates
United Kingdom
United States
Uruguay
Zimbabwe
WORLD ENERGY COUNCIL
62–64 CornhillLondon EC3V 3NH United KingdomT (+44) 20 7734 5996F (+44) 20 7734 5926E [email protected]
www.worldenergy.org | @WECouncil