
World Energy Outlook 2010 · World Energy Outlook 2010 ... 1990 1995 2000 2005 2010 2015 2020 2025...
35
© OECD/IEA 2010 World Energy Outlook 2010 Nobuo Tanaka Executive Director International Energy Agency Beijing, 17 November 2010
Transcript of World Energy Outlook 2010 · World Energy Outlook 2010 ... 1990 1995 2000 2005 2010 2015 2020 2025...

© OECD/IEA 2010
World Energy Outlook 2010
Nobuo TanakaExecutive DirectorInternational Energy Agency
Beijing, 17 November 2010
© OECD/IEA 2010
The context: A time of unprecedented uncertainty
The worst of the global economic crisis appears to be over – but is the recovery sustainable?
Oil demand & supply are becoming less sensitive to price – what does this mean for future price movements ?
Natural gas markets are in the midst of a revolution – will it herald a golden era for gas?
Copenhagen Accord & G-20 subsidy reforms are key advances –but do they go far enough & will they be fully implemented ?
Emerging economies will shape the global energy future –where will their policy decisions lead us ?

© OECD/IEA 2010
Overview of WEO-2010 scenarios
New Policies Scenario is the central scenario in WEO-2010
> assumes cautious implementation of recently announced commitments & plans, even if yet to be formally adopted
> provides benchmark to assess achievements & limitations of recent developments in climate & energy policy
Current Policies Scenario takes into consideration only those policies that had been formally adopted by mid-2010
> equivalent to the Reference Scenario of past Outlooks
The 450 Scenario sets out an energy pathway consistent with the goal of limiting increase in average temperature to 2OC
© OECD/IEA 2010
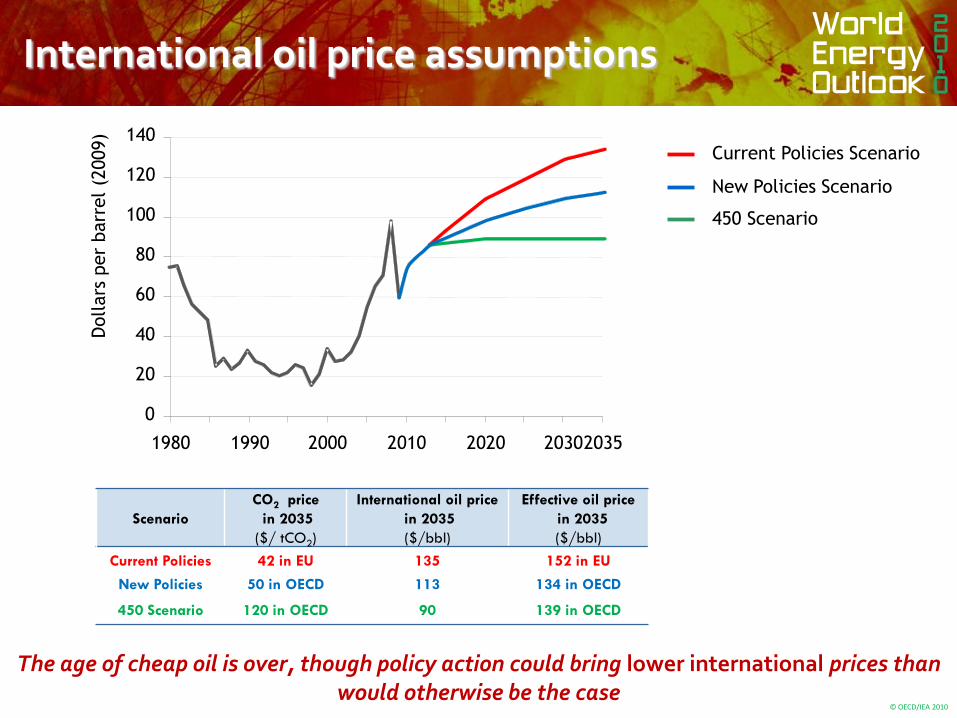
International oil price assumptions
The age of cheap oil is over, though policy action could bring lower international prices than would otherwise be the case
Scenario
CO2 price
in 2035
($/ tCO2)
International oil price
in 2035
($/bbl)
Effective oil price
in 2035
($/bbl)
Current Policies 42 in EU 135 152 in EU
New Policies 50 in OECD 113 134 in OECD
450 Scenario 120 in OECD 90 139 in OECD
0
20
40
60
80
100
120
140
1980 1990 2000 2010 2020 20302035
Dollars
per
barr
el
(2009)
Current Policies Scenario
New Policies Scenario
450 Scenario
© OECD/IEA 2010
0
2 000
4 000
6 000
8 000
10 000
12 000
14 000
16 000
18 000
Mto
e
1980 1990 2000 2010 2020 2030 2035
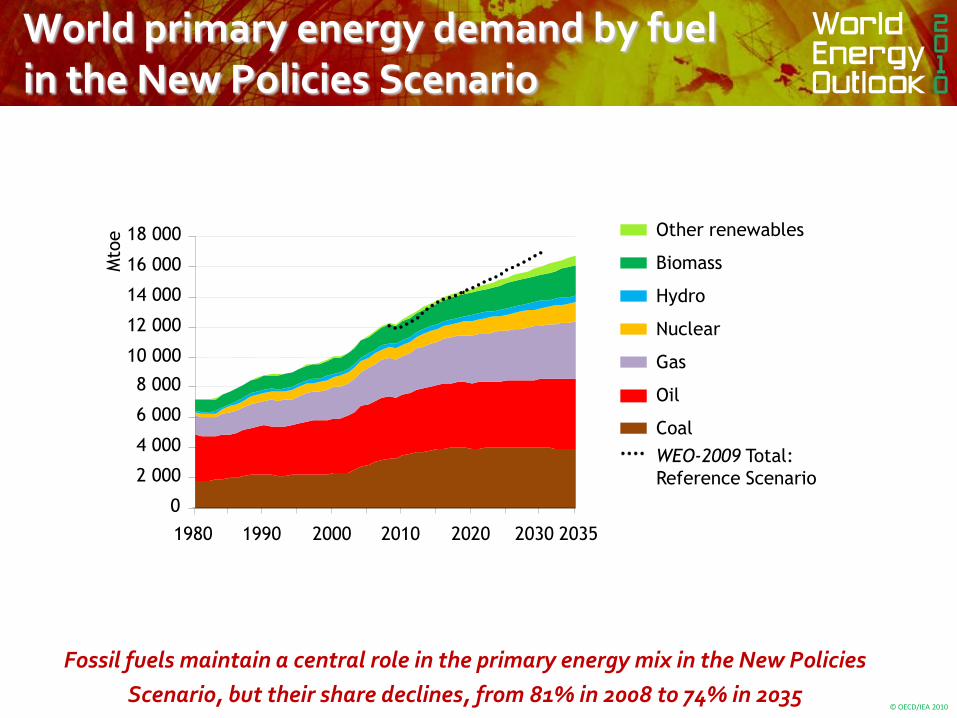
World primary energy demand by fuelin the New Policies Scenario
Fossil fuels maintain a central role in the primary energy mix in the New Policies
Scenario, but their share declines, from 81% in 2008 to 74% in 2035
Other renewables
Biomass
Hydro
Nuclear
Gas
Oil
Coal
WEO-2009 Total:
Reference Scenario
© OECD/IEA 2010
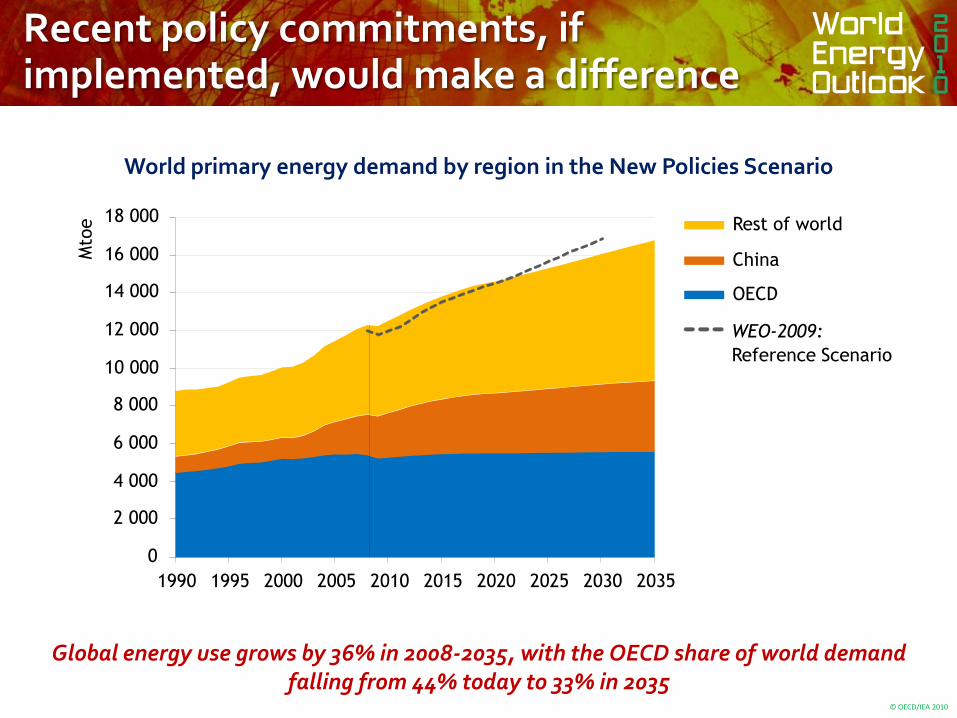
Recent policy commitments, if implemented, would make a difference
Global energy use grows by 36% in 2008-2035, with the OECD share of world demand falling from 44% today to 33% in 2035
World primary energy demand by region in the New Policies Scenario
0
2 000
4 000
6 000
8 000
10 000
12 000
14 000
16 000
18 000
1990 1995 2000 2005 2010 2015 2020 2025 2030 2035
Mto
e Rest of world
China
OECD
WEO-2009:
Reference Scenario
© OECD/IEA 2010
Other renewables
Biomass
Hydro
Nuclear
Gas
Oil
Coal
WEO-2009 Total:
Reference Scenario0
500
1 000
1 500
2 000
2 500
3 000
3 500
4 000
1980 1990 2000 2010 2020 2030
Mto
e
2035
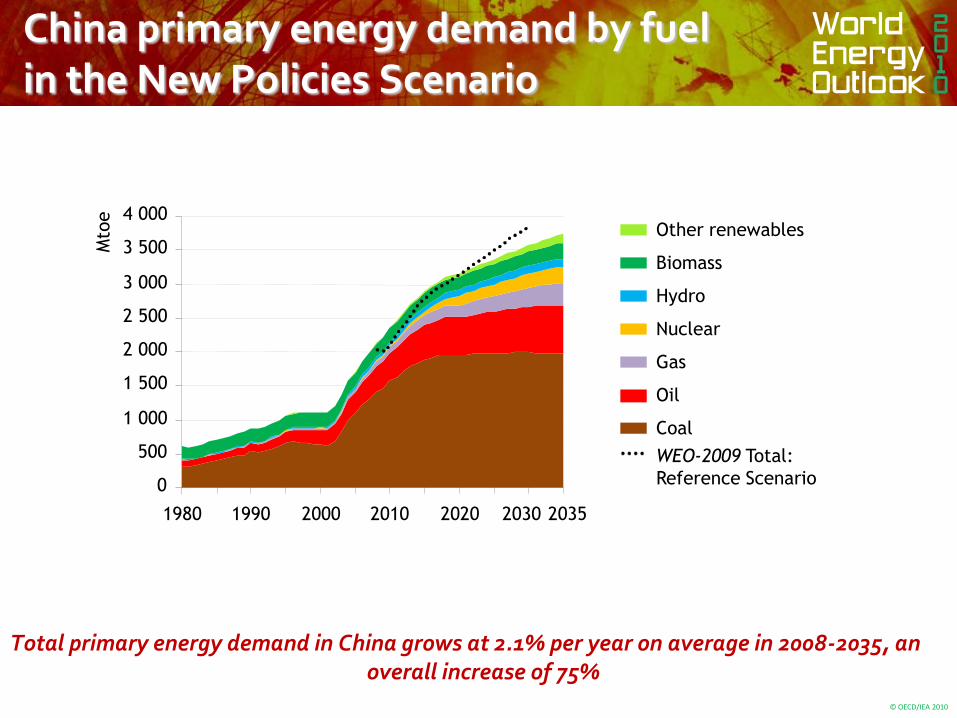
China primary energy demand by fuel in the New Policies Scenario
Total primary energy demand in China grows at 2.1% per year on average in 2008-2035, an overall increase of 75%

© OECD/IEA 2010
Emerging economies dominate the growth in demand for all fuels
Demand for all types of energy increases in non-OECD countries, while demand for coal & oil declines in the OECD
Incremental primary energy demand in the New Policies Scenario, 2008-2035
- 600 - 300 0 300 600 900 1 200 1 500
Other renewables
Hydro
Nuclear
Gas
Oil
Coal
Mtoe
OECD
China
Rest of world

© OECD/IEA 2010
Fossil-fuel subsidies are distorting price signals
Fossil-fuel consumption subsidies amounted to $312 billion in 2009, down from $558 billion in 2008, with the bulk of the fall due to lower international prices
Economic value of fossil-fuel consumption subsidies by country, 2009
Turk
menis
tan
Electricity(generated from
fossil fuels)
Gas
Oil
Coal
Additional
subsidy in 2008
Iran
Saudi Ara
bia
Russ
ia
India
Chin
a
Egypt
Venezuela
Indonesi
a
UAE
Uzbekis
tan
Iraq
Kuw
ait
Pakis
tan
Arg
enti
na
Ukra
ine
Alg
eri
a
Mala
ysi
a
Thailand
Bangla
desh
Mexic
o
South
Afr
ica
Qata
r
Kazakhst
an
Lib
ya
0
Billion d
ollars
20
40
60
80
100

© OECD/IEA 2010
Booming demand for mobility in the emerging economies drives up oil use
The global car fleet will continue to surge as more & more people in China & other emerging economies buy a car, overshadowing modest growth in the OECD
0
200
400
600
800
1 000
1 200
1 400
1 600
1980 1990 2000 2008 2020 2035
Million China
Other non-OECD
United States
Other OECD
Passenger vehicles in the New Policies Scenario

© OECD/IEA 2010
0
20
40
60
80
100
1990 1995 2000 2005 2010 2015 2020 2025 2030 2035
mb/d
Crude oil:
fields yet to be developed
Crude oil:
currently producing fields
Total crude oil
Oil production becomes less crude
Global oil production reaches 96 mb/d in 2035 on the back of rising output of natural gas liquids & unconventional oil, as crude oil production plateaus
World oil production by type in the New Policies Scenario
Unconventional oil
Natural gas liquids
Crude oil:
fields yet to be found

© OECD/IEA 2010
More oil from fewer producers
Production rises most in Saudi Arabia & Iraq, helping to push OPEC’s market share from 41% today to 52% by 2035, a level last seen prior to the first oil shock of 1973-1974
Incremental oil production by key country in the New Policies Scenario, 2009-2035
0 1 2 3 4 5 6
Algeria
Libya
Nigeria
Qatar
Iran
Kuwait
UAE
Venezuela
Canada
Kazakhstan
Brazil
Iraq
Saudi Arabia
mb/d
OPEC
Non-OPEC
© OECD/IEA 2010
A golden age for gas?
Gas is set to play a key role in meeting the world’s energy needs
> demand rises by 44%, led by China & Middle East
Unconventional gas accounts for 35% of the increase in global supply to 2035, with new non-US producers emerging
Gas glut will peak soon, but may dissipate only very slowly
The glut will keep pressure on gas exporters to move away from oil-price indexation, notably in Europe
Lower prices could lead to stronger demand for gas, backing out renewables & coal in power generation
© OECD/IEA 2010
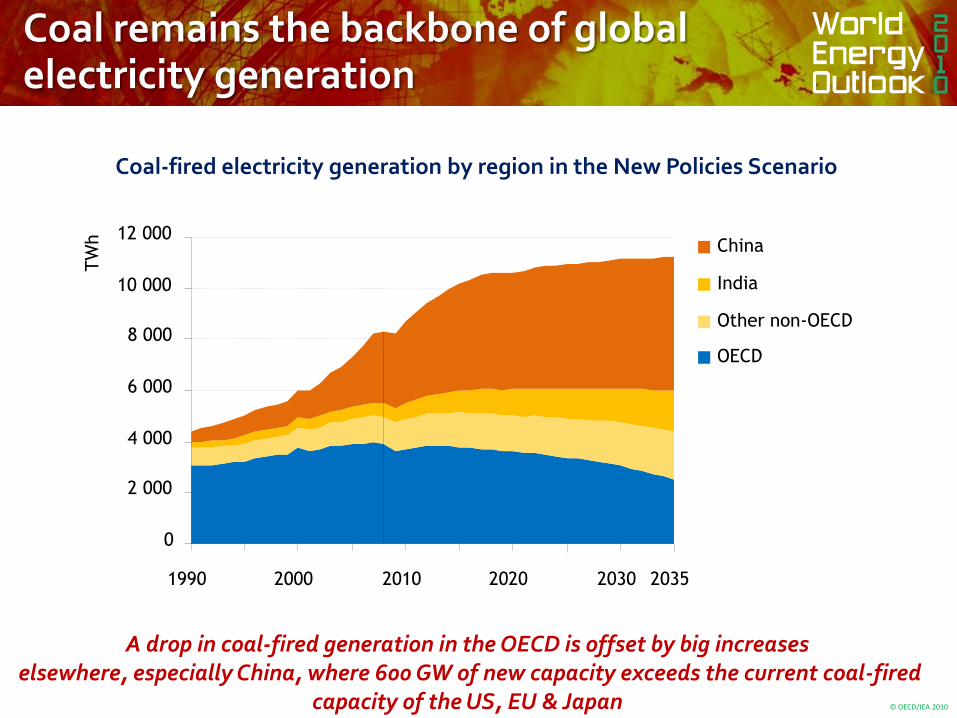
Coal remains the backbone of global electricity generation
A drop in coal-fired generation in the OECD is offset by big increaseselsewhere, especially China, where 600 GW of new capacity exceeds the current coal-fired
capacity of the US, EU & Japan
0
2 000
4 000
6 000
8 000
10 000
12 000
1990 2000 2010 2020 2030 2035
TW
h China
India
Other non-OECD
OECD
Coal-fired electricity generation by region in the New Policies Scenario

© OECD/IEA 2010
Renewables enter the mainstream….
The use of renewable energy triples between 2008 & 2035, driven by the power sector where their share in electricity supply rises from 19% in 2008 to 32% in 2035
Renewable primary energy demand in the New Policies Scenario
0 100 200 300 400 500
European Union
United States
China
Brazil
India
Africa
OECD Pacific
Mtoe
2008
2035

© OECD/IEA 2010
….but only if there is enough government support
Government support remains the key driver – rising from $57 billion in 2009 to $205 billion in 2035 – but higher fossil-fuel prices & declining investment costs also spur growth
Annual global support for renewables in the New Policies Scenario
Billion d
ollars
(2009)
Biofuels
Renewables-based
electricity
0
30
60
90
120
150
180
210
2007 2008 2009 2015 2020 2025 2030 2035
© OECD/IEA 2010
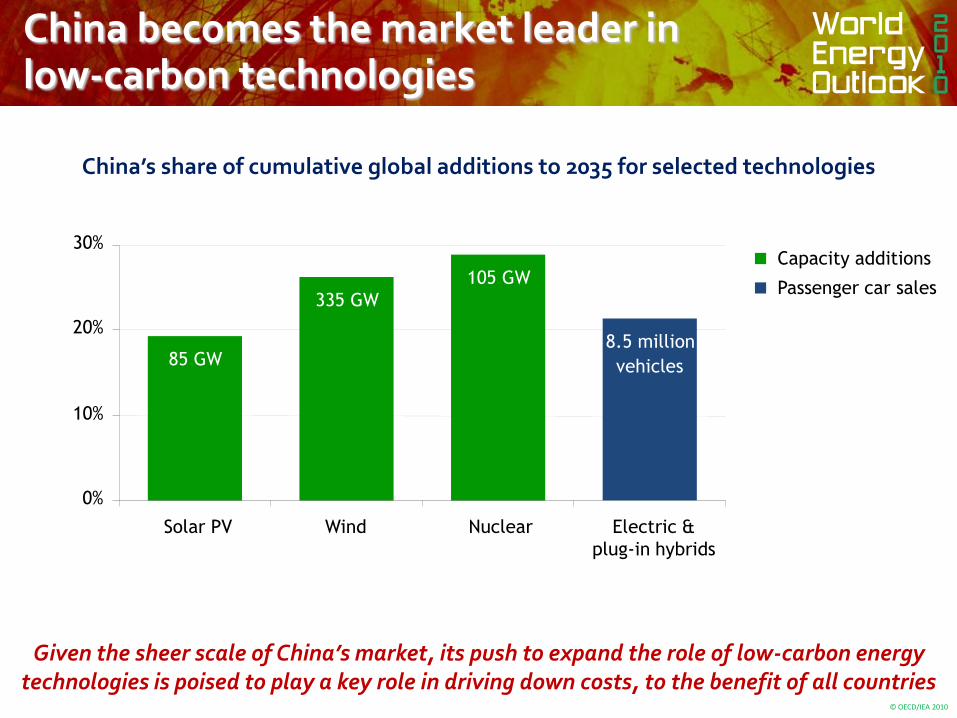
China becomes the market leader inlow-carbon technologies
Passenger car sales
Capacity additions
China’s share of cumulative global additions to 2035 for selected technologies
Given the sheer scale of China’s market, its push to expand the role of low-carbon energy technologies is poised to play a key role in driving down costs, to the benefit of all countries
85 GW
335 GW
105 GW
0%
10%
20%
30%
Solar PV Wind Nuclear Electric &
plug-in hybrids
8.5 million
vehicles
© OECD/IEA 2010
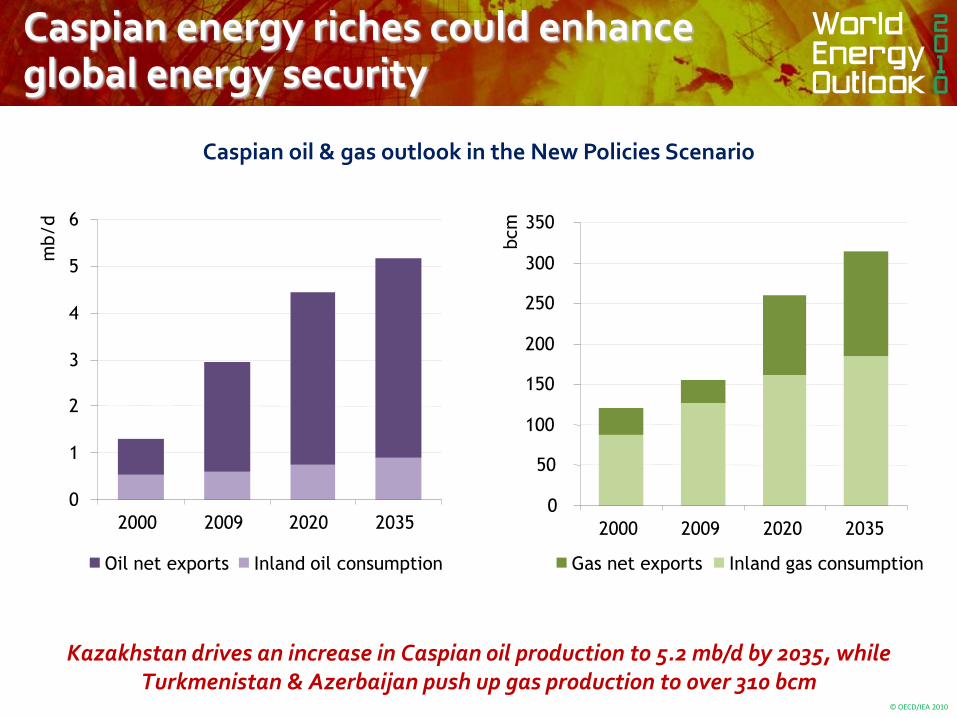
Caspian energy riches could enhance global energy security
Kazakhstan drives an increase in Caspian oil production to 5.2 mb/d by 2035, while Turkmenistan & Azerbaijan push up gas production to over 310 bcm
Caspian oil & gas outlook in the New Policies Scenario
0
1
2
3
4
5
6
2000 2009 2020 2035
mb/d
Oil net exports Inland oil consumption
0
50
100
150
200
250
300
350
2000 2009 2020 2035bcm
Gas net exports Inland gas consumption

© OECD/IEA 2010
Number of people without access to electricity(million)
Today, there are 1.4 billion people lacking access to electricity. Based on current trends, 1.2 billion people – or 15% of the world’s population –
will still lack access in 2030
© OECD/IEA 2010
The 450 Scenario:A roadmap from 3.5C to 2C
The 450 Scenario sets out an energy pathway consistent with limiting the increase in temperature to 2C
Assumes vigorous implementation of Copenhagen Accord pledges to 2020 & much stronger action thereafter
The failure of the Copenhagen Accord pledges:
> As many lack transparency, there is 3.9 Gt of uncertainty over the level of abatement pledged to 2020
> As many lack ambition, the cost of achieving the 2 C goal has increased by $1 trillion in 2010-2030 compared with WEO-2009

© OECD/IEA 2010
In the 450 Scenario, compared with the Current Policies Scenario, efficiency measures provide 53% of the necessary abatement, but renewables, CCS & nuclear are also crucial
World energy-related CO2 emission savings by technology in the 450 Scenario relative to the Current Policies Scenario
20
25
30
35
40
45
2008 2015 2020 2025 2030 2035
Gt
Efficiency 53%
Renewables 21%
Biofuels 3%
Nuclear 9%
CCS 15%
Share of cumulative abatement
between 2010-203542.6 Gt
21.7 Gt450 Scenario
20.9 Gt
Current Policies
Scenario
The 450 Scenario: Abatement by technology
© OECD/IEA 2010
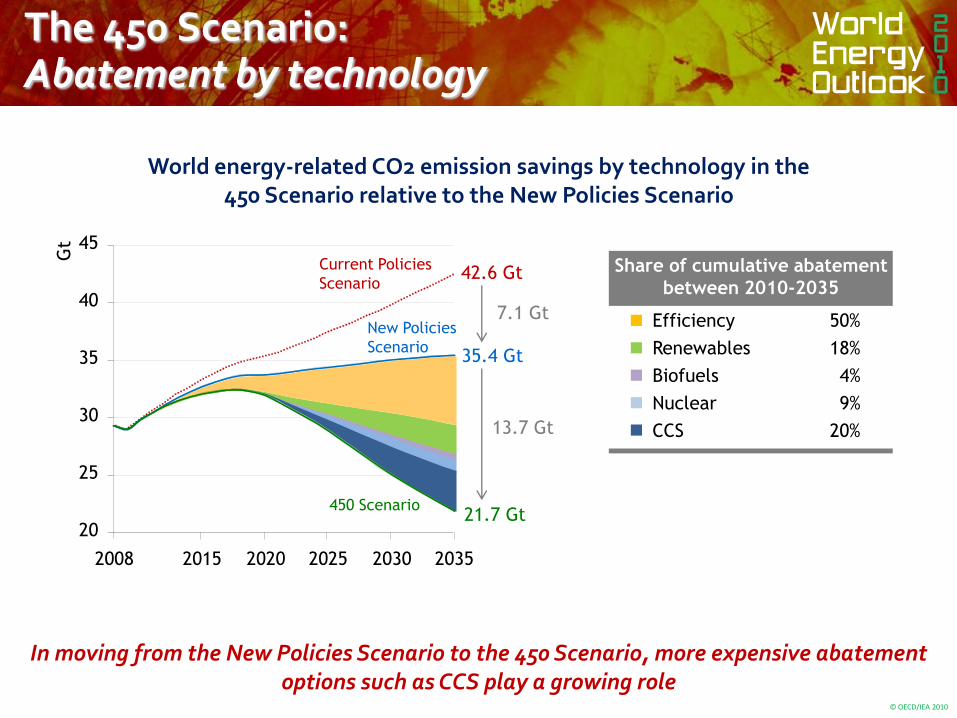
The 450 Scenario: Abatement by technology
In moving from the New Policies Scenario to the 450 Scenario, more expensive abatement options such as CCS play a growing role
World energy-related CO2 emission savings by technology in the 450 Scenario relative to the New Policies Scenario
20
25
30
35
40
45
2008 2015 2020 2025 2030 2035
Gt
Efficiency 50%
Renewables 18%
Biofuels 4%
Nuclear 9%
CCS 20%
Share of cumulative abatement
between 2010-203542.6 Gt
35.4 Gt
21.7 Gt
Current Policies
Scenario
450 Scenario
New Policies
Scenario
13.7 Gt
7.1 Gt
© OECD/IEA 2010
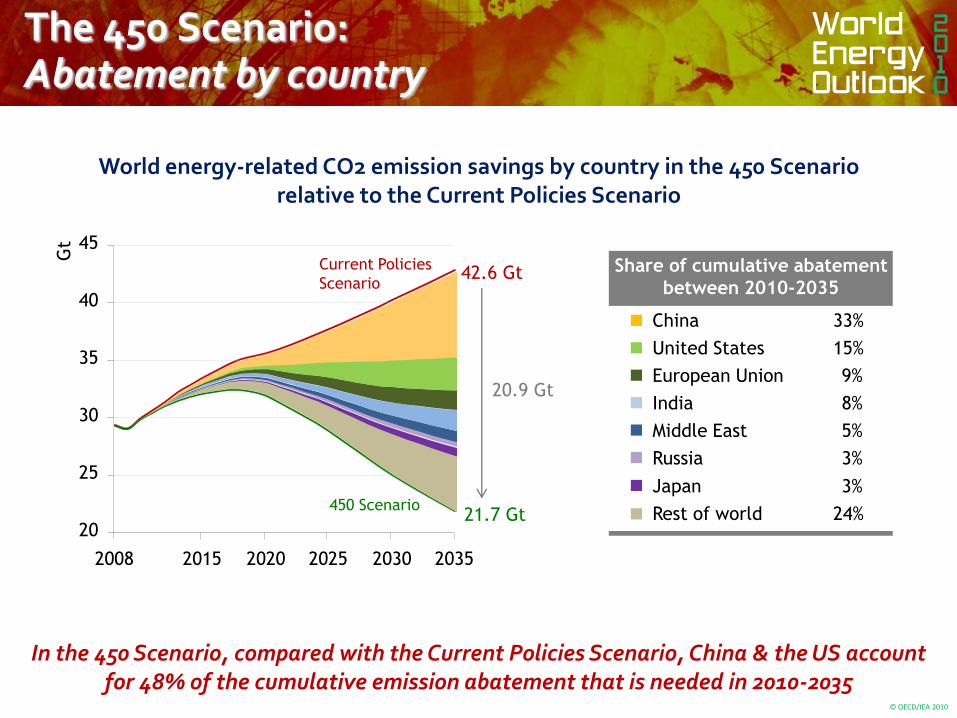
In the 450 Scenario, compared with the Current Policies Scenario, China & the US account for 48% of the cumulative emission abatement that is needed in 2010-2035
World energy-related CO2 emission savings by country in the 450 Scenariorelative to the Current Policies Scenario
20
25
30
35
40
45
2008 2015 2020 2025 2030 2035
Gt
China 33%
United States 15%
European Union 9%
India 8%
Middle East 5%
Russia 3%
Rest of world 24%
Share of cumulative abatement
between 2010-2035
Japan 3%
42.6 Gt
21.7 Gt
Current Policies
Scenario
450 Scenario
20.9 Gt
The 450 Scenario: Abatement by country

© OECD/IEA 2010
Achieving the 2°C goal will require rapid decarbonisation of global energy
Carbon intensity would have to fall at twice the rate of 1990-2008 in the period 2008-2020 & almost four times faster in 2020-2035
Average annual change in CO2 intensity in the 450 scenario
0%
1%
2%
3%
4%
5%
6%
1990-2008 2008-2020 2020-2035
A four-fold
increase needed
© OECD/IEA 2010
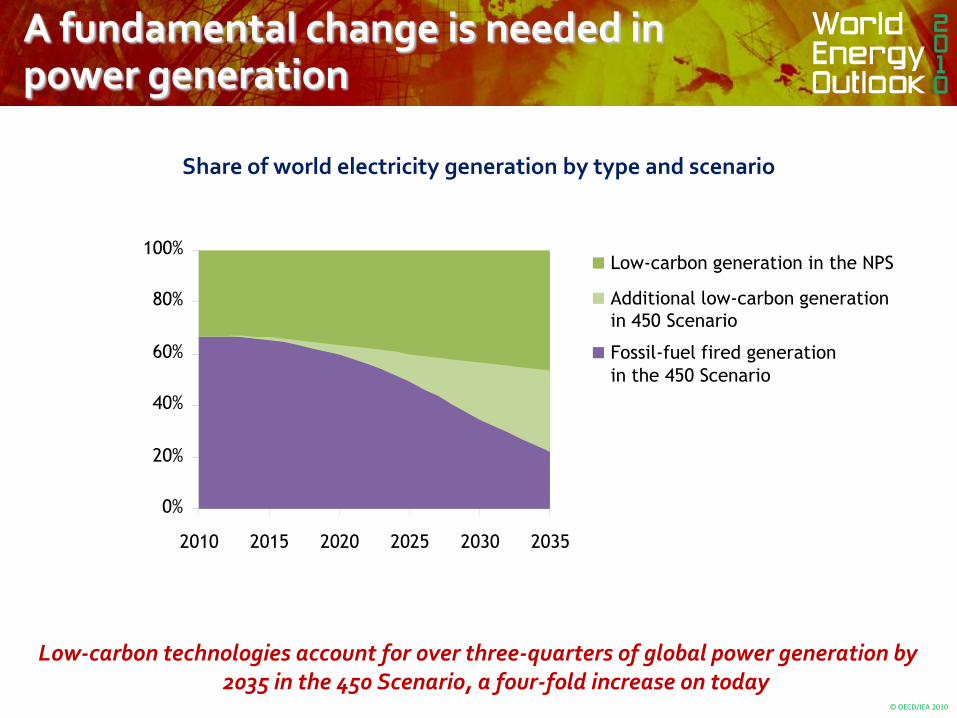
A fundamental change is needed in power generation
Low-carbon technologies account for over three-quarters of global power generation by 2035 in the 450 Scenario, a four-fold increase on today
Share of world electricity generation by type and scenario
Additional low-carbon generation
in 450 Scenario
Low-carbon generation in the NPS
Fossil-fuel fired generation
0%
20%
40%
60%
80%
100%
2010 2015 2020 2025 2030 2035
in the 450 Scenario
© OECD/IEA 2010
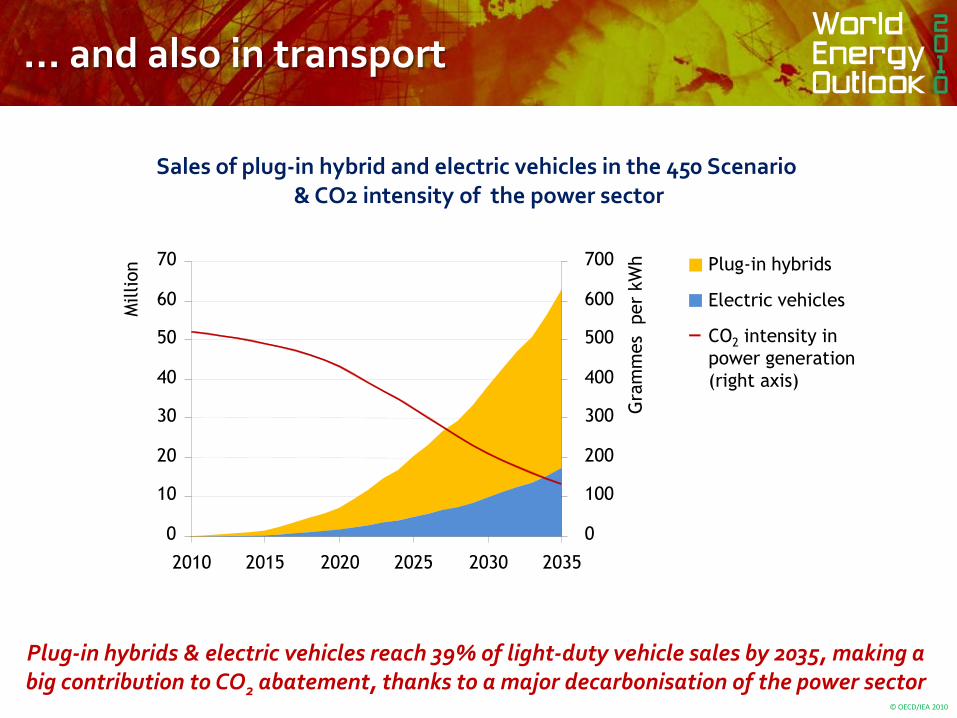
… and also in transport
Plug-in hybrids & electric vehicles reach 39% of light-duty vehicle sales by 2035, making a big contribution to CO2 abatement, thanks to a major decarbonisation of the power sector
Sales of plug-in hybrid and electric vehicles in the 450 Scenario
CO2 intensity in
power generation
(right axis)
Electric vehicles
Plug-in hybrids
& CO2 intensity of the power sector
0
100
200
300
400
500
600
700
Gra
mm
es
per
kW
h
0
10
20
30
40
50
60
70
2010 2015 2020 2025 2030 2035
Million

© OECD/IEA 2010
Will peak oil be a guest or the spectreat the feast?
Oil demand peaks at 88 mb/d before 2020 & falls to 81 mb/d in 2035, with a plunge in OECD demand more than offsetting continuing growth in non-OECD demand
Oil demand
World demand in
450 Scenario
Inter-regional
(bunkers)
Other non-OECD
India
China
OECD
Right axis:
2009 2015 2020 2025 2030 2035
mb/d
68
72
76
80
84
88
92
96
100
mb/d
-16
-12
-8
-4
0
4
8
12
16 World demand in
New Policies Scenario
Peak demand
in the 450 Scenario

© OECD/IEA 2010
Combating climate change will bring economic benefits as well as costs
In the 450 Scenario, annual spending on oil imports in 2035 by the five largest importers is around $560 billion, or one-third, lower than in the New Policies Scenario
Oil-import bills as share of GDP in selected countries
0%
1%
2%
3%
4%
5%
6%
7%
8%
European
Union
United
States
Japan China India
1980
2008
2009
2035: New Policies Scenario
2035: 450 Scenario
© OECD/IEA 2010
China in the 450 Scenario
© OECD/IEA 2010
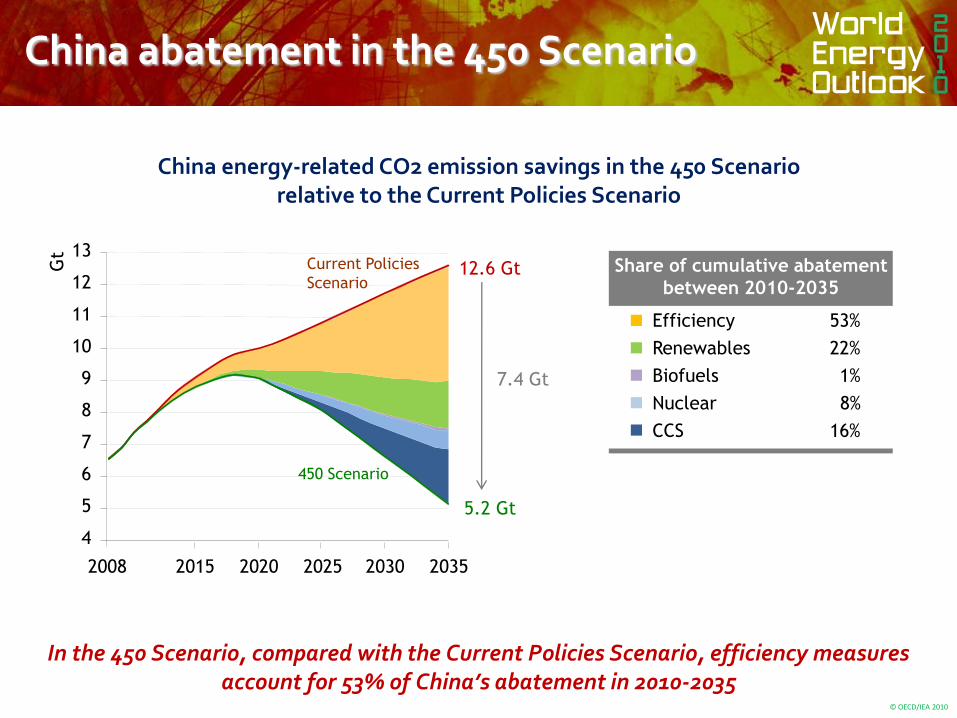
China abatement in the 450 Scenario
In the 450 Scenario, compared with the Current Policies Scenario, efficiency measures account for 53% of China’s abatement in 2010-2035
China energy-related CO2 emission savings in the 450 Scenariorelative to the Current Policies Scenario
Efficiency 53%
Renewables 22%
Biofuels 1%
Nuclear 8%
CCS 16%
Share of cumulative abatement
between 2010-203512.6 Gt
5.2 Gt
7.4 Gt
4
5
6
7
8
9
10
11
12
13
2008 2015 2020 2025 2030 2035
Gt
Current Policies
Scenario
450 Scenario

© OECD/IEA 2010
China abatement in the 450 Scenario
In moving from the New Policies Scenario to the 450 Scenario, China starts to rely more on CCS as room for further abatement from lower-cost options becomes limited
China energy-related CO2 emission savings in the 450 Scenariorelative to the New Policies Scenario
Efficiency 50%
Renewables 18%
Biofuels 1%
Nuclear 8%
CCS 23%
Share of cumulative abatement
between 2010-203512.6 Gt
5.2 Gt
5.0 Gt
4
5
6
7
8
9
10
11
12
13
2008 2015 2020 2025 2030 2035
Gt
Current Policies
Scenario
450 Scenario
10.1 Gt
2.4 GtNew Policies
Scenario

© OECD/IEA 2010
Low-carbon technologies account for 78% of China’s power generation by 2035 in the 450 Scenario, up from 19% today
Share of China electricity generation by type and scenario
Additional low-carbon generation
in 450 Scenario
Low-carbon generation in the NPS
Fossil-fuel fired generation
0%
20%
40%
60%
80%
100%
2010 2015 2020 2025 2030 2035
in the 450 Scenario
Power generation in China in the 450 Scenario

© OECD/IEA 2010
Sales of plug-in hybrid and electric vehicles in the 450 Scenario
CO2 intensity in
power generation
(right axis)
Electric vehicles
Plug-in hybrids
& CO2 intensity of the power sector in China
0
3
6
9
12
15
18
21
24
2010 2015 2020 2025 2030 2035
Million
0
100
200
300
400
500
600
700
800
Gra
mm
es
per
kW
h
Transport in China in the 450 Scenario
In China, plug-in hybrids & electric vehicles reach 45% of new light-duty vehicle sales by 2035
© OECD/IEA 2010
Summary & conclusions
Recently announced policies can make a difference, but fall well short of what is needed for a secure & sustainable energy future
Lack of ambition in Copenhagen has increased the cost of achieving the 2C goal & made it less likely to happen
> Unless commitments are fully implemented by 2020, it will be all but impossible to achieve the goal
The age of cheap oil is over, though policy action could bring lower international prices than would otherwise be the case
Renewables are entering the mainstream, but long-term support is needed to boost their competitiveness
Getting the prices right, by phasing-out fossil-fuel subsidies, is the single most effective measure to cut energy demand

© OECD/IEA 2010
Implications for China
China's role in global energy is set to expand & its policies will significantly impact global energy trends & prospects for limiting climate change
A golden age of gas led by China in the interest of diversifying the fuel mix can contribute greatly to reducing CO2 and other emissions
Continued energy pricing reforms in China is a triple-win for enhancing energy security, reducing emissions & immediate economic gains
China's role as leader in developing, manufacturing & deploying low-carbon technologies can drive down costs, to the benefits of all countries
Growing interconnectedness & China's increasing weight in the energy market links its energy security to global energy security


