WORLD ENERGY INVESTMENT OUTLOOKsiteresources.worldbank.org/EXTENERGY2/Resources/4114199...WORLD...
37
Dr. Fatih Birol Chief Economist Head, Economic Analysis Division International Energy Agency / OECD WORLD ENERGY INVESTMENT OUTLOOK
Transcript of WORLD ENERGY INVESTMENT OUTLOOKsiteresources.worldbank.org/EXTENERGY2/Resources/4114199...WORLD...
Dr. Fatih BirolChief Economist Head, Economic Analysis DivisionInternational Energy Agency / OECD
WORLDENERGYINVESTMENTOUTLOOK
Global Strategic Challenges
l Security of energy supplies
l Threat of environmental damage caused by energy use
l Uneven access of the world’s population to modern energy
l Investment in energy-supply infrastructure
Global Energy Global Energy Investment OutlookInvestment Outlook

World Energy Investment2001-2030
Total investment: 16 trillion dollars
Oil 19%
Electricity60%
Coal 2%Gas 19%
OtherRefining
E&D 72%
13%15%
E&D
LNG Chain
T&D and Storage
55%
37%
8%
Power generation
T&D54%
46%
Mining
Shipping and ports
12%
88%
Production accounts for the majority of investment in the supplychain – except for electricity
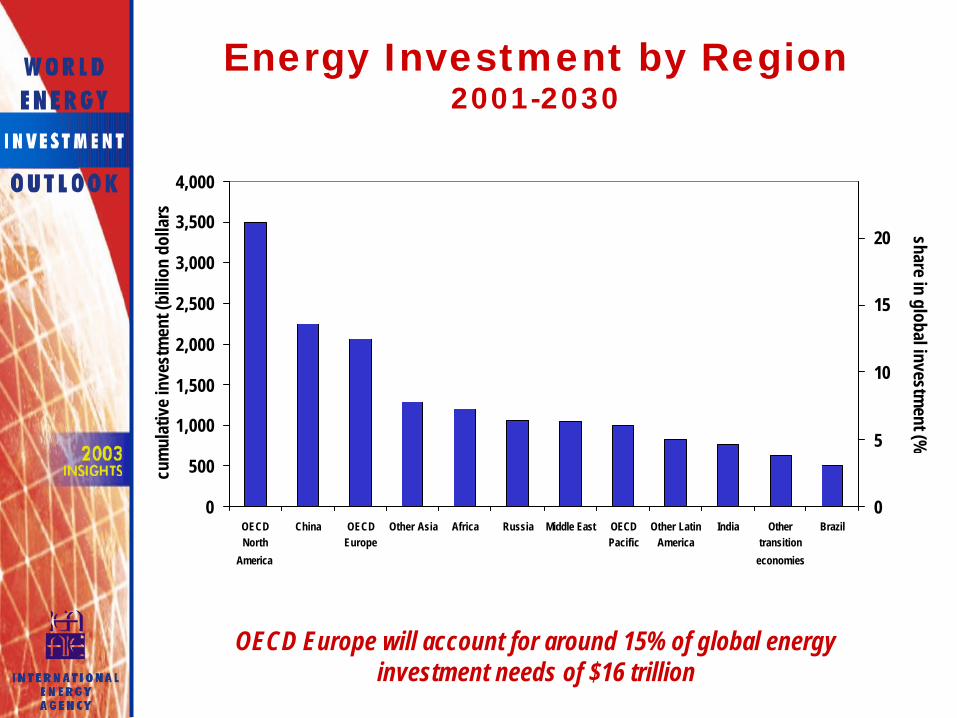
Energy Investment by Region 2001-2030
0
500
1,000
1,500
2,000
2,500
3,000
3,500
4,000
OECDNorth
America
China OECDEurope
Other Asia Africa Russia Middle East OECDPacific
Other LatinAmerica
India Othertransition
economies
Brazil
cum
ulat
ive
inve
stm
ent (
billi
on d
olla
rs)
0
5
10
15
20 share in global investment (%
)
OECD Europe will account for around 15% of global energy investment needs of $16 trillion
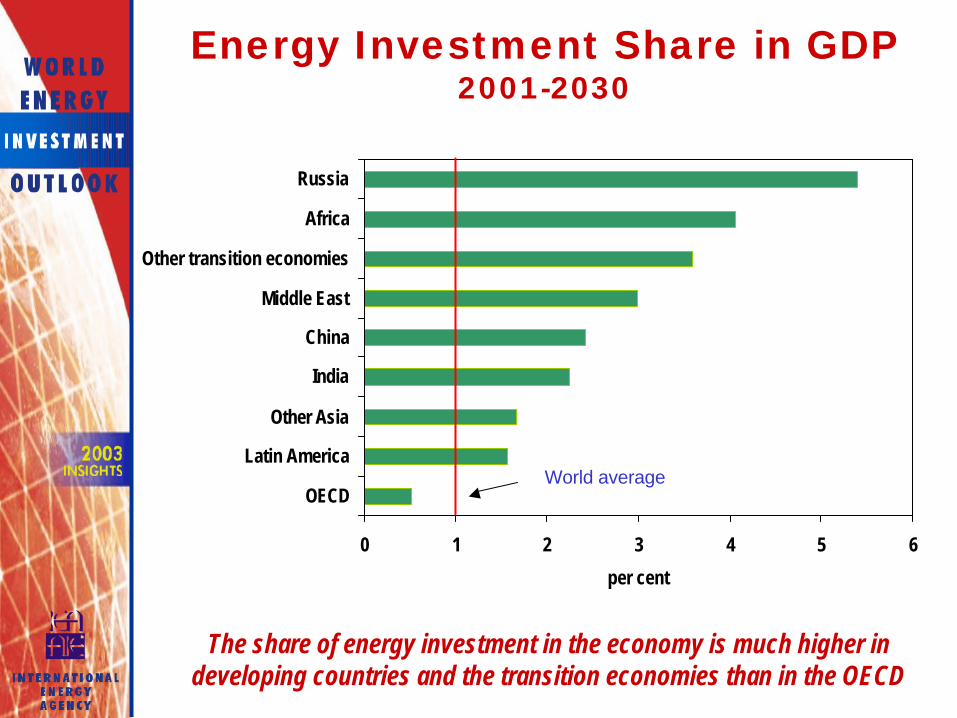
Energy Investment Share in GDP2001-2030
0 1 2 3 4 5 6
OECD
Latin America
Other Asia
India
China
Middle East
Other transition economies
Africa
Russia
per cent
World average
The share of energy investment in the economy is much higher in developing countries and the transition economies than in the OECD

Oil Investment OutlookOil Investment Outlook
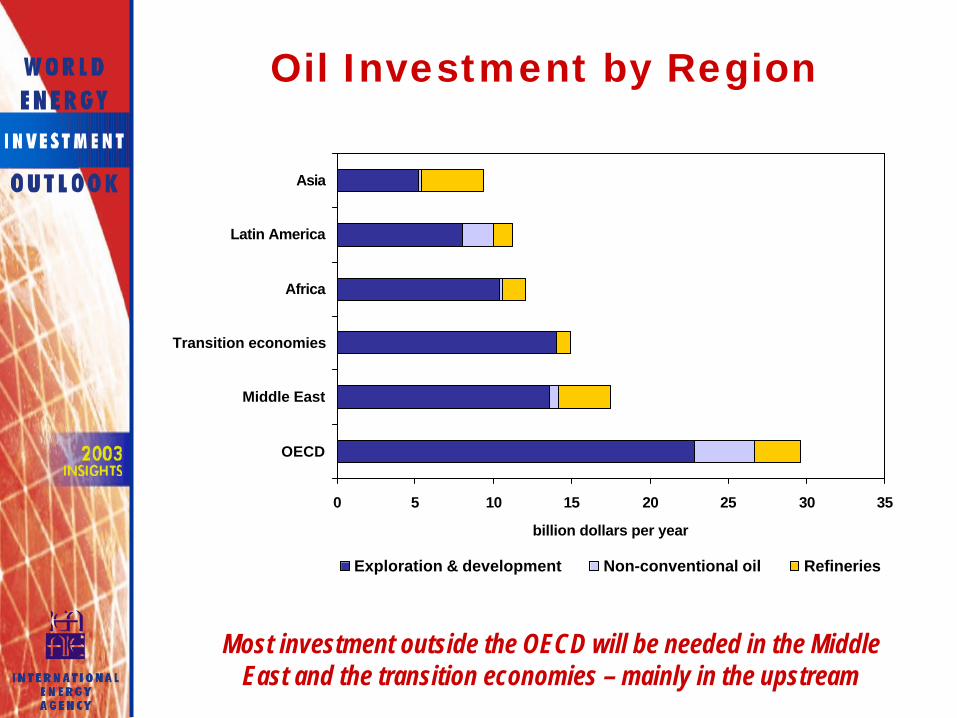
Oil Investment by Region
Most investment outside the OECD will be needed in the Middle East and the transition economies – mainly in the upstream
0 5 10 15 20 25 30 35
OECD
Middle East
Transition economies
Africa
Latin America
Asia
billion dollars per year
Exploration & development Non-conventional oil Refineries
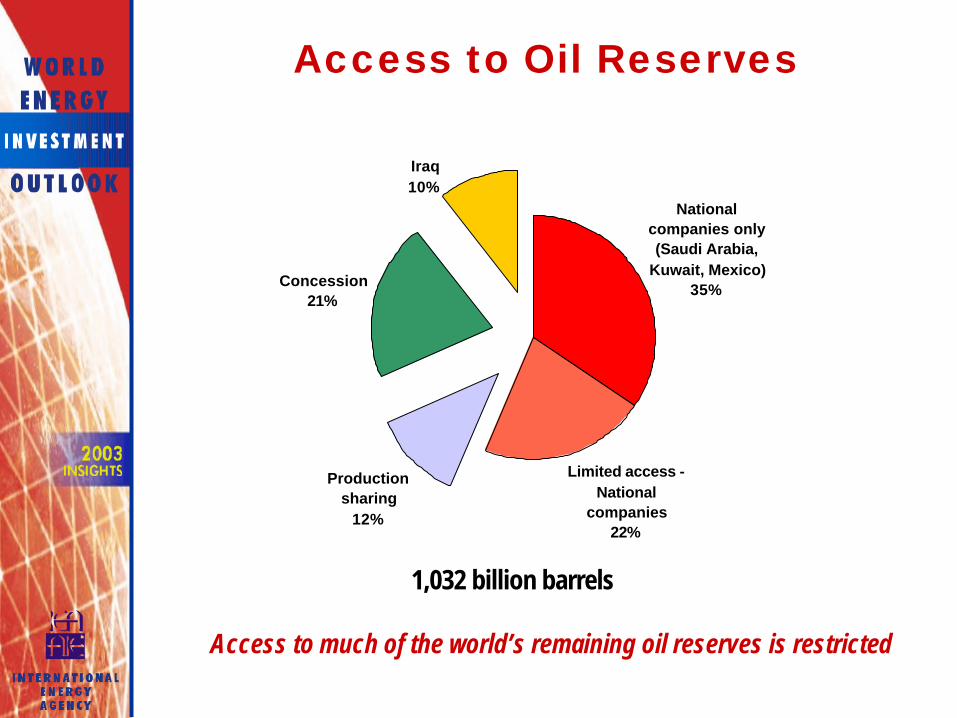
Access to Oil Reserves
National companies only (Saudi Arabia,
Kuwait, Mexico)35%
Limited access - National
companies 22%
Production sharing
12%
Concession21%
Iraq10%
1,032 billion barrels
Access to much of the world’s remaining oil reserves is restricted

Restricted Middle East Oil Investment Scenario
OPEC Middle East Share in Global Oil Supply
OPEC Middle East’s share of global oil production is assumed to remain flat at under 30% in Restricted Investment Scenario
0
10
20
30
40
50
1970 1980 1990 2000 2010 2020 2030
per
cent
Restricted Investment Scenario Reference Scenario
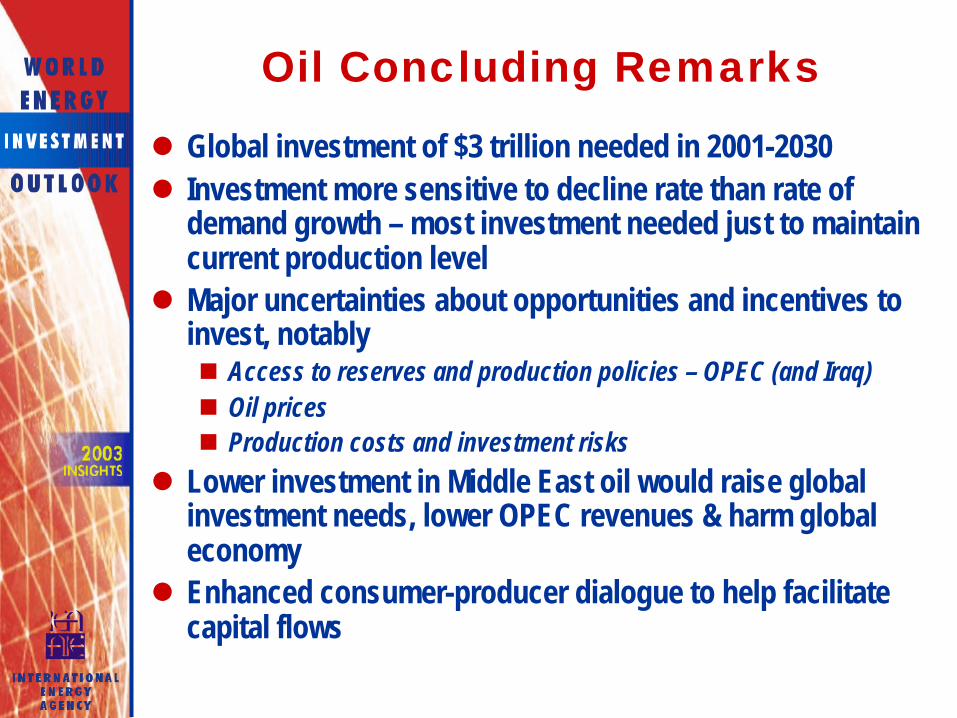
Oil Concluding Remarks
l Global investment of $3 trillion needed in 2001-2030l Investment more sensitive to decline rate than rate of
demand growth – most investment needed just to maintain current production level
l Major uncertainties about opportunities and incentives to invest, notablyn Access to reserves and production policies – OPEC (and Iraq)n Oil pricesn Production costs and investment risks
l Lower investment in Middle East oil would raise global investment needs, lower OPEC revenues & harm global economy
l Enhanced consumer-producer dialogue to help facilitate capital flows

Gas Investment Gas Investment OutlookOutlook
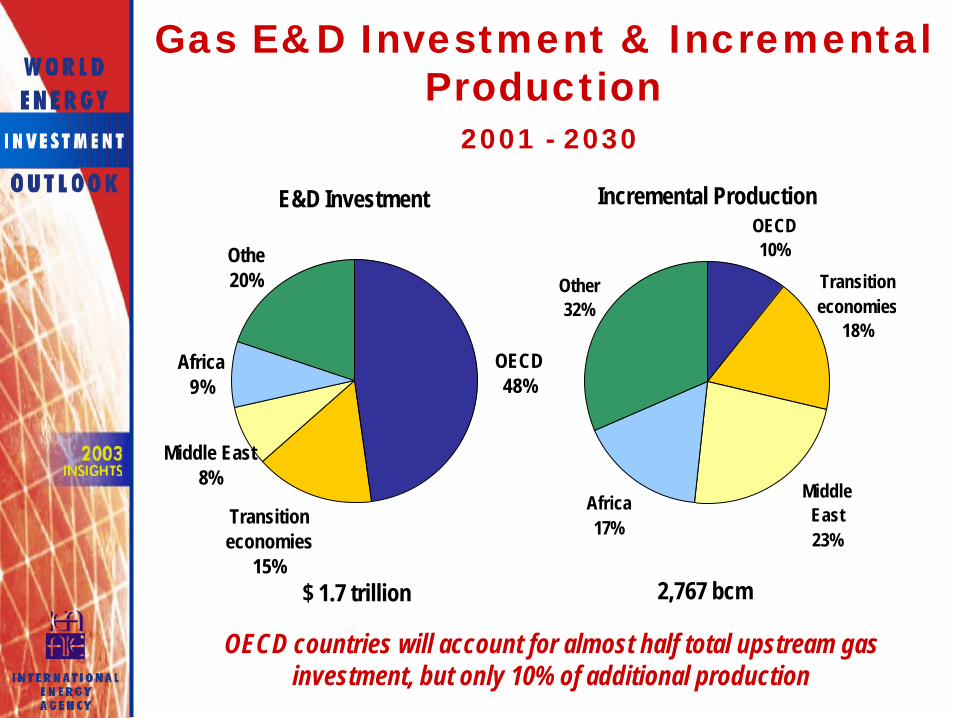
Gas E&D Investment & Incremental Production
2001 - 2030
Middle East 8%
OECD48%
Othe20%
Transition economies
15%
Africa9%
Africa17%
Middle East23%
Other32%
OECD10%
Transition economies
18%
E&D Investment Incremental Production
$ 1.7 trillion 2,767 bcm
OECD countries will account for almost half total upstream gas investment, but only 10% of additional production
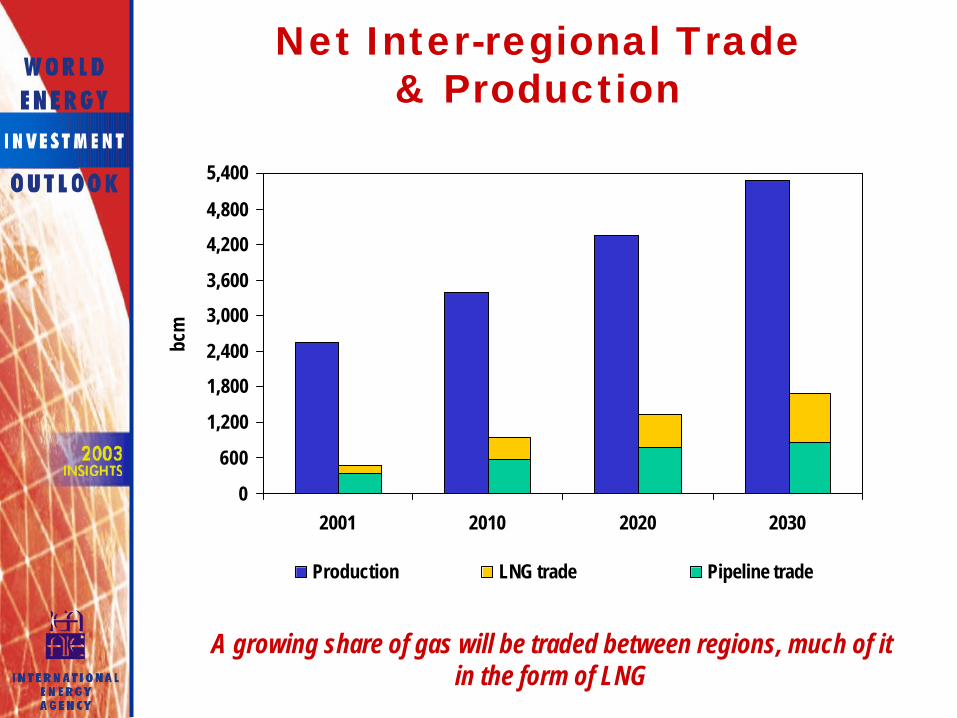
Net Inter-regional Trade & Production
0
600
1,200
1,800
2,400
3,000
3,600
4,200
4,800
5,400
2001 2010 2020 2030
bcm
Production LNG trade Pipeline trade
A growing share of gas will be traded between regions, much of it in the form of LNG
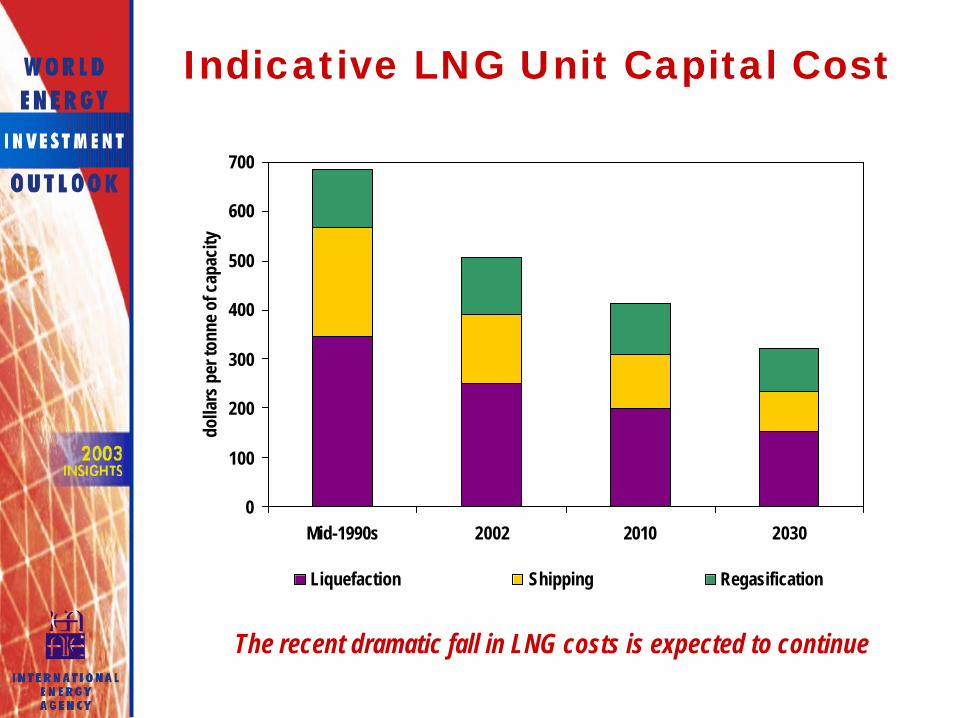
Indicative LNG Unit Capital Cost
0
100
200
300
400
500
600
700
Mid-1990s 2002 2010 2030
dolla
rs p
er to
nne
of c
apac
ity
Liquefaction Shipping Regasification
The recent dramatic fall in LNG costs is expected to continue
Gas Investment Uncertainties
l Balance of risk and return – price is key
l Complexity of financing very large-scale projects –especially in developing countries
l Access to reserves and fiscal regime – most new investment will be private
l Impact of market reforms on investment risk – long-term contracts will remain necessary
These factors could lead to shortfall in investment, supply bottlenecks and higher prices in some cases

Coal Investment Coal Investment OutlookOutlook
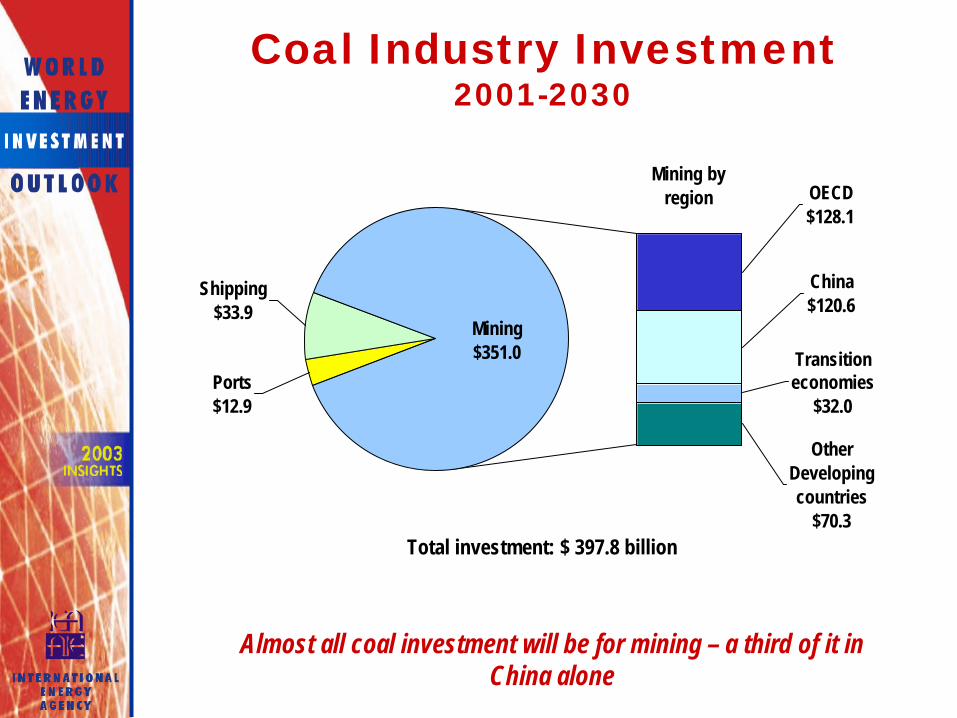
Coal Industry Investment 2001-2030
OtherDeveloping countries
$70.3
Transition economies
$32.0
China $120.6
OECD $128.1
Ports $12.9
Shipping $33.9
Mining $351.0
Mining by region
Total investment: $ 397.8 billion
Almost all coal investment will be for mining – a third of it in China alone
Electricity Investment Electricity Investment OutlookOutlook
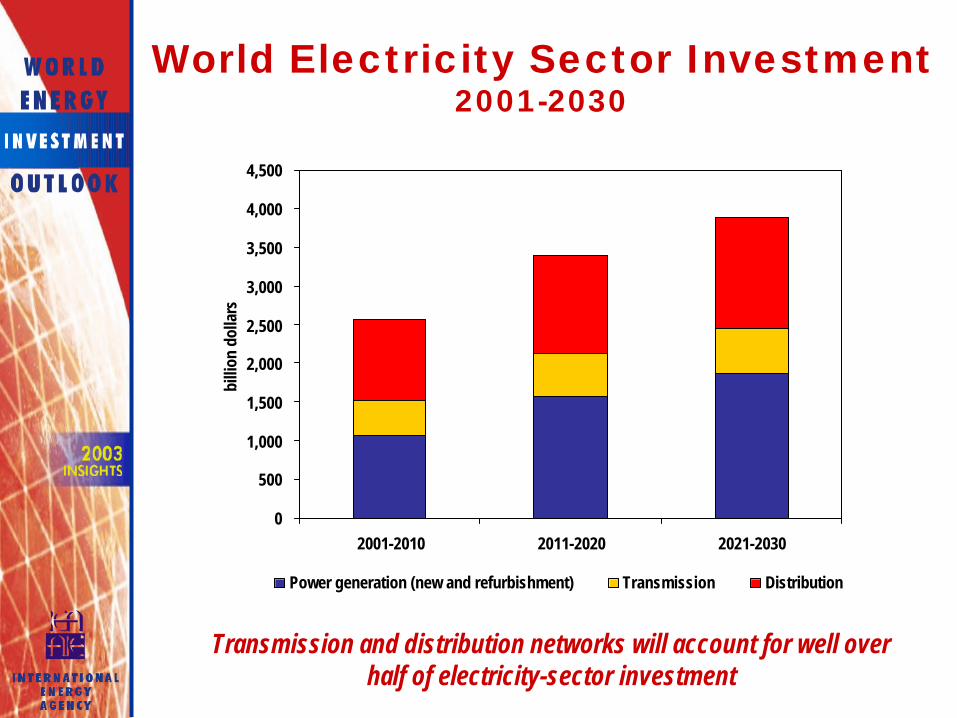
World Electricity Sector Investment2001-2030
0
500
1,000
1,500
2,000
2,500
3,000
3,500
4,000
4,500
2001-2010 2011-2020 2021-2030
billi
on d
olla
rs
Power generation (new and refurbishment) Transmission Distribution
Transmission and distribution networks will account for well over half of electricity-sector investment

Electricity Sector Investment by Region
2001-2030
China will need more electricity investment than any other country or region
0
500
1,000
1,500
2,000
2,500
China OtherAsia
LatinAmerica
Africa MiddleEast
US andCanada
EuropeanUnion
OECDPacific
OtherOECD
Russia Rest ofTE
billi
on d
olla
rs
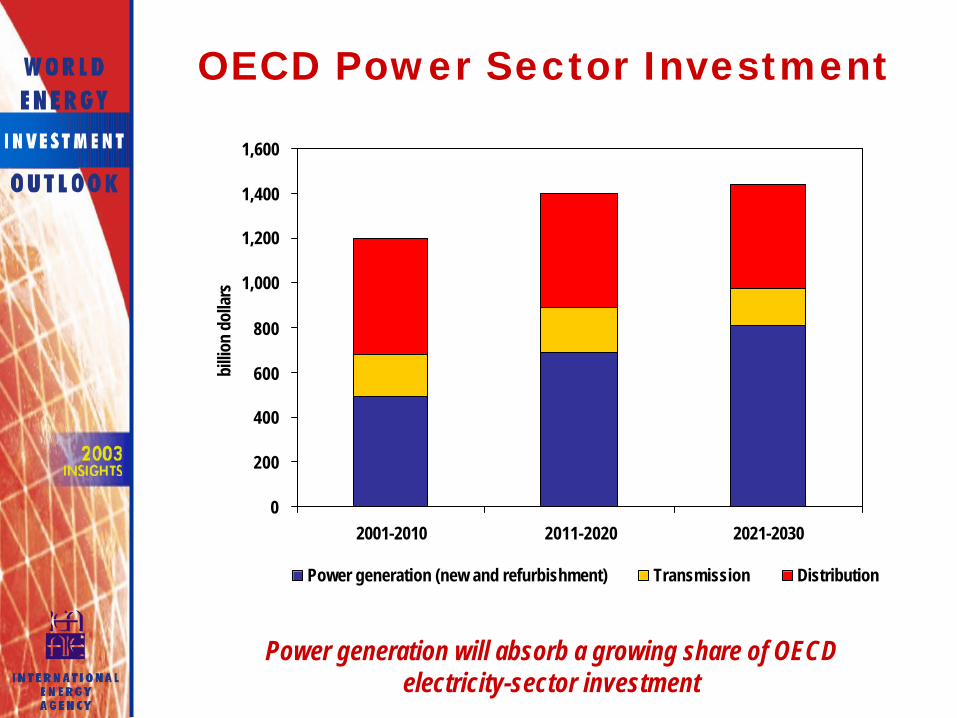
OECD Power Sector Investment
0
200
400
600
800
1,000
1,200
1,400
1,600
2001-2010 2011-2020 2021-2030
billi
on d
olla
rs
Power generation (new and refurbishment) Transmission Distribution
Power generation will absorb a growing share of OECD electricity-sector investment
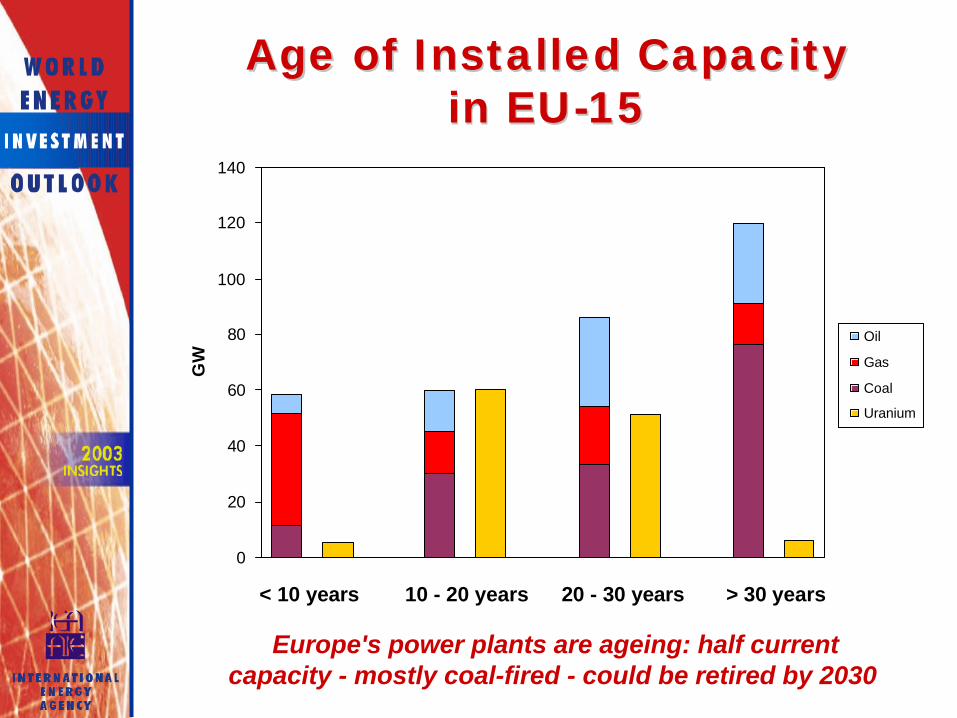
Age of Installed CapacityAge of Installed Capacityin EU-15in EU-15
0
20
40
60
80
100
120
140
GW
Oil
Gas
Coal
Uranium
< 10 years 10 - 20 years 20 - 30 years > 30 years
Europe's power plants are ageing: half currentcapacity - mostly coal-fired - could be retired by 2030
Electricity Investment Challenges in OECD
l $4 trillion needed (2001-2030)l Blackouts have underscored reliability needsn Under-investment in transmission in some countriesn Approvals remain a key barrier to investment
l Distributed generation will helpn Will save in transmission investmentn Already important in developing countries with unreliable
central systems
l Competition is changing investmentn Timing, technology choicen Heavier use of transmission – issue of peak load
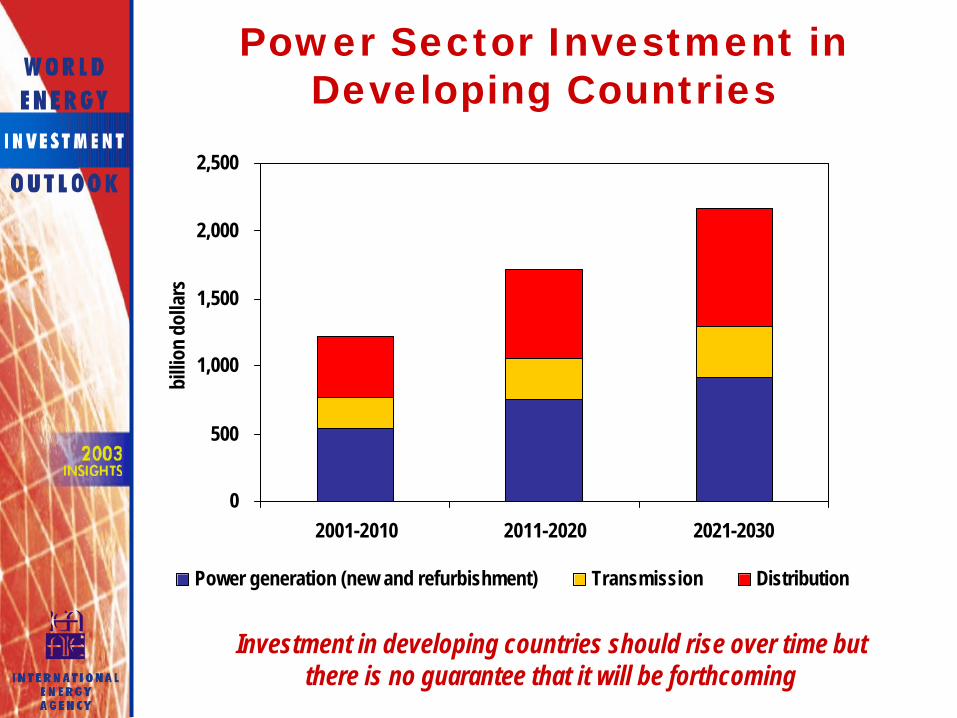
Power Sector Investment in Developing Countries
0
500
1,000
1,500
2,000
2,500
2001-2010 2011-2020 2021-2030
billi
on d
olla
rs
Power generation (new and refurbishment) Transmission Distribution
Investment in developing countries should rise over time but there is no guarantee that it will be forthcoming
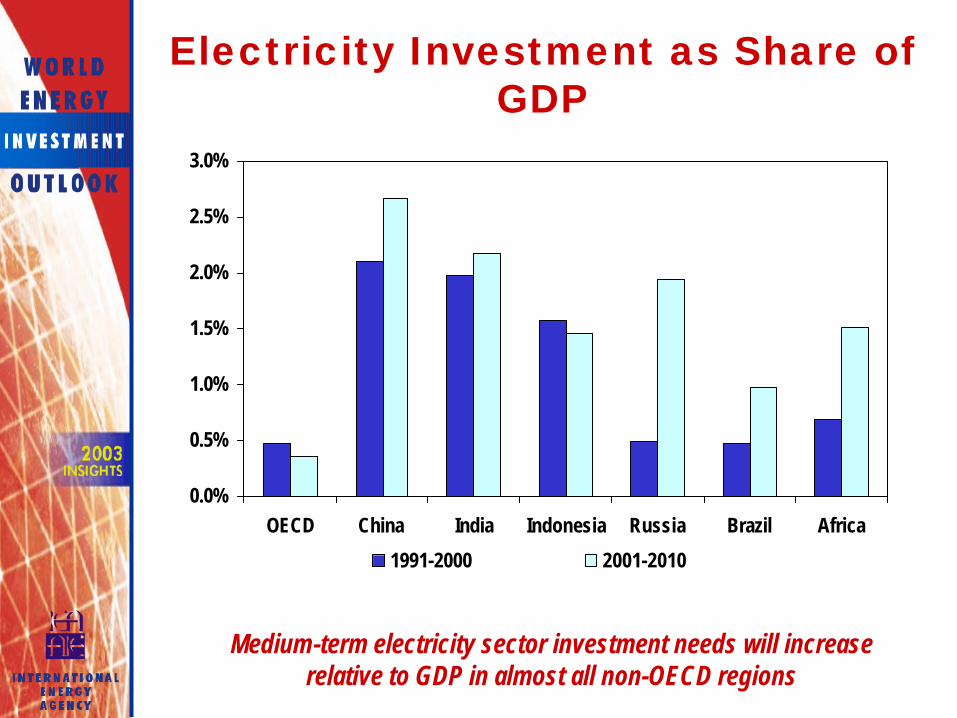
Electricity Investment as Share of GDP
0.0%
0.5%
1.0%
1.5%
2.0%
2.5%
3.0%
OECD China India Indonesia Russia Brazil Africa
1991-2000 2001-2010
Medium-term electricity sector investment needs will increase relative to GDP in almost all non-OECD regions
0
200
400
600
800
1,000
1,200
1971-1980 1981-1990 1991-2000 2001-2010 2011-2020 2021-2030
GW
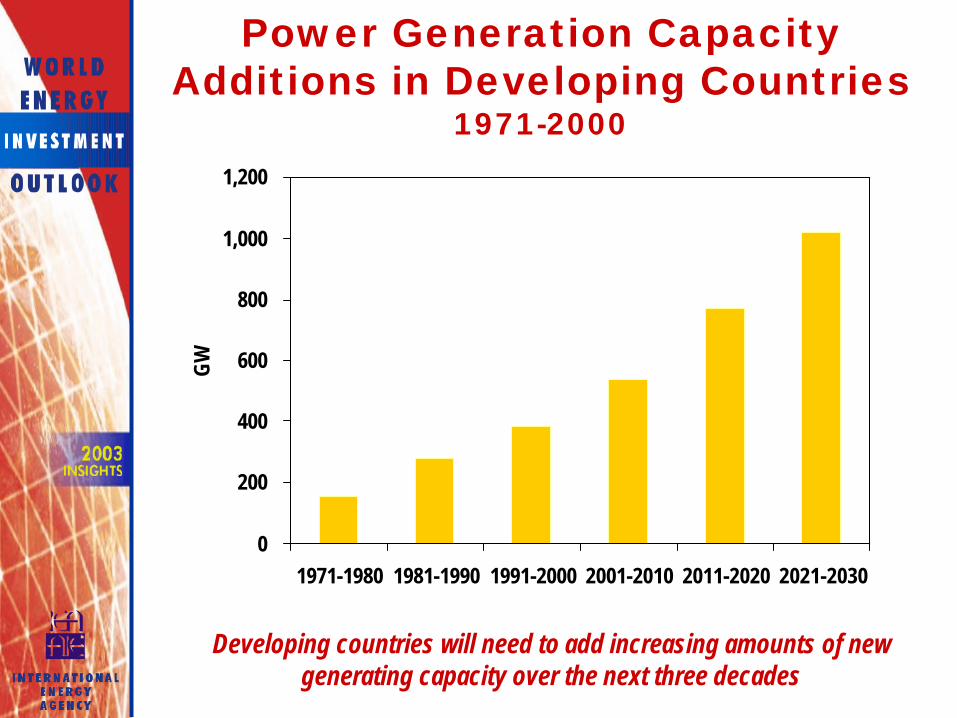
Power Generation Capacity Additions in Developing Countries
1971-2000
Developing countries will need to add increasing amounts of new generating capacity over the next three decades
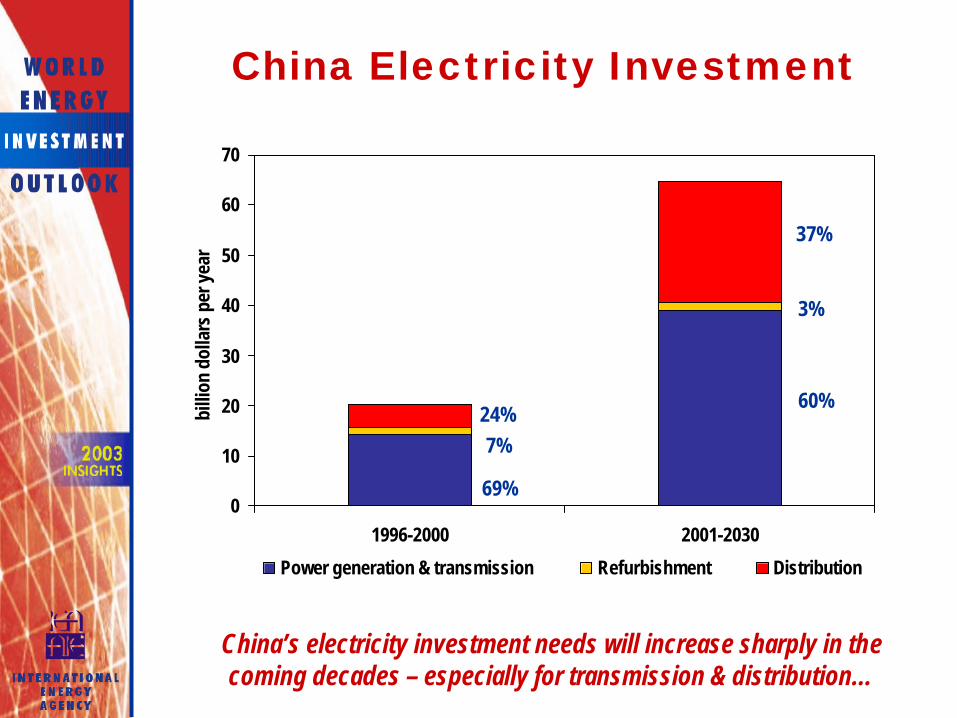
China Electricity Investment
0
10
20
30
40
50
60
70
1996-2000 2001-2030
billi
on d
olla
rs p
er y
ear
Power generation & transmission Refurbishment Distribution
24%7%
69%
37%
3%
60%
China’s electricity investment needs will increase sharply in the coming decades – especially for transmission & distribution…

Ratio of China Electricity Sector Investment to GDP
0
1
2
3
1985 1990 2000 2001-2010 2011-2020 2021-2030
shar
e of
ele
ctric
ity in
vest
men
ts in
GDP
(%)
… though investment needs will decline relative to GDP as its economy matures
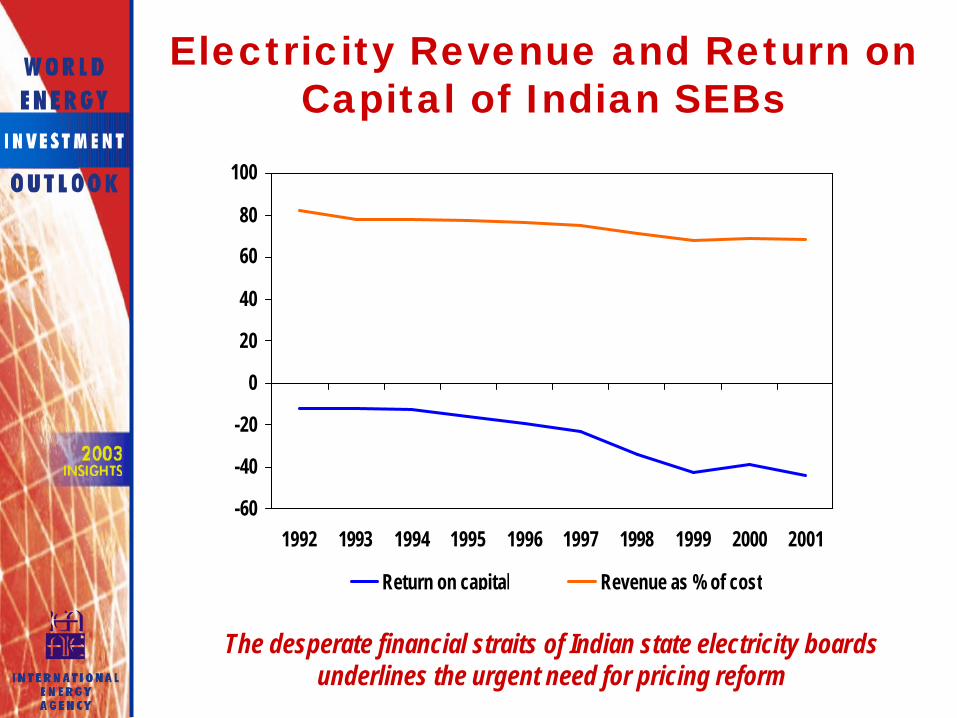
Electricity Revenue and Return on Capital of Indian SEBs
-60
-40
-20
0
20
40
60
80
100
1992 1993 1994 1995 1996 1997 1998 1999 2000 2001
Return on capital Revenue as % of cost
The desperate financial straits of Indian state electricity boards underlines the urgent need for pricing reform

Power Sector Private Investment in Developing Countries
0
5
10
15
20
25
30
35
40
45
50
1990 1991 1992 1993 1994 1995 1996 1997 1998 1999 2000 2001 2002
billi
on d
olla
rs
Developing countries will need to reverse the slump in private capital flows if projected investment is to be forthcoming
Universal Electricity Universal Electricity Access ScenarioAccess Scenario

Investment to Ensure Universal Electricity Access
2001-2030
0
500
1,000
1,500
2,000
China South Asia Africa East Asia LatinAmerica
MiddleEast
billi
on d
olla
rs
Reference Scenario Electrification Scenario
More than $660 billion is needed to supply basic electricity services to the world’s very poor – mainly in Africa and South Asia
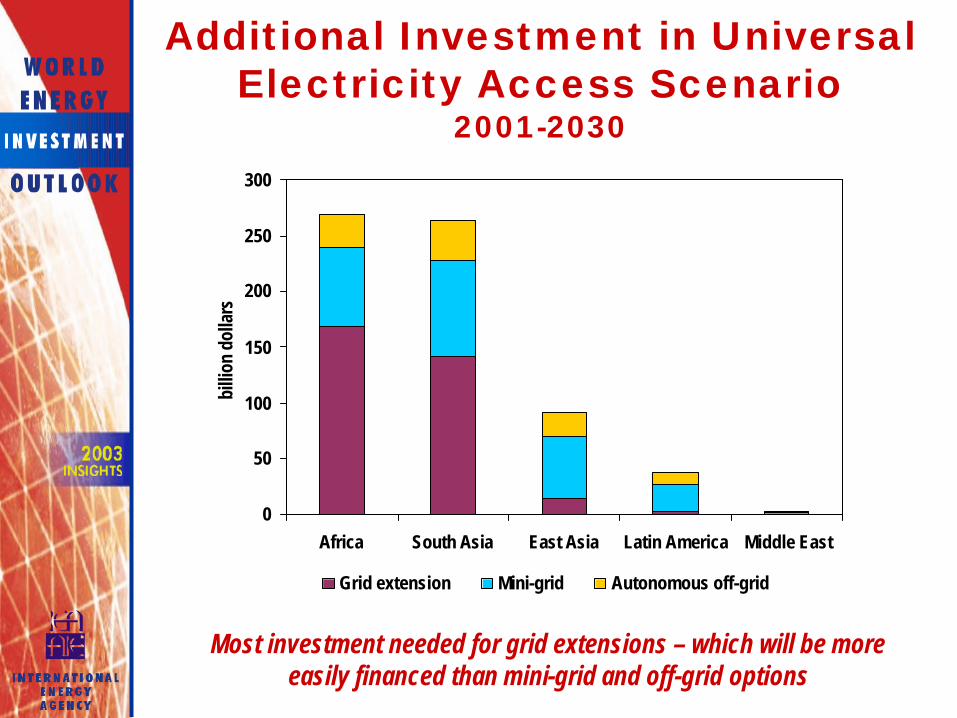
Additional Investment in Universal Electricity Access Scenario
2001-2030
0
50
100
150
200
250
300
Africa South Asia East Asia Latin America Middle East
billi
on d
olla
rs
Grid extension Mini-grid Autonomous off-grid
Most investment needed for grid extensions – which will be more easily financed than mini-grid and off-grid options

Electricity Investment Challenges in Developing Countries
l Almost $6 trillion needed (2001-2030) – far more than in past 3 decades
l Financing this will be challenging – especially in Africa and India
l Realising this investment will call forn More rigorous sector reforms – notably more cost-reflective
pricing and improved collectionn More stable and predictable investment regimesn Better corporate governancen Development of domestic financial markets n Stronger incentives for private and foreign investors
Electricity Concluding Remarks
l Electricity sector will dominate energy investment
l Almost $10 billion needed in 3 decades to 2030
l More than half electricity investment will go to transmission & distribution networks
l Biggest uncertainty in OECD countries concerns impact of market reforms on investment risks and returns –especially for reserve and peak capacity
l Financing electricity investment in non-OECD countries is greatest challenge – pricing reform is fundamental to attracting private capital
Energy Investment Challenge
l Total investment requirements are modest relative to world GDP, but challenge differs by region / fuel
l Energy and financial resources are sufficient, but increasing competition for capital and higher risk
l Capital needs are largest for electricityl Half total energy investment is needed in developing
countries – where financing will be hardestl Policymakers need to ensure basic principles of good
governance are applied and respected – including cost-reflective pricing
l Production accounts for the bulk of investment – more than half just to replace old capacity