WORLD CRUDE OIL AND NATURAL GAS MARKETS: STARING INTO...
46
WORLD CRUDE OIL AND NATURAL GAS MARKETS: STARING INTO THE ABYSS (HIGHWAY TO HELL)? Martin King, Vice President, Institutional Research FirstEnergy Capital Corp. January 19, 2016 Data and closing prices as of January 15, 2016 1
Transcript of WORLD CRUDE OIL AND NATURAL GAS MARKETS: STARING INTO...
WORLD CRUDE OIL ANDNATURAL GAS MARKETS:
STARING INTO THE ABYSS(HIGHWAY TO HELL)?
Martin King, Vice President, Institutional ResearchFirstEnergy Capital Corp.
January 19, 2016
Data and closing prices as of January 15, 2016
1
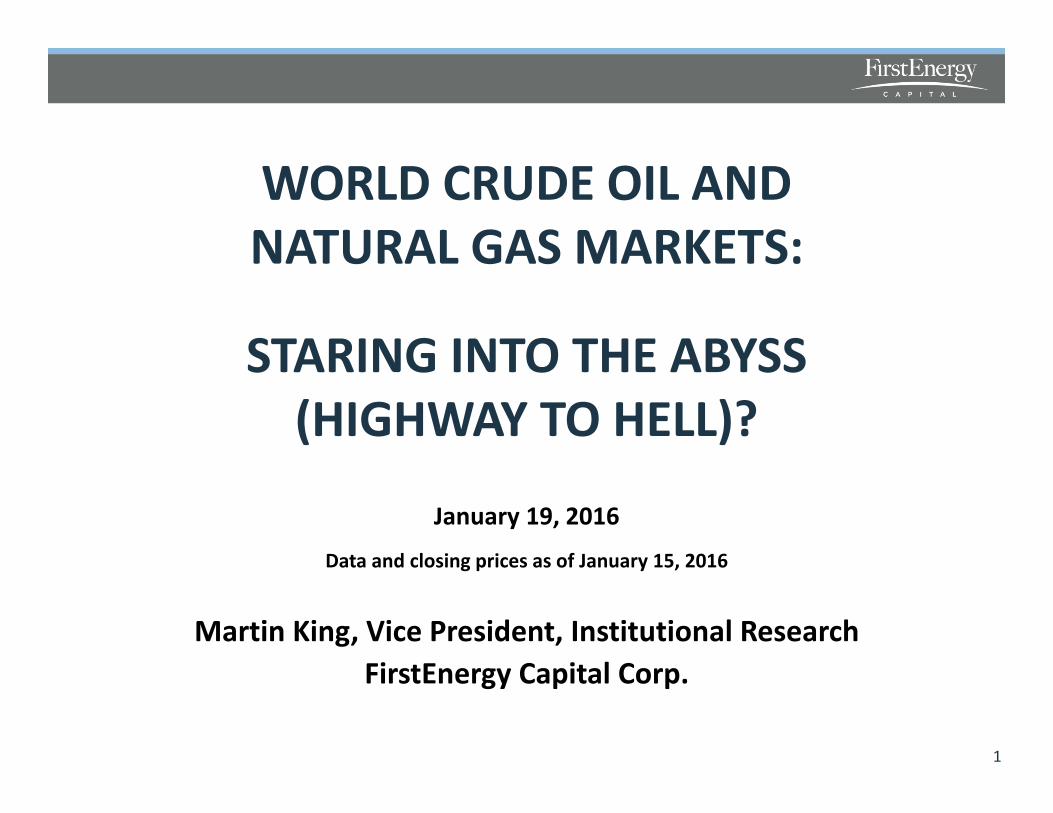
CANADIAN OIL/GAS & SERVICES EQUITIES PERFORMANCE• Gas weighted down 10% YTD; down
64% from 2014 peak.• Oil weighted down 13% YTD; down
52% from 2014 peak.• Services down 18% YTD; down 74%
from 2014 peak.• WTI down 21% YTD; down 73% from
2014 peak; Natural gas down 10% YTD; down 66% from 2014 peak.
FCC Can. Gas Weighted Equity Index
405060708090
100110120130
Jan-14 Jul-14 Jan-15 Jul-15 Jan-16Source: FirstEnergy Capital Corp., Bloomberg
1/1/ 2014 = 100
FCC Can. Oil Weighted Equity Index
5060708090
100110120130
Jan-14 Jul-14 Jan-15 Jul-15 Jan-16Source: FirstEnergy Capital Corp., Bloomberg
1/1/ 2014 = 100
2
FCC Can. Services Weighted Equity Index
30
50
70
90
110
130
Jan-14 Jul-14 Jan-15 Jul-15 Jan-16Source: FirstEnergy Capital Corp., Bloomberg
1/1/ 2014 = 100
CRUDE OIL MARKETS
ARE WE THERE YET?
3
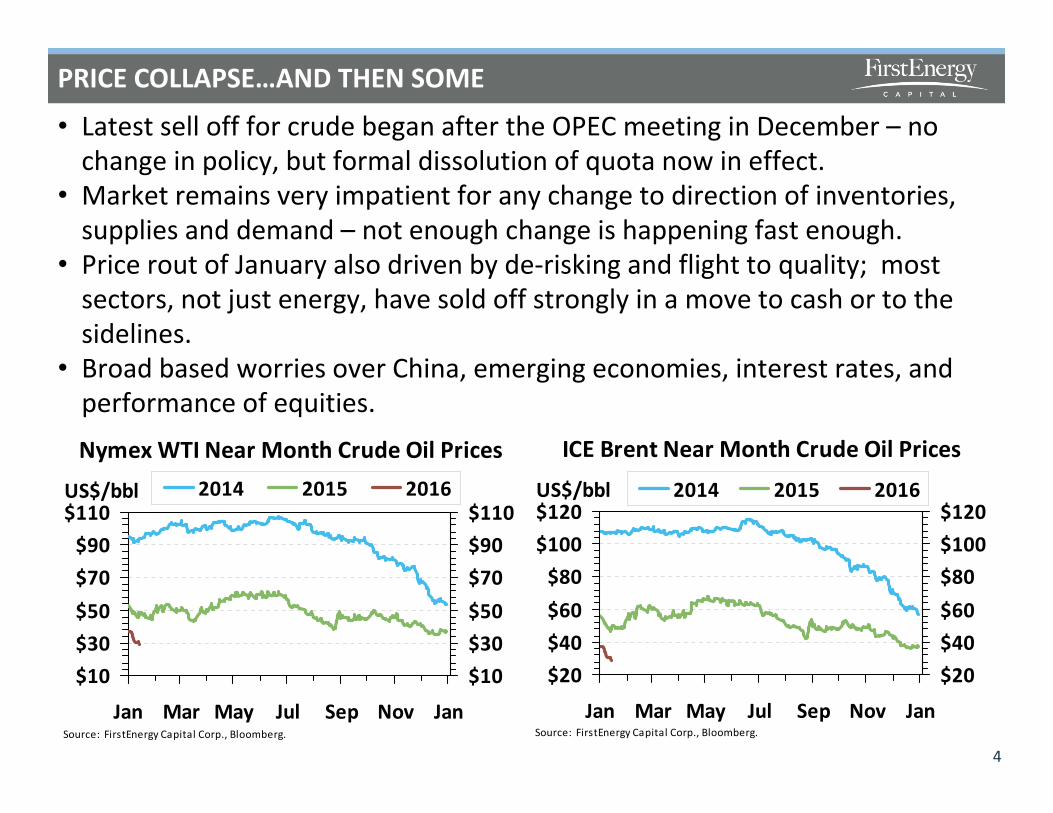
PRICE COLLAPSE…AND THEN SOME
• Latest sell off for crude began after the OPEC meeting in December – no change in policy, but formal dissolution of quota now in effect.
• Market remains very impatient for any change to direction of inventories, supplies and demand – not enough change is happening fast enough.
• Price rout of January also driven by de-risking and flight to quality; most sectors, not just energy, have sold off strongly in a move to cash or to the sidelines.
• Broad based worries over China, emerging economies, interest rates, and performance of equities.
4
Nymex WTI Near Month Crude Oil Prices
$10$30$50$70$90
$110
Jan Mar May Jul Sep Nov JanSource: FirstEnergy Capital Corp., Bloomberg.
US$/bbl
$10$30$50$70$90$110
2014 2015 2016
ICE Brent Near Month Crude Oil Prices
$20$40$60$80
$100$120
Jan Mar May Jul Sep Nov JanSource: FirstEnergy Capital Corp., Bloomberg.
US$/bbl
$20$40$60$80$100$120
2014 2015 2016

WTI PRICE HISTORY
5
$0
$15
$30
$45
$60
$75
$90
$105
$120
$135
$150
1983 1986 1989 1992 1995 1998 2001 2004 2007 2010 2013 2016Source: FirstEnergy Capital Corp., Bloomberg.
US$/bbl
US$29.42 on Jan. 15, 2016.Lowest price sinceNovember 4, 2003.
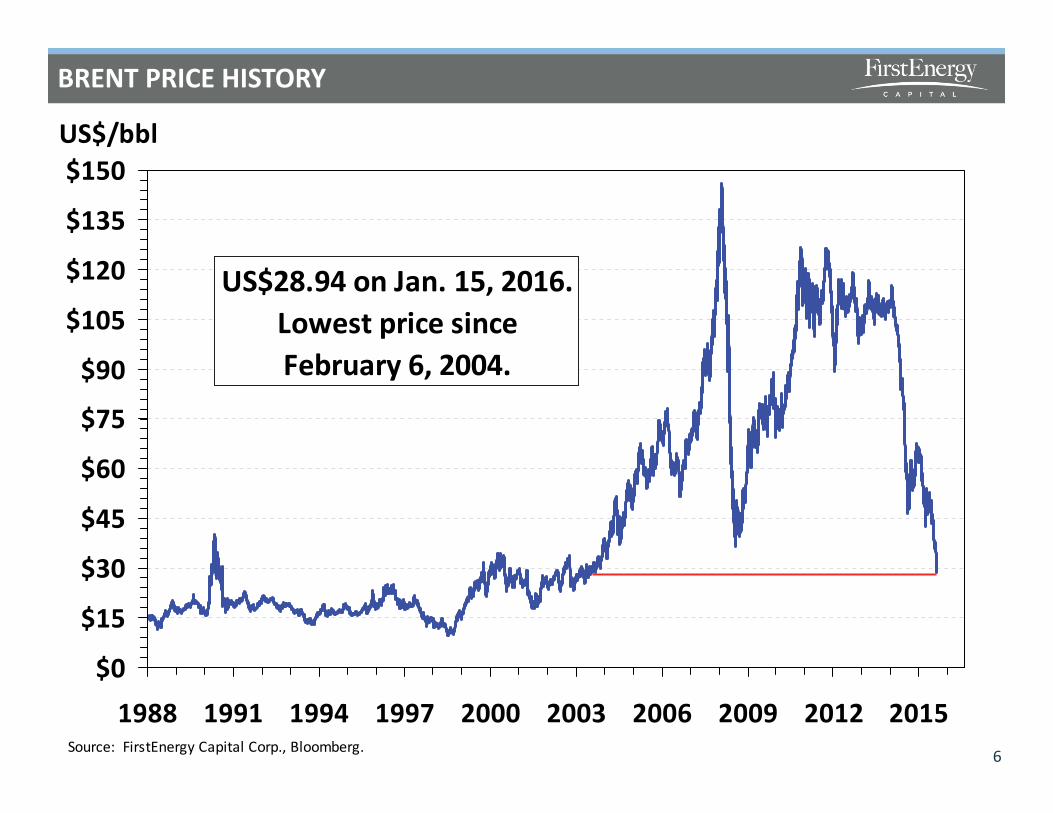
BRENT PRICE HISTORY
6
$0
$15
$30
$45
$60
$75
$90
$105
$120
$135
$150
1988 1991 1994 1997 2000 2003 2006 2009 2012 2015Source: FirstEnergy Capital Corp., Bloomberg.
US$/bbl
US$28.94 on Jan. 15, 2016.Lowest price sinceFebruary 6, 2004.

CURRENT PRICES IN HISTORICAL CONTEXT
• Latest prices at US$30 per barrel are the lowest in inflation adjusted terms since 1999 – is oil too cheap at these levels?
• Oil burden (oil spending as share of global GDP) is the lowest since early 2000s; now well below 5% critical level that typically characterizes major oil demand slowdowns or demand pauses.
• Latest prices would suggest that a full demand reset is being staged and should further boost or revive demand is some regions; will help to offset effects of any economic slowdown.
7
Inflation Adjusted Brent Price
$0$20$40$60$80
$100$120
1970 1979 1988 1997 2006 2015Source: FirstEnergy Capital Corp., Bloomberg, Pennwell, U.S. Federal Reserve.
US$/bbl
$0$20$40$60$80$100$120
Nominal Real ($2015)
Oil Burden Versus Oil Demand
0%1%2%3%4%5%6%7%8%9%
1970 1980 1990 2000 2010Source: FirstEnergy Capital Corp., IMF.
(2.0)(1.0)0.01.02.03.04.05.0
mm bbls/dOil DemandOil Burden
WHAT THE F&#K??!!
8
• Latest price rout to below US$30 has gone beyond, far beyond, what the fundamentals appear to justify.
• Current market is about de-risking and raising cash – a “sell everything” attitude.
• If we took the most recent prices as being representative of fundamentals, this would suggest that demand growth has fallen to zero and supply is accelerating.
• Neither of these is true, but the market does have intense fundamental concerns, most of which are not price supportive; remains a market in desperate search for any price positive news and is not getting it at the moment.
• Latest price moves would seem to suggest that supply shut-ins are needed and that future capex should be trimmed to the bone and beyond.
FOUR PROBLEMS REMAIN UNSOLVED – SO FAR
9
• Putting aside the recent sell everything attitude, the crude oil market is still facing four major issues which remain to be resolved and have been waiting for a resolution for nearly a year.
• Without progress on these four, price improvement cannot be sustained.
• U.S. crude oil inventories (still at record highs and threatening to go higher).
• U.S. crude oil supplies (drifting lower, but slowly).• China macro – how bad is it or not?• Iran – getting back into the markets right now.
• U.S. data is highly visible and of good quality, reminding the market almost daily of the immense challenges to be overcome.
U.S. CRUDE OIL INVENTORIES – PLEASE GO DOWN!
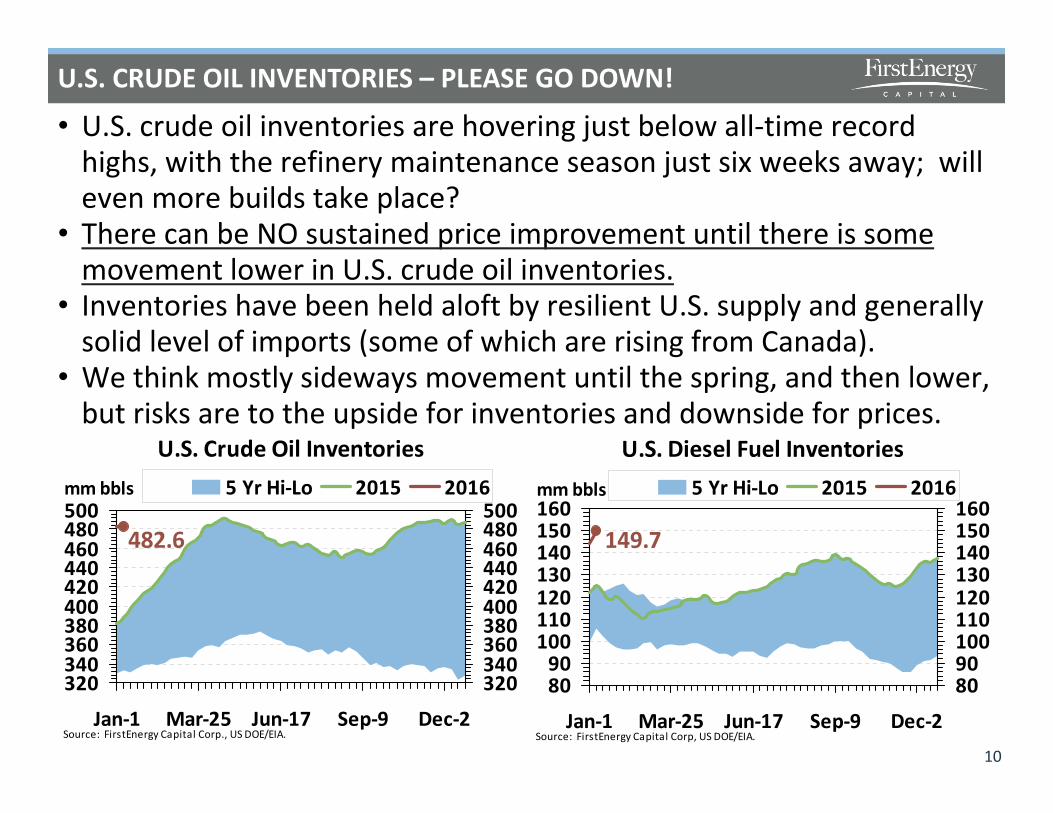
• U.S. crude oil inventories are hovering just below all-time record highs, with the refinery maintenance season just six weeks away; will even more builds take place?
• There can be NO sustained price improvement until there is some movement lower in U.S. crude oil inventories.
• Inventories have been held aloft by resilient U.S. supply and generally solid level of imports (some of which are rising from Canada).
• We think mostly sideways movement until the spring, and then lower, but risks are to the upside for inventories and downside for prices.
10
U.S. Crude Oil Inventories
482.6
320340360380400420440460480500
Jan-1 Mar-25 Jun-17 Sep-9 Dec-2Source: FirstEnergy Capital Corp., US DOE/EIA.
mm bbls
320340360380400420440460480500
5 Yr Hi-Lo 2015 2016
U.S. Diesel Fuel Inventories
149.7
8090
100110120130140150160
Jan-1 Mar-25 Jun-17 Sep-9 Dec-2Source: FirstEnergy Capital Corp, US DOE/EIA.
mm bbls
8090100110120130140150160
5 Yr Hi-Lo 2015 2016
U.S. CRUDE OIL SUPPLIES – SLOW TO RETREAT
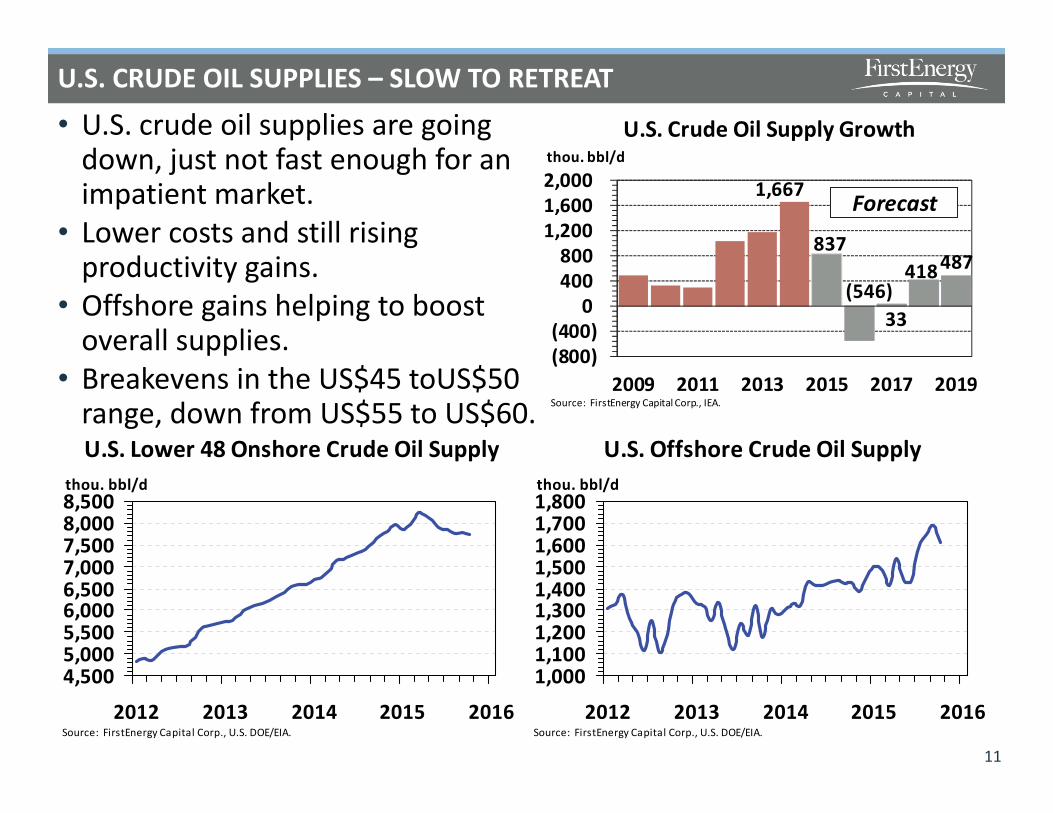
• U.S. crude oil supplies are going down, just not fast enough for an impatient market.
• Lower costs and still rising productivity gains.
• Offshore gains helping to boost overall supplies.
• Breakevens in the US$45 toUS$50 range, down from US$55 to US$60.
11
U.S. Lower 48 Onshore Crude Oil Supply
4,5005,0005,5006,0006,5007,0007,5008,0008,500
2012 2013 2014 2015 2016Source: FirstEnergy Capital Corp., U.S. DOE/EIA.
thou. bbl/d
U.S. Offshore Crude Oil Supply
1,0001,1001,2001,3001,4001,5001,6001,7001,800
2012 2013 2014 2015 2016Source: FirstEnergy Capital Corp., U.S. DOE/EIA.
thou. bbl/d
U.S. Crude Oil Supply Growth
1,667
837
(546)33
418 487
(800)(400)
0400800
1,2001,6002,000
2009 2011 2013 2015 2017 2019
thou. bbl/d
Source: FirstEnergy Capital Corp., IEA.
Forecast
CHINA MACRO – IS IT REALLY THAT BAD?
12
Chinese Oil Demand Growth
357567
322195200168
0200400600800
1,0001,200
2009 2011 2013 2015 2017 2019
thou. bbl/d
Source: FirstEnergy Capital Corp., IEA.
Forecast
China Monthly Oil Demand
8,0008,5009,0009,500
10,00010,50011,00011,50012,000
Jan Mar May Jul Sep NovSource: FirstEnergy Capital Corp., U.S. DOE/EIA.
thou. bbl/d
8,0008,5009,0009,50010,00010,50011,00011,50012,000
5 Yr. Hi-Lo 2014 2015
China Manufacturing Index
46485052545658
2010 2011 2012 2013 2014 2015 2016Source: FirstEnergy Capital Corp., Bloomberg.
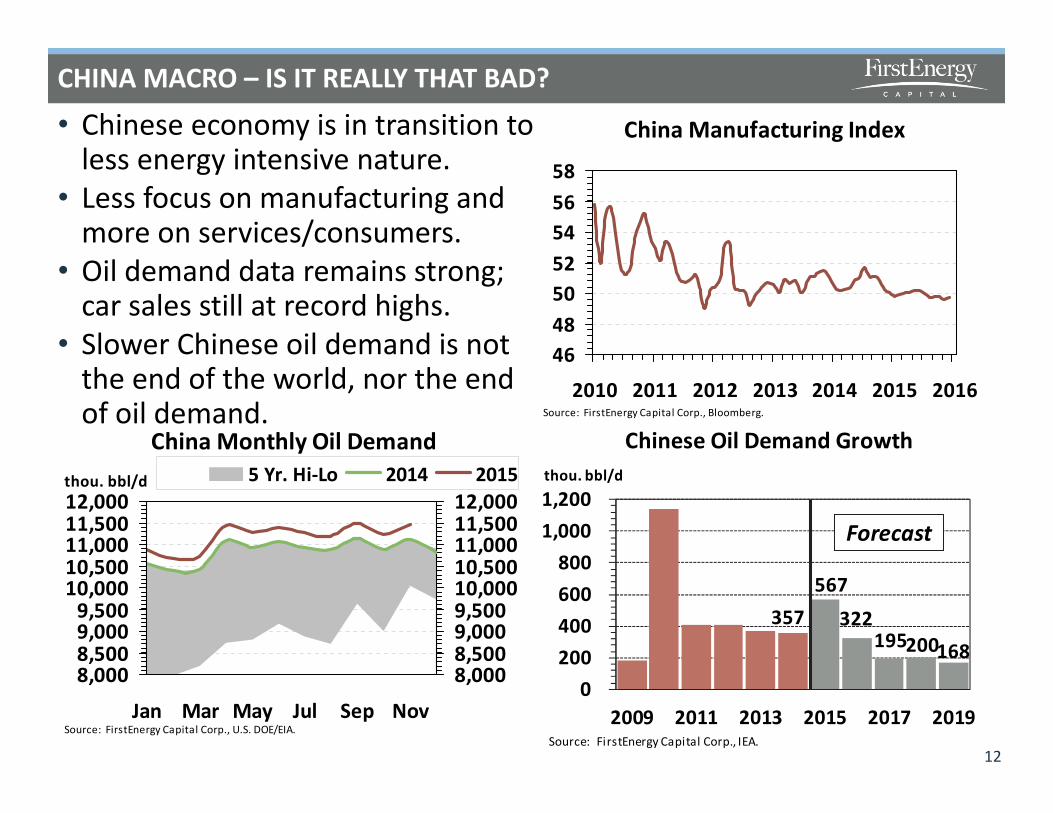
• Chinese economy is in transition to less energy intensive nature.
• Less focus on manufacturing and more on services/consumers.
• Oil demand data remains strong; car sales still at record highs.
• Slower Chinese oil demand is not the end of the world, nor the end of oil demand.
CHINA STRATEGIC PETROLEUM INVENTORY PICTURE
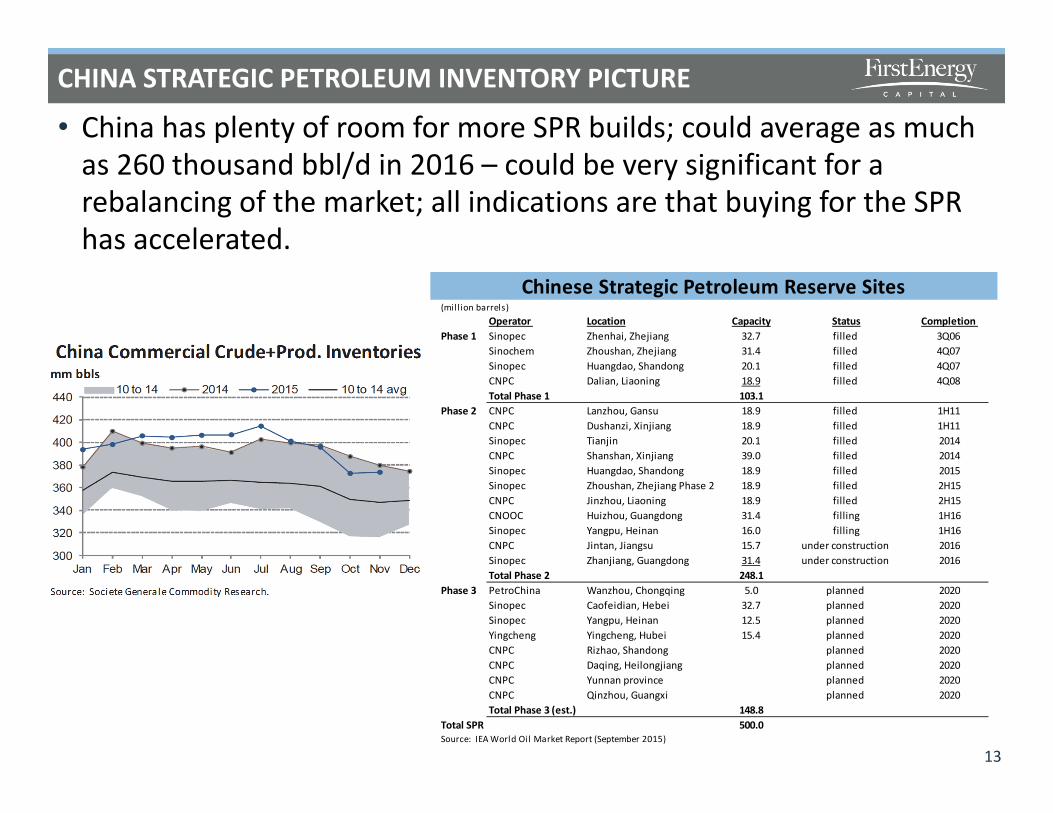
• China has plenty of room for more SPR builds; could average as much as 260 thousand bbl/d in 2016 – could be very significant for a rebalancing of the market; all indications are that buying for the SPRhas accelerated.
13
Chinese Strategic Petroleum Reserve Sites
(mil lion barrels) Operator Location Capacity Status Completion
Phase 1 Sinopec Zhenhai, Zhejiang 32.7 filled 3Q06 Sinochem Zhoushan, Zhejiang 31.4 filled 4Q07 Sinopec Huangdao, Shandong 20.1 filled 4Q07 CNPC Dalian, Liaoning 18.9 filled 4Q08 Total Phase 1 103.1
Phase 2 CNPC Lanzhou, Gansu 18.9 filled 1H11 CNPC Dushanzi, Xinjiang 18.9 filled 1H11 Sinopec Tianjin 20.1 filled 2014 CNPC Shanshan, Xinjiang 39.0 filled 2014 Sinopec Huangdao, Shandong 18.9 filled 2015 Sinopec Zhoushan, Zhejiang Phase 2 18.9 filled 2H15 CNPC Jinzhou, Liaoning 18.9 filled 2H15 CNOOC Huizhou, Guangdong 31.4 filling 1H16 Sinopec Yangpu, Heinan 16.0 filling 1H16 CNPC Jintan, Jiangsu 15.7 under construction 2016 Sinopec Zhanjiang, Guangdong 31.4 under construction 2016 Total Phase 2 248.1
Phase 3 PetroChina Wanzhou, Chongqing 5.0 planned 2020 Sinopec Caofeidian, Hebei 32.7 planned 2020 Sinopec Yangpu, Heinan 12.5 planned 2020 Yingcheng Yingcheng, Hubei 15.4 planned 2020 CNPC Rizhao, Shandong planned 2020CNPC Daqing, Heilongjiang planned 2020 CNPC Yunnan province planned 2020 CNPC Qinzhou, Guangxi planned 2020 Total Phase 3 (est.) 148.8
Total SPR 500.0 Source: IEA World Oil Market Report (September 2015)
IRAN – BACK IN BUSINESS
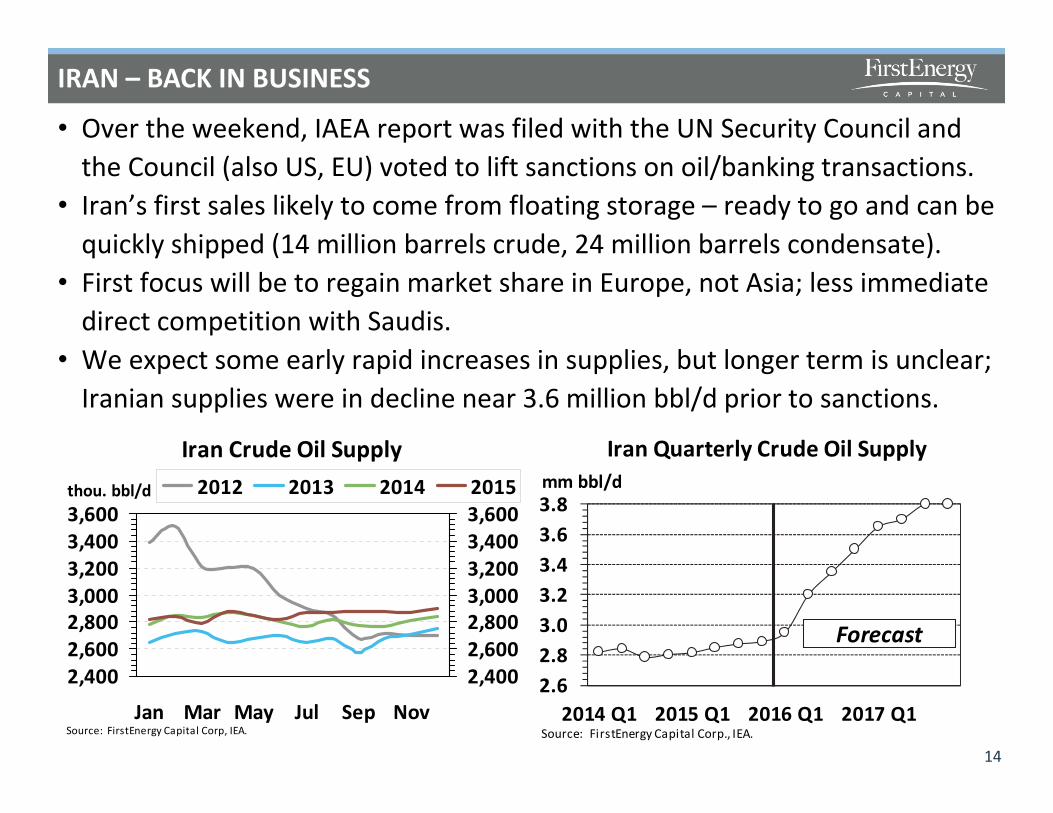
• Over the weekend, IAEA report was filed with the UN Security Council and the Council (also US, EU) voted to lift sanctions on oil/banking transactions.
• Iran’s first sales likely to come from floating storage – ready to go and can be quickly shipped (14 million barrels crude, 24 million barrels condensate).
• First focus will be to regain market share in Europe, not Asia; less immediate direct competition with Saudis.
• We expect some early rapid increases in supplies, but longer term is unclear; Iranian supplies were in decline near 3.6 million bbl/d prior to sanctions.
14
Iran Crude Oil Supply
2,4002,6002,8003,0003,2003,4003,600
Jan Mar May Jul Sep NovSource: FirstEnergy Capital Corp, IEA.
thou. bbl/d
2,4002,6002,8003,0003,2003,4003,600
2012 2013 2014 2015
Iran Quarterly Crude Oil Supply
2.62.83.03.23.43.63.8
2014 Q1 2015 Q1 2016 Q1 2017 Q1
mm bbl/d
Source: FirstEnergy Capital Corp., IEA.
Forecast

SO WHERE DOES THIS LEAVE US?
15
World Oil Demand Growth
0.8 1.9
1.5 1.0
(2.0)(1.0)0.01.02.03.04.0
2009 2011 2013 2015 2017 2019
mm bbl/d
Source: FirstEnergy Capital Corp., IEA.
Forecast
Global Demand Growth Estimates 2016
1.8
0.71.21.2
0.9
3.2
1.4 1.4 1.21.5
0.00.40.81.21.62.02.42.83.23.6
2010 2011 2012 2013 2014 2015 Aug Sep Nov ?Source: FirstEnergy Capital Corp., IEA.
mm bbl/d
IEA 2016Estimates
• Oil is now very cheap, even in the context of the current macro slowdown – oil demand should remain reasonably strong.
• Oil supplies will be affected to an even greater degree with Non-OPEC supply declines to accelerate, led by the United States.
• Price collapse is happening at a time when budgets for 2016 were being finalized, will force further retrenchment in spending.
• The oil market is still trending to balance, but price rout will accelerate the process – the market remains very impatient for change.
SUPPLIES WILL TAKE AN EVEN BIGGER HIT
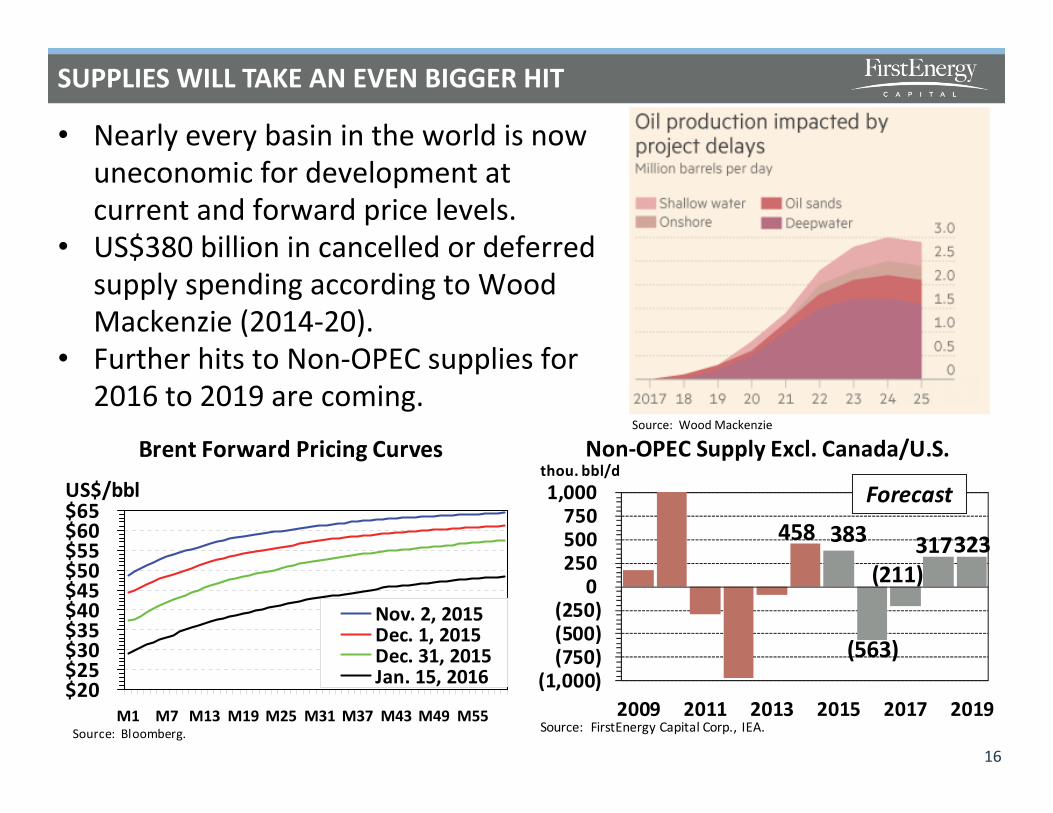
• Nearly every basin in the world is now uneconomic for development at current and forward price levels.
• US$380 billion in cancelled or deferred supply spending according to Wood Mackenzie (2014-20).
• Further hits to Non-OPEC supplies for 2016 to 2019 are coming.
16
Non-OPEC Supply Excl. Canada/U.S.
458 383
(563)
(211)317 323
(1,000)(750)(500)(250)
0250500750
1,000
2009 2011 2013 2015 2017 2019
thou. bbl/d
Source: FirstEnergy Capital Corp., IEA.
Forecast
Brent Forward Pricing Curves
$20$25$30$35$40$45$50$55$60$65
M1 M7 M13 M19 M25 M31 M37 M43 M49 M55Source: Bloomberg.
US$/bbl
Nov. 2, 2015Dec. 1, 2015Dec. 31, 2015Jan. 15, 2016
Source: Wood Mackenzie
OPEC (SAUDI ARABIA) PATIENTLY WAITS
17
Saudi Arabia Crude Oil Supply
9,000
9,400
9,800
10,200
10,600
Jan Mar May Jul Sep NovSource: FirstEnergy Capital Corp, IEA.
thou. bbl/d
9,000
9,400
9,800
10,200
10,6002012 2013 2014 2015
OPEC Notional and Effective Spare Capacity
01,0002,0003,0004,0005,0006,000
Jan-12 Jan-13 Jan-14 Jan-15 Jan-16Source: FirstEnergy Capital Corp., IEA.
thou. bbl/d
01,0002,0003,0004,0005,0006,000
Other OPECSaudi ArabiaEffective
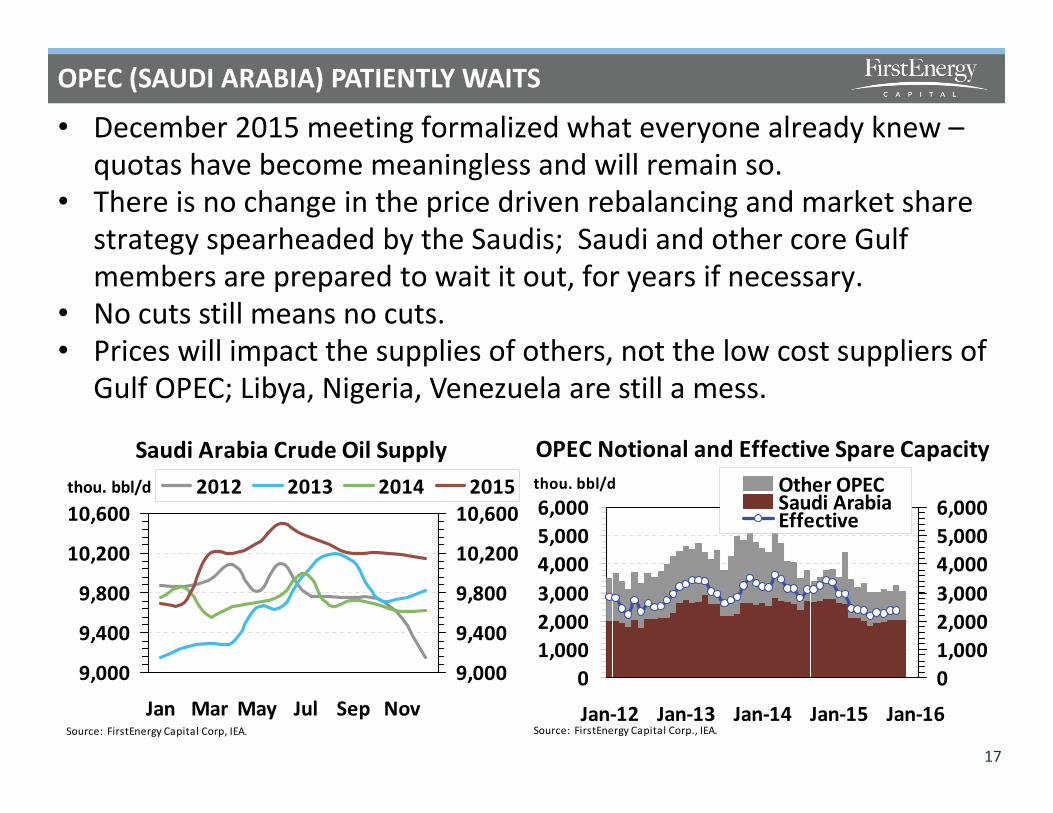
• December 2015 meeting formalized what everyone already knew –quotas have become meaningless and will remain so.
• There is no change in the price driven rebalancing and market share strategy spearheaded by the Saudis; Saudi and other core Gulf members are prepared to wait it out, for years if necessary.
• No cuts still means no cuts.• Prices will impact the supplies of others, not the low cost suppliers of
Gulf OPEC; Libya, Nigeria, Venezuela are still a mess.
MEANWHILE, BACK IN CANADA….
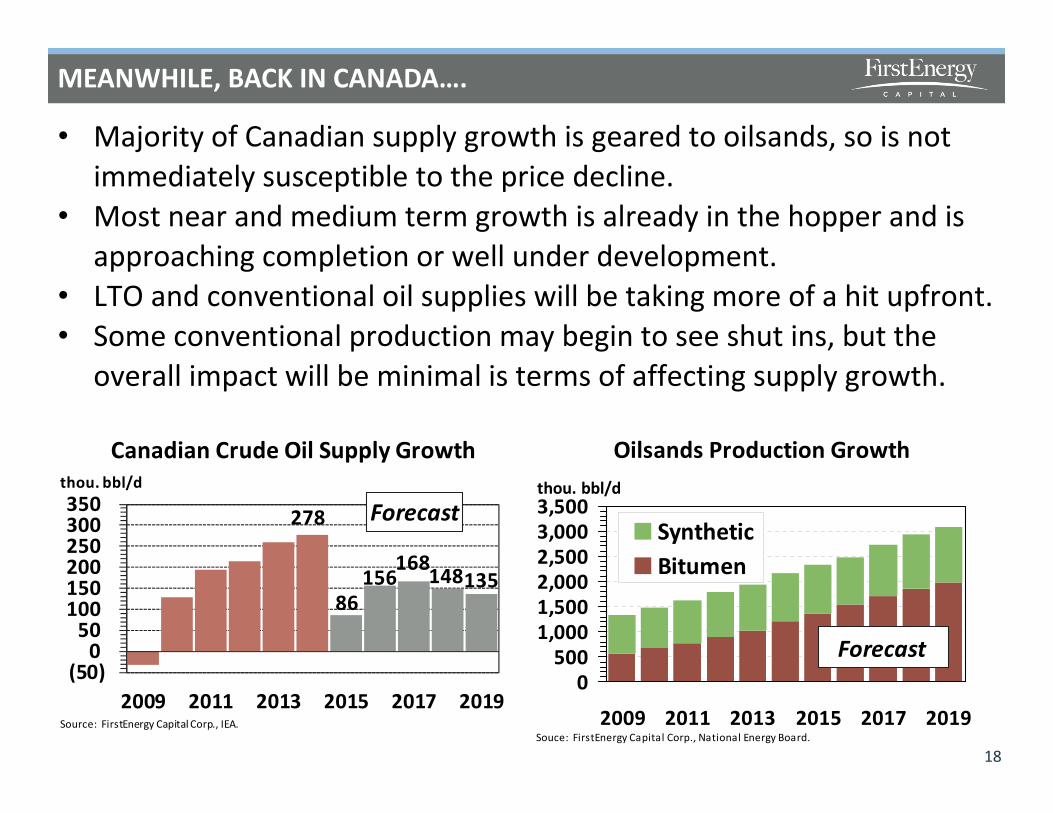
• Majority of Canadian supply growth is geared to oilsands, so is not immediately susceptible to the price decline.
• Most near and medium term growth is already in the hopper and is approaching completion or well under development.
• LTO and conventional oil supplies will be taking more of a hit upfront.• Some conventional production may begin to see shut ins, but the
overall impact will be minimal is terms of affecting supply growth.
18
Canadian Crude Oil Supply Growth
278
86 156
168 148 135
(50)0
50100150200250300350
2009 2011 2013 2015 2017 2019
thou. bbl/d
Source: FirstEnergy Capital Corp., IEA.
Forecast
Oilsands Production Growth
0500
1,0001,5002,0002,5003,0003,500
2009 2011 2013 2015 2017 2019Souce: FirstEnergy Capital Corp., National Energy Board.
thou. bbl/d
SyntheticBitumen
Forecast
NO MAJOR OILSANDS SHUT INS WILL BE FORTHCOMING
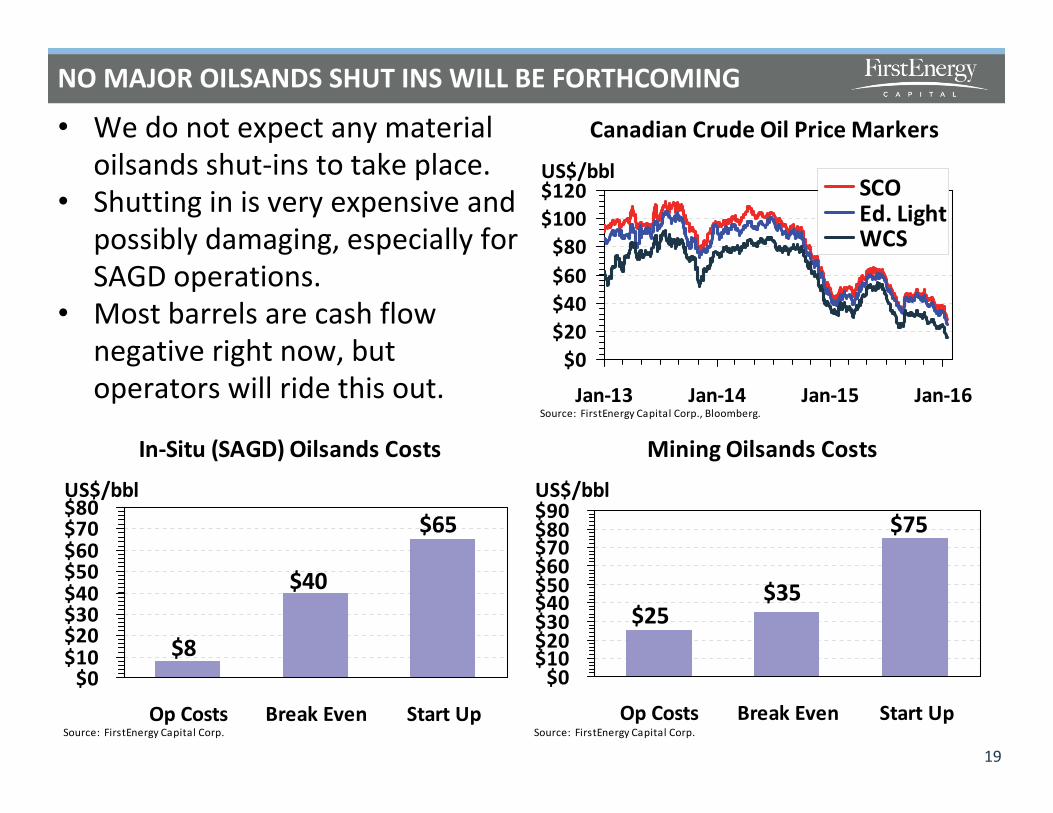
• We do not expect any material oilsands shut-ins to take place.
• Shutting in is very expensive and possibly damaging, especially for SAGD operations.
• Most barrels are cash flow negative right now, but operators will ride this out.
19
In-Situ (SAGD) Oilsands Costs
$65
$40
$8$0
$10$20$30$40$50$60$70$80
Op Costs Break Even Start UpSource: FirstEnergy Capital Corp.
US$/bbl
Mining Oilsands Costs
$75
$35$25
$0$10$20$30$40$50$60$70$80$90
Op Costs Break Even Start UpSource: FirstEnergy Capital Corp.
US$/bbl
Canadian Crude Oil Price Markers
$0$20$40$60$80
$100$120
Jan-13 Jan-14 Jan-15 Jan-16Source: FirstEnergy Capital Corp., Bloomberg.
US$/bblSCOEd. LightWCS
ARE THERE ANY POSITIVES FOR CANADA?
20
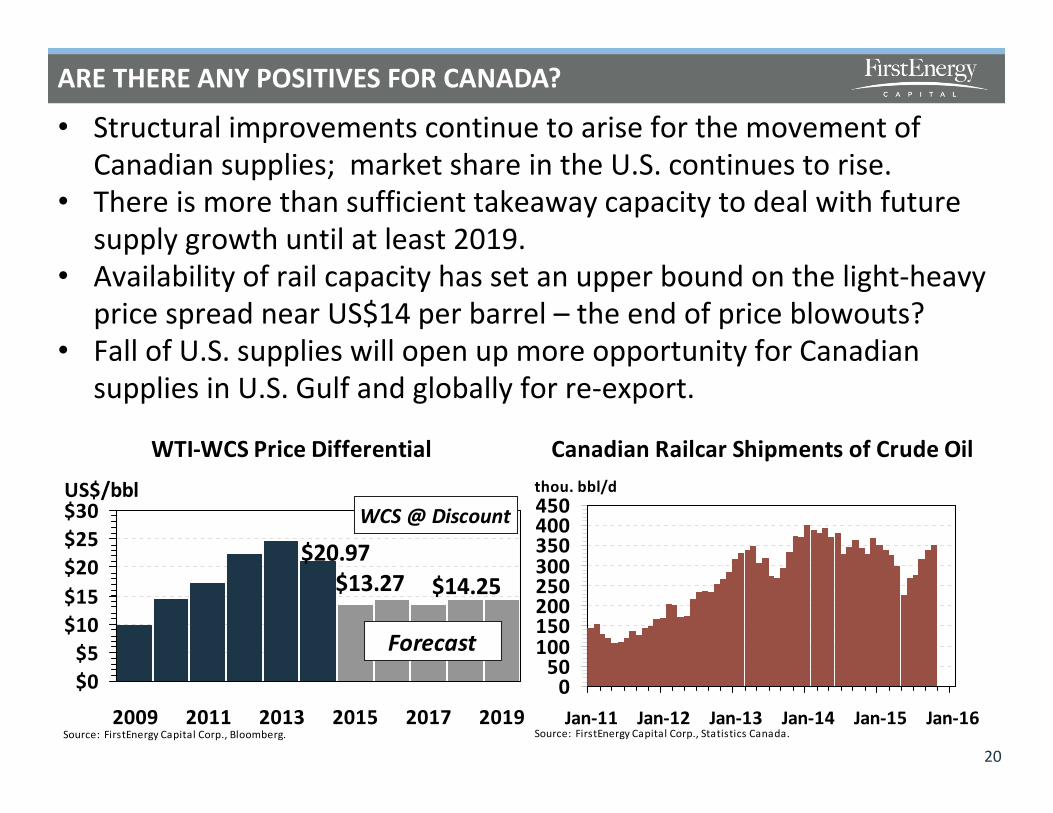
• Structural improvements continue to arise for the movement of Canadian supplies; market share in the U.S. continues to rise.
• There is more than sufficient takeaway capacity to deal with future supply growth until at least 2019.
• Availability of rail capacity has set an upper bound on the light-heavy price spread near US$14 per barrel – the end of price blowouts?
• Fall of U.S. supplies will open up more opportunity for Canadian supplies in U.S. Gulf and globally for re-export.
Canadian Railcar Shipments of Crude Oil
050
100150200250300350400450
Jan-11 Jan-12 Jan-13 Jan-14 Jan-15 Jan-16Source: FirstEnergy Capital Corp., Statistics Canada.
thou. bbl/d
WTI-WCS Price Differential
$20.97$13.27 $14.25
$0$5
$10$15$20$25$30
2009 2011 2013 2015 2017 2019Source: FirstEnergy Capital Corp., Bloomberg.
US$/bbl
Forecast
WCS @ Discount

LIFTING OF THE EXPORT BAN
21
• Budget bill signed by President Obama in December ended 40 year-old U.S. oil export ban; several cargoes have already left U.S. shores.
• Allows U.S. market to be more efficient in movement of crude.• Should relieve the backlog of light barrels in the Gulf Coast; does
create more competition, in general, with Canadian barrels.• However, relieving backlog of U.S. light barrels via exports, will allow
Canadian heavy oil to more fully capture Gulf Coast refineries.• More potential for re-exports?
Canadian Re-exports of Crude Oil via U.S. GOM
0255075
100125150
Jan-14 Jul-14 Jan-15 Jul-15 Jan-16Source: FirstEnergy Capital Corp., U.S. DOE/EIA.
thou. bbl/d Spain SwitzerlandSingapore ItalyKorea GermanyChina IndiaFrance Netherlands
Brent-WTI Price Differential
($4)$0$4$8
$12$16
Jan Mar May Jul Sep Nov JanSource: FirstEnergy Capital Corp., Bloomberg.
US$/bbl
($4)$0$4$8$12$16
2014 2015 2016
THE LOONIE UNDER PRESSURE
22
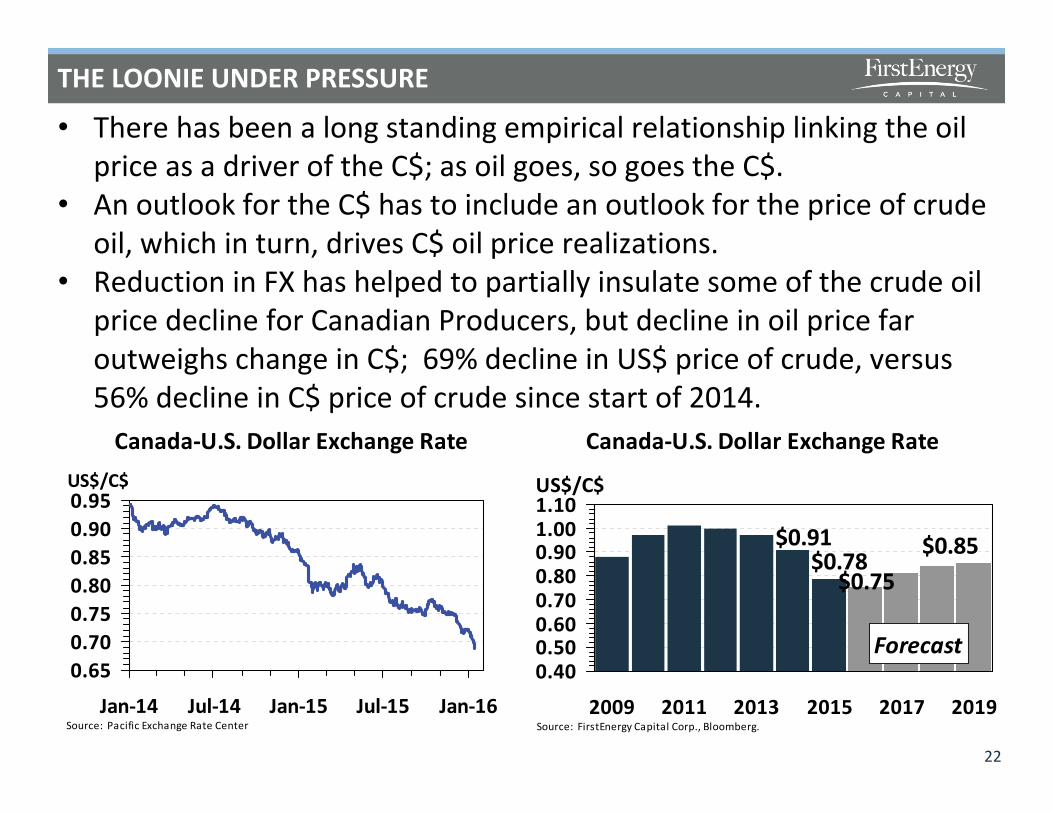
Canada-U.S. Dollar Exchange Rate
0.650.700.750.800.850.900.95
Jan-14 Jul-14 Jan-15 Jul-15 Jan-16Source: Pacific Exchange Rate Center
US$/C$
Canada-U.S. Dollar Exchange Rate
$0.85$0.75
$0.78$0.91
0.400.500.600.700.800.901.001.10
2009 2011 2013 2015 2017 2019Source: FirstEnergy Capital Corp., Bloomberg.
US$/C$
Forecast
• There has been a long standing empirical relationship linking the oil price as a driver of the C$; as oil goes, so goes the C$.
• An outlook for the C$ has to include an outlook for the price of crude oil, which in turn, drives C$ oil price realizations.
• Reduction in FX has helped to partially insulate some of the crude oil price decline for Canadian Producers, but decline in oil price far outweighs change in C$; 69% decline in US$ price of crude, versus 56% decline in C$ price of crude since start of 2014.
OTHER BIG PICTURE CONNECTIONS FOR CRUDE PRICES
23
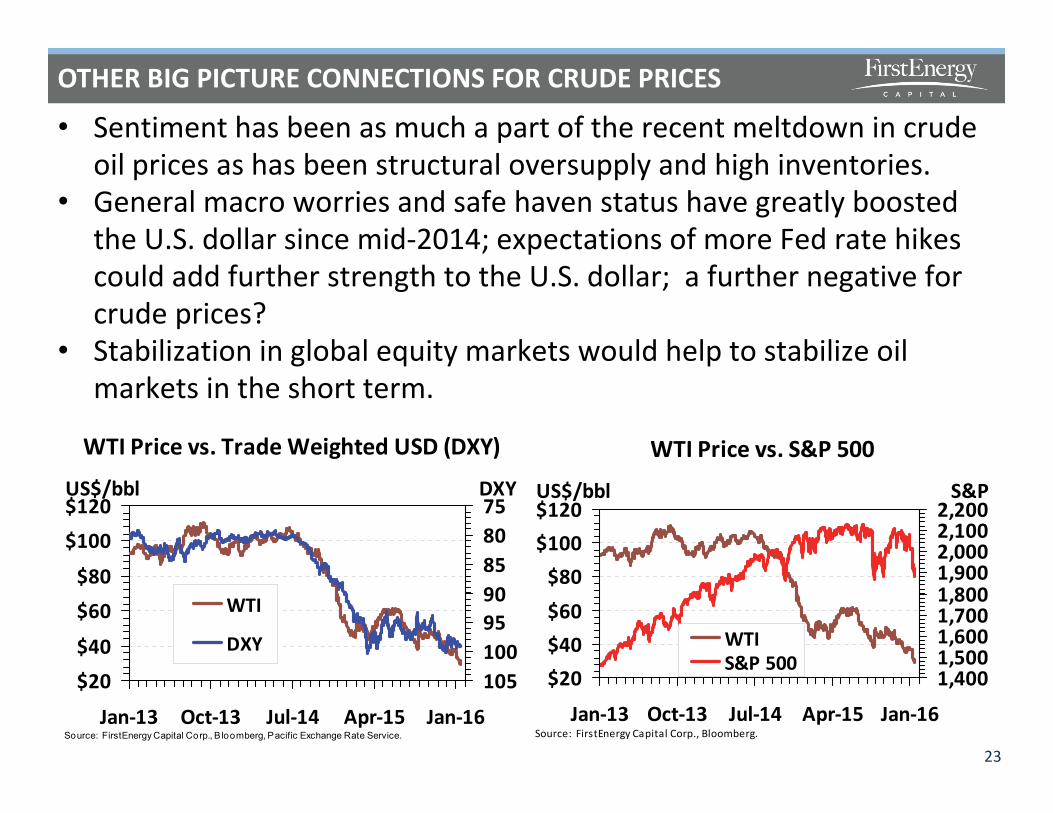
• Sentiment has been as much a part of the recent meltdown in crude oil prices as has been structural oversupply and high inventories.
• General macro worries and safe haven status have greatly boosted the U.S. dollar since mid-2014; expectations of more Fed rate hikes could add further strength to the U.S. dollar; a further negative for crude prices?
• Stabilization in global equity markets would help to stabilize oil markets in the short term.
WTI Price vs. S&P 500
$20$40$60$80
$100$120
Jan-13 Oct-13 Jul-14 Apr-15 Jan-16Source: FirstEnergy Capital Corp., Bloomberg.
US$/bbl
1,4001,5001,6001,7001,8001,9002,0002,1002,200
S&P
WTIS&P 500
WTI Price vs. Trade Weighted USD (DXY)
$20$40
$60$80
$100$120
Jan-13 Oct-13 Jul-14 Apr-15 Jan-16Source: FirstEnergy Capital Corp., B loomberg, Pacific Exchange Rate Service.
US$/bbl7580859095100105
DXY
WTI
DXY

THE GOOD AND THE BAD FOR OIL PRICE CHANGEThe bad
• Additional price weakness cannot be ruled out – small, but growing possibility of global inventories reaching nearly full – sub US$20s?
• Recent demand slowdowns in the United States and emerging economies – more to come?
• Warm winter 2015/16 in Northern Hemisphere.• Supplies end up declining more slowly than needed for price relief?• Further equity market meltdown undermines consumer sentiment?• Rebalancing delayed until well into 2017?
The good• Current low oil prices should support demand and offset some
macro weakness; supply shut-ins should become more immediate.• Spare wellhead capacity still remains tight by historic standards.• Longer term supply impacts will severely tighten the market post-
2017.• Canada better positioned than most to capture upside once prices
recover.24
CRUDE OIL MARKET CONCLUSIONS
• The United States created the oversupply and the United States will have to solve the oversupply – inventories need to fall and supplies need to drop further before there is a sustained improvement in crude oil prices.
• Low, but increasing possibility of further U.S. inventory increases and potential for further price declines in short term.
• Price declines setting the stage for a tighter market into 2017 and thereafter; Non-OPEC supplies being severely impacted and demand will get a further boost.
• Initially expected a balancing in 1H16, now appears to be later in 2H16, with a potential for further delay into 2017.
• No help from OPEC; Iran return will drag on prices.• Canadian supplies looking resilient into 2018 on oilsands growth;
Canada better positioned to increase market share in the U.S.• Price signals still work! Supply will decline and demand will improve –
the market WILL achieve balance, but it is a slow and uneven process.25
FIRSTENERGY CRUDE OIL PRICE FORECAST (AND CHANGES?)
26
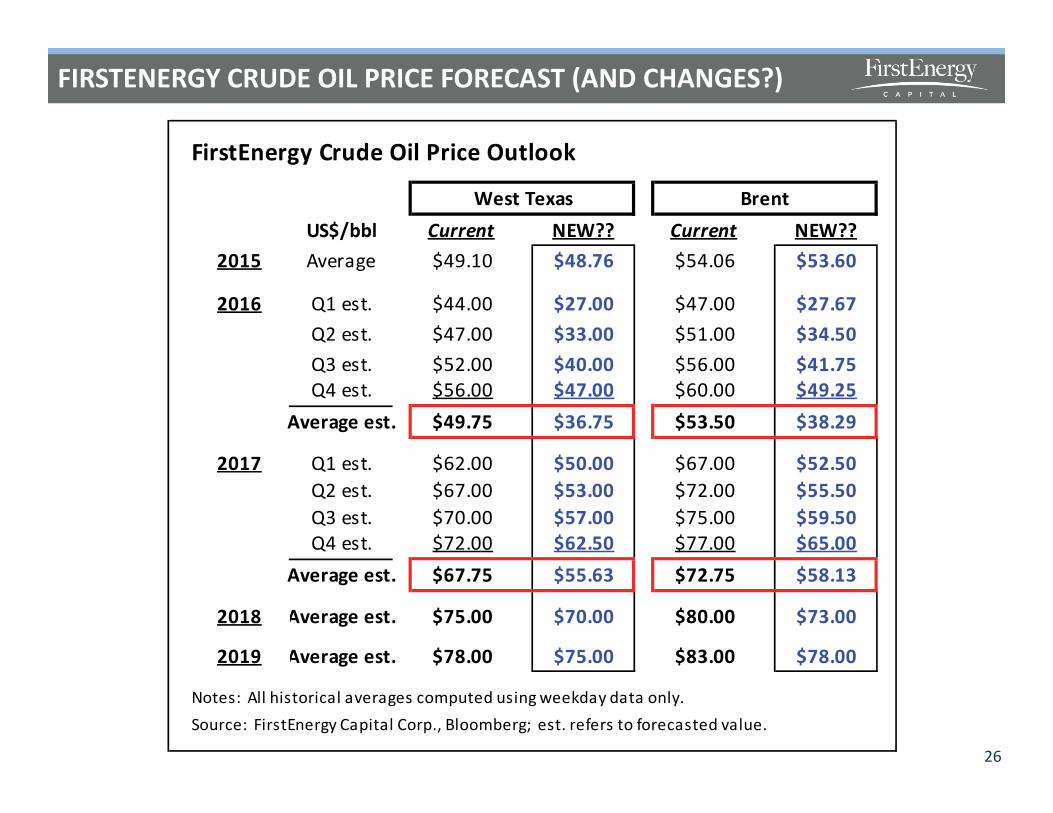
FirstEnergy Crude Oil Price Outlook
West Texas BrentUS$/bbl Current NEW?? Current NEW??
2015 Average $49.10 $48.76 $54.06 $53.60
2016 Q1 est. $44.00 $27.00 $47.00 $27.67Q2 est. $47.00 $33.00 $51.00 $34.50Q3 est. $52.00 $40.00 $56.00 $41.75Q4 est. $56.00 $47.00 $60.00 $49.25
Average est. $49.75 $36.75 $53.50 $38.29
2017 Q1 est. $62.00 $50.00 $67.00 $52.50Q2 est. $67.00 $53.00 $72.00 $55.50Q3 est. $70.00 $57.00 $75.00 $59.50Q4 est. $72.00 $62.50 $77.00 $65.00
Average est. $67.75 $55.63 $72.75 $58.13
2018 Average est. $75.00 $70.00 $80.00 $73.00
2019 Average est. $78.00 $75.00 $83.00 $78.00
Notes: All historical averages computed using weekday data only.Source: FirstEnergy Capital Corp., Bloomberg; est. refers to forecasted value.
FIRSTENERGY CANADIAN CRUDE OIL PRICE FORECAST
27
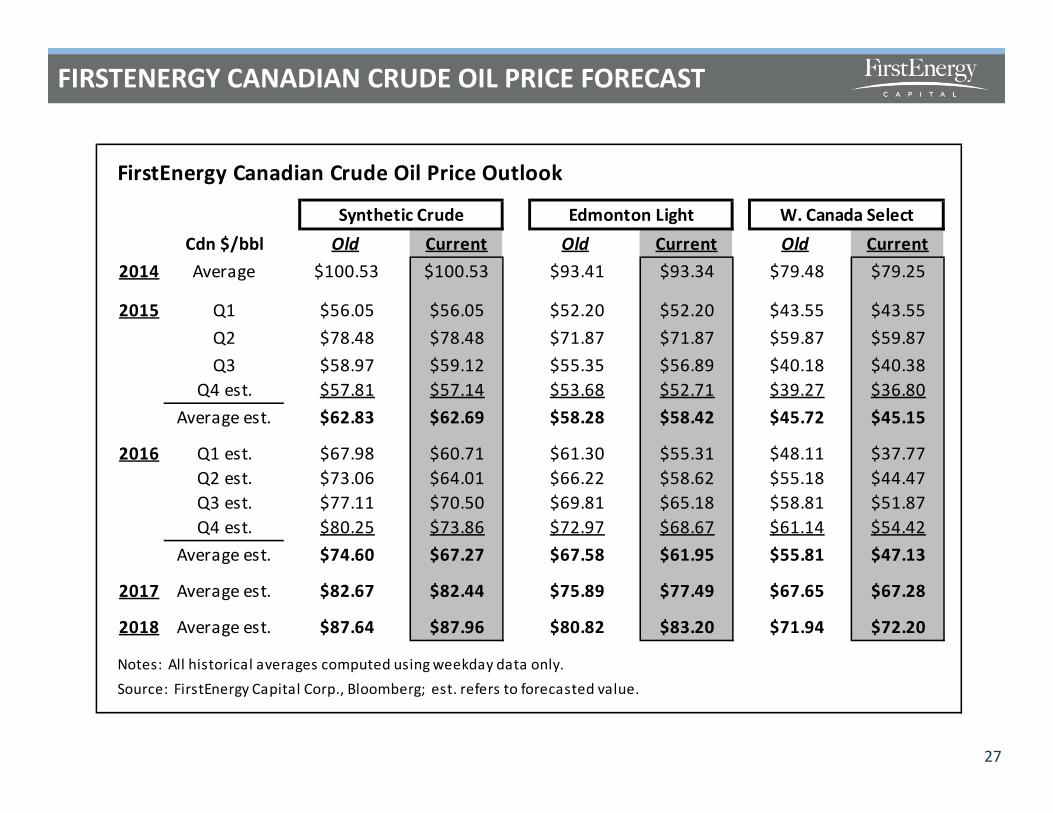
FirstEnergy Canadian Crude Oil Price Outlook
Synthetic Crude Edmonton Light W. Canada SelectCdn $/bbl Old Current Old Current Old Current
2014 Average $100.53 $100.53 $93.41 $93.34 $79.48 $79.25
2015 Q1 $56.05 $56.05 $52.20 $52.20 $43.55 $43.55Q2 $78.48 $78.48 $71.87 $71.87 $59.87 $59.87Q3 $58.97 $59.12 $55.35 $56.89 $40.18 $40.38
Q4 est. $57.81 $57.14 $53.68 $52.71 $39.27 $36.80Average est. $62.83 $62.69 $58.28 $58.42 $45.72 $45.15
2016 Q1 est. $67.98 $60.71 $61.30 $55.31 $48.11 $37.77Q2 est. $73.06 $64.01 $66.22 $58.62 $55.18 $44.47Q3 est. $77.11 $70.50 $69.81 $65.18 $58.81 $51.87Q4 est. $80.25 $73.86 $72.97 $68.67 $61.14 $54.42
Average est. $74.60 $67.27 $67.58 $61.95 $55.81 $47.13
2017 Average est. $82.67 $82.44 $75.89 $77.49 $67.65 $67.28
2018 Average est. $87.64 $87.96 $80.82 $83.20 $71.94 $72.20
Notes: All historical averages computed using weekday data only.Source: FirstEnergy Capital Corp., Bloomberg; est. refers to forecasted value.

NATURAL GAS MARKETS
A WINTER TO FORGET, BUT A SUMMER TO REMEMBER?
28
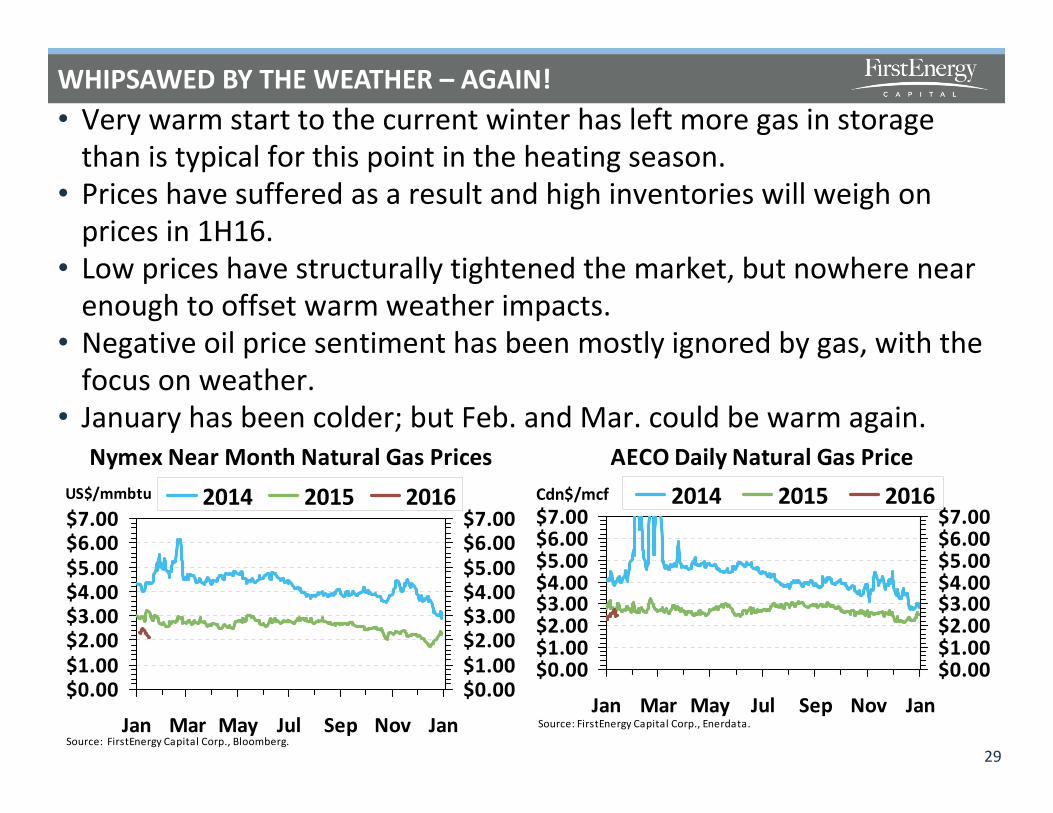
WHIPSAWED BY THE WEATHER – AGAIN!• Very warm start to the current winter has left more gas in storage
than is typical for this point in the heating season.• Prices have suffered as a result and high inventories will weigh on
prices in 1H16.• Low prices have structurally tightened the market, but nowhere near
enough to offset warm weather impacts.• Negative oil price sentiment has been mostly ignored by gas, with the
focus on weather.• January has been colder; but Feb. and Mar. could be warm again.
29
Nymex Near Month Natural Gas Prices
$0.00$1.00$2.00$3.00$4.00$5.00$6.00$7.00
Jan Mar May Jul Sep Nov JanSource: FirstEnergy Capital Corp., Bloomberg.
US$/mmbtu
$0.00$1.00$2.00$3.00$4.00$5.00$6.00$7.00
2014 2015 2016AECO Daily Natural Gas Price
$0.00$1.00$2.00$3.00$4.00$5.00$6.00$7.00
Jan Mar May Jul Sep Nov JanSource: FirstEnergy Capital Corp., Enerdata.
Cdn$/mcf
$0.00$1.00$2.00$3.00$4.00$5.00$6.00$7.00
2014 2015 2016

OFF THE CHARTS – IT HAS BEEN EXCEPTIONALLY WARM
30
U.S. December HDDs 1931-2015
0200400600800
1,0001,200
2015
1931
2011
1939
1979
1933
1952
1967
1973
1951
1966
1947
1978
1943
1955
1958
1985
Source: FirstEnergy Capital Corp., U.S. NOAA.
HDDs
2015
U.S. December Storage Withdrawals
0100200300400500600700800
1975 1983 1991 1999 2007 2015Source: FirstEnegry Capital Corp., U.S. DOE/EIA.
bcf/d
U.S. Winter Heating Degree Days
050
100150200250
Sep-26 Nov-7 Dec-19 Jan-30 Mar-12 Apr-23Source: FirstEnergy Capital Corp., U.S. NOAA.
HDDs 2015/2016 Normal
• December 2015 was the warmest on record for the United States – by far.
• Has cost the market 350 to 400 bcf of gas storage consumption.
• Nov. 2015 also warmer than average, which set the stage for price bear declines of Dec.
STORAGE LEVELS ARE HIGH – TOO HIGH
31
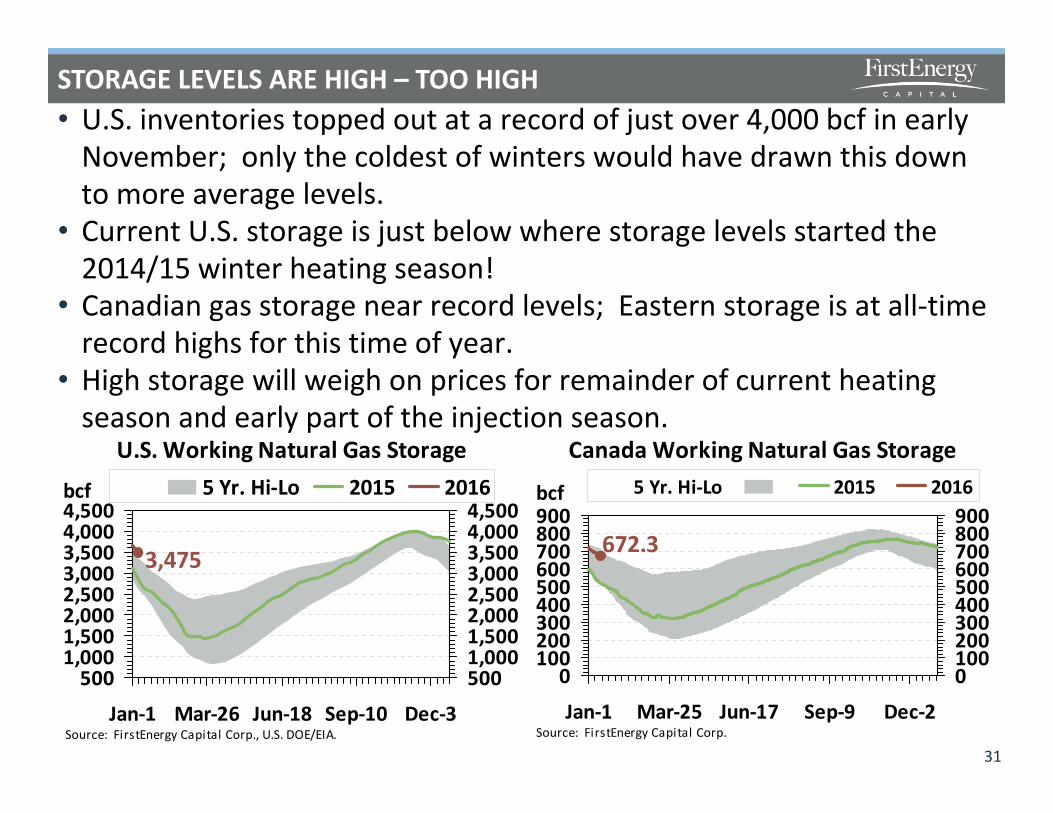
U.S. Working Natural Gas Storage
3,475
5001,0001,5002,0002,5003,0003,5004,0004,500
Jan-1 Mar-26 Jun-18 Sep-10 Dec-3Source: FirstEnergy Capital Corp., U.S. DOE/EIA.
bcf
5001,0001,5002,0002,5003,0003,5004,0004,500
5 Yr. Hi-Lo 2015 2016
Canada Working Natural Gas Storage
672.3
0100200300400500600700800900
Jan-1 Mar-25 Jun-17 Sep-9 Dec-2Source: FirstEnergy Capital Corp.
bcf
0100200300400500600700800900
5 Yr. Hi-Lo 2015 2016
• U.S. inventories topped out at a record of just over 4,000 bcf in early November; only the coldest of winters would have drawn this down to more average levels.
• Current U.S. storage is just below where storage levels started the 2014/15 winter heating season!
• Canadian gas storage near record levels; Eastern storage is at all-time record highs for this time of year.
• High storage will weigh on prices for remainder of current heating season and early part of the injection season.
POTENTIAL END MARCH EXIT FOR STORAGE
32
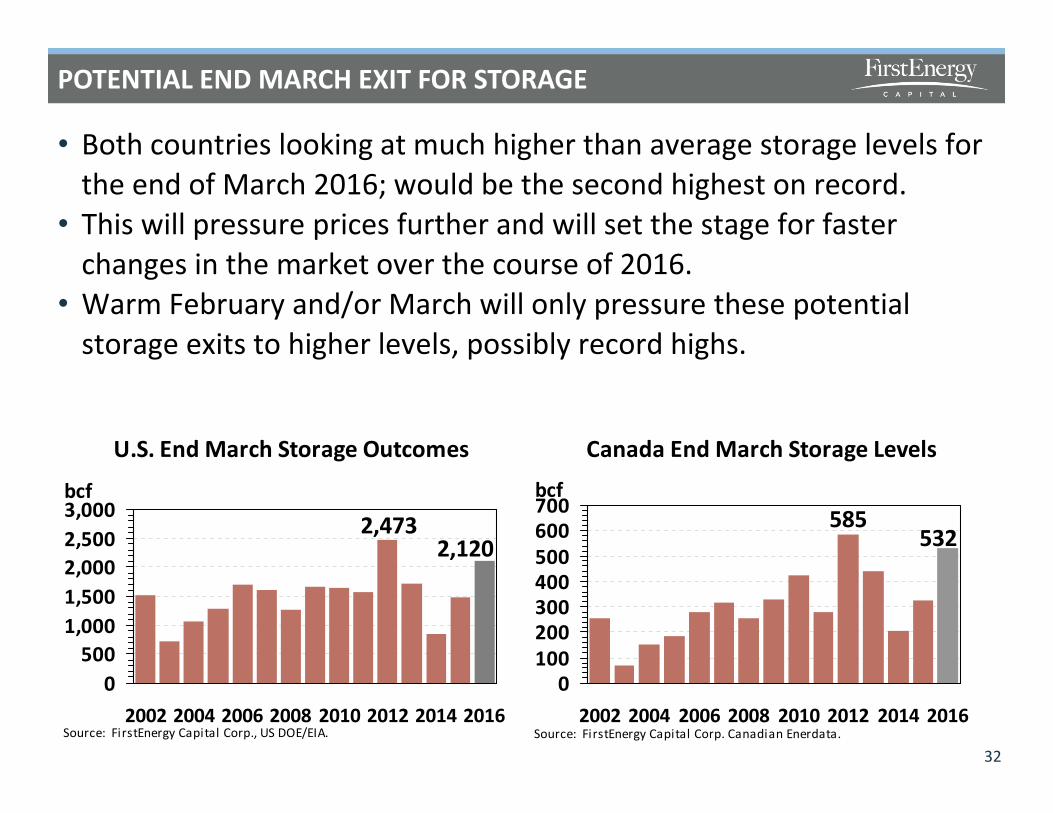
U.S. End March Storage Outcomes
2,1202,473
0500
1,0001,5002,0002,5003,000
2002 2004 2006 2008 2010 2012 2014 2016Source: FirstEnergy Capital Corp., US DOE/EIA.
bcf
Canada End March Storage Levels
532585
0100200300400500600700
2002 2004 2006 2008 2010 2012 2014 2016Source: FirstEnergy Capital Corp. Canadian Enerdata.
bcf
• Both countries looking at much higher than average storage levels for the end of March 2016; would be the second highest on record.
• This will pressure prices further and will set the stage for faster changes in the market over the course of 2016.
• Warm February and/or March will only pressure these potential storage exits to higher levels, possibly record highs.

POTENTIAL FOR THE GAS MARKET TO SNAP BACK THIS SUMMER
• Just like in the oil market, even lower prices than anyone expected are forcing even faster change – the difference for the North American natural gas market is that it does not have to rely on other parts of the world for a rebalancing.
• Impacts from low oil prices are already making an impact on U.S. domestic gas supplies.
• Low gas prices have deferred/discouraged more drilling, further cuts to capex programs, and encouraged regional shut-ins (Marcellus).
• Most U.S. supply growth in 2016 will be regionally focused (Marcellus), but still held back on low gas prices and infrastructure constraints (could still be more shut-ins).
• Structural demand growth is continuing, while price sensitive demand growth is still in the hopper for 2016 (power generation).
• Market could be looking at just average to modestly higher than average storage by October 2016.
33
POTENTIAL END OCTOBER EXIT FOR STORAGE
34
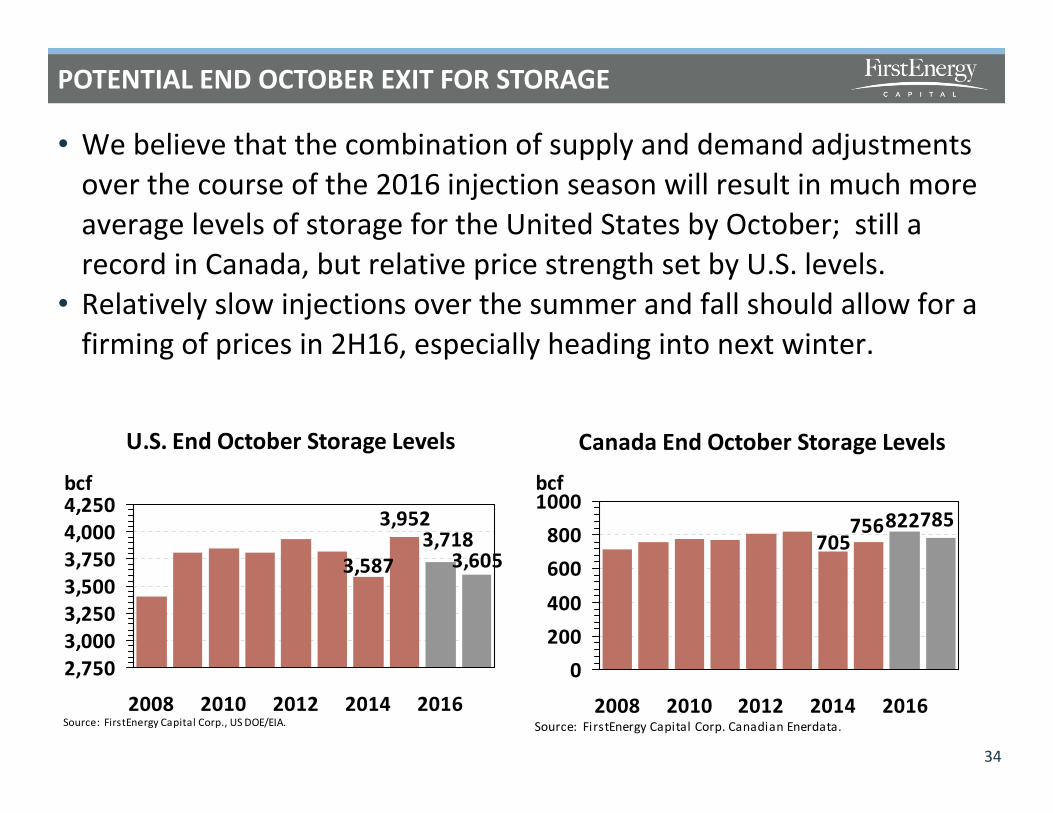
• We believe that the combination of supply and demand adjustments over the course of the 2016 injection season will result in much more average levels of storage for the United States by October; still a record in Canada, but relative price strength set by U.S. levels.
• Relatively slow injections over the summer and fall should allow for a firming of prices in 2H16, especially heading into next winter.
U.S. End October Storage Levels
3,6053,718
3,952
3,587
2,7503,0003,2503,5003,7504,0004,250
2008 2010 2012 2014 2016Source: FirstEnergy Capital Corp., US DOE/EIA.
bcf
Canada End October Storage Levels
705756822785
0200400600800
1000
2008 2010 2012 2014 2016Source: FirstEnergy Capital Corp. Canadian Enerdata.
bcf
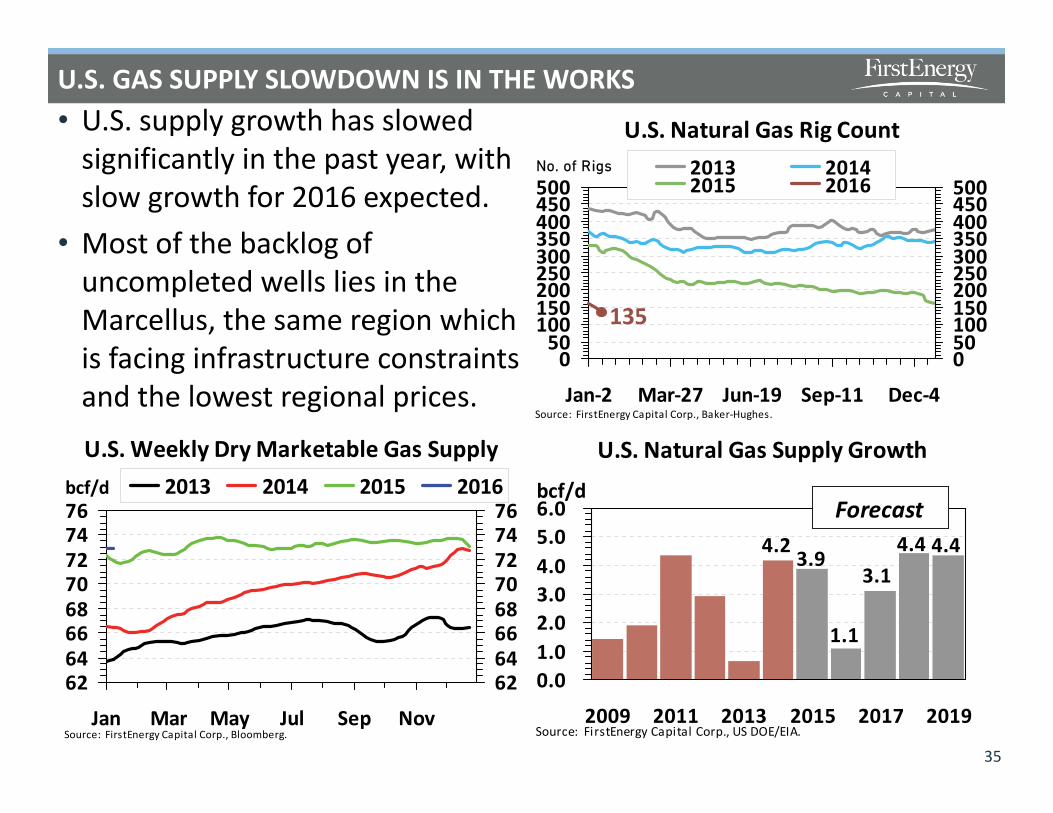
U.S. GAS SUPPLY SLOWDOWN IS IN THE WORKS• U.S. supply growth has slowed
significantly in the past year, with slow growth for 2016 expected.
• Most of the backlog of uncompleted wells lies in the Marcellus, the same region which is facing infrastructure constraints and the lowest regional prices.
35
U.S. Natural Gas Supply Growth
4.2 3.9
1.1
3.14.4 4.4
0.01.02.03.04.05.06.0
2009 2011 2013 2015 2017 2019Source: FirstEnergy Capital Corp., US DOE/EIA.
bcf/dForecast
U.S. Weekly Dry Marketable Gas Supply
6264666870727476
Jan Mar May Jul Sep NovSource: FirstEnergy Capital Corp., Bloomberg.
bcf/d
6264666870727476
2013 2014 2015 2016
U.S. Natural Gas Rig Count
135
050
100150200250300350400450500
Jan-2 Mar-27 Jun-19 Sep-11 Dec-4Source: FirstEnergy Capital Corp., Baker-Hughes.
No. of Rigs
050100150200250300350400450500
2013 20142015 2016
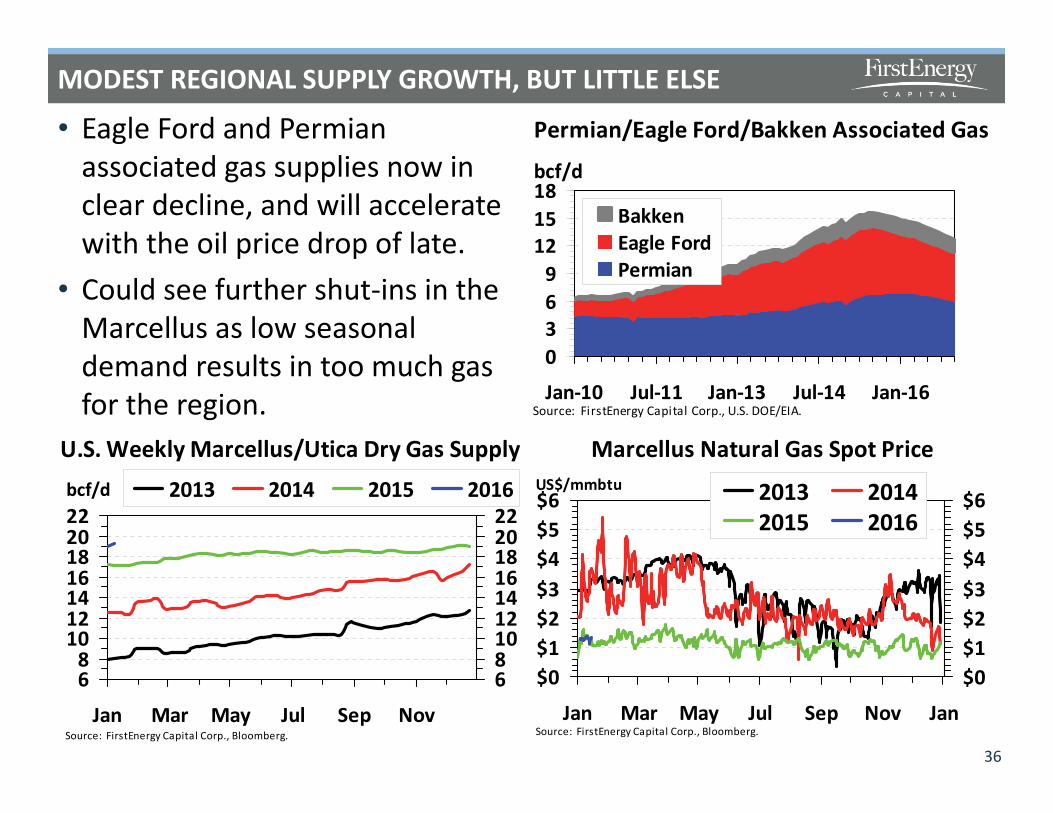
MODEST REGIONAL SUPPLY GROWTH, BUT LITTLE ELSE
36
U.S. Weekly Marcellus/Utica Dry Gas Supply
68
10121416182022
Jan Mar May Jul Sep NovSource: FirstEnergy Capital Corp., Bloomberg.
bcf/d
6810121416182022
2013 2014 2015 2016
Permian/Eagle Ford/Bakken Associated Gas
0369
121518
Jan-10 Jul-11 Jan-13 Jul-14 Jan-16Source: FirstEnergy Capital Corp., U.S. DOE/EIA.
bcf/d
BakkenEagle FordPermian
Marcellus Natural Gas Spot Price
$0$1$2$3$4$5$6
Jan Mar May Jul Sep Nov JanSource: FirstEnergy Capital Corp., Bloomberg.
US$/mmbtu
$0$1$2$3$4$5$62013 2014
2015 2016
• Eagle Ford and Permian associated gas supplies now in clear decline, and will accelerate with the oil price drop of late.
• Could see further shut-ins in the Marcellus as low seasonal demand results in too much gas for the region.
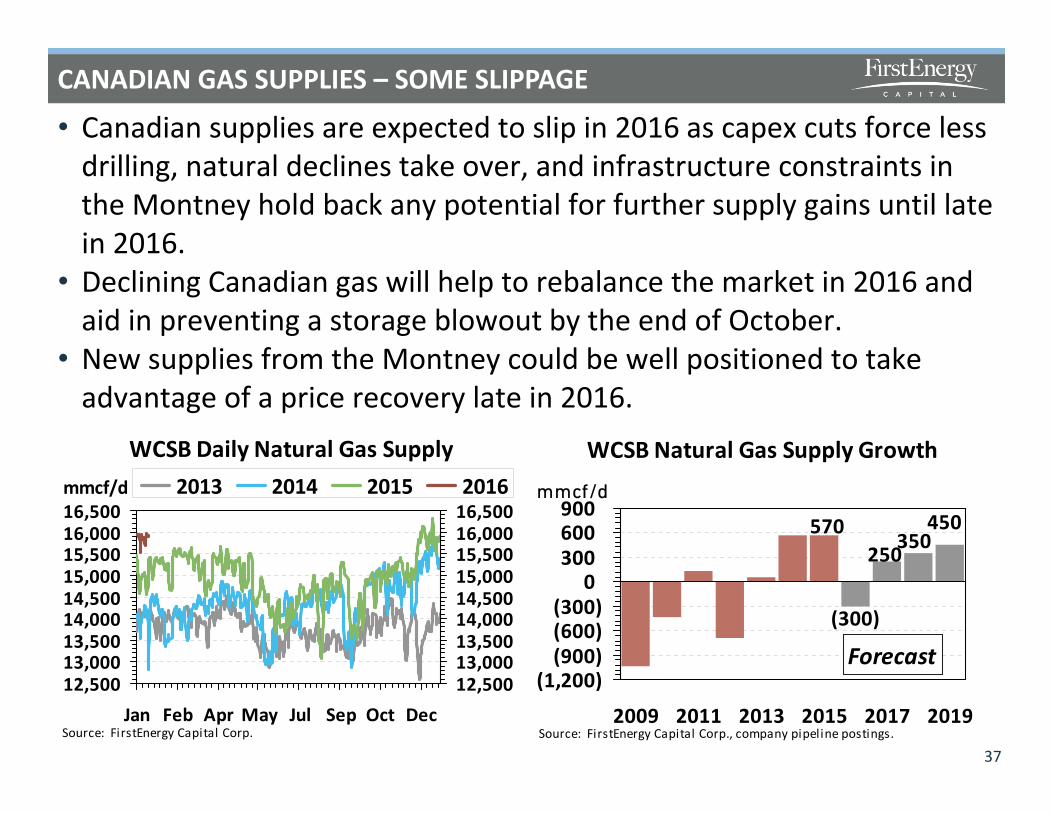
CANADIAN GAS SUPPLIES – SOME SLIPPAGE
• Canadian supplies are expected to slip in 2016 as capex cuts force less drilling, natural declines take over, and infrastructure constraints in the Montney hold back any potential for further supply gains until late in 2016.
• Declining Canadian gas will help to rebalance the market in 2016 and aid in preventing a storage blowout by the end of October.
• New supplies from the Montney could be well positioned to take advantage of a price recovery late in 2016.
37
WCSB Natural Gas Supply Growth
570
(300)
250350450
(1,200)(900)(600)(300)
0300600900
2009 2011 2013 2015 2017 2019Source: FirstEnergy Capital Corp., company pipeline postings.
mmcf/d
Forecast
WCSB Daily Natural Gas Supply
12,50013,00013,50014,00014,50015,00015,50016,00016,500
Jan Feb Apr May Jul Sep Oct DecSource: FirstEnergy Capital Corp.
mmcf/d
12,50013,00013,50014,00014,50015,00015,50016,00016,500
2013 2014 2015 2016
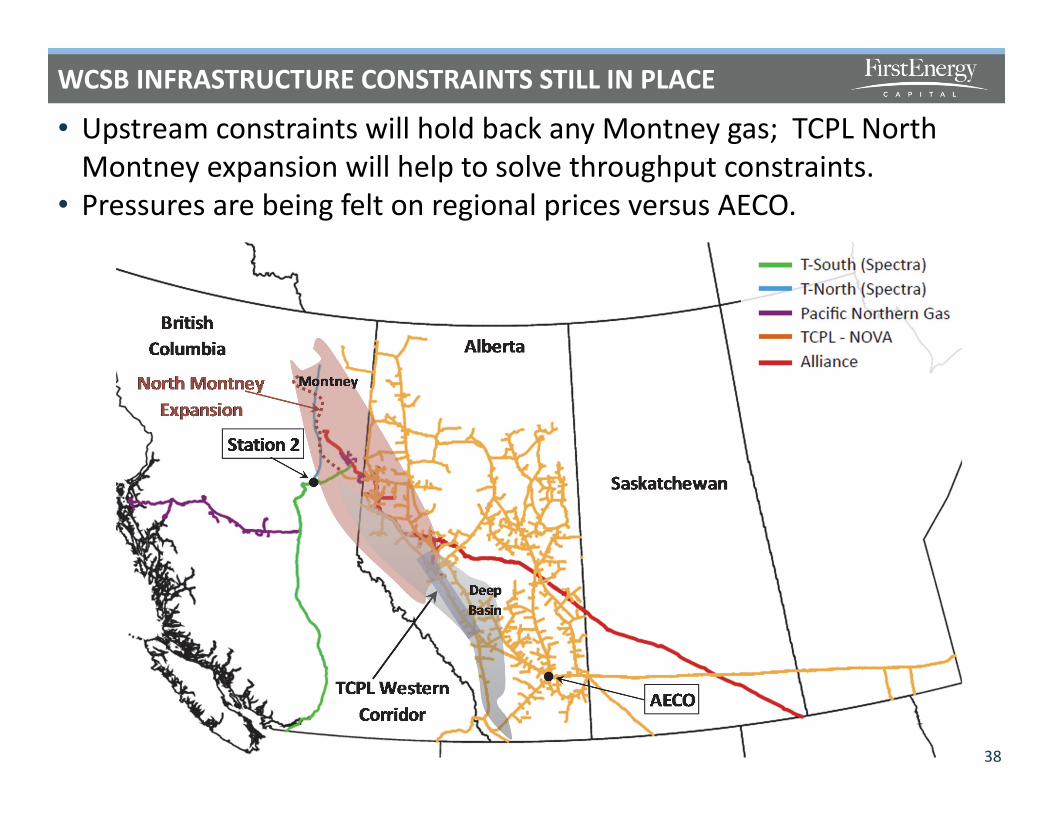
WCSB INFRASTRUCTURE CONSTRAINTS STILL IN PLACE
• Upstream constraints will hold back any Montney gas; TCPL North Montney expansion will help to solve throughput constraints.
• Pressures are being felt on regional prices versus AECO.
38
DEMAND GROWTH ON THE WAY
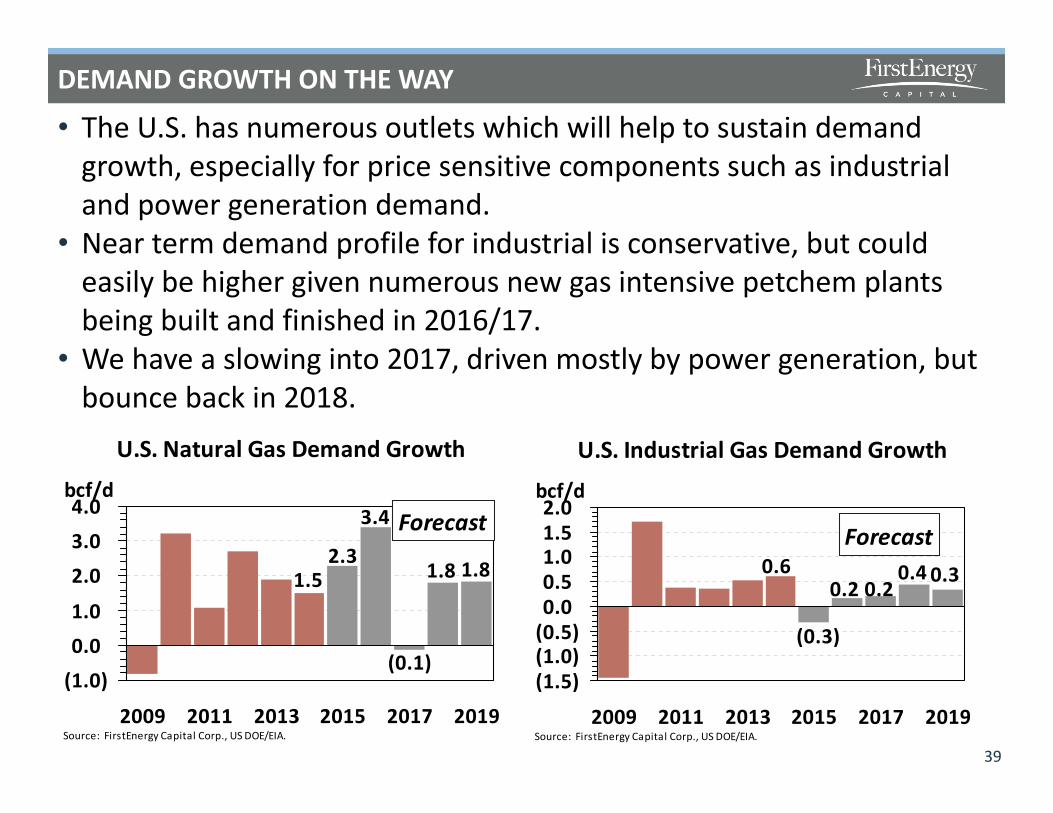
• The U.S. has numerous outlets which will help to sustain demand growth, especially for price sensitive components such as industrial and power generation demand.
• Near term demand profile for industrial is conservative, but could easily be higher given numerous new gas intensive petchem plants being built and finished in 2016/17.
• We have a slowing into 2017, driven mostly by power generation, but bounce back in 2018.
39
U.S. Natural Gas Demand Growth
1.81.8
(0.1)
3.4
2.31.5
(1.0)0.01.0
2.03.04.0
2009 2011 2013 2015 2017 2019Source: FirstEnergy Capital Corp., US DOE/EIA.
bcf/dForecast
U.S. Industrial Gas Demand Growth
0.6
(0.3)
0.2 0.20.4 0.3
(1.5)(1.0)(0.5)0.00.51.01.52.0
2009 2011 2013 2015 2017 2019Source: FirstEnergy Capital Corp., US DOE/EIA.
bcf/d
Forecast
U.S. GAS POWER DEMAND
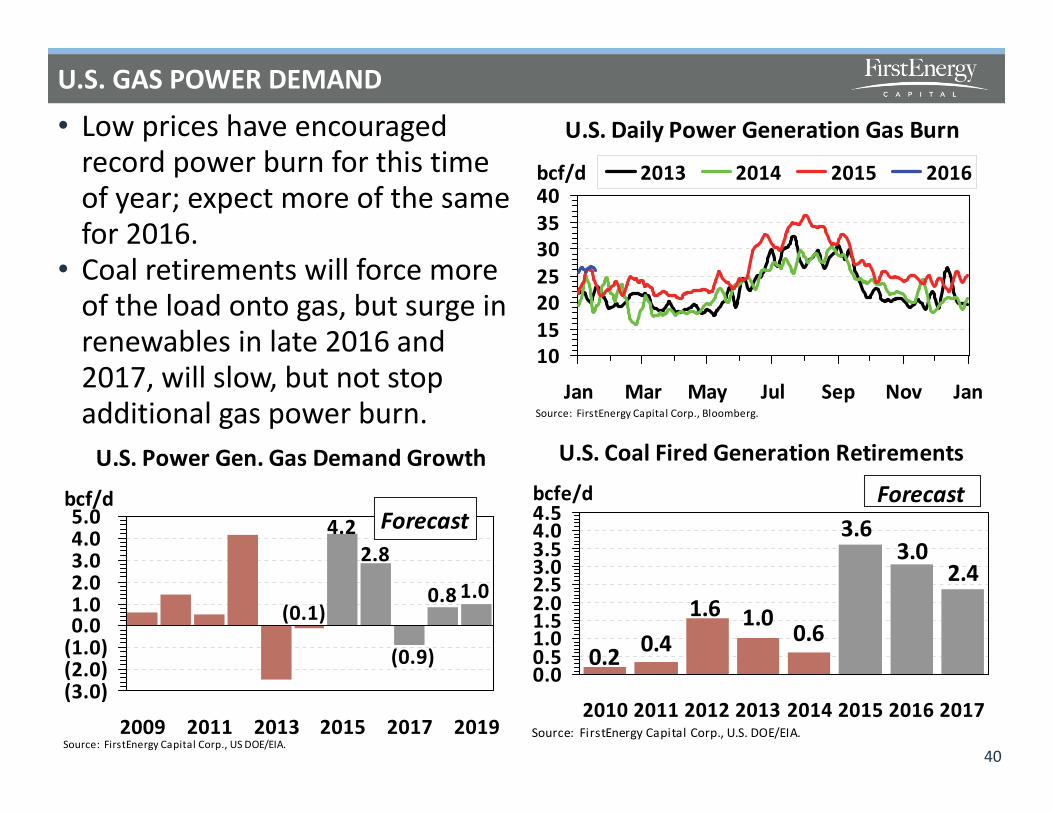
• Low prices have encouraged record power burn for this time of year; expect more of the same for 2016.
• Coal retirements will force more of the load onto gas, but surge in renewables in late 2016 and 2017, will slow, but not stop additional gas power burn.
40
U.S. Power Gen. Gas Demand Growth
(0.1)
4.22.8
(0.9)
0.8 1.0
(3.0)(2.0)(1.0)0.01.02.03.04.05.0
2009 2011 2013 2015 2017 2019Source: FirstEnergy Capital Corp., US DOE/EIA.
bcf/dForecast
U.S. Coal Fired Generation Retirements
2.4
3.6
1.01.6
3.0
0.40.20.6
0.00.51.01.52.02.53.03.54.04.5
2010 2011 2012 2013 2014 2015 2016 2017Source: FirstEnergy Capital Corp., U.S. DOE/EIA.
bcfe/d Forecast
U.S. Daily Power Generation Gas Burn
10152025303540
Jan Mar May Jul Sep Nov JanSource: FirstEnergy Capital Corp., Bloomberg.
bcf/d 2013 2014 2015 2016
EXPORTS OF U.S. GAS TO RISE FURTHER
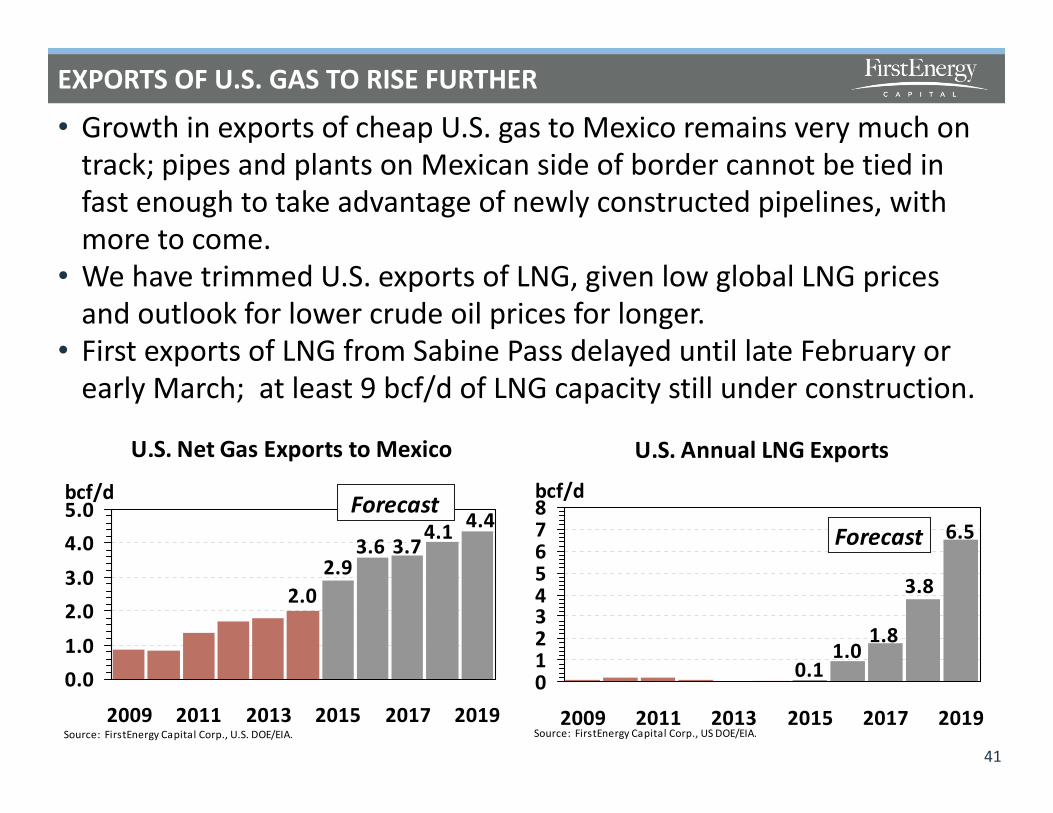
• Growth in exports of cheap U.S. gas to Mexico remains very much on track; pipes and plants on Mexican side of border cannot be tied in fast enough to take advantage of newly constructed pipelines, with more to come.
• We have trimmed U.S. exports of LNG, given low global LNG prices and outlook for lower crude oil prices for longer.
• First exports of LNG from Sabine Pass delayed until late February or early March; at least 9 bcf/d of LNG capacity still under construction.
41
U.S. Annual LNG Exports
3.8
1.80.1
1.0
6.5
012345678
2009 2011 2013 2015 2017 2019Source: FirstEnergy Capital Corp., US DOE/EIA.
bcf/d
Forecast
U.S. Net Gas Exports to Mexico
4.44.13.7
2.02.9
3.6
0.01.02.03.04.05.0
2009 2011 2013 2015 2017 2019Source: FirstEnergy Capital Corp., U.S. DOE/EIA.
bcf/d Forecast

MORE LNG CONCERNS
42
Global LNG Netbacks
$3$6$9
$12$15$18$21
Jan-14 Jul-14 Jan-15 Jul-15 Jan-16Source: FirstEnergy Capital Corp., Waterborne Energy Inc.
US $/mmbtu
$3$6$9$12$15$18$21
IndiaSpainJapanUK
Global LNG Supply and Capacity
20
30
40
50
60
2009 2011 2013 2015 2017 2019Source: FirstEnergy Capital Corp., Waterborne Energy Inc.
bcf/d
20
30
40
50
60LNG ProductionLNG Capacity
• The collapse in crude oil prices and expectations of low prices for longer has dragged down oil indexed LNG prices to multi-year lows.
• Increasing number of buyers looking for spot linked LNG prices and greater flexibility in pricing and shipping terms.
• Significant increase in supply capacity from Australia and U.S. in next three years, some of which is not committed to end buyers, and will pressure spot prices.
• Slack demand in Asian economies and Japan’s nuke renewal is holding back LNG demand.
CANADIAN LNG PROJECTS – THE FRONT RUNNERS
43
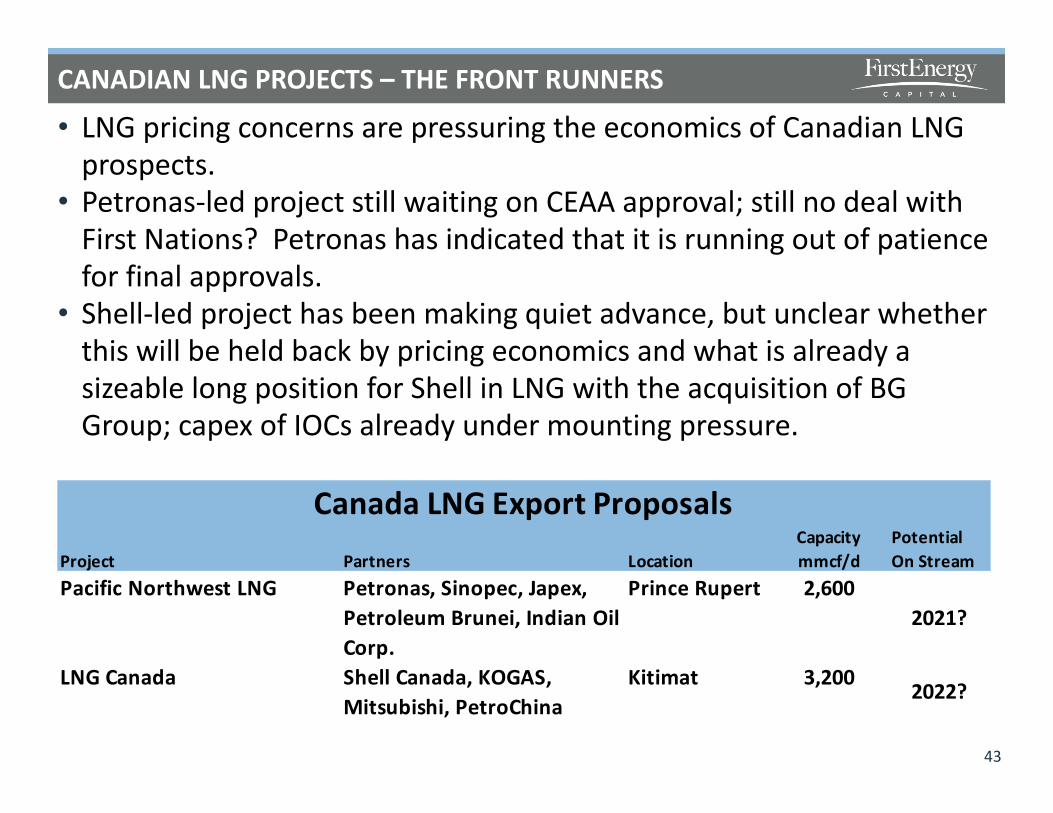
• LNG pricing concerns are pressuring the economics of Canadian LNG prospects.
• Petronas-led project still waiting on CEAA approval; still no deal with First Nations? Petronas has indicated that it is running out of patience for final approvals.
• Shell-led project has been making quiet advance, but unclear whether this will be held back by pricing economics and what is already a sizeable long position for Shell in LNG with the acquisition of BG Group; capex of IOCs already under mounting pressure.
Canada LNG Export ProposalsCapacity Potential
Project Partners Location mmcf/d On StreamPacific Northwest LNG Petronas, Sinopec, Japex,
Petroleum Brunei, Indian Oil Corp.
Prince Rupert 2,6002021?
LNG Canada Shell Canada, KOGAS, Mitsubishi, PetroChina
Kitimat 3,200 2022?
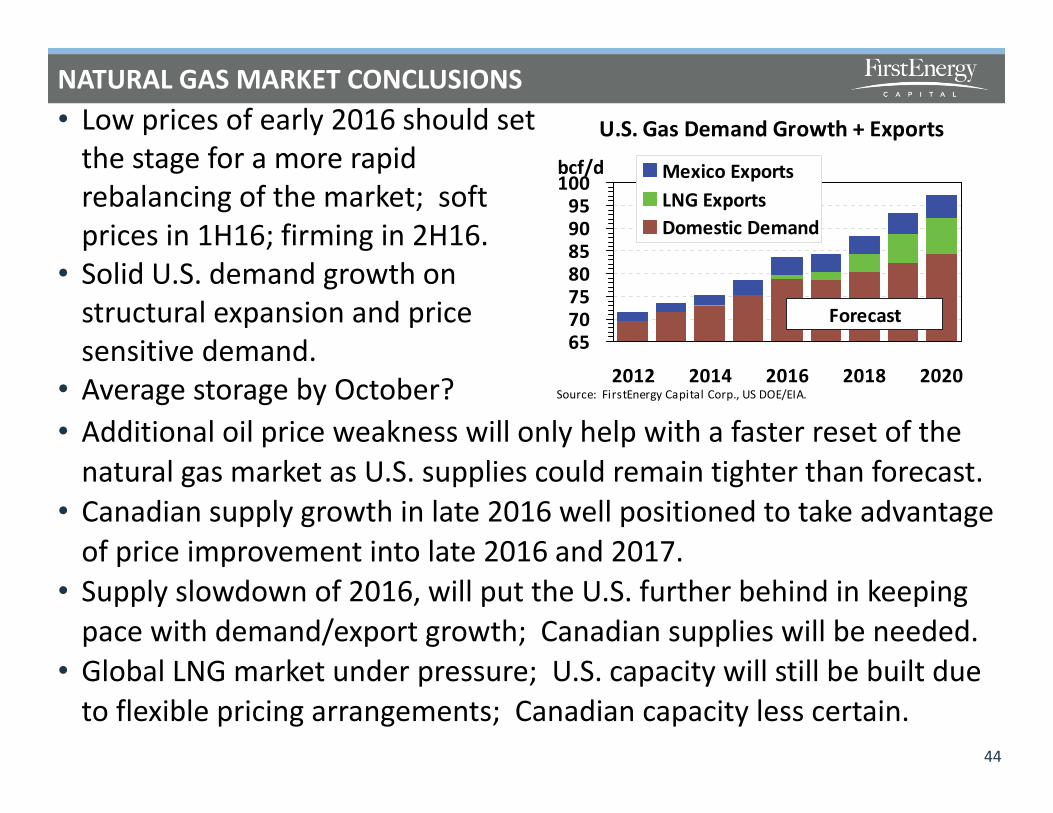
NATURAL GAS MARKET CONCLUSIONS• Low prices of early 2016 should set
the stage for a more rapid rebalancing of the market; soft prices in 1H16; firming in 2H16.
• Solid U.S. demand growth on structural expansion and price sensitive demand.
• Average storage by October?
44
U.S. Gas Demand Growth + Exports
65707580859095
100
2012 2014 2016 2018 2020Source: FirstEnergy Capital Corp., US DOE/EIA.
bcf/d Mexico ExportsLNG ExportsDomestic Demand
Forecast
• Additional oil price weakness will only help with a faster reset of the natural gas market as U.S. supplies could remain tighter than forecast.
• Canadian supply growth in late 2016 well positioned to take advantage of price improvement into late 2016 and 2017.
• Supply slowdown of 2016, will put the U.S. further behind in keeping pace with demand/export growth; Canadian supplies will be needed.
• Global LNG market under pressure; U.S. capacity will still be built due to flexible pricing arrangements; Canadian capacity less certain.
FIRSTENERGY NATURAL GAS PRICE OUTLOOK
45
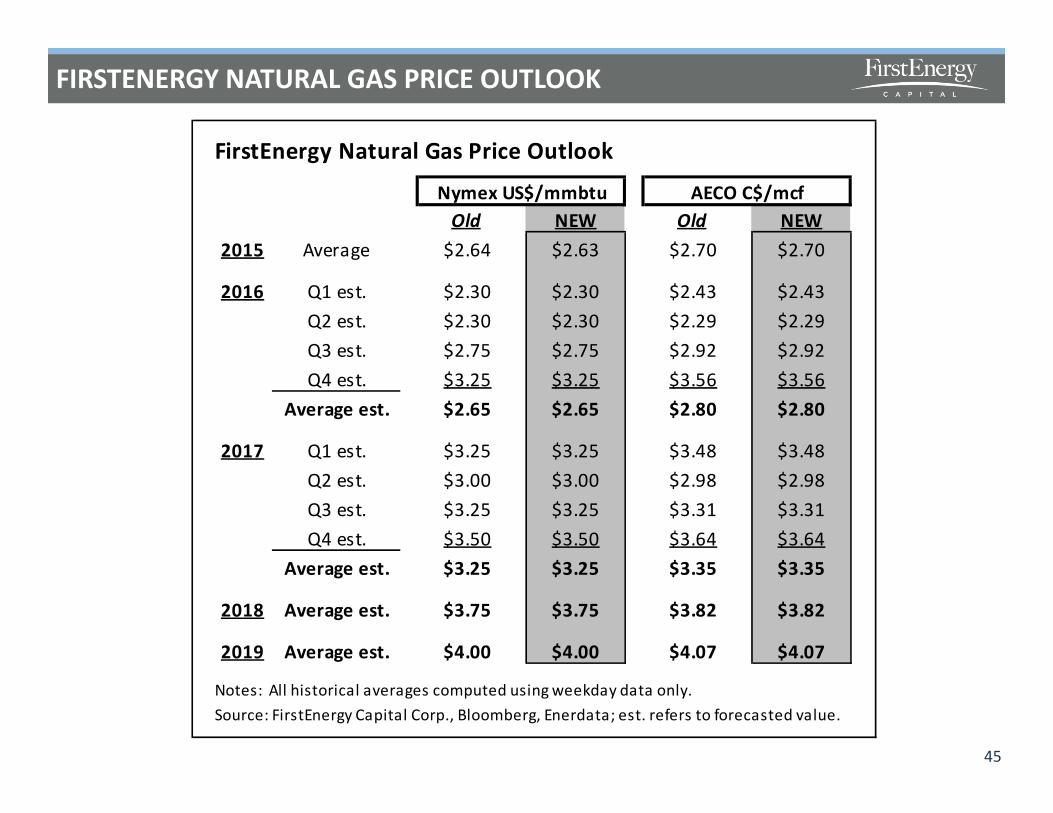
FirstEnergy Natural Gas Price Outlook
Nymex US$/mmbtu AECO C$/mcfOld NEW Old NEW
2015 Average $2.64 $2.63 $2.70 $2.70
2016 Q1 est. $2.30 $2.30 $2.43 $2.43Q2 est. $2.30 $2.30 $2.29 $2.29Q3 est. $2.75 $2.75 $2.92 $2.92Q4 est. $3.25 $3.25 $3.56 $3.56
Average est. $2.65 $2.65 $2.80 $2.80
2017 Q1 est. $3.25 $3.25 $3.48 $3.48Q2 est. $3.00 $3.00 $2.98 $2.98Q3 est. $3.25 $3.25 $3.31 $3.31Q4 est. $3.50 $3.50 $3.64 $3.64
Average est. $3.25 $3.25 $3.35 $3.35
2018 Average est. $3.75 $3.75 $3.82 $3.82
2019 Average est. $4.00 $4.00 $4.07 $4.07
Notes: All historical averages computed using weekday data only.Source: FirstEnergy Capital Corp., Bloomberg, Enerdata; est. refers to forecasted value.

Thank Youand
Questions??