World Bank Document · PDF fileCompletion Report on India Railway Modernization and...
44
Document of The World Bank FOR OFFICIAL USE ONLY Report No. 9455-IN PROJECT COMPLETION REPORT INDIA RAILWAYMODERNIZATION AND MAINTENANCE PROJECT II (LOAN 2210-IN/CREDIT 1299-IN) MARCH 22, 1991 Transportand Energy Operations Division Country Department IV Asia Region Thi-s document has a restricteddistribution and may be used by recipients only in the performance of l ~~~~their offcial duties. Its contents may not otherwise be disclosed withoutWorld Bank authorization. Public Disclosure Authorized Public Disclosure Authorized Public Disclosure Authorized Public Disclosure Authorized
Transcript of World Bank Document · PDF fileCompletion Report on India Railway Modernization and...
Document of
The World Bank
FOR OFFICIAL USE ONLY
Report No. 9455-IN
PROJECT COMPLETION REPORT
INDIA
RAILWAY MODERNIZATION AND MAINTENANCE PROJECT II(LOAN 2210-IN/CREDIT 1299-IN)
MARCH 22, 1991
Transport and Energy Operations DivisionCountry Department IVAsia Region
Thi-s document has a restricted distribution and may be used by recipients only in the performance ofl ~~~~their offcial duties. Its contents may not otherwise be disclosed without World Bank authorization.
Pub
lic D
iscl
osur
e A
utho
rized
Pub
lic D
iscl
osur
e A
utho
rized
Pub
lic D
iscl
osur
e A
utho
rized
Pub
lic D
iscl
osur
e A
utho
rized

CURRENCY EQUIVALENTS
Currency Unit = Rupees (Rs)US$1.00 = Rs 16.50Rs 1,000,000 = US$60.60
ABBREVIATIONS AND ACRONYMS
AC - Alternative CurrentBG - Broad GaugeDC - Direct CurrentDCW - Diesel Component Workshop-Patiala (Remanufacturing
Plant for Locomotive Components)IR - Indian Railwayskg - kilogramMG - Meter Gaugemm - millimeteroIS - Operations Information SystemUTS - Ultimate Tensile Strength
FISCAL YEAR OF BORROWER
Government of India: April 1 - March 31

THE WORLD SANK OB om YWashington. D.C. 20433
U.S.A.
Offict O D,ettv.C..wai
March 22, 1991
MEMORANDUM TO THE EXECUTIVE DIRECTORS AND THE PRESIDENT
SUBJECT: Project Completion Report on India Railway Modernizationand Maintenance Project II (Loan 2210-IN/Credit 1299-IN)
Attached, for information, is a copy of a report entitled 'ProjectCompletion Report on India Railway Modernization and Maintenance Project II (Loan2210-IN/Credit 1299-IN)" prepared by the Asia Regional Office with Part II of thereport contributed by the Borrower. No audit of this project has been made bythe Operations Evaluation Department at this time.
Attachment
IThis document has a restricted distribution and may be used by recipients onily in the performance of their official duties. Its contents rnay not otherwise be discobsed without World Bgank authorization.|

FOR OFFICIAL USE ONLY
RAILWAY MODERNIZATION AND MAINT NCE PROJECT II(LOAN 2210-IN/CREDIT 1299-IN)
MPOJECT COMPLETION REPORT
Table of Contents
Paxne No.
EVALUATION SUMMARY . . - ................. . i
I. PROJECT REVIEW FROM BANK'S PERSPECTIVE . . . . . . . . . 1Project Identity ................. 1Background . . . . . . . . . 1 . . . . . . . . . . IProject Objectives and Description . . . . . . . . 1Project Design and Organization . . . . . . . . . 2Project Implementation . . . . . . . . . . . . . . 4Project Results 7 . * . . . . . . . . . * . . . . 7Project Sustainability *.. .. . . . . .. . . . 11Bank Performance . . . . . . . . . . . . . . . . . 11Borrower Performance . . . . . . . . . . . . . . . 11Project Relationship . . . . . . . . . . . . . . . 12Consulting Services and Training . . . . . . . . . 12Project Documentation and Data . . . . . . . . . . 13
XI. PROJECT REVIEW FROM BORROwERS PERSPECTIVE . . . . . . . 14
III. STATISTICAL INFORMATION . . . . . . . . . . . . . . .T . 16Project Data . . . . . . . . . . . . . . . . . . . 16Related Bank Loan and/or Credits . . . . . . . . . 16Project Timetable .. ... . ................. 17Loan/Credit Disbursements . . . . . . . . . . . . 17Project Implementation . . . . . . . . . . . ... 18Project Costs and Financing . . . . . . . . . . 19Project Results #...... . 99999 20Status of Covenants . . . .. .. . . . . . . .. 22Use of Bank ResourcEs .* * . . . . . 23
ANNEXES . . . . . . . . . . . . . . . . . . . . . . . . . 241. Economic2. Indian Railways Performance Indicators3. Indian Railways Financial Statements
I This document has a restricted distribution and may be used by recipients onlY in the performanceof their official duties. Its contents may not otherwise be disclosed without World Bank authorization.
-1i-
INDIA
RAILWAY MODERNIZATION AND MAINTENANCL PROJECT II(LOAN 2210-INICREDIT 1299-IN)
PROJECT COMPLETION REPORT
Preface
This is the Project Completion Report (PCR) for the RailwayModernization and Maintenance Project II, for which Loan 2210-IN of US$20Omillion and Credit 1299-IN of SDR184.7 million (equivalent to US$200 millionat the time of Board approval) were approved on November 16, 1982. Theclosing date was extended twice to September 30, 1989, two years behindschedule. The Loan and Credit Accounts were closed on May 31, 1990 afterbeing fully disbursed.
The Evaluation Summary and Parts I and III were jointly preparedby the India Transport and Energy Division (AS4TE) and the InfrastructureDivision, Asia Technical Department, (ASTIN). The Beneficiary, Part II, wasprepared by the Indian Railways (IR).
Preparation had begun in September 1989 and was based on the StaffAppraisal Report, the Loan and Credit agreements, the supervision reports,correspondence between the Bank and the Beneficiary, and internal Bankmemoranda.

- ii -
INDIA
RAILWAY MODERNIZATION AND MAINTENANCE PROJECT II(LOAN 2210-IN/CREDIT 1299-IN)
PROJECT COMPLETION REPORT
Evaluation Summar,
Obiectives
1. The objectives were to modernize and improve diesel electriclocomotive maintenance and reliability, improve the tecthology and performanceof the mainline alternative current (AC) electric locomotive, and improve theoperational efficiency of heavy bulk freight movements.
Implementation Experience
2. There were five project components:
(a) locomotive and rolling stock maintenance improvement, includingestablishment of a diesel component workshop (DCW) at Patiala inthe State of Punjab and acquisition of parts and components for aunit exchange maintenance system;
(b) acquisition and testing of modern AC electric locomotiveprototypes, to provide the basis for a new locomotive design;
(c) construction of high capacity wagons for bulk traffic, using a newdesign based on tests of modern bogie prototype'- V
(d) test eguipment, technical assistance, and trair ag for DCV; and
(e) test equipment, technical assistance, and training for bogie testsand other studies.
3. At the outset, negotiations were delayed over a year, mainlybecause of the Borrower's failure to make satisfactory progress inimplementing an operations information system (OIS). The project becameeffective five months after negotiations (para. 4.4). Implementation requiredtwo extensions, resulting in a total of seven years from negotiations toclosing.
4. At closing, DCW-Patiala (except for the locomotive remanufacturingfacility) was fully operational. All parts and components for the unitexchange maintenance system had been acquired except for a small number of
3/ A bogie comprises the wheels, axles, and frame that support each end ofthe wagon. The tests were intended to replace the existing CASNUBbogie with one which was lighter weight and less rigid.
X iii -
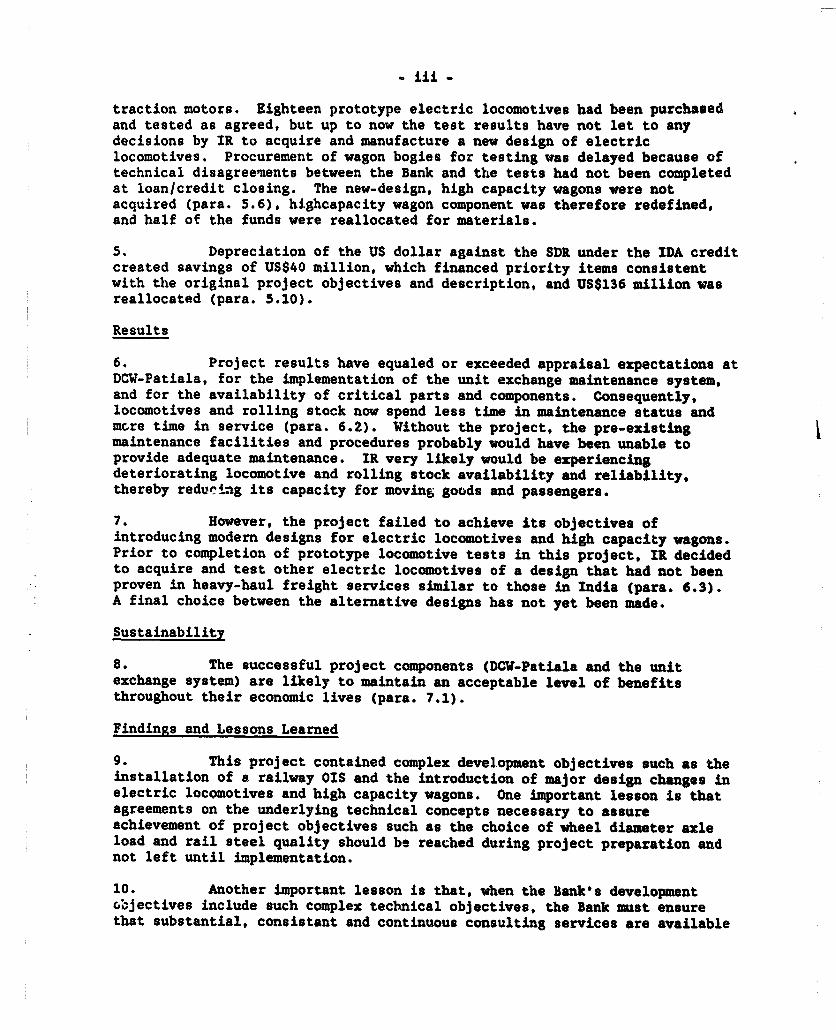
traction motors. Eighteen prototype electric locomotives had been purchasedand tested as agreed, but up to now the test results have not let to anydecisions by IR to acquire and manufacture a new design of electriclocomotives. Procurement of wagon bogies for testing was delayed because oftechnical disagreements between the Bank and the tests had not been completedat loan/credit closing. The new-design, high capacity wagons were notacquired (para. 5.6), highcapacity wagon component was therefore redefined,and half of the funds were reallocated for materials.
5. Depreciation of the US dollar against the SDR under the IDA creditcreated savings of US$40 million, which financed priority items consistentwith the original project objectives and description, and US$136 million wasreallocated (para. 5.10).
Results
6. Project results have equaled or exceeded appraisal expectations atDCW-Patiala, for the implementation of the unit exchange maintenance system,and for the availability of critical parts and components. Consequently,locomotives and rolling stock now spend less time in maintenance status andmc,re time in service (para. 6.2). Without the project, the pre-existingmaintenance facilities and procedures probably would have been unable toprovide adequate maintenance. IR very likely would be experiencingdeteriorating locomotive and rolling stock availability and reliability,thereby reducing its capacity for moving goods and passengers.
7. However, the project failed to achieve its objectives ofintroducing modern designs for electric locomotives and high capacity wagons.Prior to completion of prototype locomotive tests in this project, IR decidedto acquire and test other electric locomotives of a design that had not beenproven in heavy-haul freight services similar to those in India (para. 6.3).A final choice between the alternative designs has not yet been made.
Sustainability
8. The successful project components (DCW-Patiala and the unitexchange system) are likely to maintain an acceptable level of benefitsthroughout their economic lives (para. 7.1).
Findings and Lessons Learned
9. This project contained complex development objectives such as theinstallation of a railway OIS and the introduction of major design changes inelectric locomotives and high capacity wagons. One important lesson is thatagreements on the underlying technical concepts necessary to assureachievement of project objectives such as the choice of wheel diameter axleload and rail steel quality should be reached during project preparation andnot left until implementation.
10. Another important lesson is that, when the hank's developmentobjectives include such complex technical objectives, the Bank must ensurethat substantial, consistant and continuous consulting services are available
- iv -
during project implamentation both to IR and to the Benk. In fact, theobjectives of improving IR's locomotive and rolling stock designs are evenmore !nportant today than they were ten years ago and therefore should beincluded in any future project for IR, but only provided agreement is reachedearly in project preparation on the proposed improvements in design oflocomotives and rolling stock.
-I -
INDIA
RAILWAY MODERNIZATION AND 14AINTENANCE PROJECT 1I(LOAN 2210-INICREDIT 1299-IN)
PROJECT COMPLETION RE)ORT
PART I: PROJECT REVIEW FROM BANK'S PERSPECTIm
Proiect Identity
P.7oject Name X Railway Modernization aud Maintenance Project IILoan/Credit Number s 2210-IN/1299-INRVP Unit s AsiaCountry s IndiaSector s TransportSubsector : Railways
Backaround
1.1 The Bank Group has supported the Indian Railways (IR) investmentprogram since 1949 with 17 operations totaling almost US$2.2 billion. Thefirst 13 operations had non-project specific formats and focused on financingpart of the foreign exchange requirements of IR's investment program. Theseoperations supported IR's foreign exchange requirements for the acquisition of(a) machinery and plant for IR manufacturing units; (b) materials, parts, andcomponents for manufacture of motive power and rolling stock; and (c)materials and equipment for line improvements and telecommuni-ations.
1.2 To better respond to IR's needs, there was a departure from thisformat in 1979 to more project specific operations, starting with the RailwayModernization and Maintenance Project (Credit 844-1N). That project supportedthe urgently needed rationalization and modernization of IR's workshops andthe establishment of a wheel and axle plant. Support for facilitiesrationalization and modernization continued under the recently closed RailwayModernization and Maintenance II Project (Loan 2210-IN/Credit 1299-IN), andunder the ongoing Railway Electrification and Workshop Modernization Project(Loan 2417-IN) and Railway Modernization III Project (2935-IN).
Proiect Obiectives and Description
1.3 The objectives of the Railway Modernization and Maintenance IIProject (Modernization II) were to modernize and improve diesel electriclocomotive maintenance and reliability, improve the technology and performanceof IR's mainline AC electric locomotive, and improve the operationalefficiency of IR's heavy bulk freight movements.
1.4 Modernization II included five project components:
(a) locomotive and rolling stock maintenance improvement, including:

-2-
(i) establishment of a diesel compone-it workshop (DCW) LS Patialain the State oi Punjab to reclaim parts and components andremanufacture diesel electric locomotives; and
(ii) acquisition of parts and components for a unit exchangemaintenance system, together with wheels and axles to meet aproduction shortfall within India;
(b) acauisition and testing of modern AC electric locomotive prototypesto provide the basis for adopting a new locomotive design to bemanufactured in India under license;
(c) construction of 11,300 high capacity wagons tor coal and other bulktraffic, incorporating corrosion resistent steel, roller bearings,and bogies of modern design based on tests of prototype wagonbogies financed by the project, in order to improve wagonreliability, reduce wear and tear on wheels and rail, and allow forfuture higher train speeds which would increase the line capacityof sections with very heavy traffic;
(d) test equipment, technical assistance, and training for DCW-Patiala;and
(e) test equipment, technical assistance, and training for bogie testsand other studies to conserve fuel and improve train operations.
Project Design and Organization
1.5 Identification and Appraisal. A project was identified in early1979, but an appraisal mission in June 1979 could not agree on the projectscope. A new project was identified in April 1980 and appraised in Januaryand February 1981, to be implemented in two phases:
(a) Phase I, which became this project, Modernization II, and involveda loan of US$200 million and a credit of SDR 184.7 million; and
(b) Phase II, which became the Railway Electrification and WorkshopModernization Project (Loan 2417-IN), and invol'ed a loan ofUS$685 million.
1.6 A third phase containing a project to support the installation ofan Operations Information System (OIS) was set aside. Ultimately, the Phase Iand II projects were appraised at a total cost of US$2,428 million, with atotal foreign exchange component of US$850 million and Bank support of US$585million. Both were complex and innovative projects. The conceptualfoundation for both projects was the introduction of new, proven technologiesinto aspects of the railway operation where there had been no sigaificanttechnological progress during the previous fifteen years or more. Both theBorrower and the Bank understood the concept and appeared to agree that thetime had come to act. However, initially there was considerable disagreementabout how to proceed with the locomottve and rolling stock modernization, andmost of all, with the installation of OIS.
-3-
1.7 Conditions for Negotiations. Modernization II originally wasscheduled for negotiations in June 1981, or t.) soon thereafter as satisfactoryprogress had been made in several areas. These included the following threewyhich were cited in the appraisal mission letter and made cor.ditions ofnegotiations:
(a) Development of OIS - For several years IR had been studyingproposals for installation of an OIS to provide an on-line, realtime computer based information system to control and monitor itsfreight and passenger operations. However, several Governmentministries and departments exercised some aspect of control overthe purchase of the necessar -omputing hardware and software andwere reluctant to approve the import of existing, proven equipmentand systems. Instead, they preferred to use the IR requirements asa catalyst and first example of a domestically based developmenteffort. However, the Bank believed that domestic development ofOIS would be costly, involve lengthy time delays, and presentexcessive technical risks. Thus the first condition ofnegotiations was that the Government would give assurances thatIndian licenses and approvals would be forthcoming for importingthe necessary computing hardware and software.
(b) Financial Performance - For seven of the nine years prior to 1980-81, IR failed to meet its dividend on capital-at-charge. Thesecond condition was that agreement would be reached between theGovernment and the Bank on a plan of action and timetable forimplementing key Railway Tariff Inquiry Committee recommendationsto improve IR's financial performance and effectiveness.
(c) Corporate Plan - IR had been developing a corporate plan limitedto its manufacturing facilities. The third condition was that IRwould provide the Bank a detailed timetable and terms of referencefor preparation of a comprehensive corporate plan.
1.8 Negotiations of Modernization II were delayed from June 1981 untilSeptember 1982 because of failure to meet the conditions. At negotiations, anunderstanding was reached on a plan of action for implementation of OIS andrelated telecommunications. There were no conditions of effectiveness forModernization II. Following Board approval on November 16, 1982,Modernization II became effective on February 23, 1983, five months afternegotiations.
1.9 The Bank insistence on stringent conditions to promote theintroduction of OAS required actions which were opposed to Government policiesfor indigenous development of information systems. This caused substantialdelays in project negotiations and loan effectiveness.
1.10 The wisdom of including the OIS conditions in the Modernization IIProject and later in the Electrification Project was affirmed in September,1989, when all Government and IR approvals were received to install OIS firston Northern Railway and in the future on the other zonal railways. Theapprovals to proceed with OIS came after a redesign of the original system
-4
configuration substantially redu-ed its cost. IR's successful implementationof an on line, real tin.? computerized passenger reservation system alsoencouraged the granting of approvals.
1.3.1 In retrospect, it would appear that the Bank, after taking sostrong a position in favor of OIS as conditions of negotiations andeffectiveness of the Modernization II and Electrification projects, shouldhave included the implementation of the first phase of the OIS as a projectcomponent.
1.12 Adequacy of Preparation. Modernization II was generally wellprepared. The site for the location of the remanufacturing plant for partsand components and locomotives at Patiala was selected at an early stage andlayouts including cost estimate of the plant were prepared in August 1980,well in advance of the appraisal mission in January 1981. The unit exchangeparts for diesel locomotives to be acquired under the project were broadlyidentified during project appraisal (although no parts were included forelectric locomotives). This was rectified during project implementation.Preparation of tender documents for procurement of the prototype AC electriclocomotives was well under way and so was a program for testing of thelocomotives, and the specifications were agreed during project negotiation.
1.13 The Bank assisted IR at an early stage with guidelines onprocurement of test bogies for the high capacity wagon component. However,because the Bank and IR took so long to agree on the wheel diameter and asleloads to be tested, the component as originally defined was rot implemented.This issue should have been identified and resolved during project Kpreparation.
Proiect Implementation
1.14 General. The project was implemented in the most satisfactorymanner and changes were made in project content to realize the objectives.Because of earlier Bank operations, IR was acquainted with Bank procedures andrequirements. Hence, it was expected that this project would be implementedsmoothly. However, preparation of tender documents, evaluation of bids, anddecisions on procurement of. prototype electric locomotives and test bogiestook more time than planned. Because of delays, the closing date was extendedby one year in May 1987 and by another year in June 1988, to September 1989.But during project implementation, project management procedures in IR werefurther improved, and follow-up projects should benefit from the improvements.
1.15 DCW-Patiala. At closing, the DCW-Patiala workshop was fullyoperational except for the locomotive remanufacturing facility, which will notreach its production target until after 1990. Construction of DCW startedwell, 'but civil disturbances and unreliable labor supply caused contractorsto fall behind schedule Suppliers of machinery and equipment had problemscommunicating with plant management and in finding service staff willing toinstall machinery and give satisfactory service after delivery. To completethe DaW component, its scope had to be scaled down, but completion wasnevertheless delayed by 24 months.
- 5 -
1.16 Unit Exchange. IR planned and implemented a satisfactory unitexchange maintenance system for diesel locomotives. It includes provision ofparts for unit exchange pools, develop'uent of adequate capacity forremanufacturing parts, logistical support for parts movement, and theorganization for monitoring and coordinating the system. The system is now inoperation and functioning satisfactorily, and at loan/credit closing allnecessary parts and components had been acquited except for a small number oftraction motors.
1.17 Electric Locomotives. Except for 405 kilometers around Bombaywhich are operated with 1,500 volts direct current (DC) power supply, thepower supply for IR's remaining 9,200 km of electrified lines is 25,000 voltsAC. The locomotive used in the Bombay area is a DC-DC electric locomotive (DCpower supply with DC traction motors), while the locomotive on the largernetwork is an AC-DC electric locomotive (AC power supply with DC tractionmotors).
1.18 Under the project objective to improve the technology andperformance of IR's mainline AC electric locomotive, 18 prototype AC-DCelectric locomotives were purchased. Finalization of bid documents for thelocomotives by IR took 17 months, bid evaluation took 18 months, and otherprocurement delays took 4 months. Despite an early start, the result was anoverall delay of more than a year in orderfing the locomotives. Thelocomotives finally were delivered in early 1988, at which time the testingstarted. Tests were completed in 1990, but so far there has been no decisionby IR to acquire and manufacture a new design of AC-DC electric locomotives.
1.19 The project failed to achieve its objectives of introducing moderndesigns of AC electric locomotives and high capacity bulk traffic wagons, evenafter lengthy, complex, and expensive tests of prototypes. Prior tocompletion of the prototype AC-DC electric locomotive tests in this project,IR decided to acquire and test AC-AC electric locomotives, a design that hasnot been proven in heavyhaul freight services similar to those in India.Nonetheless, the pro'2ct had a favorable technological impact on IR, since ithas contributed to introducing new technology in locomotive componentremanufacturing and maintenance. The project has had minor impacts on thephysical and social environment and on human resource development.
1.20 High Capacity Wagons and Test Bogies. Procurement of wagon testbogies was delayed by protracted discussions between the Bank and It on thetechnical specifications and their operational implications, and the testshave not been completed to date. The highcapacity wagon component thereforewas not implemented as intended, but redefined. Half of the funds werereallocated for procurement of critically needed materials, parts, andcomponents.
1.21 ZR's initial preparation of technical specificationb for the testbogies led to discussions with the Bank on the wheel size and axle load forthe bogies. To ultimately provide for move efficient operations, the Bankrequested IR to include tests of smaller diameter wheels (33 inch) than thoseused by IR (39 inches), as well as tests of a higher axle load (up to 30 tonscompared to the present 20 toiis on broad gauge).
6-
1.22 IR did not agree with the Bank, arguing that studies prepared inEurope by Union Internationale des Chemins-de-Fer and its research unit showedthat utilization of smaller wheels with 30 tons axle load created unacceptableshear stresses in the softer rail (72 kg/mm2 UTS) used in India. IR arguedthat railways using 33 inch wheels are using stronger rail (90 kg/mm2 UTS)which can better withstand the higher shear stresses. A compromise finallywas reached in which IR agreed to test bogies with medium size wheels (36 inchdiameter). The preparation of tender documents for the procurement of testbogies lasted 51 months, and bid evaluation and contracting took 12 months.In retrospect, the Bank's technical position was correct, but greaterconsideration should have been giv¢n to the constraints which prevented IRfrom introducing large diameter wheels and high tensile wheel rails at thepace envisaged by the Bank. Had the compromise been reached earlier, the Bankwould have had the opportunity to be more involved in the review of the testresults.
1.23 Efforts by the Bank to encourage IR to adopt maller wheeldiameters and higher axle loads have had some success. In 1989, IR decided toallow 33 inch wheels for low axle load container wagons. Also in 1989, IRidentified a number of lines on which it intends to operate with axle loads of22 tons. Track standards on these lines have been changed to requireinstallation of 90 kglmm2 UTS rail and other improved components.
1.24 Final Allocation of Funds. During implementation, a review of theparts requirements for the unit exchaige maintenance system showed that Bankfunds originally allocated were insufficient. IR also requested the Bank tofinance more wheels and axles. A total of US$136 million was thereforereallocated, including US$40 million project savings due to the depreciationof the US dollar against the SDR under the IDA credit, US$16 million from thereduced scope of the DCW component, and US$75 million from the cancellation ofthe planned bulk supply of bogies in the high capacity wagon component. Thereallocation of credit and loan funds is summarized by the comparison ofactual disbursements with appraisal estimates in the table below (additionaldetails are shown in Part I1I, page 19, Project Costs and Project Financing).

mHul IIg U 0.. for IVal,t
Amnraisal Estlmate Actual Oisburem_nts
Totel To S. Paid Total PaldProject From Loan A Project From Loan &Cost Credit Cost Credit Dlfternes
DCW-Patiala 119 as 5 89 (16)
Unit ExchangeParts 283 88 68 164 82Wheels & Axles 246 so 219 91 as
AC ElectricLocomotives 87 45 97 64 19
High CapacityWagons 608 J 268 70 t7)
TA & Training 16 20 8 (5)
OtherF 8 3 8 3 0Exchang Rate 0 0 4 4 4Adjustment
TOTAL In USI 1.216 400 1.264 "44 44
Prolect Results
1.25 The overall economic return of the project was estimated at 241 atproject appraisal, with economic rates of return of 22Z for DCW, 23Z for theunit exchange maintenance system, and 301 for the high capacity wagoncomponent. No economic evaluation was made for the electric locomotives, thetest bogies, and the training and technical assistance components.
1.26 The nature of the project is such that an economic reevaluation atthis time is tentative, since many project benefits are just now starting toappear. However, project results have equaled or exceeded appraisalexpectations at DCW-Patiala, for the implementation of the unit exchangemaintenance system, and in the availability of critical parts and components.Consequently, locomotives and rolling stock now spend less time in maintenancestatus and more time in service. Without the project, the pre-existingmaintenance facilities and procedures probably would have been unable toprovide adequate maintenance. IR very likely would be experiencingdeteriorating locomotive and rolling stock availability and reliability,thereby reducing the its capacity for moving goods and passengers.
1.27 Economic Impact. As noted in para. 1.4, the project consisted offour specific components for improving the design and maintenance oflocomotives and rolling stock, along with a technical assistance and stafftraining component. The specific components were: (i) the establishment andoperation of DCW; (ii) the procurement of parts and components for a unit
-~ ~ ~ ~ ~ ~ ~ 8
exchange maintenance system; (iii) the acquisition of components andmaterials for construction of high capacity wagons for bulk traffic; and(iv) the acquisition and testing of modern AC locomotive prototypes.
1.28 The appraisal evaluation included individual assessments of thebenefits from components (i), (ii), and (iii) above (including relatedtechnical assistance), which accounted for about 93 Z of total project costsestimated at appraisal. No separate economic evaluation was carried out foritem (iv) above, although the cost of this item was included in an overallevaluation without counting any separate benefits.
1.29 DCW. At appraisal, this component was expected to yield aneconomic return of 242 (para. 4.06 and Annex E of Report No. 3431-IN) with thebenefits being derived from the difference in the CIP value of equivalentimported parts and components and the estimated production cost of the newfacility for equivalent parts and components. The import cost ofremanufactured locomotives was taken as 702 of the border price of new ones.
1.30 The economic reevaluation is based on actual investment costs,including the cost of technical assistance, adjusted to 1989190 prices andexcluding taxes and duties (estimated at 152). In addition to totalproduction costs for the years 1986/87 through 1989/90 and estimates for1990/91 through 1992/93 (when full production will be reached), IR providedunit costs of production, including overhead, for the main components andsubassemblies manufactured in the DCW, as well as major remanufactured items,including locomotives. IR also provided comparable import costs for abouthalf of these items. This was complemented by recent Indian trade costs fromsuppliers and prices or quotations available in the Bank. The items coveredrepresented about two-thirds of the production cost in 1989/90 and about 802of the estimated production cost in 1991/92. The re-estimated rate of returnis 212 (Annex 1, Table 1) as compared with 24? at appraisal. The marginallylower rate of return is due largely to the longer construction period, slowerbuildup of production and higher investment cost partly compensated byincreased benefits.
1.31 Unit Exchange System. At appraisal this component was estimated toyield a rate of return of 232 with the benefits accruing from (i) reducedmaintenance time of locomotives and rolling stock; (ii) increased reliabilityof motive power; and (iii) better utilization of rolling stock. Locomotiveavailability was estimated to improve by two days per month and utilization by12 while the rollitg stock availability was estimated to improve by one dayper month and utilization by 42.
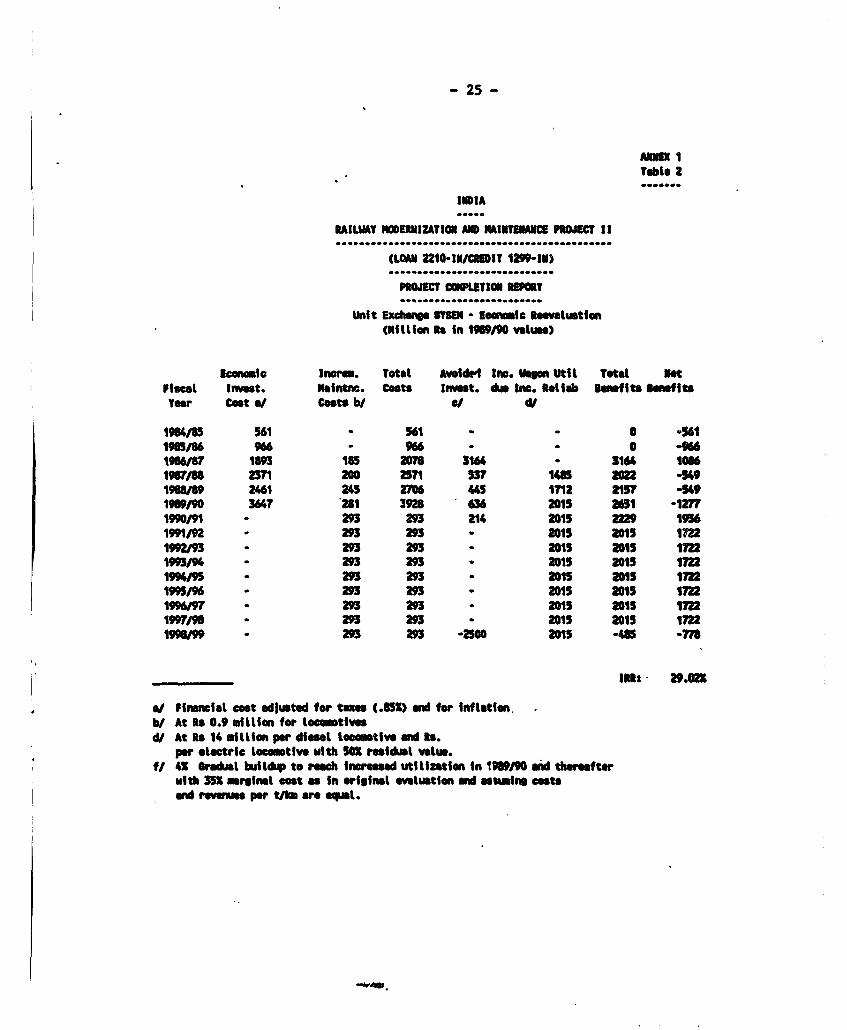
1.32 The economic reevaluation is based on updated costs and the samebroad benefits, but with a slightly modified approach as far as (i) isconcerned. Instead of using incremental output as the benefit, avoidedinvestment in additional locomotives and rolling stock were used based onreduced out-of-service rates for diesel locomotives and electric locomotives.The share of these benefits attributable to the unit exchange system has beenestimated at 602. As indicated in Annex 1, Table 2, the reevaluated rate ofreturn is 29Z. The somewhat higher rate of return is due to greater than
expected performance improvements, of which only a part has been attributed tothe unit exchange system.
1.33 High Capacity Wagons. The appraisal rate of return estimate forthis component was 23? with the main benefits arising from expzcted savings inmineral transport costs from the new high capacity wagons with faster turn-around using unit trains.
1.34 IR cost data do not provide separate cost estimates by type ofwagon used, nor an exact determination of the share of the total high capacitywagons financed under the project as compared with the number of high capacitywagons acquired during the period. A rough reevaluation of this component wastherefore made bys (i) estimating the number of high capacity wagons financed;(ii) updat'ng the 1981 estimated cost savings per ton km. for high capacityand regular wagons to 1989190 prices, assuming that only 75? of the estimatedunit benefits were actually achieved. Based on the above key assumptions thereevaluated rate of return for this component would be 20Z, as compared withat least 23Z at appraisal.
1.35 The re-evaluated overall rate of return for the project, includingcomponents for which no benefits were quantified, is 192, which indicates thatthe project can be expected to yield substantial economic benefits.
1.36 Financial Impact. As per the Agreement, GOI was to maintainpassenger fares and freight rates and take all other actions necessary, so asto provide to the Railways revenues sufficient to enable it to meet out ofinternally generated resources all operating expenses (including appropriationto the Depreciation Reserve Fund (DRF)), and dividend on capital at charge.It was also agreed that appropriation to the DRF would be at least Re. 10.3billion in the aggregate for FY84 and FY85. GOI has complied in essence withits commitment. IR had a positive net result in all years except 1985. Itexceeded the targeted Rs 10.3 billion appropriation to the DRF in FY 84 and FY85 together by Rs 6.7 billion, but had a negative net result of Rs 2.5 billionin FY 85. Had GOI strictly adhered to the agreed Rs 10.3 billion appropriationto the DRE, it would have had a positive net result of about Rs 1 billion inFY 85.
1.37 IR's actual and projected financial statements are presented inAnnex 2, pages 1 to 4. The most salient features of IR's operations during the1981 to 1990 period are: (i) IR's failure to capture or pass on to consumersat least part of the significant increase in the railway overall physicalproductivity; (ii) IR's substantial modernization effort reflected in thehigher level capital investment; (iii) the change in IR's resourcemobilization policy reflected in the increase in it's self-financing rate; and.(iv) the resulting significant tariff increase in real terms.
1.38 IR's overall productivity improvement is reflected in the 3.5?p.a. increase in Traffic Units (TU) per employee and in other physicalproductivity indicators (Annex 3). However, the corresponding surplusgenerated has been fully appropriated by IR's employees; IR's wage bill, whichrepresent about 60? of working expenses, increased by 16.2? p.a. (6.6? in realterms) with a nearly constant labor force. This increase was only partly

- 10 -
compensated by the labor productivity increase, and the increase in theproductivity of other production factors (including fuel efficiency), andultimately resulted in real tariff increases.
1.39 The modernization effort is reflected in the rapid increase of IR'scapital investment, which was Rs 9.4 billion in FY 81, and Rs 30.3 billion inFY 89, a 6.11 p.a. increase in real terms. This was achieved withoutsignificant extension of the railway network, mainly through accelerated trackrenewal and transport capacity investments.
1.40 At the time of Project appraisal, the annual appropriation to theDepreciation Reserve Fund (DRF), which represent IR's provision fordepreciationlreplacement of fixed assets and self-financing effort, was only31 of gross fixed assets; as agreed under the Project, this provision wasraised, and reached 9Z of gross fixed assets in 1985 and thereafter, which isremarkably high for a railway, as the economic life of most of the fixedassets is between 20 and 40 years. However, it is because of the increasingappropriation to the DRF (increasing from Rs 2.3 billion in FY 81 to Rs 17.1billion in FY 90) that IR has raised its self-financing rate from 25Z ofcapital investment in FY 81 to about 5OZ in FY 90, whi':h constitute a goodperformance by international standards.
1.41 The increasing claims on railway revenues to meet salary increasesand investment self-financing requirements required that tariffs be revisedupward. Tariff increases affected both passenger and freight traffic, thoujghit was higher for the latter. The average passenger tariff increase was 10.92p.a. (1.72 p.a in real terms), and the freight tariff increase was 12.72 p.a.(3.3Z p.a in real terms). Ongoing tariffs fully cover marginal costs oftransport. However, there is an element of cross-subsidization betweenfreight and passengers, as freight tariffs exceed the average transport cost,while passenger tariffs do not cover the full average cost. The lesserincreases of passenger tariff have accentuated traffic cross-subsidization.
1.42 IR's actual financial performance, compared to the projectionsprepared during project preparation, indicate that significant effort was madeto enforce financial discipline in the railway; the annual net result has beenkept slightly positive in the long term; and the investment effort has beenaccompanied by a substantial effort to increase the self-financing rate.However, the projections did not anticipate the large wage bill increase andunderestimated the railway's investrment requirements. The projected realtariff increase was therefore significantly smaller than the actualadjustments.
1.43 It is uncertain whether IR will be able to continue to increasereal tariffs to finance salary increases and transfer some of the financialburden of investment financing from the Government to rail users withoutrunning the risk of losing a substantial share of passenger traffic andfreight 'other than coal and ponderous bulk) to roads. To avoid further realtariff increases, IR will need to enforce better labor cost control measuresthrough manpower planning, and to improve investment planning to avoid therecurrence of considerable backlog in track renewal and replacement of rollingstock.

- 11 -
Proiect Sustainability
1.44 The sustainability of DCW-Patiala is practically assured, in viewof its demonstrated ability to meet production and quality goals.Sustainability of the unit exchange maintenance system will depend oncontinued provision of necessary funds to replace worn out unit exchange partsand components, in order to maintain unit exchange parts pools. So far asthere are operational benefits from use of the prototype tC electriclocomotives, these benefits also are likely to be sustained.
Bank Performance
1.45 A project of this magnitude and complexity must be flexible andallow for modifications during project implementation. For reasons mentionedabove (para. 1.24), the scope of some components was changed and funds werereallocated in a timely manner to avoid additional implementation dlelays.
1.46 This project contained complex development objectives such as theinstallation of OIS and the introduction of major design changes in electriclocomotives and high capacity wagons. One important lesson is that agreementson the underlying technical concepts which are required to assure achievementof project objectives should be reached during project preparation and notleft until implementation. As it happened, the Bank unnecessarily delayedpioject implementation by its rigid position on wheel size and axle loads forthe bogie tests.
1.47 Another important lesson is that, vhen the Bank's developmentobjectives include such complex technical objectives, the Bank must make useof substantial consulting services in implementation. Alternatively, the Bankitself would have to take the responsibility for assuming a strong technicalassistance role if these objectives are to be achieved. In fact, theobjectives of improving IR's locomotive and rolling stock designs are evenmore important today than they were ten years ago and therefore should beincluded in any future project fcr IR, but only provided agreement is reachedearly in project preparation on the proposed improvements in design oflocomotives and rolling stock.
Borrower Performance
1.48 The Borrower has been in compliance with all principal covenantsexcept for the one affected by the delay in completion of DCW. The Borrowerhas prepared timely quarterly reports as required in the loan documents andalso has prepared useful reports for supervision missions.
1.49 After 40 years of cooperation, IR was well acquainted with Bankprocedures, and procurement was expected to be smoother than it was. Ananalysis made during project supervision of the lead tiL for procurement ofgoods indicated that more time was being taken for identification of goods,preparation and evaluation of tenders, and requests for disbursement than wasestimated at appraisal. Bid evaluation took 5 to 10 months, preparation ofcontracts took 3 to 8 months, and requests for disbursements took 6 months.
- 12 -
1.50 One reason for this poor performance was frequent turnover of staffin critical positions. New staff invariably had different views on technicalmatters, and frequently the preparation and studies underlying previousdecisions had to be redone. To ensure efficient implementation, the mostcritical positions are those of Advisor, Planning and his principal assistant;but each of theve positions was occupied by six different persons during theproject period. Other critical positions with high turnover were the posi-tions of Advisors for Mechanical Engineering, Civil Engineering, and Traction,all important in decisions on technical matters underlying the procurement ofgoods and the introduction of new technology.
Project Relationship
1.51 The relationship between IR and the Bank is a long standing one.It goes back to the early 1950s. It continues to be generally satisfa_tory,although some tension developed during the discussions on wagon wheel size.IR cooperated fully in keeping the rationale for their selection of largerwheels. IR is well acquainted with the Bank procurement and disbursementsprocedures, and no significant tension arese from procurement related issues.The decision to reallocate funds amongst ca:egories was taken in agreementbetween IR and the Bank. In the later years of project implementation, IRtook significant action to improve the organization of their disbursementdepartment to accelerate project disbursements at the Bank's request.
Consulting Services
1.52 The Project included US$20.5 million for training and technicalassistance. This component included training for DCW staff; training fortrain operation and fuel efficient train driving techniques; and technicalassistance for bogie testing.
1.53 From the US$20.5 million, only about 8 million were used asinitially envisaged. The reduction in this project component was due mainlyto the late start of the bogie testing program and the dropping of the train |driving component.
1.54 Training for DCW staff included 2045 staff-months of training, ofwhich 114 abroad. The actual program started late due to the delay in thephysical implementation of this project component. By the loan/credit closingdate, 375 staff had been trained locally, and 146 had received trainingabroad. This component hasbeen successfully implemented broadly as initiallyplanned and has served the intended purpose.
1.55 Technical assistance for bogie testing was also delayed and wasstill ongoing at closing date. The success of this component cannot beassessed at this point of time.
1.56 Training for train operation and fuel efficient train driving hasbeen dropped from the project and was not implemented.
1.57 The parts of the training and technical assistance programs whichhave not been completed by closing date are being considered for financing by
- 13 -
IR, or, as far as possible, by the Bank under the ongoing RailwayElectrification Project.
Proiect Documentation and Data
1.58 Documentation on project implementation was well kept, inaccordance with Bank requirements in this respect, which are well understoodand adhered to by IR for many years. Periodical project implementationreports were prepared in accordance with agreed reporting requirements. Inaddition, the Bank received the support of a local consultant who ensures thatthe necessary documentation was prepared on time for each of the supervisionmissions from 1987 onward.
1.59 All necessary data on IR's operations were made available to theBank, as well as data on Project implementation. The only identifiedshortcoming was with the record of the comparative availability andoperational performance of wagons and locomotives maintained under theproject, compared to the other units. The absence of systematic record inthis respect required that a specific survey be conducted for the collectionof some of the data necessary for the evaluation of the economic impact of theproject.
1.60 Project accounts were well maintained and audited. Audit reportson Project accounts were presented in a timely manner, as part of thefinancial control accounts were not subjected to a separate audit, as thefinancial controls of the Ministry of Finances and the report on IR's financespresented annually to the parliament fulfill the Bank requirements.

- 14 -
PART IIs PROJECT REVIEW FROM BORROWER'S PERSPECTIVE
2.1 The project has served its intended purpose. The project helpedIndian Railways (a) to set up a plant for manufacture/remanufacture ofcomponents for diesel locomotives and rebuilding of locomotives; (b) enabledthe Indian Railways to switch over to the unit exchange system of maintenancefor diesel locomotives; (c) introduced into the system electric locomotives ofmodern design based on the state of art; and (d) upgraded freight rollingstock.
2.2 Diesel Component Works, Patiala (DCW) is making assemblies andsubassemblies. The plant has also commenced rebuilding of locomotives. Theplant has already reached a level of rebuilding of 2 locomotives per month,which is expected to increase to 6 locomotives per month by 1991/92 Thelocomotives are rebuilt to new standards, and as the cost of rebuildinglocomotives is about 502 of the cost of the new locomotives or a little more,the plant has helped make significant economies.
2.3 Introduction of unit exchange system of maintenance for locomotiveshas significantly contributed to the increased availability and reliability ofdiesel locomotives. Ineffective percentage of diesel locomotives, both onBroad Gauge (BG) and Metre Gauge (MG), has declined over the years. Thisdropped on BG from 18.22 in 1985/86 to 11.1 in 1986/87, 10.42 in 1987188, 102in 1988/89 and 9.3Z in 1989/90. Corresponding figures for MG were 17.5?,11.52, 10.5Z, 10.82, and 9.42.
2.4 Similarly, reliability of BG diesel locomotives has improved.Kilometers per engine failure improved from 90,297 in 1985/86 to 95,746 in1986/87, 95,957 in 1987/88, 104,857 in 1988/89, and 109,628 in 1989/90.Corresponding MG figures were 77,120, 72,343, 85,602, 96,941, and 106,296.
2.5 The availability of electric locomotives improved from about84-852 in the years 1982-1986 to 902 in 1987/88.
2.6 Introduction of high capacity wagons (BOX-N and BCN types) was themost important factor which made it possible for the Indian Railways to copewith the increased demand for freight traff':. The Seventh Five Year Planwitnessed an increase of 70 million tons in originating tonnage and about 55billion ton kilometers in freight transport output; increases of this orderwere registered in the past over a period of 15 to 20 years. The new freightstock, being sturdier, was very reliable; and there were fewer detachments ofsick or crippled wagons enroute. The turnaround of these wagons, though notbeing estimated separately, is significantly lower than the turnaround for thefreight stock as a whole. The gross trailing load of freight trains alsoimproved significantly.
2.7 The pace of implementation of the project was, by and large,satisfactory, except that procurement of bogies for freight stock was delayedfor quite some time because of the Bank's insistence on adoption of a smallerd5.meter wheel. Indian Railways had made a thorough study of the questionincluding a detailed techno-economic evaluation of the reduction in the wheel

- 15 -
size from 39 inches to 33 inches, but it took some time to convince the Bank'sexperts to agree to the IR's considered views on the question. As the IndianRailways did not wish to be saddled with a large number of bogies of differentmakes and design, the number of bogies to be procured for test and trial hadto be limited; and, to avoid shortfall in the utilization of the loan, savingsfrom the bogie segment of the loan were utilized for procurement of componentsof electric locomotives.
2.8 The progress of the Diesel Component Works, Patiala, consideringthe disturbed conditions in the State of Punjab where it is located, could notbe considered unsatisfactory. The contractors had difficulty in progressingthe work due to unreliable labor supply on account of civil disturbances; andfor the same reasons, suppliers of machinery and plant had problems inlocating staff willing to install machinery and plant. Despite thesedifficulties, the production in most of the shops commenced almost on or alittle behind schedule. The plant is soon expected to achieve production andremanufacture of parts and components at 901 of its gross rated capacity.
2.9 The procurement of electric locomotives took a little longer thananticipated mainly because the Railways i.. .ided to procure locomotives basedon the state of the art. Railways had to be rnturally cautious in theselection of the locomotive as the locomotive selected would be meeting thelong term requirement. The locomotive had to be suitable for Indianconditions. In fact, to ensure that an appropriate locomotive was selected,the draft specifications were even referred to the potential suppliers. Theexamination of the relevant factors and finalization of the bid documents andevaluation of bids naturally took time. In passing, it may be mentioned thatof the 17 months taken for finalization of bid documents, some time was spentin consultations with the Bank; for example, about 2 112 months were taken ingetting Bank's approval for negotiations with suppliers.
2.10 One reason for the increase in the cost of locomotives was therevision in the exchange rate. For instance, at the time of placing of thecontract, the dollar value of the price in yen at which the order was placedon the Japanese firm was equivalent to US$21.7 million. The actual value indollars by the time the disbursement was made came to US$40.73 million, i.e.,$19 million higher at the original yen value.
2.11 It would be wrong to attribute the delay in procurement to frequentturnover of staff. The Railways fully recognize the need for continuity, butchanges made were unavoidable in the context of personnel policies of theRailways.
2.12 The supervisory mission helped the implementing agencies in a bigway to sort out problems and other related issues, but these purposes would beserved still better if the missions are spaced uniformly at slightly longerintervals.

- 16 -
PART IIIt SATITSTICAL INFORMATION
Proiect Data
RVP Unit AsiaSector TransportSubsector RailwaysBorroinr Government of IndiaExecuting Agency Indian RailwaysFiscal Year of Borrower April 1 - March 3i
Related Bank Loans andlor Credits
Ln/Cr. Title Purpose Approved Status
Cr. 844-IN Railway Moderni- Workshop modernixa- 1978 Completedzation and tion and constru-Maintenance ction of wheel andaxle plant
Cr. 2417-IN Railway Electri- Electrification of 1984 Activefication and key routes andWorkshop Modern- modernization ofization additional
workshops
Cr. 2935-IN Railway Modern- Modernization of 1988 Activeization III track structure oncore network
-17 -
Project Timetable
Date Date DateItem Planned Revised Actual
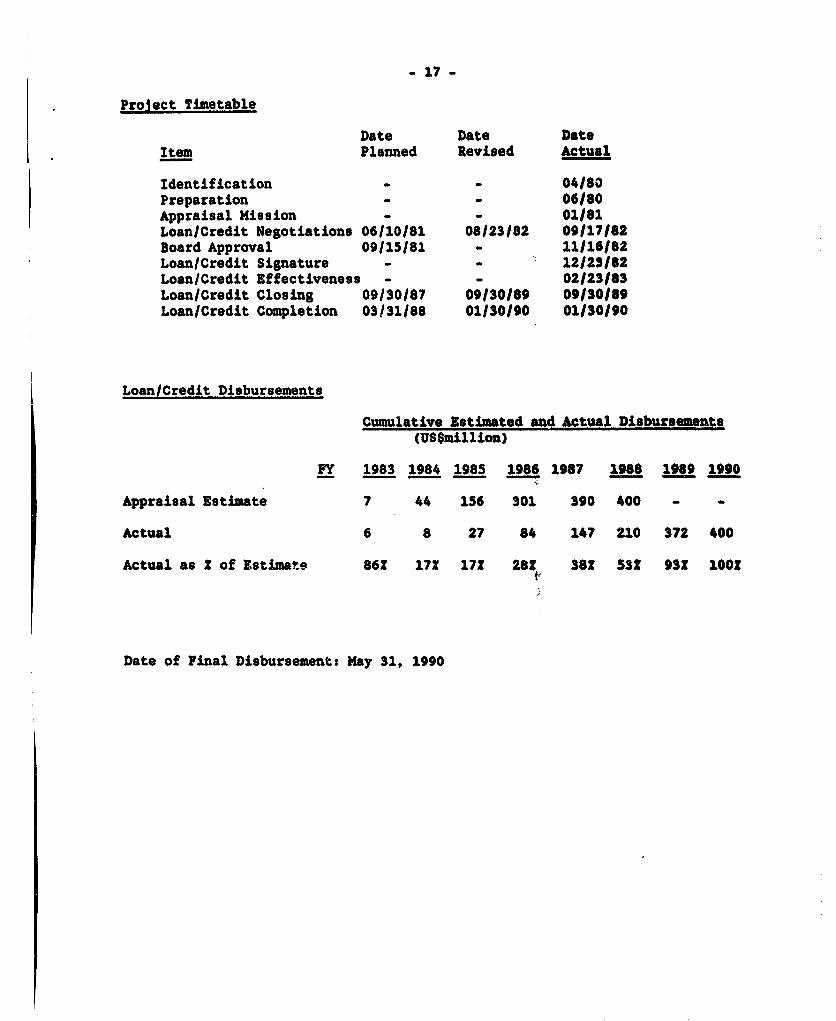
Identification - - 04/80Preparation - - 06/80Appraisal Mission - - 01/81Loan/Credit Negotiations 06/10/81 08/23/82 09/17/82Board Approval 09/15/81 - 11/16/82Loan/Credit Signature - 12/23/82Loan/Credit Effectiveness - - 02/23/83Loan/Credit Closing 09/30/87 09/30/89 09/30/89Loan/Credit Completion 03131/88 01/30/90 01/30/90
Loan/Credit Disbursements
Cumulative Estimated and Actual Disbursements(US$million)
FY 1983 1984 1985 1986 1987 1988 1989 1990
Appraisal Estimate 7 44 156 301 390 400 - -
Actual 6 8 27 84 147 210 372 400
Actual as Z of Estimate 861 17Z 172 28Z 382 532 932 1002
Date of Final Disbursement: May 31, 1990
- 18 -
Prosect Implementation
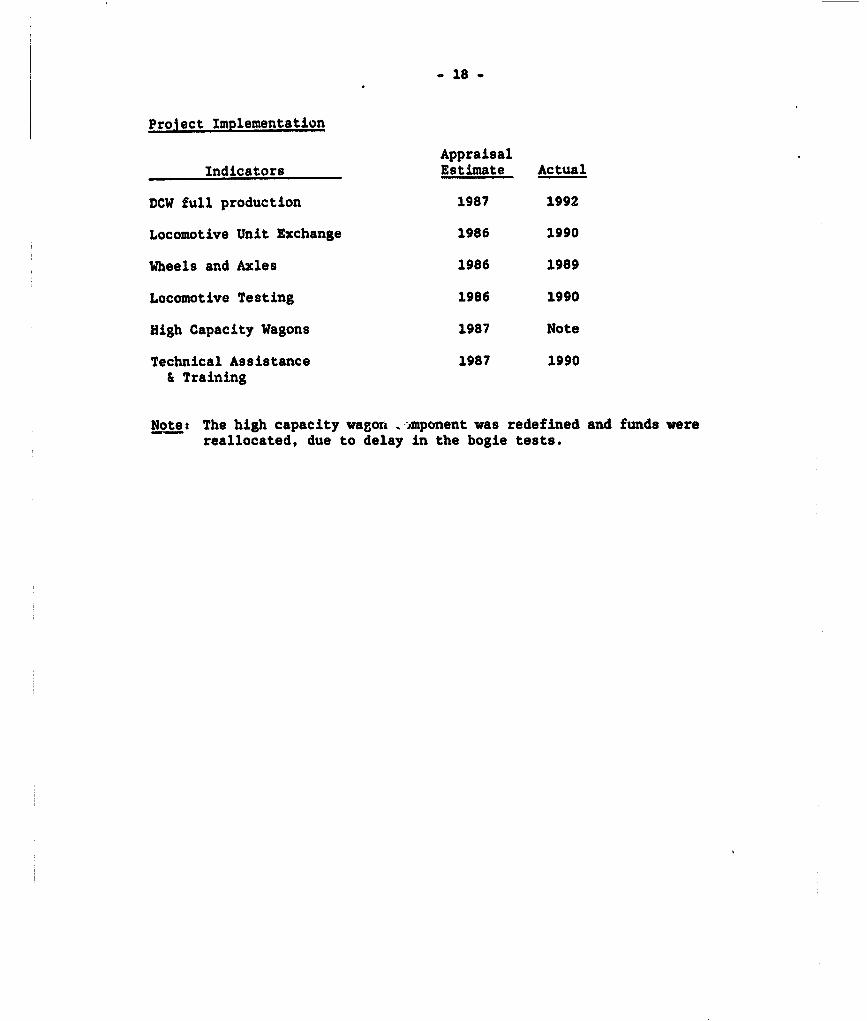
AppraisalIndicators Estimate Actual
DCW full production 1987 1992
Locomotive Unit Exchange 1986 1990
Wheels and Axles 1986 1989
Locomotive Testing 1986 1990
High Capacity Wagons 1987 Note
Technical Assistance 1987 1990& Training
Note: The high capacity wagorL -nponent was redefined and funds werereallocated, due to delay in the bogie tests.
- 19 -
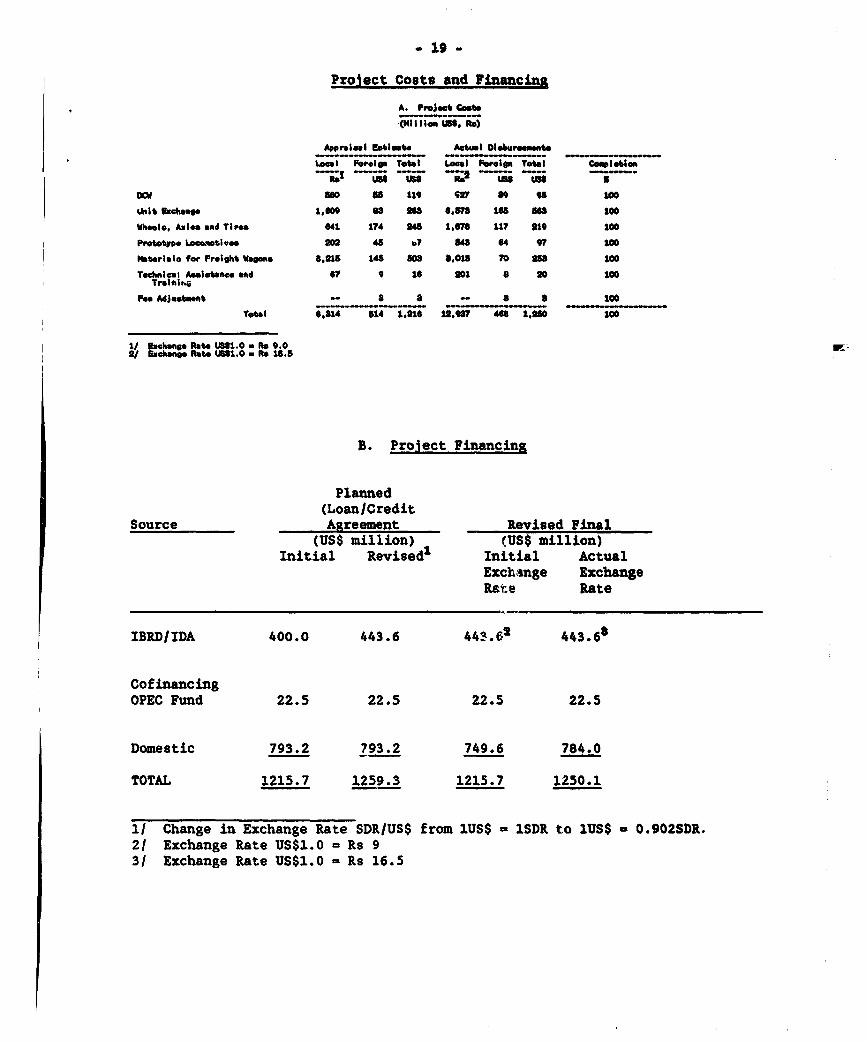
Proiect Costs and Financing
A. ProJ"ct
.Praat t- atimat Aet Oieb
Leral Foreign l crl Foign Totl Copeticn
1' -U -u - s; -z U
oD MlO as Ito v a9 9o 109
Unit lxchae 1,609 a8 16 is7a 1in so 100
Wheel., Axt.. and Tile 641 174 4 1'678 it? 19 100
PrototyPe Iootiv-e 202 48 b 548 64 97 1oo
Material. for Freight Wagon, 8,112 14 808 8,1o8 70 188 100
Toehnacat Asslitace aw 67 9 16 10t 8 20 100Tralfifi.&
Fe Adjusto"t - a a -_ 8 l00
Toal 6.814 $14 1,112 1,.9a7 486 1,110 100
1/ Exchange Rate UW1.0 a Re 9.0V/ Sachang. Rate 161.0 M R. 16.8
B. Proiect Financing
Planned(Loan/Credit
Source Agreement Revised Final(US$ million) (US$ million)
Initial Revised' Initial ActualExchange ExchangeRate Rate
IBRD/IDA 400.0 443.6 443.62 443.68
CofinancingOPEC Fund 22.5 22.5 22.5 22.5
Domestic 793.2 793.2 749.6 784.0
TOTAL 1215.7 1259.3 1215.7 1250.1
1/ Change in Exchange Rate SDRIUS$ from 1US$ - 1SDR to lUS$ 0.902SDR.2/ Exchange Rate US$1.0 - Rs 931 Exchange Rate US$1.0 - Rs 16.5
- 20 -
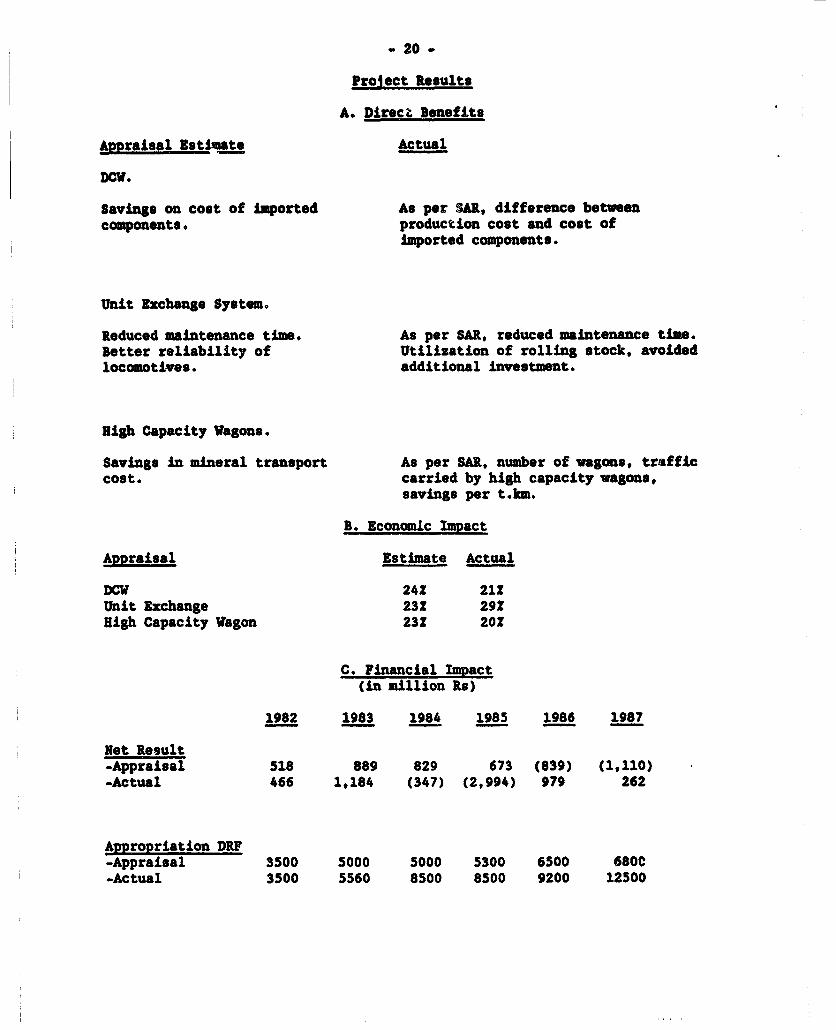
Pro1ect Results
A. Direct Benefits
Appraisal Estimate Actual
DCW.
Savings on cost of imported As per SAR, difference betweencomponents. production cost and cost of
imported components.
Unit Exchange System.
Reduced maintenance time. As per SAR, reduced maintenance time.Better reliability of Utilization of rolling stock, avoidedlocomoti-ves. additional investment.
High Capacity Wagons.
Savings in mineral transport As per SAR, number of wagons, trafficcost. carried by high capacity wagons,
savings per t.km.
B. Economlc Impact
Appraisal Estimate Actual
DCW 242 212Unit Exchange 23Z 292High Capacity Wagon 23Z 20X
C. Financial Impact(in million Rs)
1982 1983 1984 1985 1986 1987
Net Result-Appraisal 518 889 829 673 (839) (1,110)-Actual 466 1,184 (347) (2,994) 979 262
Appropriation DRP-Appraisal 3500 5000 5000 5300 6500 680C-Actual 3500 5560 8500 8500 9200 12500
- 21 -
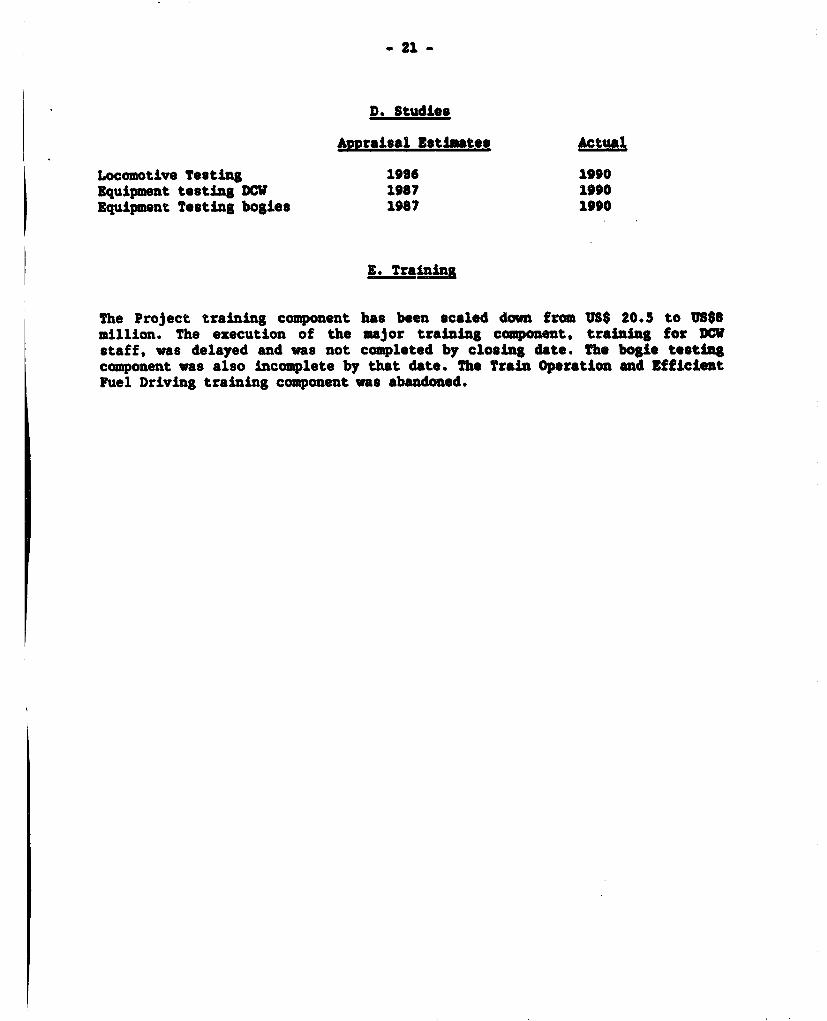
D. Studies
Am,raisal Estimtes Actual
Locomotive Testing 1996 1990Equipment testing DCV 1987 1990Equipment Testing bogies 1987 1990
Z. Tralning
The Project training component has been scaled down from US$ 20.5 to WS$8million. The execution of the major training component, training for DCVstaff, vas delayed and was not completed by closing date. The bogie testingcomponent was also incomplete by that date. The Train Operation and EfficLentFuel Driving training component was abandoned.

- 22 -
Status of Covenants
Covenant Status of Compliance
Maintain passenger fares and freight In compliance for FY96,rates, and take all other action FY87, FY83, and FY89 (basednecessary or appropriate so as to on preliminary estimates).enable the Railwasy to meet annuallyout of internally generated resources,all operating expenses, and dividendpayments on capital at charge.(C.A. 4.02)
Appropriations to the Depreciation In compliance.Reserve Fund of the Railways shall benot less than Rs 21,000 million inaggregate for the period April 1, 1980to March 31, 1985.
Maintain and expand the unit exchange In compliance.component pool of the Railways so as tomeet the latter's maintenance needs.(C.A. 4.04)
Ensure that production and Civil disturbances inremanufacture of parts and component at Punjab initially delayedthe diesel works shall be at least 402 this component and as aof gross rated capacity in 1985186, 702 result, compliance with this1986/87 and no less than 90? thereafter. covenant is delayed. However,(C.A. 4.05) the units are now in full
operation and the productionwas in 1988 70X of totalplanned capacity, 752 in FY89and will be 100? in FY90.
Concurrently with the start of In compliance, howeveroperations Diesel Component Works, somewhate delayed due toinstall a management information delay in the completion ofsystem. the DCW.

- 23 -
Use of Bank Resources
Planned Revised Final
A. Through Appraisal NA NA 168Through Boad Appraisal NA NA 56Through Effectivenss NA NA 0Supervision NA NA 246
B. Staff Input and Major Project Missions
Staff Input Days Overall ProjectActivity Date In Field 1/ Composition Status Typ of Problems
Identification 4/80 28 days 6 Eng/Ec/FAAppraisal 1/81 140 days 21 Eng/Ec/FAPost Appraisal 4/81 21 days 6 Eng/Ec/FAPost Appraisal 8/el 36 days 7 Eng/Ec/FASupervisoln 1 1/83 42 days 12 Eng/Ec 1Supervision 2 5/83 S0 days 14 Eng/Ec/F. 1Supervision 3 10/83 5 days 5 Eno 1Supervision 4 2/86 15 days 8 Eng/Ec/FA 1Supervision 5 4/85 7 days 2 Eng/Ec/FA 1Supervision 6 6/85 20 days 7 Eng/FA 1Supervision 7 9/85 16 days 6 Eng 1Supervision 8 4/86 25 days 7 Eng 2 Technical/FinSupervision 9 12/66 16 days 6 Eng 2 Technical/FinSupervision 10 1/87 6 days 8 Eng 2 TechnicalSupervision 11 6/87 5 days 8 Eng/Ec/FA 2 TechnicalSupervision 12 12/87 6 days 3 Eng 2 TechnicalSupervision 18 2/88 10 days 5 Ec/FA 2 TechnicalSupervision 14 10/88 6 days 3 2 TechniaelSupervision 15 1/89 10 days 6 2 TechnicalSupervision 18 10/89 10 days 5 2 Technical
1/ Estimate. Most missions supervised more than ono on-going projectwith IR In one mission.
1: Problem-free or minor problems.2: Moderate problems.
C. Costs (Not available)

- 24 -
Table I
INDIA
RAILUAY NOERNIZATIO'N AND MAINTENANCE PROJECT It..... .................. _........
(LOAN 2210-IN/CREDIT 1299-IN).............................
PROJECT COMPLETION REPORT
Cost/Defit Streams for Economie Rate of Return for DCU......... .................. _._..............
(Nittion Rs. in 1989/90 values)
AdJusted Technical Total Economic Economic METEconomic Assist. Economic Product. Smnefits COST/ME
cost Cost Costa/ SB ase Case 38AS CASE
1981/82 11.73 11.73 -11.?8v8i 55.81 - 55.81 -55.883/84 110.89 - 110.89 -110.984/8 165.72 - 165.72 -165.785/86 392.50 5.0 397.50 -397.586/87 270.16 8.0 278.16 32.1 48.2 -262.187/88 192.77 8.0 200.77 65.4 98.1 -168.188/89 198.56 8.0 206.56 142.2 213.3 -135.58.°/90 196.86 4.0 200.86 262.6 420.0 -43.590/91 74.13 - 74.13 404.7 729.0 20.291/92 210.63 210.63 611.8 1132.5 310.192/93 167.74 - 167.74 860.9 1617.1 588.593/94 - 860.9 1617.1 756.294/95 860.9 1617.1 756.2f/96 - - 860.9 1617.1 756.2
9697 - * 860.9 1617.1 756.297/98 - 860.9 1617.1 756.298/99 - - 860.9 1617.1 756.2
99/2000 - - 860.9 1617.1 756.200/01 - 860.9 1617.1 756.201/02 * 860.9 1617.1 756.202/03 - - 860.9 1617.1 756.203/04 - 860.9 1617.1 756.204/0 -- 860.9 1617.1 756.205/06 - 860.9 1617.1 756.206/07 * 860.9 1617.1 756.207/08 - 860.9 1617.1 756.208/09 - 860.9 1617.1 756.209/10 - 860.9 1617.1 756.210/11 - 860.9 1617.1 756.2
IRR: 20.C11S/ Technical costs adjusted for 15 taxes and inflation
- 25 -
_NNX 1Table I
tNDtA
tAILWAY NODERNIZATN ND MPAITNA PRWECT 11.......................... ...........
(LoAw 2210-IN/CDiT 1299-I1)......... ....... ...........
PRWCT COPLTIN T.........................
Unit Exchange SIE - fkomie eevaluation(Niltion Re In 19/90 volum)
Economic lIna. Total Aviduol Inc. Wagon Util Total Nltfnsoal Inmt. Maintne. Costs ImQt. due Inc. Rleab l lk fit BhnefitsYear Cost a Costsb/ 4/ 4/
19S4/85 561 - 561 .0 .561198/86 966 966 - 0 19668? 1893 16S 2078 316- 3164 10"196W/68 2371 200 2571 537 1485 202 -5491988489 2461 245 2706 445 1712 2157 -5491969/9O 3647 281 3928 636 2015 265 -1271990/91 2m 293 214 2015 2229 1936s1s192 - m m29 2015 2M15 1722
1992/93 2 293 m 2015 2015 lm1993/94 2m 293 - 2015 2015 17221994/95 -29 293 - 2015 2015 1n221995/96 m 293 - 2015 201s 17221996197 - m 293 2015 2M15 17221997/98 293 293 2015 2015 172219989 - 293 293 -2500 2015 -485 -m
______ 133:~~~~~~~~~~~~~lR 29.022
a/ finmmisl cost adjusted for t xes (.85X) nd for Inflation.b/ At Is 0.9 million for locomotivesdi At R 14 mftilon per diesct locomotlv nid r.
per electric locomtive with 50 remidual value.ft 4S Oradbal bulidup to nea Increased utilization In tI6/90 nd thd e rfter
wiht 35X narglntl cost as In oriinal evluation mid asnuming ontod revene per tnm re "at.

26 -
ANNEX ITable 3
INDIA
RAILWAY MODERNIZATION AND MAINtENANCE PROJECT 11
(LOAN 2210-IN/CREDIT 1299-IN).............................
PROJECT COMPLETION REPORT
Cost Benefit Streams for Economfc Rate of Returnfor High Capacity Wagons
(Millon Rs In 1989/90 values)
AdjustedFiscal Econamic Economic NetYear Costs Benefits Benefits
1984/85 302 -3021965/86 47 62 1S1986/87 1004 161 -8431987188 922 343 -5791988/89 694 496 -1981989/90 995 6S6 -3391990/91 737 7371991/92 - 737 7371992/93 - 737 7371993/94 - 737 7371994/5 737 7371995/6 - 737 7371996/97 737 7371997/98 - 737 737198/99 - 737 737
1999/2000 737 7372000/01 - 737 7372001/02 737 7372002/03 - 737 7372003/04 737 7372004/05 - 737 7372005/06 - 737 7372006/07 - 737 7372007/08 -737 7372008/09 737 7372009/10 - 737 737
IRR: 20.01X
; ~~~~~~~~....... ..........
a/ Financial costsnadjusted for taxes/duties(0.85) and inflation

Table 4
INDIA
RAILVAY NODERNIZATION MID PINIMTENAUCE PROJECt II.............. .............................
(LOw 2210-IN/CREDIT 1299-IN)
PROJECT COMPLETION REPORT
Sumary of the Economic Cost and BenefIts Steams of the Projectfor Nigh Capacity Vagons
(Mlliton Re in 1989/90 values)
U33UUflUUUU3u- *- m- -cost Streams it St------ D C Y -...... Unit Exchange -- --- Unit Exchane --- Nigh Total get Eeneffts
I Incremental High Cmpcty Other Total Avoided Increment. Capacity Project Total Projectisca t Investment Production Investment Naintenace Vagons Items Project 0 C V Loco rw Vagon Util. agons.Year
1981/82 . - - 10 -11.1982/83 55.8 - - - - 55.8 - - - - 0 -55.81983/84 110.9 - - - 110.9 - - - - 0 -110.91984/85 165.7 - 561 - 302 - 1028.7 - - - - 0 -1028.71985/86 397.5 - 966 - 47 - 1410.5 - - - - 0 -1410.51986/87 278.2 32.1 1893 185 1004 42 3434.3 48.2 3164 - 62 3274.2 -160.11987/88 200.8 65.4 2371 200 922 3759.2 98.1 537 1485 161 2281.1 -1478.11988/89 206.6 142.2 2461 245 694 1331 5079.8 213.3 445 1712 243 2613.3 -2466.51989/90 200.9 262.6 3647 281 995 34 5420.5 420.0 636 2015 496 3567.0 -1853.51990/91 74.1 404.7 - 293 - - 771.8 729.0 214 2015 656 3614.0 2842.21991/92 210.6 611.8 - 293 - - 1115.4 1132.5 - 2015 737 3884.5 2769.11992/93 167.7 860.9 - 293 - - 1321.6 1617.1 - 2015 73? 4369.1 3047.51993/94 - 860.9 - 293 - - 1153.9 1617.1 - 2015 737 4369.1 3215.21994/95 - 860.9 - 293 - - 1153.9 1617.1 - 2015 737 4369.1 3215.21995/96 - 860.9 - 293 - - 1153.9 1617.1 - 2015 737 4369.1 3215.21996/97 - 860.9 - 293 - - 1153.9 1617.1 - 2015 737 4369.1 321S.21997/98 - 860.9 - 293 - - 1153.9 1617.1 - 2015 737 4369.1 3215.2198/99 - 860.9 - 293 - - 1153.9 1617.1 -2500 2015 737 1869.1 71s.2
1999/2000 - 860.9 - 293 - - 1153.9 1617.1 -2500 201S 737 1869.1 715.22000/01 - 860.9 - 293 - - 1153.9 16t7.t -2500 2015 73? 1869.1 71s.22001/02 - 860.9 293 - - 1153.9 1617.1 -2500 2015 737 1869.1 715.22002/03 * 860.9 * 293 - - 1153.9 1617.1 -2500 2015 73? 1869.1 715.22003/04 - 860.9 - 293 - - 1153.9 1617.1 -2500 2015 ?37 1869.1 71S.22004/S05 - 860.9 - 293 - - 1153.9 1617.1 -2500 2015 737 1869.1 715.22005/06 - 860.9 - 293 - - 1153.9 1617.1 -2500 2015 73m 1869.1 71S.22006/07 - 860.9 - 293 - - 1153.9 1617.1 -2500 2015 737 1869.1 71S.22007/08 - 860.9 - 293 - - 1153.9 1617.1 -2500 2015 n7? 1869.1 71S.22008/09 - 860.9 -293 - 1153.9 1617.1 -2500 2015 737 1869.1 715.22009/10 860.9 293 - - 1153.9 16171 -2500 2015 737 1869.1 T5S.2
18.764
CLRU WL101UCIDJT 1299-ZE1)
PRJECT 00WLETIU EMiT...... .......... _. _..._. _._. _.---
I681M RAILIWAS. ~~~~...............
FILNIA. STATSMS(M96l-19M, in thoAawd t.)
Ia Statnts 981-19J(Nittien Rf)
1931 19J2 193 1,984 15 1986 1987 196 19" 1990Actual Actual Project. Actual Project. Actual Project. Actual Project. Actual Project. Actul ProJect. Actal Actual Actual
TraffIt Earnirns
Passene 1 9,431.8 11,173.4 9,840.0 13,216.8 11,942.0 5,.201.1 12,320.0 16,385. t2.M730.0 19,301.4 n3,140.0 22,364.4 t3.SS0.0 23,U7.7 27262. 29,U4.0
First Clas 911. 1.09.9 1,293.5 1,362.8 1,514.9 1.31.7 2,09.7 2,343.5 2W97.9. 3.1996SeodC1i. 7,363.3 8,.78. 10.323.0 12. 172.7 13,073.3 15,305.1 17,309.9 18,257.1 21,587.1 23,110.A
other Coaching 1,157.1 1,7.8 1,279.0 1,600.3 1,398.0 1,665.6 1,440.0 1,797.s 1,4o.o 2,104.6 1,S20.0 2,934.8 1,S60.0 2,547.1 2,707.4 3,110.0
Freigt 16,175.2 23S71.4 23,448.0 29,721.2 26,904.0 33,535.0 2,369.o 36,024.1 27,842.0 43,76.8 28,323.0 S1,332.4 28,813.0 S5,19.5 63,431.1 76,11O.0
Niscellamo Reverue 1,220.1 1,396.3 651.0 1,696.0 876.0 1,730.3 9O.0 1,246.S 940.0 1328.9 970.0 1,418.2 1,000.0 1,621.4 2,249.7 1,990.0
Spwwes (187.6) (291.8) 433.0 (257.6) 400.0 (62.3) 4S0.0 (68.7) 500.0 (1U.1) 205.0 (30.4) 311.0 (236.1) (350.3) (200.0
Gross Trafffc Rewn 26,039.S 3s,8513 35,851.0 o,376.4 41,S20.0 SO,404.1 42,489.0 53,57.6 43,452.0 64,231.0 44,1s5.0 75,056.6 45,234.0 84,352. 9s2,92.9 107?r.o
Genet luperfntendane 1,420.3 1,585.1 1,3.4 2,084.0 2,136.4 2,591.6 3,142.3 S3.0 3,931.1 4,6.6
epair wrd Paint. of Permwnt usy 2 . 2,.1 3,628.3 4,219.3 5,047.6 56.4 6,519.6 7,371 8,203.4 8,n.9.9
Repair rd Paint. of Motiv Pawr 2,163.4 2,570.6 3,039.S 3,399.5 3,748.7 4,521.0 s,271.3 5,534A. 626.8 67.7
Repair end Naint, of Carriage & Megan 2,697.1 3,487.0 4,317.9 4,865.3 S,270.6 6003.4 6,906.5 7,41.5 8,0.6 9,0 7
Repair ud Naint. of Plants wid Eqaip 1,34.4 15S96.8 1,87?.7 2,217.7 ,562.2 3,220.7 3,616.6 3, 6.9 4, I0.1 4,790.5
Op. Expensrs lollng Stock srd Eqaip. 2,5s84 3,069.0 3,406.7 3,869.3 4,265.9 4,750.0 S,4t3.2 6,294.6 6,859.1 7,279.
Operating Espenees Traffic 2,899.1 3,258.2 3,740.8 4,349.6 4,904.0 5,455.9 6,391.0 ,741 9,40.4 11,491.?
Operating ERpewues Pual 5,0983 6,903.8 7,823.7 8,747.3 9,780.0 10,872.S 12,059.8 12,185.7 1,03.2 14,74.8
Staff Velfare and lmties ss956.1 1,105.4 1,2C6.0 1,480.1 1,666.6 1,892.9 2,22.s 2,561.9 2,89.4 3,142.9
Niselluwo e arking Espus 1,439.2 1,5ss.1 1,856.0 2,207.3 2,437a 3,e04.9 3,129.7 3,21.s 4,3 4,097.6
Preident Fuid ud Pewon 1,223.3 1,398.0 1,943.7 2,347,2 2,889.4 3,628.6 4,74.3 56.0 7,56.5 49.1
Nlsceltanaa (1,283.3)(2,191.6) (2,970.8) (3,597.0) (4,193.9 (5,213.4) (6,418.) (126.6) (983.) (20.9
Totat Wrking l prmas 22,964.8 2r,33s.s 27,16.0 31,2.9 30,100.0 36,189.6 30,620.0 40,71S3 31,149.0 46,431.4 31,68.0 53,005.6 32,234.0 60,039.5 60,1t8 74,470.0
cahb Geated from qeattio 3,654.7 8,515.8 8,M.0 12,S83.5 11,420.0 14,214.S 11,869.0 12,872.3 12,303.0 17,849.6 12,471.0 22,051.0 13,000.0 24,323.0 32,406.2 32,850.0
Appropriation to DRF 2,200.0 3,so.o0 3,500.0 5,S5O.O s,0o.o0 s,s00.0 s,00o.o 6,5so.0 S,300.0 9,200.0 6,500.0 12,SO.O 6,800.0 13,500.0 15,080.0 17,150.0
Apprepriation to Perfen Fwd 860.0 96s5. 985.0 1,480.0 1,480.0 1,825.0 1,750.0 2,210.0 1,900.0 2,600.0 2,1SO.0 3,s5o.0 2,300.0 4,500.0 S,S0O.0 72.0LO
Dividend to General Reveraj 3,253.6 3,S64.7 3,702.0 4,359.8 4,051.0 4,237.0 4,290.0 4,656.9 4,430.0 S,070.4 4,660.0 S,788.S S,010.0 6,388.6 7,156.6 7,816.7
Net Rult (2,63L9) 466.1 S18.0 1,183.7 889.0 (347.S) 829.0 (2,494.6) 63.0 979.2 (89.0) 262.5 (1.110.06)(. 4,747.6 533
mum

IWI* SQmm 2
OAWUA%T YMIZAT'iWA AS UiUTWU ttai
(LOW 221O-131T 29961-)
PRMTac CWeLua NuT
IWIAN RAZUtYS
FtINAIAL STAIBEET(198t-1990, in thmsad fs.)
3ale PMsheets ¶981-a9
(Ritlion Rs.)
ASSETS 18 1982 1983 19 85 1986 1t9 e 15 1909 190
Actual Actuat Projt. Act Project. Actut Project. ActUa Project. AttLt Project. Actusl Project. Atuat Actuat ctual
Grs Fixed Asets (imt. Stores) 74,483.9 81,643.6 76,9U.0 88.822.0 83,145.0 94,014.1 89,650.0 103,MJ 96,80 114,920.1 102,117.0 3.068.7 106,677.0 1 .5 172,394.2
less: Depro reserw Fund nsted 4,915.7 S,596.1 6,216.0 6,660.2 7,716.0 8,063.4 7,716.0 9,935.9 8,016.0 12,350.8 10,216.0 16,148.6 10,216.0 20,61.3 25,7.2
Other 3unc niested 8,604.7 9,064.4 9,285.0 9,650.9 9,25.0 10,272.7 9,455.0 10,960.9 9,606.0 11,78.6 10,338.0 13,189.1 1¶0338O 144932.0 16,c6.9
Net Fixed Abets 60,963.5 66,981.1 61,486.0 72,510.9 66,14.0 75,678.0 72,479.0 82,856.5 ?9,17o 90.780.7 1,5S63.0 103,731.0 86,1.0 116,222.2 12987S.1 0.0
Furds with tentral Coy. 18,021.2 17,764.0 5,454.0 19,062.0 6,019.0 20,661.0 6,761.0 22,710.5 7,349.0 22,830.5 s,866.0 26,068.0 4,60.0 31,752. 29,603.3
Lore Term Assets 78,964.7 84,745.1 66,940.0 91,572.9 72,163.0 96,339.0 79,240.0 103,567.0 86,527.0 113,611.2 87,431.0 129,799.0 90,726.0 147,974.9 159,478.4 0.0
sudry Debtors 248.7 303.6 4,818.0 370.2 4,866.0 444.9 4,916.0 448.1 4,067.0 s12.2 s,029.0 683.9 S,087.0 6M0.2 791.6
Receivable on Traffic 1,434.4 1726.3 4,200.0 1,98.8 4,536.0 2,046.1 4,854.0 2,114.8 5,14S.0 2,227.9 S,402.0 2,266.2 5,618.0 2,492.4 2,684.7
Recemivbte frae Gover.nt 571.6 763.2 920.2 951.9 793.2 656.0 427.3 421.1 1,125.5
Cash in Mard 1,959.0 1,980.5 1,231.0 2,034.0 1,231.0 2,467.5 1,31.0 1,811.6 1,231.0 2,U3.6 1.8t.0 3,046.3 1,Z31.0 3,217.6 3,780.1
Short Tem Aets 4,213.7 4,773.6 10,249.0 5,368.2 10,633.0 5,910.4 11,001.0 5,167.7?l ,343.0 5,39.7 116,68O 6,45.7 11,936.0 6,814.3 8,381.9 0.0
Total Assets 03,198.4 89,518.7 77,189.0 96,941.1 82,796.0 102,249.4 90,241.0 110,734.7 97,870.0 119,150.9 ",089.0 136,222.7 102,66.0 154,789.2 167,86.3 0.0
LIAILITTIES
Raitway Reserve Funds Availabte 6,484.7 5,425.1 5,454.0 4,883.2 6,019.0 5,794.8 6,761.0 6,392.7 7,39.0 5,692.4 5,168.0 6,133.5 4,603.0 6,944.1 6,162.1
Lom tapital 60,963.5 66,980.5 66,400.0 72,510.9 72,780.0 75,678.0 76,465.0 82,856.5 80,150.0 90,780.7 86,60.0 103,731.0 93,150.0 116,222.2 12975.1
Provident Fund 9,019.5 9,492.3 10,277.7 10,643. 11,274.5 11,807.8 13,036.5 15,617.0 17,395.4
othr Deposits wd Advances 2,517.0 2,846.6 3,981.1 4,m23.2 S,OU3 S,330.3 6 098.0 9,191.6 6,045.8
Total EqAty 78,984.7 84,744.5 71,854.0 91,572.9 78,799.0 96,339.1 03,226.0 105,567.0 87,499.0 113,611.2 92 U98.0 19,799.0 97,753.0 147,974.9 159,478.4 0.o
..-............................. ---.---
Payables 917.2 1 0483 1,169.0 1,320.4 1,543.8 1,75.7 2,112.0 2,281.9 2,558.
----I-----ntl Trsactions 3,296.5 3,7253 4,199.2 4,590.0 3,623.9 3,034.0 4,311.7 4,s19.4 S,83.2
total short Ter Liabilities 4,213.7 4,m.6 5,335.0 5,368.2 3,997.0 5,910.4 7,015.0 S,167.7 10,371.0 S,539.7 6,571.0 6,423.7 4,909.0 6,814.3 8,381.9 0.0
................... ... ............................... .......... ..........
Total Liabilfties 83,198.4 89,518.1 77,189.0 96,941.1 82,796.0 102,249.5 90,241.0 110,734.7 97,870.0 119,150.9 99,"089.0 136,222.7 102,662.0 54,789.2 167,8603 0.0

INDIA ANM 2
*RAILW.Y WRWIZA;OW AND KAITNAC It Page 3........ . .. .....................
CLOAiN 2210-INV/CEDIT 1299-I1)PItOJECT W.LETIOI RlEP0T......... .............. _. .
IlDIM RAILWAYS
FINANCIAL StATENIS(1981-1990, In thousud fs.)
Sesm wsd Appticatiore of Fudn(litticn ft)
1981 1982 1963 1984 ¶985 1986 1987 1968 1989 IMO
Actuat Actin Project. Actual Project. Actuat Project. Actual Project. Actual Project. Actual Project. Actuat ActuaL Actuat
Net Revuu 1,274.9 4,030.6 5,S42.9 4,940.0 3,798.5 5,119.0 2,701.0 5,103.0 6,858.7 3,821.0 6,808.4 3,900.0 7,231.S 7,373.3 9,550.0
Contribution tp DRF 2,232.0 3,533.0 S,594.3 S,000.0 8,S37.3 S,000.0 8,544.8 5,300.0 9,.23.8 6,500.0 12,S93.2 6,800.0 13,619.6 I5.127.3 17,307.5
Open Lines 114. 97.0 89.4 93.8 110.0 95.3 1S0.0 114.1 193.0 135.6 200.0 234.3 200.0 310.5 368.S 500.0
Catributin ti Pesion Fud 73.1 149.5 185.6 170.0 213.3 280.0 408.9 340.0 726.# 200.0 985.0 210.0 2,075.6 1,781.6 443.2
Contribution to Safety Fwd 10i5.0 106.1 90.5 86.0 82.1 87.0 84.9 87.0 252.6 bO.0 309.0 74.0 669.8 564.1 564.2
Intrst on fud Bal 394.9 372.7 335.5 388.0 342.3 387.0 387.9 S12.0 392.7 248.0 376.4 305.0 424.3 414.4 464.0
Cash Flew 4,176.9 8,281.3 11,845.6 10,694.0 13,068.8 11,023.0 12,241.6 11,S35.0 17,630.3 11.0C9.0 21,306.3 11,489.0 24,331.3 2S,629.2 28,S28.9
6aveninnt ContribitiawCapitat 6,11O.0 6,017.0 S,489.8 6,300.0 S,061.2 3,685.0 7,178.4 3,68S.0 7,924.2 6,500.0 12,950.3 6,SOO.0 12,492.1 13,627.1 16,01S.0
Loom 346.6 495.9 626.1 795.0 118.0 973.0 537.8 1 273.3 S68.S
Totat Long Tof Sorce 10,633.5 14,298.3 0.0 17,335.4 17,074.0 18,62.9 1,708.0 20,016.1 15,220.0 2S,SS4.S 18,344.0 34,374.6 18,962.0 37,361.2 40:S29.6 4S,412.4
APPLICATIONS
O Lines ws Chared 97.0 89.4 93.8 110.0 95.3 150.0 114.1 193.0 135.6 200.0 234.3 200.0 31O.5 368.5 50O.0
E xmicn binestamt 6,110.0 6,017.0 5,489.8 6,044.0 5,061.2 3,367.0 7,178.4 3,394.0 7,924.2 6,243.0 12,f9O.3 6,284.0 12,491.2 13,627.1 16,015.0
Replacaimnt lwestent 2,786.3 5,043.1 6,5S5.8 S,230.0 7,3.8 s,OnO.o 7,975.3 S,S91.0 9,814.a 7,S0.0 11,752.9 7,500.0 11,M.7 14,776.2 14,890.0
Develapunt Fuid Works 297.6 272.3 327.4 320.0 326.5 450.0 377.8 455.0 421.0 650.0 840.3 650.0 1,03S.0 1,060.2 1,450.0
Safety Fuid Wboks 110.1 113.5 188.9 170.0 210.8 170.0 234.3 144.0 269.4 1SO.0 349.1 1SO.0 430.3 499.8 650.0
Total Capital Ifwestuent 9,401.0 11,535.3 0.0 12,655.7 11,874.0 13,531.6 9,137.0 1S,879.9 9,M.0 18,565.0 14,743.0 26,126.9 14,784.0 25,989.7 30,331.8 33,505.0
Dviduwd Paydule 1,274.9 3,589.9 5,079.3 4,051.0 3,789.5 4,290.0 2,701.0 4,430.0 6,237.6 4,660.0 S,788.5 S,010.0 6,388.6 8,150.0 8,150.0
Loan Repqimmts 112.4 118.4 140.5 247.0 162.3 221.0 212.2 134.0 243.9 165.0 299.3 217.0 345.8 430.4 518.S
Debt Service 1,387.3 3,708.3 0.0 S,219.8 4,298.0 3,951.8 4,511.0 2,913.2 4,564.0 6,481.5 4,82.0 6,087.8 5,227.0 6,734.A 8,580.4 8,668.5
............
Increasejoecrae Fuis 301.0 1,244.3 917.3 566.0 706.9 742.0 425.2 S88.0 (945.8) (1,481.0) 183.8 (1,26S.0) 485.0 (92.4) 2,32.s
Vaiation working capitat (455.8)(2,189.6) (1,457.4) 336.0 435.6 318.0 827.8 291.0 1,453.8 257.0 1,976.1 216.0 4,152.1 2,S69.8 M6.4
Total Short tem AWicatiam 1,232.5 2,763.0 4,679.7 5,200.0 5,094.3 5,571.0 4,166.2 S,443.0 6,989.5 3,601.0 8,247.7 4,178.0 11,371.5 10,197.8 11,9074
Total A4pticatio 10,633. 14,298.3 17,335.4 17,074.0 18,625.9 14,708.0 20,046.1 15,220.0 25,554.5 18,344.0 34,374.6 18,962.0 37,361.2 40,S29.6 4S,412.4
'K>
s*IUWA lllUATlal AND 4 I1UTDWU 1, PaS 4
(MU 22t10-IUIET 1299WII)PRlOJECt LETION SPRT
INDIMN RAILITYS
INAlICIAL STAIBUITSC198-1990. in thoswad Rf.)
Perforite trdiestors
t981 1982 9t 1986 t987 19"8 1989 1990- - r - _ - ___
Price Itdu(1 ( 8 100) 100.0 112.5 121.2 136.5 145.3 1168.2 1383.5 20.2 213.3Working Ratioj 0.86 0.76 0.72 0.72 0.716 0.72 0.71 0.71 0.65 0.69
RtetuOf Ra1.01 6.01 .151 241 6.71 541 5.41 9.21 neY, . 1.0 1.0 1.0 1.0 1.0 1.0 1.0 1.0 1.0 We/
ODbt Srvice Coveae 2.63 2.30 2.41 3.60 4.42 2.75 3.62 3.61 3.78 3.79DRF/Gros Fixed Assets (1) 3.0C 4.31 6.31 9.0C 8.2 8.0X 9.41 8.9X 8.7S ta
Amul Capitat Inest (curr Prices) 9,401 11,S3S 12,656 13,532 15.880 18,565 26,127 25,990 30.332 33,5S05Arnl CapitaIn lvest (1981 Prices) 9 401 10 251 10 44 9a912 10 930 12007 15,532 14,165 15 148 15.707I seLf-f imiwcing U.7X 6361 47.21 66.01 fr.61 55.91 54.01 "4.2% 8UJ 56.2work. pn. per T.U.(Rs:curr Prfces) 0.065 0.071 0.081 0.09 0.102 0.106 0.113 0.122 0.124 Wabrk. Eipen per T.U. (Rs:t98t Prices) 0.06S 0.063 0.066 0.068 0.070 0.069 0.067 0.067 0.062 Wva
Trffic (billion T.U.) 356.2 384.9 394.7 391.7 399.2 437.0 470.6 491.9 486.1 230.4Pasers (billion p-bn) 206.6 220.8 226.9 222.9 226.6 240.6 256.S 269.4 263.7 280.4Freight (billion t-kr) 147.6 164.1 167.8 168.8 172.6 196.4 214.1 222.5 222.4 0.0
TariffsPasewefs (ts.lp-b, cwrr pries) 0.04S O.OS 0.058 0.068 0.072 0.080 0.087 0.086 0.103 0.105Passener CRs.lp-b,. 1981 Prices) 0.045 0.045 0.048 0.050 0.050 0.052 0.052 0.847 0.652 0.019Freight lRr./t k r. r8nt Prices) 0.140 0.144 0.177 0.199 0.209 0.223 0.240 0.260 0.285 0.332Freight tRs./tk, 1961 Prices) 0.110 O.128 0.146 0.146 O.14 0.144 0.143 0.147 0.142 Wa
Nmer of EqAloe (ThdLawd) 1572 1575 184 1592 1603 161 1611 1617 1624WSW Sill Off tlien ft: Crur Prices) V,l167 14.515 17,099 20413 23,534 27,069 33,297 39,873 43,9051kg Sltl Oliion Its: 1981 Prices) 13,16? 12.899 14,113 14,952 16,198 17.507 t9,794 21,731 21.927 0
T.U. per Eploee 226,559 244,368 249,192 246,068 249,014 270,930 292,142 304,199 299,323
I!

MIA Are.. 3
RAILWAY HOOIZTION AND AiNt _,1C3 11 Pe I
(LOAM 2219-1C10IT 1299-3NPltOJET COPETLEIOt REPeT
1,010k RAILWAYS - ttACIAL STAT94TS 1961-90
Incea Statemeets
(Ro Hti I ion)
196 1962 196 11094 1965 1966 1967 19866 1M6 1990
Actal Act Poject. Actual Project. Actual Pojct. Actual ProJect. Actual Project. Actual Proet. Actual Acual Act,et
Traffic E;rIn -- _ -----...- _ _ _ _____________-
P _eeaegera 9,431.8 ,.173.4 9,840.0 13,216.6 11,942.0 15,201.1 .2.320.0 1S.6a3.? 12,730.0 19.01.4 13.140.0 22.344.4 13.SSO.O 23.147.7 27.262.4 29.420.0
Fir" Clae 911.5 1,095.9 1,298.5 1,802.s 1,314.9 1,691.7 2,09.7 2.343.S 2.,67.9 .3.99.6
Saggd Class 7.813.8 e.7M.? 10,323.0 12.172.? 13..073.3 35.05.1 17.309.9 16.257.1 21.687.1 23,110.4
other Coa"Too 1,157.1 1,267.8 1.29.0 1,600.3 1.896.0 1,665.6 1,440.0 1,797.5 1,440.0 2.104.6 1.520.0 2.934.S 1.660.0 2,S47.1 2,707.4 3,110.0
Friot 16,175.2 #,571.423,446.0 29.M.2 26,94.0 20,515.0 27,869.0 36,024.1 2,42.0 43,7.63, 25,323.0 51,232.4 2S.SU..0 59,919.5 56,431.1 76,110.0
eoteloe Reven 1,220.1 1,86.8 831.0 1,6".0 e76.0 1,720.8 910.0 1,240.5 940.0 1=., 970.0 1,418.2 1,000.0 1.6.4 2,240.7 1.990.0
_u I (257.6) 29.8) 483.0 (257.6) 400.0 (62.6) 460.0 (66.7) 600.0 (11.1) 2S0.0 (6.4) 811.0 (6.1) 8O.3) C200.Oj
Orgem Traffic Ueee_ 2tt89.t5.s,651.8 15,651.0 44,87S.4 41,S20.0 50,404.1 42.409.0 56.567.6 a43.42.0 04,261.0 44.156.0 7.066.6 45.234.0 66.,22.5 d.452.9 107.320.0
- ~ ~ ~ ~ ~ ~ ~ ~ ~ ~ ~ ~ ~ ~ ~ ~ ~ ~ ~ ~ ~ ~ ~ ~ ~ ~ ~ ~ u-
oe,ralt Suparlatendaen, 1,420.3 1,56.1 1,623.4 2,e04.0 2,s36t.4 2,691.6 3,142.3 3,634.0 3.91.1. 4.363.6
Repair and mIntenee of P ereat gay 2,449.1 2,961.1 8,626.8 4,219.8 5,047.6 5,.62.4 S,S19.6 7,371.1 0.203.4 8.94.9
Repit and Iblet_enace Of 1ativ; Pomer 2.3S..4 2,670.,6 8,039.5 8,09.5 3.74s.7 4.821.9 5,27.8 5.54.4 626.6 6.725.?
Repel. *ad tbhmt_enc of Cariae an aone 2,690.1 8,.4.0 4,317.9 4,e66.8 5.270.6 0,.00.4 6,90.5 7,.471.5 6.330.6 9,046.7
Repair "a thlnt c of Pleat d 54u lpeet 1,344.4 1,56.6 .,677.7 2,217.7 2,862.2 3.290.? 3,616.6 ,6836.9 4.250.1 4,790.S
Oeratleg &EPene Relltee Stock aN Rwepet_ 2.384.6 8,06s.0 8,406.7 8,6.3 *4.265.9 4,r70.0 5,418.2 6,294.6 6.659.1 ,279.4
Operating Eapenee Taffic 2,699.1 8..2 S,740.8 4,849. 4,904.0 s,4ss.9 0,391.0 7,748.1 9,440.4 114.91.7
eerabtlie EpeFa . 5,e09.3 0,903.6 7.63.? 6,747.8 9,760.0 10,672.5 12.059.6 12.55.7 18.653.2 14,740.6
S1tff Vefa an Amenities 966.1 1,10S.4 1,296.0 1,460.3 1,66.6 1,662.9 2.227.S 2,651.9 2.,39.4 8.142.9
l6acoloaeaiua, Varlee Uapeeee 1,469.2 1,69.1 1,66.0 2,207.3 2,437.6 8,eee.9 8.129.7 8.2.9 4,336.5 4,097.6
Pre,idalk Foed aN teale, 1,2U.ms 1,9.0 1,9a8.7 2,67.1 2,609.4 iI.M.$ 4,745.3 c.o0 7,06.5 49.1
Niacellag (,2.1-)(2,1916-) (2,9170.6) (3,7.0) (4,193.9) (5.218.4) (6,418.2) (156.6) (9.630.4) (20.9)
To.ttl V _.4Iagpeea 232.9".8 27,1s.S 27,14.08 1,7.9 80,160.0 8U6,8 20.02,.0 *40,715.3 8.1149.0 4,.451.4 61,657.0 es,005.6 2,234.0 6O,629.5 60,165.7 74,470.0
Caa GOae.aa from S1Uatime 3,64.? 6,515.811 6,705.0 12,6.. 11,40.0 14,214.5 ,66.0 12,672. 12,60.0 178,6.6 12,471.0 22,61.0 18,060.0 24,2s.0 s2,404.1 32,0.0
ppoprlatIot to OW 2,20.0 8,600 .0 8s,500.o . 0 M. 0 0.500 6,soo.0 S,00.0 8,s80.0 s,80.0 9,260.0 a,800.0 121,60.0 6,60o.0 1S,660.0 15,060.0 17.".10.0
Approrition Pt n Noice Food 6400 950 965.0 1.480.0 1,40.0 1,625.0 1,7A0.0 2,210.0 1,190.0 200.0 2,150.0 3,150.0 2.300.0 4,500.0 S,S00.0 7.2000
ividend to Cenerl R_aeu 3,258.6 8,564.? 8,76.0 4,869.6 4.6.O 4*,237.0 4,260.0 4,516.9 4,420.0 6,070.4 4.660.0 5,736.8 6,010.0 6.38. 7.256.S 7,6t6.7 LW
Wt Reault (2,568.9) 466.1 516.0 1,166.? 56.0 (847.5) 66.0 (2,496.) 678.0 979.2 (669.0) 262.5 (1,110.0) (S3.0) 4.*47.6 SlS.S
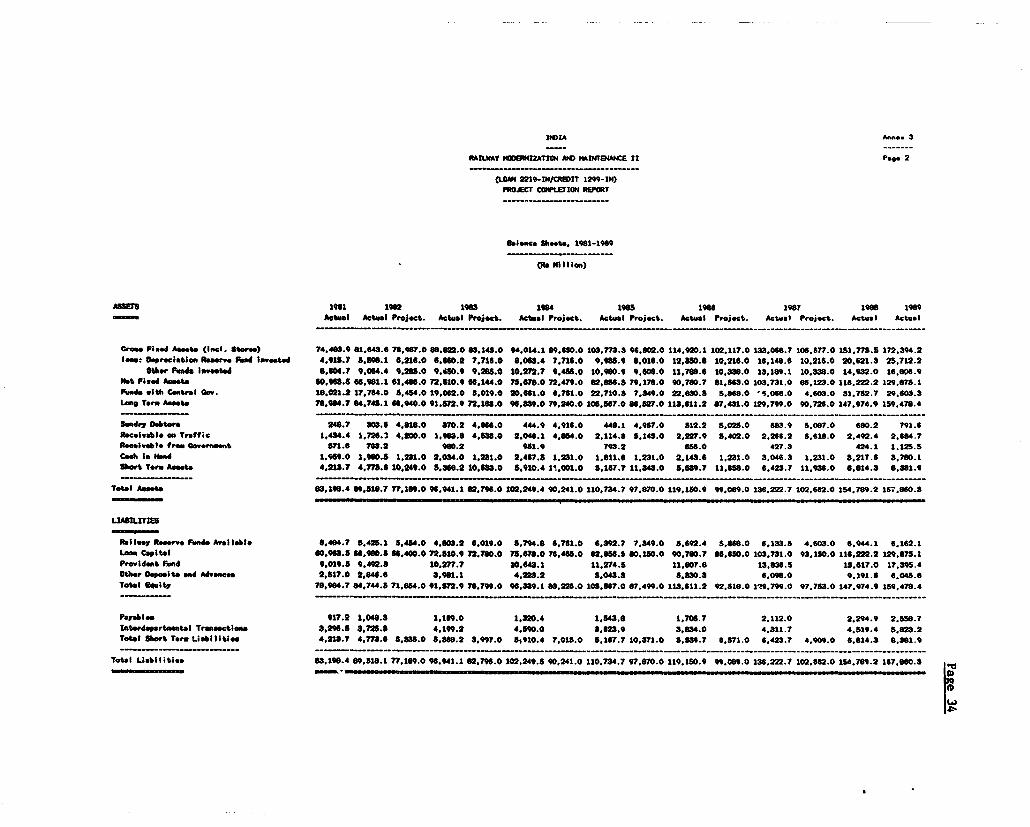
ItQA A-*. 3
RAILWAY ODOmIZATIMW AO M AINtANC 11 Pogo 2
(LOW 2219-IIqREIT 1299-INP0JECT ClFETI0N REPORT
6.len4 Shoo"., 19-1989
0R HillIion)
ASSE£ S 1981 1902 1963 1904 1968 1966 1937 1960 1909
- Actual Actwal Project. Actual Prect. Actual Proj4et. Actual Project. Actual Project. Actual Project. Actual Acteel
Oce. PFied Aeet. (insl. Store.) 74,488.9 01,643.6 76,967.0 ss,622.0 83.14S.O 04.014.1 89.9,6.0 103,77.3 96.802.0 114,920.1 102,117.0 133,066.7 106,677.0 18.177S.5 172.34.2
lee1:epreciation Reere fed loaest" 4.918.7 ?.896.1 6,216.0 6.6.0.2 7,716.0 8.065.4 7,716.0 9,915.9 8.016.0 12,350.8 10,216.0 16,146.6 10,216.0 20,621.3 2.712.2
other Feed. lveeted 8,04.7 9.064.4 9.265.0 9.650.9 9.266.0 10.272,7 9.488.0 10,960.9 9e,00.0 11,708.6 10,336.0 13.169.1 10,338.0 14,932.0 16,606.9
at Pie sd Aete 60,93.6 66S.191.1 81,466.0 72,810.9 66.144.0 73,e78.0 72,479.0 62,666.5 79,176.0 90,760.7 61,863.0 103.731.0 06,123.0 116,222.2 129.078.1
FPD." ith Central C . 16,021.2 17,764.0 8,484.0 19,062.0 6,019.0 20.661.0 6,761.0 22,710.5 7,349.0 22,6.s.8 s.868.0 *..068.0 4603.0 31.752.7 29,608.3
Long Ture Meets 7984.7 ,74.84.1 66.940.0 91,872.9 72.163.0 96,339.0 79,240.0 106,567.0 86.527.0 118,611.2 87,431.0 129.799.0 90.7.0 147,974.9 159,470.4
&unry Dabtore 240.7 303.6 4.618.0 37o.2 4.666.0 444.9 4,916.0 44.1 4,967.0 512.2 5.025.0 683.9 S.07.0 680.2 791.6
Raceivable on Traffic 1,434.4 1,72S.3 4,200.0 1,963.6 4,536.0 2,046.1 4,854.0 2.114.6 8,148.0 2,227.9 8,402.0 2.266.2 5,618.0 2.492.4 2.64.7
Receivable from Government 871.6 763.2 960.2 631.9 73.2 656.0 427.3 424.1 1.12S.S
Cah io HAn 1,99.0 1,960.8 1,231.0 2,034.0 1.231.0 2.4e7. 1.231.0 1,611.6 1,231.0 2,143.6 1,231.0 3,046.3 1,231.0 3,217.6 3,760.1
ShoT Ter Asset 4,213.7 4,m.6 10,249.0 S,366.2 10.613.0 8,910.4 11,001.0 5,167.7 11,343.0 s,69.7 11,658.0 8,423.7 I1,936.o 6,014.3 8,381.9
Total A*et 63,1961.4 69,1S6.7 77,109.0 961,941.1 62,796.0 102,249.4 90,241.0 110,734.7 97.a70.0 119,160.9 99,o09.0 16,222.7 102,662.0 1S4,789.2 168,660.8
R8llmy Ree"o Peed. Avelable 0,484.7 8,425.1 8,434.0 4,803.2 6,019.0 ,4.0 6,76.0 6,392.7 7,349.0 3,692.4 8,868.0 6,133.5 4.603.0 6,944.1 6,162.1
Leon Capital 60.093.5 66.960.5 66,400.0 72.810.9 72.760.0 7s,676.0 76,468.0 62,06.5 80,180.0 90,70.7 8,660.0 103,731.0 93,160.0 116,222.2 129.,7S.1
Provident Fend 9.019.8 9.492.3 102.7.7 10,643.1 11,274.5 11,607.0 13.036.5 15,617.0 17.395.4
Stjeer ODpoest and Advane.t 2,517.0 2,646.6 3,961.1 4,223.2 S,043.3 8,330.3 6,096.0 9,191. 6.045.6
Toutl oultp 70,904.7 84,744.3 71.084.0 1,8672.9 70,799.0 96,339.1 63,228.0 105,567.0 67,499.0 113.611.2 92,516.0 129,799.0 97,t73.0 147,974.9 IS9,470.4
~~~~~~~~~~~~~~~~~~~~~~~~~~~~~~~~~----- - -- - ------ - - - - -- -- -- - -- -- -- ,-,- -- .-- ..- - - -. - - - - - - -... -.- -- -- .-
PerotIes 917.2 1,046.3 1,169.0 1,320.4 1,843.6 1,705 7 2,112.0 2,294.9 2.,50.7
Interdepartmental Traseactions 3,26.8 35,728.3 4,19I.2 4,901.0 3,62s.9 3,634.0 4,311.7 4,819.4 8,623.2
Totel Sbhrt Term Liabilitie 4,213.7 4,773.6 8,s3a.0 8,360.2 3,997.0 si9 1 0
.4
7,01S.0 5,1677 10,371.0 ,6397 6,871.0 6,423.7 4,09.0 6.614.8 6.361.9
Total Liabilities 83,198.4 09,516.1 77,189.0 6,941.1 62,r7e.0 102,249.S 90,241.0 110,734.7 97.8r.0 110,180.9 99,009.0 138,222.7 102,662.0 1S4.709.2 167,860.8
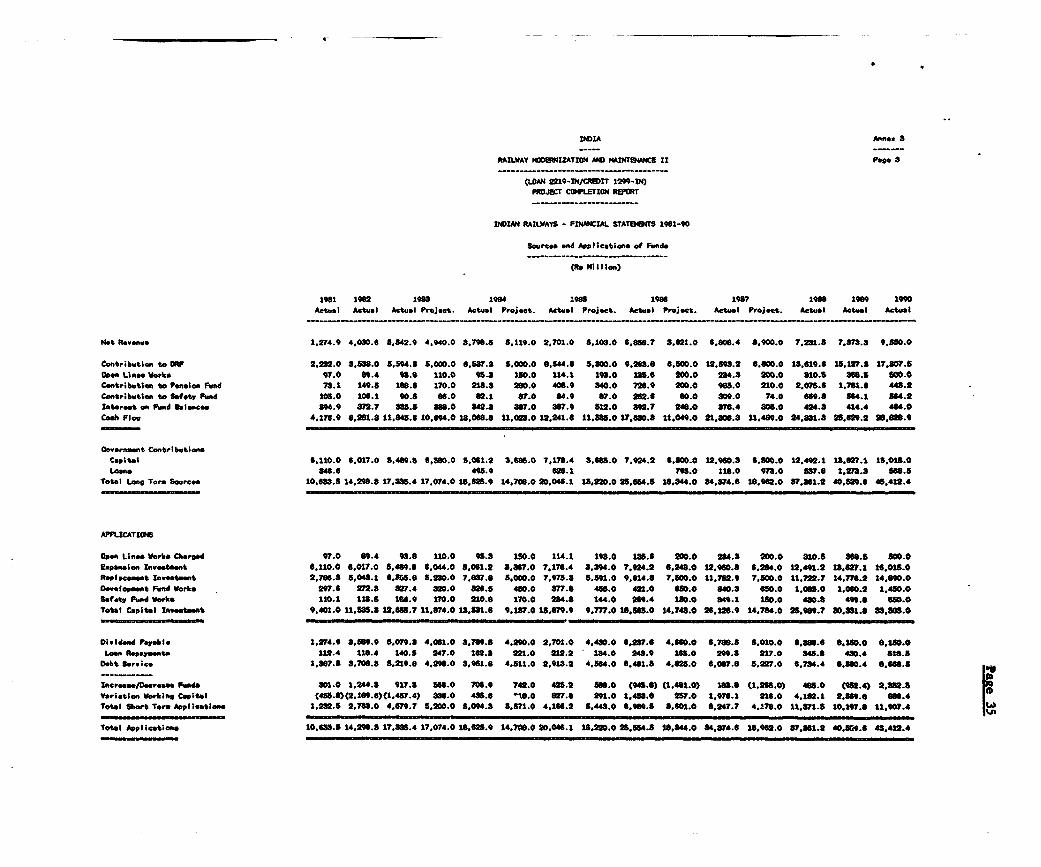
NDeIA Annes
RAIWAY MOODIbeZATION AN MAINMANCE It Pe. 3
---------- _-_-------------------------
tLOAN 229-IN/CREDIT 1299-IN)
PRO.i2CT COMPLETION4 RET
I?QIAN RAILWAYS - FINACIAL STATEOETS 1981-90
Sources and Applicati.,. of Fund.
(Re Mi llion)
19d1 1982 1938 1984 t98s 180 1987 19S8 1989 1990
Actual Actual Actual Proajet. Actual Project. Actual Project. Actual Proje)t. Actul P ro;ect. Actual Actual Actual
Not Revanuw 1,274.9 4,030.6 S.,42.9 4.940.0 3.7"9.8 3,119.0 2,701.0 5,108.0 6,8118.7 3.821.0 6.808.4 3,900.0 7,231.5 7r3rs.3 e9.5D.0
Contribution to OlF 2,282.0 8,38S.O 8,594.S .000.0 8,83.3 7.8 000.0 t.t4t.6 8,300.0 9,268.6 6S,00.0 12,898.2 6.800.O 13,619.6 15,17.S 17,807.5
Open Lloe Wotris 97.0 09.4 98.6 110.0 95.3 180.0 114.1 198.0 128.6 200.0 284.3 200.0 S10.6 868.S 600.0
Contribution to Pansein Fund 73.1 149.8 18.6 170.0 218.8 280.0 408.9 840.0 726.9 200.0 98S.0 210.0 2,075.6 1,781.6 448.2
Contribution to Safty Fund 105.0 306.1 90.8 86.0 02.1 87.0 84.9 87.0 282.6 90.0 809.0 74.0 669.6 864.1 864.2
IStereat on Fund 8blnc.. 894.9 872.7 s8s.5 868.0 842.8 887.0 887.9 812.0 892.7 248.0 376.4 806.0 424.3 414.4 464.0
Cab Flo 4.176.9 8,201.8 11.848.6 10.694,0 18,068.8 11,028.0 12.241.6 11.O130 17,6380. 11,049.0 21,806.8 11.489,0 24,881.8 25,629.2 28,828.9
Cowvernant ContributioneCopital S.1100 6,017.0 8.489.S 6,S30.0 S.061.2 3,68S.0 7,178.4 S,685.0 7,924.2 6.s00.0 12.9S0.3 6,500.0 12,492.1 13.27.1 16,01S.0
ctne 346.6 495.9 626.1 796.0 118.0 973.0 887.6 1,2738 868.6
Total Lont Tor Sourceo 10.833.S 14,298.8 17,835.4 17,074.0 18,625.9 14,706.0 20,048.1 18,20.0 25,864.8 18.344.0 84,874.6 18,962.0 S7,861.2 40,829.6 4,412.4
APPLICATIONS
Open Lines Worb Charg.d 97.0 89.4 9S.8 110.0 98.8 30.0 114.1 193.0 185.6 20.0 234.8 200.0 810.5 868.S SO0.0
Erpanooon Inveetoet 6,110.0 6,017.0 .401.8 6,044.0 8,061.2 8,S67.0 7,176.4 8,394.0 7,924.2 6,248.0 12,990.8 6,284.0 12,491.2 13,67.1 16,018.0
Raplacanant Invcetoant 2,786.8 5,048.1 6,108.6 8,230.0 7,8S7.6 S,000.0 7r,978.8 891.0 9,614.8 7,800.0 11,782.9 7,800.0 11.722.7 14,77.2 14,800.0
DOv l_poont Fund Works 297.6 272.8 27.4 820.0 826.5 480.0 877.8 4851.0 421.0 68.0 840.8 680.0 1,01S.0 1.060.2 1,480.0
Safety Fund Work 110.1 118.8 198.9 170.0 210.6 170.0 2".8 144.0 2Se.4 160.0 84.1 180.0 48.8 499.6 68.0
Total Caoital inw.oetet 9,401.0 11,385.8 12,688.7 11,874.0 13,831.6 9,137.0 18,679.9 9,777.0 13,868.0 14,748.0 26,126.9 14,784.0 2S,909.7 80,83l.8 88,801.0
ldend Praable 1,274.9 8,891.9 8,079.8 4,061.0 8,769.8 4.260.0 2,701.0 4,430.0 6,27T. 4,660.0 8.7.8 5,010.0 6,866.6 6,2O0.0 8,18>.0
Lon Ropsy.nte 112.4 118.4 140.8 247.0 162.8 221.0 212.2 184.0 243.9 148.0 29.8 217.0 848.8 430.4 818.8
Debt Servie 1,Stt7.8 8,706.3 5,219.8 4,298.0 3,951.8 4*,11.0 2,913.2 4,864.0 6,461.5 4.28.0 6,067.8 S.227.0 6,784.4 8,60S.4 8,668.8
IncrSea/Decreaa Panda 801.0 1,244.8 917.3 6S.0 706.9 742.0 426.2 S8.,0 (94-8) (1,481.0) 188.8 (1,265.0) 4SS.0 (982.4) 2,S32.5
Variation WorkIn Capital (45S.8)C2,1809.)(1,487.4) 336.0 488.6 "¶3.0 #7.8 291.0 1,468.6 2S7.0 1.976.1 216.0 4,1S2.1 2,569.6 680.4
Total Short Tor Appl$catlons 1,232.8 2.788.0 4,679.7 5,200.0 8,094.8 S.s,7.0 4,1Sft.2 8,448.0 0. 3,601.0 8,247.7 4.178.0 11,871.8 10,197.S 11,907.4
Total Applicatt;in 10,63.5 14,21t8.8 17,88.4 17,074.0 18,2S.9 14,700.0 20,046.1 18.20.0 26,1554.5 18,844.0 34S74.S 18,962.0 373,81.2 40,909.0 48,412.4
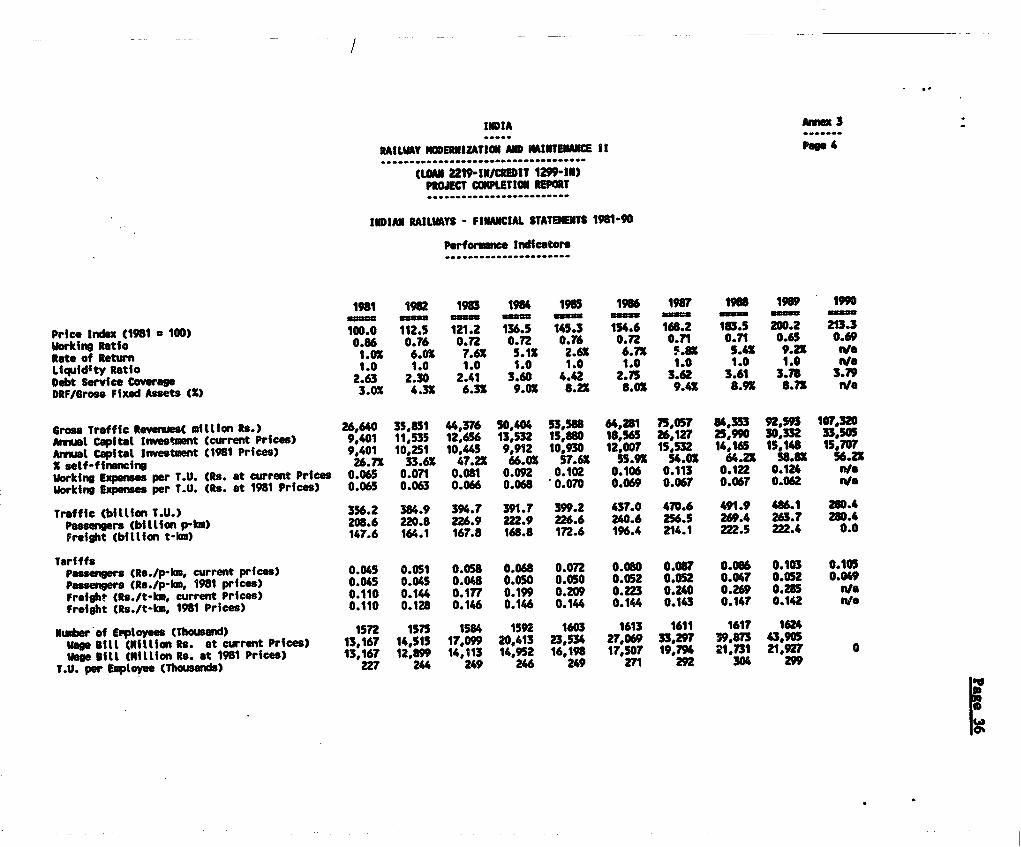
/
INDIA Amex 3
RAILIAY NODERMIZATION AND MAINTENANCE I Pa6e 4....................................
(LOAN 2219-IN/lClDIT 1299-IN)PROJECT CONPLETION REPORT.........................
INDIAN RAILWAYS - FINANCIAL STATEMENTS 1981-90
Performance Indicators
1981 1982 1983 1984 1985 1986 1987 1918 1969 1990usuma - uuuuu 33.33 uuua Sao= _ _ _ _
Price Indox (1981 a 100) 100.0 112.5 121.2 136.5 145.3 154.6 168.2 163.5 200.2 2133
Vorking Ratio 0.86 0.76 0.72 o. 0.76 0.72 0.7 0.71 0.60 0.69
Rate of Return 1.01 6.0X 7.6X 5.1X 2.6X 6.71 .IX 5.4" 9.2X Wa
Liquidity Ratio 1.0 1.0 1.0 1.0 1.0 1.0 1.0 1.0 1.0 we
Debt Sevice Coverage 2.63 2.30 2.41 3.60 4.42 2.7S 3.62 3.61 3.78 3.79
DRF/Sross Fixed Assets (M) 3.01 4.3X 6.3X 9.01 8.21 8.01 9.41 8.9X 8.% nWa
Gross Traffic Revenues( mittlion Rs.) 26,640 35,851 44376 s0,404 53,588 64,281 75,057 i84353 92,593 107,320
Anmsat Capitat tnestmet (current Prices) 9,401 11,535 12,6S6 13,532 1S,880 18,565 26,127 25,990 30,332 33,505
Arnwt Capitat Investent (1981 Prices) 9,401 10,251 10,44S 9,912 10,930 12,007 15,532 14,165 15,148 15,707
X self-financing 26.71 33.61 47.21 66.01 57.61 55.91 54.01 64.21 S8.8X 56.21
Working Expenses per T.U. (Rs. at current Prices 0.065 0.071 0.081 o.0n 0.102 0.106 0.113 0.122 0.124 ni/
working Experses per T.U. (Rs. at 1981 Prices) 0.065 0.063 0.066 0.068 0.070 0.069 0.067 0.067 0.062 niv
Traffic (billfon T.U.) 3S6.2 384.9 394.7 391.7 399.2 437.0 470.6 491.9 486.1 280.4
Passngers (bittion p-km) 208.6 220.8 226.9 2Z.9 226.6 240.6 256.5 269.4 263.7 280.4
Freight (bittlon t-km) 147.6 164.1 167.8 168.8 172.6 196.4 214.1 222.s 222.4 0.0
TariffsPassengers (Rs./p-km, current prices) 0.045 0.051 0.058 0.068 0.072 0.080 0.087 0.086 0.103 0.105
Passeners (Rs./p-km, 1981 prices) 0.045 0.045 0.048 0.050 0.050 0.052 0.052 0.047 0.052 0.049
Freight (Rs./t-km, current Prices) 0.110 0.144 0.177 0.1°9 0.209 0.223 0.240 0.269 0.285 n"/
Freight (Rs./t-km, 1981 Prices) 0.110 0.128 0.146 0.146 0.144 0.144 0.143 0.147 0.142 Nla
NLeber'of Emptoyees (Thousand) 1572 1575 1584 1592 1603 1613 1611 1617 1624
Wage Silt (ittion Rs. at current Prices) 13,167 14,51S 17,099 20.413 23,534 27,069 33,297 39,8n 43,905
Wage Sitt (Mittion Rs. at 1981 Prices) 13,167 12,899 14,113 14,952 16,198 17,507 19.794 21,731 21.92? 0
T.U. per Eptoyee (Thousands) 227 24 249 246 249 271 292 304 299 K

Paae 37
.~~~~~~~~~~~~~~~~u U
* ~~~~~~~~~~~~~~~INDIA
tAILSA? NOERNIZATION AND NAINTNANCE PROJECT It................................................
(LOAN 2210-IN/CREDIT 1299bIN)
PROJECT CONPLETIO REFCRt................. I........
PIMFORNANCE INDICATORS FP12-90
FY2 FY83 FY66 FY85 "F6 FY37 FMY8 FY F90t. TIFFIC ................. ...... ...... ...... ............ ......
Frelght (btb) 164 168 169 173 196 214 m 222 229Ss*urbmn as. (btkan) 44 46 42 44 45 48 52 52 N.Aumk-sub. Puss (btku) 177 181 181 162 19M 208 218 212 U.A
It. TRAFFIC UNITS/ENPLOYEE (000) 244 249 246 249 270 292 304 299 N.A
111. AVAILABILITY (X) - ROAD GAME................... .......................... . ........
Locomotives - Dieset 83.8 83.6 82.2 82.0 81.3 88.1 88.1 89.1 90.7Locomtives - Electric 78.6 76.5 75.9 76.9 79.8 90.5 87.8 90.5 *.AVagons 93.5 92.6 93.5 94.1 94.9 95.4 95.4 95.4 N.APassenger Coaches 84.3 84.9 86.1 86.6 87.4 90.8 89.6 90.8 *.A
IV. LQOCOOTIVE UTILIZATION......................
(km/avail Loco/day-8G)P enpr * Disel 671 664 696 746 764 739 766 7S9 I.APasseer - Eletric 453 458 428 438 448 458 44 482 I.AFreight - Diol 347 364 388 407 416 427 45r 457 "1Freight - Electric 355 380 396 385 395 400 410 405 402
V. WAGON UTILIZATION
km/wagon/day/BG 1112 1123 1112 1150 1296 1420 149 1453 1475
VI. GRO0S TRAILING LOAD PER.............................
Train (tome) 80 1780 1760 1787 1843 1955 1999 2050 2054 N.A
VII. NET TONNE LOAD PER FREIGHTTRAIN (TOINE) SG 911 898 892 922 1001 1031 1053 1042 A.A..........................
VIII. FINANCIAL
Working Ratio 76 72 0.72 0.76 0.72 0.71 0.71 0.65 0.69Rat* of Return 6.0 7.6 5.1 .2.6 6.7 5.8 5.4 9.2. U.A
X self-financing 34 47 66 S8 56 54 6 S9/ 56Debt Service Coverage 2.3 24 3.6 4.4 2.8 3.6 3.6 3.8 3.8