World Bank Document - Documents &...
111
.~~~~~~~~~~~~~~~~~.- ~ ~ ~ ~ ~ ~ ~ ~ ~ ~ ~ ~ ~ ~ - China In'st'itu c nd 6Ioa *p% -. r- * f... -wil~ ~ ~ Public Disclosure Authorized Public Disclosure Authorized Public Disclosure Authorized Public Disclosure Authorized Public Disclosure Authorized Public Disclosure Authorized Public Disclosure Authorized Public Disclosure Authorized
Transcript of World Bank Document - Documents &...
.~~~~~~~~~~~~~~~~~.- ~ ~ ~ ~ ~ ~ ~ ~ ~ ~ ~ ~ ~ ~ -
China In'st'itu c nd 6Ioa
*p% -. r- *
f...
-wil~ ~ ~
Pub
lic D
iscl
osur
e A
utho
rized
Pub
lic D
iscl
osur
e A
utho
rized
Pub
lic D
iscl
osur
e A
utho
rized
Pub
lic D
iscl
osur
e A
utho
rized
Pub
lic D
iscl
osur
e A
utho
rized
Pub
lic D
iscl
osur
e A
utho
rized
Pub
lic D
iscl
osur
e A
utho
rized
Pub
lic D
iscl
osur
e A
utho
rized

A
1wA
j -:'
. _ _,,,_ , _, ,_,_ __. , ,,,__t S -. 4. - 4 :'..- D
)~~~~~~~~4 -4 g
jn'~Zj
tZ;[ a_ 3Z; ~~~~~~~~~~.,:----w x-', - .;=__X

A
Water Conservancy Project
Financed by the World Bank
Environmental Impact
Assessment Report
Implementation agency
Environment Impact Assessment and Research Center of IWHR
Person in Charge of Assessment Institution
Chen Kaiqi
Person in Charge of Project
Chen Kaiqi, Wang Dongsheng
Project Participants:
Wang Dongsheng,Lu Guangsi,Zhu Yao,Chen Kaiqi,Jiang Aichun,Tan Hongwu
Report Compiler
Wang Donghsheng
Report Examiner
Liu Lanfen

I
China: Water Conservation Project
General EIA Report
Table of Contents
1. Generals1.1 Background
1.1.1 Project sense1.1.2 Environmental impact assessment
1.2 Compilation accordance and assessment standard1.2.1 Compilation accordance1.2.2 Assessment standard
1.3 Assessment component, focal point and environmental protection goal1.3.1 Assessment component1.3.2 Assessment scope1.3.3 Assessment focal point1.3.4 Objectives of environmental protection
1.4 Assessment level1.5 Assessment principles1.6 Assessment procedures and planning1.7 Brief of assessment works2. Project situations and project analysis2.1 Project situations
2.1.1 Project name, character and components2.1.2 Project scale and investment2.1.3 Project objectives2.1.4 Project selection criteria2.1.5 Project area distribution
2.2 Project components2.2.1 Water conservancy component2.2.2 Agricultural component2.2.3 Forestry component2.2.4 Management, research and technical assistance2.2.5 Management measures for water saving
2.3 Project analysis2.3.1 Analysis on environment impact of water conservancy project2.3.2 Analysis on environment impact of agricultural project2.3.3 Environment impact of construction process2.3.4 Project impact on water resources utilization, social and economic development
2.4 Identification and preparation of environmental impact factors3. Project area3.1 Natural environment in the project area
3.1.1 Topography3.1.2 Climate3.1.3 Soil and plants
3.1.4 River system3.1.5 Hydrogeography
3.2 Social economic conditions3.2.1 Populations3.2.2 National economy3.2.3 Agricultural production
3.3 Generals for the construction of water conservancy works3.3.1 Generals of constructed water conservancy works3.3.2 Main exist problems during construction of water conservancy works3.3.3 Role of irrigation in agricultural production
4. Present Status of environmental quality and water resources assessment4.1 Pollution sources4.2 Soil quality
4.2.1 Soil fertility4.2.2 Soil heavy metal
4.3 Present situation of surface water quality4.3.1 Water quality of irrigation water sources4.3.2 Irrigation backwater quality in the project area
4.4 Present situation of groundwater quality4.5 Analysis on the present situation of water shortage in the project area
4.5.1 Analysis on the present situation of water shortage in the well-irrigation area4.5.2 Analysis on the present situation of water shortage in the river or/and bank
irrgation area4.6 Conclusions of the present environment in the project area5. Environmental impact assessment and environmental protection measures5.1 Project positive impact on the environment5.2 Analysis on the impact of water saving irrigation on groundwater enviromnent
5.2.1 Level variation and utilization of groundwater in the project area5.2.2 Impact of water saving irrigation on groundwater level
5.3 Impact of fertilizer application on the soil and water environment5.3.1 Fertilizer application situations5.3.2 Main influencing factors to the formation of N03-N in field groundwater5.3.3 Inpact of nitrogenous fertilizer on groundwater pollution under water saving
irrigation5.4 Impacts of pesticide on soil and groundwater
5.4.1 Application of pesticides in the project areas5.4.2 Behavior of pesticide in soil and groundwater5.4.3 Impacts of pesticide on groundwater after project
5.5 Environment impact during construction period5.6 Social impact assessment
5.6.1 The project alleviates the regional conflicts of water supply and demand5.6.2 Impact on rural production method after project5.6.3 Impact on agricultural economy5.6.4 Women's roles in project5.6.5 SIDD's impact on social environment
5.7 Measures to alleviate pollution of pesticide and fertilizer to water environment
5.7.1 Measures to alleviate pollution of pesticide and fertilizer to water environment5.7.2 Measures to alleviate adverse impact during construction period5.7.3 Other environmental issues and control measures
6. Environment benefit analysis6.1 Project financing6.2 Economic benefit analysis
6.2.1 Adjusting crop sort6.2.2 Increase of agricultural/forest production
6.3 Social benefit analysis6.3.1 Disaster alleviation and prevention6.3.2 Mitigation of water right and conflicts6.3.3. Accelerate regional economic development6.3.4 Promote social stable
6.4 Environment benefit analysis6.4.1 Environment benefit of forestry6.4.2 Environment benefit of agriculture6.4.3 Environment benefit of water conservancy
7. Environment monitoring plan and protection and management plan7.1 Environment monitoring plan
7.1.1 Objective7.1.2 Monitoring plan
7.2 Environment protection and management plan7.2.1 Environment management during construction period7.2.2 Environment management during operation period7.2.3 Establishment of special environment management organization7.2.4 Establishment of environment monitoring and report system
8. Public involvement8.1 Survey objects and method8.2 Survey results9. Conclusions and recommendations9.1 Main positive impact9.2 Main adverse impacts and prevention measures9.3 Conclusions and recommendations

I
General
1.1 Background
1.1.1 Project sense
China is an agricultural country with more populations and less cultivated lands whichare always restricted factors for the whole national development. With the economicdevelopment and the increase of populations, solving the issue of feeding more than onebillion population is always a matter of prime importance for the social and economicdevelopment of China. China is also a country with frequent flood and drought disastersand short water resources, even though the total water resources volume takes the sixthplace of the world, its average per capita is only one fourth of that of the world level,making up the 110th place and was designated by the United Nations as one of thethirteen water short countries. The limited water resources is distributed unevenly atspace and time, which are more in the south and less in the north, more in the east andless in the west, more in summer and autumn and less in winter and spring. Thecomposition of water and land resources is non-proportional, the water resources inNorth China where the land area constitutes 60% of the whole country can't makes up20% of that of the whole country and its seasonal and regional water shortage is veryprominent.
On the one hand, the water resources are very short, and on the other hand, they arewasted seriously in agriculture. At present, the utilization factor of irrigation water inChina is only 0.4, however, it can reach 0.8-0.9 in advanced countries, therefore, thereare great potentials for water saving in agriculture in China. If the utilization factor ofirrigation water in the constructed irrigated areas of China can be increased by 0.1-0.2,the annual water saving volume will reach 40-80 billion cubic meters calculated as 400billion cubic meters water consumption in agriculture and this will play an important rolein alleviating the contradictions between water resources supply and demand. At present,the water use efficiency of irrigation water in China is very low, the cereal production percubic meter water can't reach 1.0 kilogram which is less than 50% of that in developedcountries.
On the basis of the "Ninth Five Year Plan of the National Economy and SocialDevelopment and the National Program for Long Term Objective in 2010", the mainobjective in agricultural development in China is to newly increase 20 billion kilogramscereal production in the ninth five years. Irrigation is one of the key factors to realize theabove objective. Developing water saving irrigation is an important way for increasingthe utilization efficiency of irrigation water, the comprehensive agricultural productivityand fanner's income and promoting the sustainable utilization of water resources and thesustainable development of agriculture, it is of great significance in water short districts.
In order to raise enough funds, the state planed to borrow loan from the World Bank todevelop water saving irrigation projects in Hebei, Beijing, Shenyang and Qingdao fourprovinces and municipalities, meanwhile, undertake the construction of agriculturalmodification and corollary projects.
1.1.2 Environmental impact assessment
According to the "Notice for Strengthening the Management of Environmental ImpactAssessment in International Financial Organization Loan Project" and the "Guideline forEnvironmental Impact Assessment of the World Bank (OP4.01)", China Institute forWater Resources and Hydropower Research (IWHR) accepted the entrustment from theComprehensive Agricultural Development Office (CADO) to undertake theenvironmental impact assessment of the project in July 1999, finished the compilation ofthe environmental impact assessment outline at the end of August 1999 and passed thereview by the departments in chief of the State's Environmental Protection Bureau. Itcarried out project investigation immediately after that, collected data from all sides andmade the environmental impact assessment.
T-his project is a modification for irrigation technologies, perfect the irrigationinstallations on the basis of the former irrigated area and won't exploit new watersources. Its aim is to increase the utilization factor of water resources, promote thevirtuous circle of agricultural ecological environment and realize the sustainabledevelopment of agricultural production. Therefore, water conservation project is anenvironmental improvement project to a great extent.
The project areas are located in the northern districts of China with frequent flood anddrought disasters and weak agricultural ecological environment. Since the foundation ofthe People's Republic of China, large-scale water conservancy and agriculturalconstructions had been carried out and the agricultural ecological environment had beenimproved to a certain extent, however, some issues also occurred with that. Theexcessive extraction of water resources in some districts had resulted in the shriveling ofriver channels and the descent of groundwater level and the large quantity application offertilizer and pesticide had led to the soil and water environment pollution. Resolvingthese issues is a new task and a higher requirement to water conservancy provided for thesustainable development of agriculture.
Because these project areas are located in the extensive rural areas of China and theirdistribution is wide and scattered, their basis for environmental monitoring research isvery weak, especially they are short of available data of groundwater environment, whichis the focal and difficult point of the assessment. Moreover, the theoretical research onthe impact of fertilizer on soil and water environment is still in the preliminary stage andit's more difficult in practical use. Therefore, we consulted a lot of data in research,broadly used the domestic and external relevant theories and methods for reference andfocused on more detailed discussion and analysis on the impact of water saving irrigationon groundwater level, the activities of pesticide and fertilizer in soil and groundwater and
2
the impact of water saving irrigation on groundwater environment. We made a detailedassessment to Hebei, Qingdao, Beijing and Shenyang project areas.
1.2 Compilation accordance and assessment standard
1.2.1 Compilation accordance
Some relevant laws and regulations of environmental protection
"Environmental Protection Laws of PRC" (26th Dec. 1989)"Water Laws of PRC" (5 th Sep. 1987)"Water Pollution Control Laws of PRC" (1 1 th May 1984)No. (98) 253 of the State Council "Environmental Protection Rules for ConstructionProject""Notice for Strengthening the Management of Enviromnental Imnpact Assessment inInternational Financial Organization Loan Project" 1993 324 issued by the State'sEnvironmental Protection Bureau, the Planning Commission, the Financial Ministry andthe People's Bank of China"Guideline for Environmental Impact Assessment of the World Bank (OP4.01)""Instructions for Environmental Impact Assessment" (HJ/T 2.2-2.3-93)
Some relevant documents and reports
The entrustment book of environmental impact assessment for the WB Financed WaterConservancy ProjectThe Project Implementation Plan of the WB Financed Water Conservancy Project issuedby CADOPIP report of WB Financed Water Conservancy ProjectHebei province PIP reportBeijing municipality PIP reportQingdao municipality PIP reportShenyang municipality PIP report
1.2.2 Assessment standard
"Standard for Field Irrigation Water Quality" (GB5084-92)"Standard for Surface water quality"(GB3838-88)
"Standard for Groundwater Quality" (GB/T14848-93)"Standard for Soil Environment" (GB15618-95)
The above standards can be carried out according to the environment role in differentproject areas
3
1.3 Assessment component, assessment focal point and environmental protectiongoal
1.3.1 Assessment component
*Analysis on the impact of the project implementation on environmental protection-Present status of environmental quality*Impact of water resources utilization on water environment-Analysis on the impact of pesticide and fertilizer on soil and water environment*Environmental impact assessment in construction period-Impact of the project implementation on social economic development*The public's evaluation to the project* Countermeasures on environmental protection*Investment for environmental protection and profit analysis*Program for environmental management and monitoring
1.3.2 Assessment scope and period
T-he construction scope of the project is the assessment scope, the assessment period ismainly the operation period of the project and brief assessment was made in theconstruction period of the project.
1.3.3 Assessment focal point
The project mainly involves water body environment. It will have no atmosphere andsolid waste influence basically except there are some partial and periodic light machinerynoises and dust. Therefore, the main impact that the project involves is waterenvironment.
There are no sensitive environmental protection objectives in these project areasaccording to the regional environmental function division and environmental protectionplaning of each province and municipality. These project areas are located in the water-deficient areas of the North of China, groundwater has shown a tendency of overdraft,the continuous descent of groundwater level and the continuous expansion of funnel areaare the main regional environmental problems. If the implementation of the project willaggravate the shortage of water resources, especially in areas where groundwater is themain irrigation water sources, if the implementation of the project will lead to oraggravate the continuous descent of groundwater level is the focal point of theassessment.
In order to increase the yield of agricultural production, it's anticipated that the appliedamnount of pesticide and fertilizer will increase for the regulation of planting structures, ifpesticide and fertilizer will pollute the soil and water environment is another assessmentfocal point.
4
Because the project focuses on increasing the utilization factor of water resources, theimplementation of the project will exert positive impact on the rational use of waterresources and the socio-economic development in the beneficiary areas. We will focallyanalyze the positive impact of the implementation of the project on resources,environment, society and economy.
1.3.4 Objectives of environmental protection
Because most of the project areas are irrigated with groundwater, the essential objectiveto be protected is concentrated mainly on groundwater environment.
The implementation of water saving irrigation should balance water resources supply anddemand and needn't result in the continuous descent of groundwater level and thecontinuous expansion of funnel area.
Adopting effective measures to apply pesticide and fertilizer rationally and ensuring notto aggravate groundwater and other environmental pollution.
1.4 Assessment level
The construction of the project focuses on the utilization of water resources, the desiredeffect for the construction of the project is that it can increase the utilization factor ofwater resources and reduce the waste of irrigation water looking from the overall andlong-term point of views. It's an environment improvement project with respect to theimpact of agricultural production on water resources. The adverse impacted scope anddegree of the project on enviromnent is limited according to the principles for leveldivision from the Environmental Monitoring Document No. [1993] 324 and the WorldBank (OP4.01). So the environmental assessment level of the project is B, however, thecontinuous descent of groundwater level and the continuous expansion of funnel area insome regions are the focus of the project. Therefore, assessment on the implementationof the project on the impact of the descent of groundwater level and groundwater qualitywill be strengthened both in depth and breadth.
1.5 Assessment principles
The environmental impact assessment of the project will enforce the laws, regulationsand some relevant standards for enviromnental protection of the state, meet thestipulations and demands on environmental impact assessment in International FinancialOrganization Loan Project and the demand for depth and assessment component in the"Guideline for Environmental Impact Assessment of the World Bank (OP4.01)".
Analyzing the project's possible environment impact according to the feasibility studyreport from each project area, carrying out assessment through typical investigation,analogy, reasoning and conclusion etc. methods and demonstrating the feasibility of theproject and the rationality of the drafted environmental protection measures in view of
5
environmental protection.
Because these project areas are broad and scattered and the impact of the adoption ofsprinkler irrigation, micro irrigation, drip irrigation, pipe irrigation and canal lining etc.measures, the change of crops and water duty and the application of pesticide andfertilizer etc. many factors, the assessment objective is regional environmental impactand realize the integration from point to surface and focal analysis in methods.
1.6Assessment procedures and planing
The assessment planing and working procedures of the project is shown in chart 1.
1.7 Assessment work and introduction of the assessment department
The environmental impact assessment of the water conservation project can be made bytwo gradations, i.e. compiling and completing each provincial and municipalenvironmental impact assessment report and then completing the general report of theenvironmental impact assessment. The environmental impact assessment report of eachprovince and municipality was completed directed by China Institute for WaterResources and Hydropower Research (IWHR) and assisted by each provincial andmunicipal relevant department and the general report of the environmental impactassessment was completed by IWHR.
China Institute for Water Resources and Hydropower Research (IWHR) has the firstlevel environmental impact assessment certificate issued by the State's EnvironmentalProtection Bureau. She is a multi-purpose institute engaging in the assessment of waterconservation and electric power etc. resources, environmental protection and engineeringconstruction, she has directed and participated in many environmental impactassessments of water conservation, electric power, agriculture and regional development.
(to be finalized)
Chart 1 assessment program
2 Project situations and project analysis
2.1 Project situations
2.1.1 Project name and characterProject name: Water Conservation ProjectProject character: agricultural infrastructure constructionProject liable department: Comprehensive Agricultural Development OfficeProject component: the water conservation project will include the following components
6
in the light of the World Bank's purpose and in association with the actual conditions ofthe five project areas:-Water conservation: mainly include developing canal lining, low pressure pipe
irrigation, sprinkler irrigation and drip irrigation four water saving irrigation projects.-Agriculture: it will adopt agricultural water saving measures, such as soil improvement,
seed production, extension of agricultural technology and training, pest and diseasecontrol and purchase of agro-machinery etc.
Forestry and environmental protection: forestry and environmental protection projectwas planed such as construction of field forest shelter and monitoring of groundwaterlevel, water quality and soil in order to improve the ecological environment.
Institutional development and support: mainly include technical assistance, training,study tours, applied research, SIDD and MIS in order to coordinate with the waterconservation and agricultural water saving measures, strengthen the water savingmanagement measures in the project- areas and improve the scientific managementlevel.
2.1.2 Project scale and investment
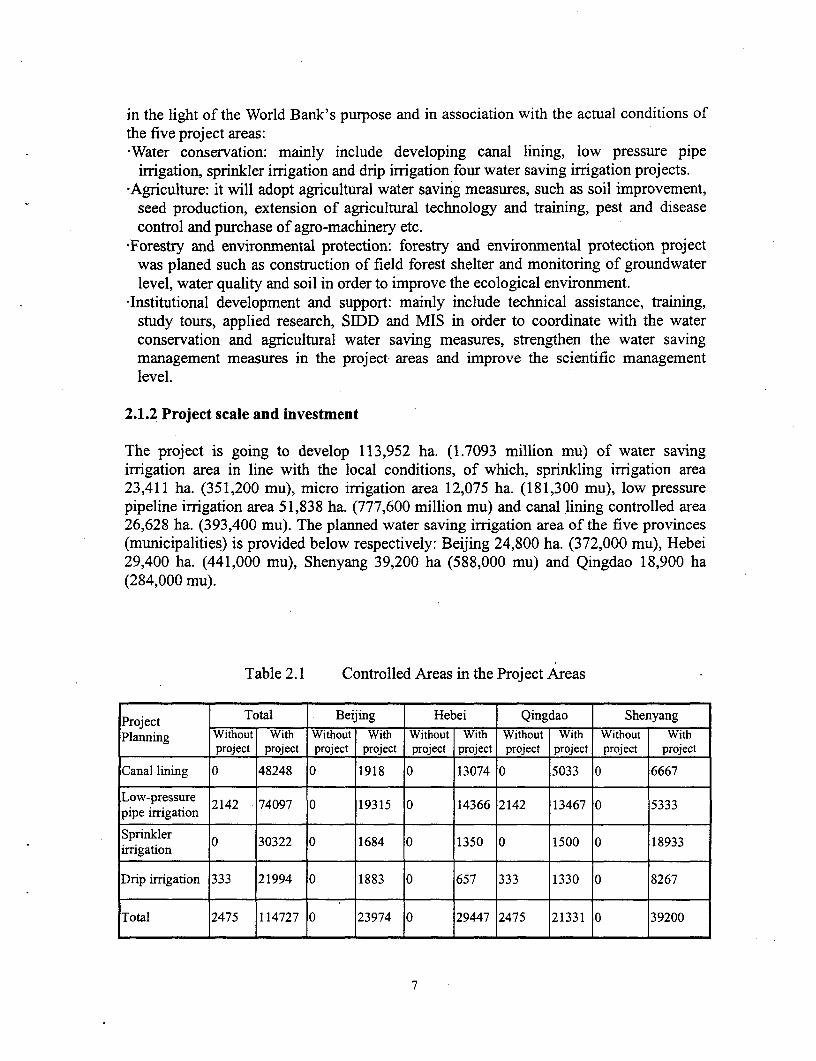
The project is going to develop 113,952 ha. (1.7093 million mu) of water savingirrigation area in line with the local conditions, of which, sprinkling irrigation area23,411 ha. (351,200 mu), micro irrigation area 12,075 ha. (181,300 mu), low pressurepipeline irrigation area 51,838 ha. (777,600 million mu) and canal lining controlled area26,628 ha. (393,400 mu). The planned water saving irrigation area of the five provinces(municipalities) is provided below respectively: Beijing 24,800 ha. (372,000 mu), Hebei29,400 ha. (441,000 mu), Shenyang 39,200 ha (588,000 mu) and Qingdao 18,900 ha(284,000 mu).
Table 2.1 Controlled Areas in the Project Areas
Project Total Beijing Hebei Qingdao ShenyangPlanning Without With Without With Without With Without With Without With
project project project project project project project project project project
Canal lining 0 48248 0 1918 0 13074 0 5033 0 6667
Low-pressure 2142 74097 0 19315 0 14366 2142 13467 0 5333pipe irrigation
Sprinkler 0 30322 0 1684 0 1350 0 1500 0 18933irrigation
Drip irrigation 333 21994 0 1883 0 657 333 1330 0 8267
Total 2475 114727 0 23974 0 29447 2475 21331 0 39200
7
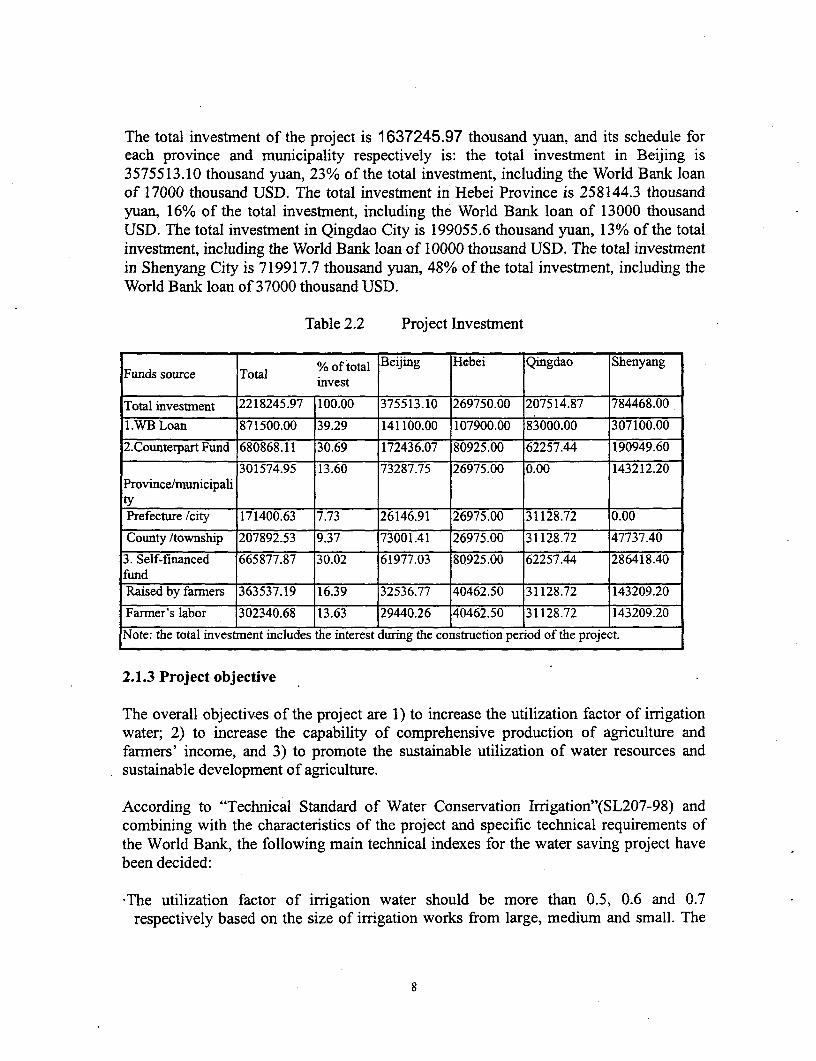
The total investment of the project is 1637245.97 thousand yuan, and its schedule foreach province and municipality respectively is: the total investment in Beijing is3575513.10 thousand yuan, 23% of the total investment, including the World Bank loanof 17000 thousand USD. The total investment in Hebei Province is 258144.3 thousandyuan, 16% of the total investment, including the World Bank loan of 13000 thousandUSD. The total investment in Qingdao City is 199055.6 thousand yuan, 13% of the totalinvestment, including the World Bank loan of 10000 thousand USD. The total investmentin Shenyang City is 719917.7 thousand yuan, 48% of the total investment, including theWorld Bank loan of 37000 thousand USD.
Table 2.2 Project Investment
Funds source Total % of total Beijing Hebei Qingdao Shenyanginvest
Total investment 2218245.97 100.00 375513.10 269750.00 207514.87 784468.00
1.WB Loan 871500.00 39.29 141100.00 107900.00 83000.00 307100.00
2.Counterpart Fund 680868.11 30.69 172436.07 80925.00 62257.44 190949.60
301574.95 13.60 73287.75 26975.00 0.00 143212.20Province/municipali
Prefecture /city 171400.63 7.73 26146.91 26975.00 31128.72 0.00
County /township 207892.53 9.37 73001.41 26975.00 31128.72 47737.40
3. Self-financed 665877.87 30.02 61977.03 80925.00 62257.44 286418.40fundRaised by farrners 363537.19 16.39 32536.77 40462.50 31128.72 143209.20
Farmer's labor 302340.68 13.63 29440.26 40462.50 31128.72 143209.20
Note: the total investment includes the interest during the construction period of the project.
2.1.3 Project objective
The overall objectives of the project are 1) to increase the utilization factor of irrigationwater; 2) to increase the capability of comprehensive production of agriculture andfarmers' income, and 3) to promote the sustainable utilization of water resources andsustainable development of agriculture.
According to "Technical Standard of Water Conservation Irrigation"(SL207-98) andcombining with the characteristics of the project and specific technical requirements ofthe World Bank, the following main technical indexes for the water saving project havebeen decided:
-The utilization factor of irrigation water should be more than 0.5, 0.6 and 0.7respectively based on the size of irrigation works from large, medium and small. The
8
utilization factor of water by different irrigation patterns should be more than 0.80-0.85for well irrigation, 0.85 for sprinkling irrigation and 0.9 for drip irrigation.
*The productivity of water should be increased at least by 20% and the cerealproductivity per unit ET is more than 1.5-1.8 kg/m3.
*The water saving volume in diversion is more than 20%.-The target of production increase of cereal and cotton: The production increase of grain
and cotton is more than 15%.*The target of revenue increase of farmers: The net revenue increase per farmer is more
than 200 Yuan.-Economic and financial indexes: The financial IRR is more than 12% and the rate of
benefits and cost is more than 2:1 considering the risk analysis.
2.1.4 Project selection criteria
According to the strategic layout of the national development plan of water savingirrigation, part of project counties located in the northern, northeast and northwest ofChina where the water resources is insufficient have been selected. Project areas areselected among the best according to the local financial capability, the initiative of localgovernments and farmers, the amount of loan from the WB and the overall planning. Thebasic principles for project selection are as follows:
*The region should be lack of water resources, Water saving irrigation is badly needed foragriculture sustainable development; local government and farmers have high initiativefor the technology of water saving irrigation development. The contradiction regionalwater resources supply and demand could be alleviated through the development of watersaving irrigation.
-The selected project area should have a certain foundation of irrigation works andbasically guarantee for flood control, drainage, water source for irrigation and usuallykey engineering works are need not to be constructed. The construction of the projectshould take the following contents of technical improvement, tapping the potential ofexisting system, completing the irrigation facilities below laterals, spreading thetechnology of water saving irrigation and establishing modernized, water conservationand high efficiency agricultural region as the main.
-In recent years, it has gained a certain experiences and laid a certain foundation on watersaving irrigation. Pilot areas for water saving irrigation have been set up. There aregroups of technicians who are familiar with the technology of water saving irrigation andcan guide farmers to work and manage the project.
-The socialized service system of agriculture and irrigation is completed. The infra-structural facilities and means of seed production, agro- machinery, pest and diseasecontrol and drought-relief service are fairly good and it is not necessary to input moreagricultural measures. The level of scientific farming of farmers is relatively higher andthe consciousness of market economy and commodity is strong.
9
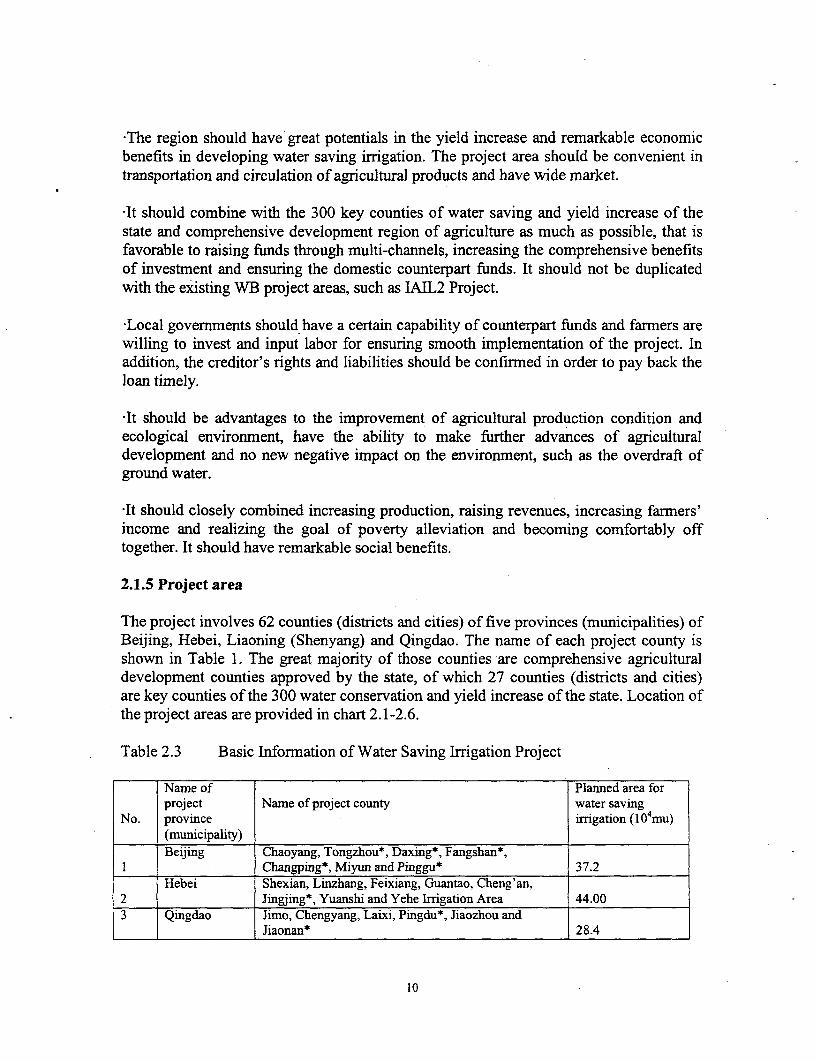
*The region should have' great potentials in the yield increase and remarkable economicbenefits in developing water saving irrigation. The project area should be convenient intransportation and circulation of agricultural products and have wide market.
-It should combine with the 300 key counties of water saving and yield increase of thestate and comprehensive development region of agriculture as much as possible, that isfavorable to raising funds through multi-channels, increasing the comprehensive benefitsof investment and ensuring the domestic counterpart funds. It should not be duplicatedwith the existing WB project areas, such as IAIL2 Project.
-Local governments should have a certain capability of counterpart funds and farmers arewilling to invest and input labor for ensuring smooth implementation of the project. Inaddition, the creditor's rights and liabilities should be confirmed in order to pay back theloan timely.
-It should be advantages to the improvement of agricultural production condition andecological enviromnent, have the ability to make further advances of agriculturaldevelopment and no new negative impact on the environment, such as the overdraft ofground water.
It should closely combined increasing production, raising revenues, increasing farmers'income and realizing the goal of poverty alleviation and becoming comfortably offtogether. It should have remarkable social benefits.
2.1.5 Project area
The project involves 62 counties (districts and cities) of five provinces (municipalities) ofBeijing, Hebei, Liaoning (Shenyang) and Qingdao. The name of each project county isshown in Table 1. The great majority of those counties are comprehensive agriculturaldevelopment counties approved by the state, of which 27 counties (districts and cities)are key counties of the 300 water conservation and yield increase of the state. Location ofthe project areas are provided in chart 2.1-2.6.
Table 2.3 Basic Information of Water Saving Irrigation Project
Name of Planned area forproject Name of project county water saving
No. province irrigation (104mu)(municipality)Beijing Chaoyang, Tongzhou*, Daxing*, Fangshan*,
2 Changping*, Miyun and Pinggu* 37.2Hebei Shexian, Linzhang, Feixiang, Guantao, Cheng'an,
2 Jingjing*, Yuanshi and Yehe Irrigation Area 44.003 Qingdao Jimo, Chengyang, Laixi, Pingdu*, Jiaozhou and
Jiaonan* 28.4
10
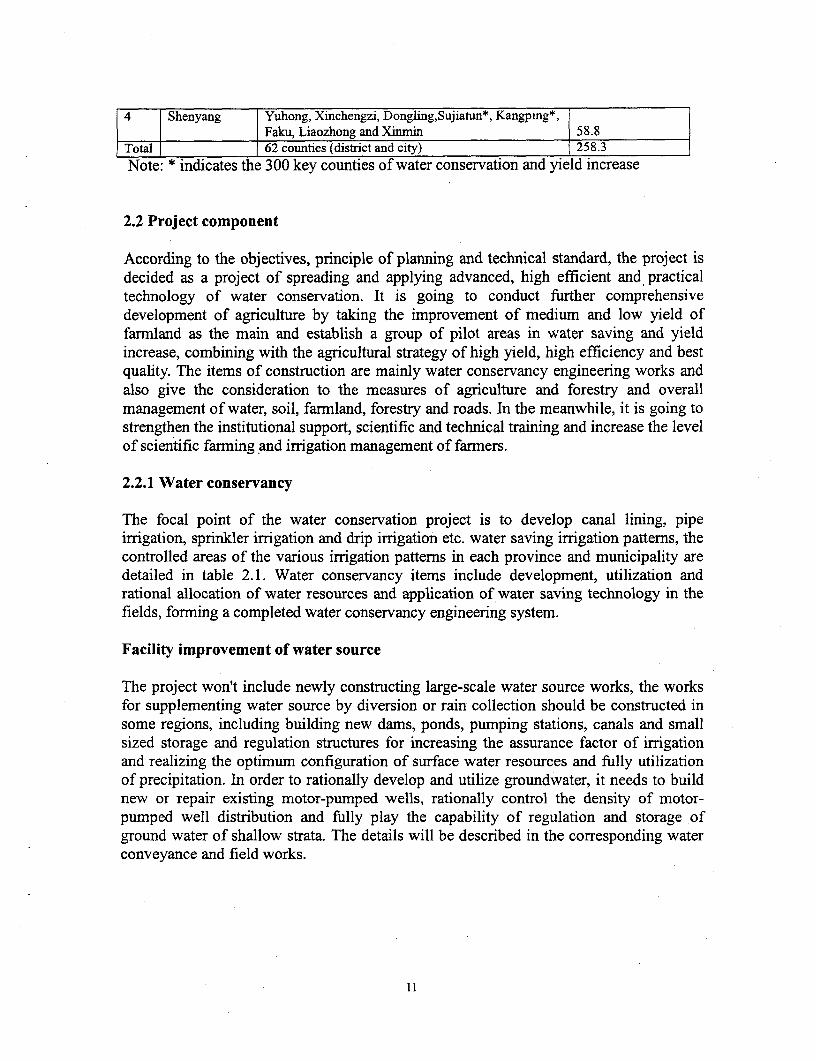
4 Shenyang Yuhong, Xinchengzi, Dongling,Sujiatun*, Kangping*,Faku, Liaozhong and Xinnin 58.8
Total 62 counties (district and city) 258.3Note: * indicates the 300 key counties of water conservation and yield increase
2.2 Project component
According to the objectives, principle of planning and technical standard, the project isdecided as a project of spreading and applying advanced, high efficient and practicaltechnology of water conservation. It is going to conduct further comprehensivedevelopment of agriculture by taking the improvement of medium and low yield offarmland as the main and establish a group of pilot areas in water saving and yieldincrease, combining with the agricultural strategy of high yield, high efficiency and bestquality. The items of construction are mainly water conservancy engineering works andalso give the consideration to the measures of agriculture and forestry and overallmanagement of water, soil, farmland, forestry and roads. In the meanwhile, it is going tostrengthen the institutional support, scientific and technical training and increase the levelof scientific farming and irrigation management of farmers.
2.2.1 Water conservancy
The focal point of the water conservation project is to develop canal lining, pipeirrigation, sprinkler irrigation and drip irrigation etc. water saving irrigation patterns, thecontrolled areas of the various irrigation patterns in each province and municipality aredetailed in table 2.1. Water conservancy items include development, utilization andrational allocation of water resources and application of water saving technology in thefields, forming a completed water conservancy engineering system.
Facility improvement of water source
The project won't include newly constructing large-scale water source works, the worksfor supplementing water source by diversion or rain collection should be constructed insome regions, including building new dams, ponds, pumping stations, canals and smallsized storage and regulation structures for increasing the assurance factor of irrigationand realizing the optimum configuration of surface water resources and fully utilizationof precipitation. In order to rationally develop and utilize groundwater, it needs to buildnew or repair existing motor-pumped wells, rationally control the density of motor-pumped well distribution and fully play the capability of regulation and storage ofground water of shallow strata. The details will be described in the corresponding waterconveyance and field works.
11
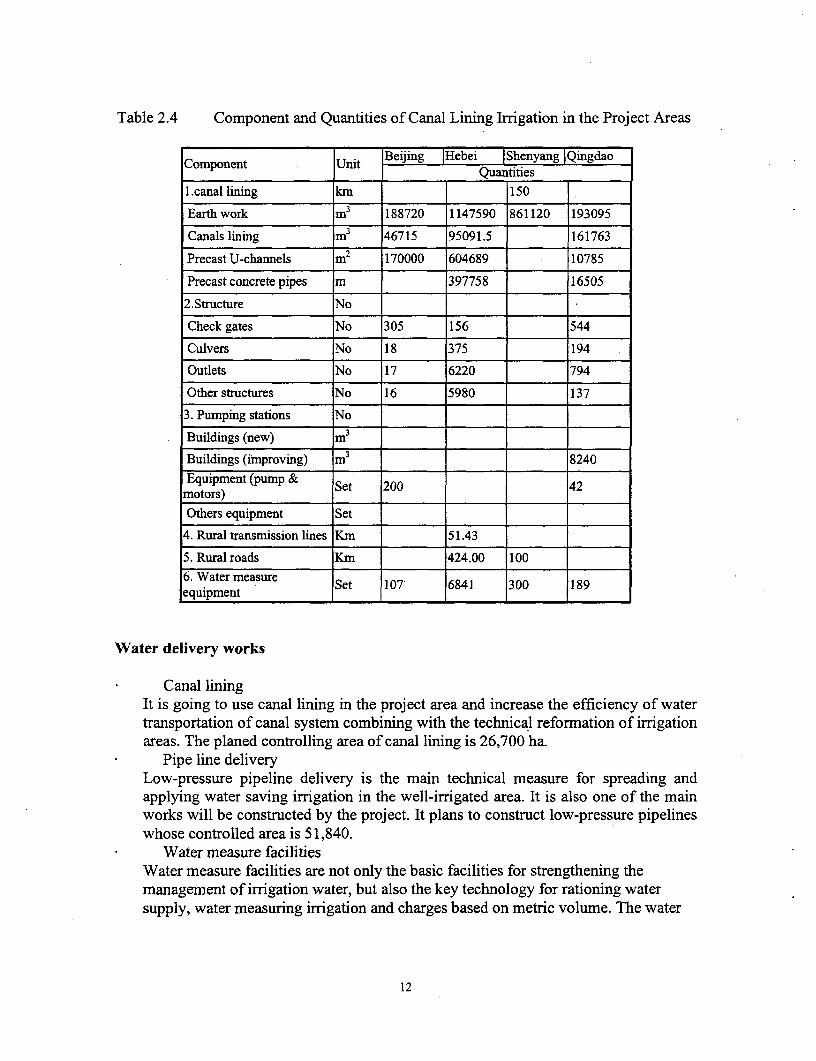
Table 2.4 Component and Quantities of Canal Lining Irrigation in the Project Areas
Component Unit Beijing IHebei iShenyang QingdaoQuantities
l.canal lining km 150
Earth work m3 188720 1147590 861120 193095
Canals lining i 3 46715 95091.5 161763
Precast U-channels m2 170000 604689 10785
Precast concrete pipes m 397758 16505
2.Structure No
Check gates No 305 156 544
Culvers No 18 375 194
Outlets No 17 6220 794
Other structures No 16 5980 137
3. Pumping stations No
Buildings (new) m3
Buildings (improving) M3 8240
Equipment (pump & Set 200 42m otors)__ _ _ __ _ _ _ __ _ _ _ __ _ _ _ __ _ _ _
Others equipment Set
4. Rural transmission lines Km 51.43
5. Ruralroads Km 424.00 100
6. Water measureequipment Set 107 6841 300 189
Water delivery works
Canal liningIt is going to use canal lining in the project area and increase the efficiency of watertransportation of canal system combining with the technical reformation of irrigationareas. The planed controlling area of canal lining is 26,700 ha.
Pipe line deliveryLow-pressure pipeline delivery is the main technical measure for spreading andapplying water saving irrigation in the well-irrigated area. It is also one of the mainworks will be constructed by the project. It plans to construct low-pressure pipelineswhose controlled area is 51,840.
Water measure facilitiesWater measure facilities are not only the basic facilities for strengthening themanagement of irrigation water, but also the key technology for rationing watersupply, water measuring irrigation and charges based on metric volume. The water
12
measuring facilities such as Partial flume, wide crest weir, triangular weir or smallsized sluice gate system can be used in the fields.
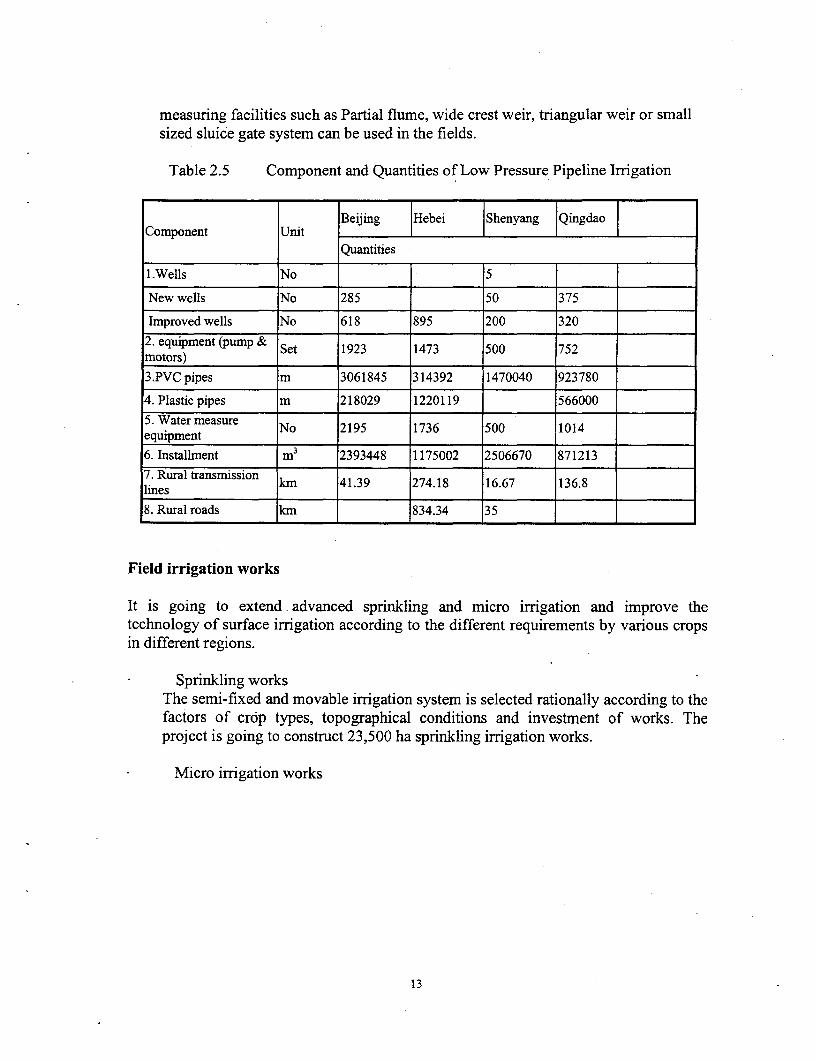
Table 2.5 Component and Quantities of Low Pressure Pipeline Irrigation
Beijing |Hebei IShenyang |QingdaoT|Component Unit I_I_I_I
Quantities
I.Wells No 5
New wells No 285 50 375
Improved wells No 618 895 200 3202. equipment (pump & Set 1923 1473 500 752motors)3.PVC pipes m 3061845 314392 1470040 923780
4. Plastic pipes m 218029 1220119 566000
.Water measure No 2195 1736 500 1014equipment_
6. Installment M3 2393448 1175002 2506670 8712137. Rural transmission km 41.39 274.18 16.67 136.8lines ______
8. Rural roads km 834.34 35
Field irrigation works
It is going to extend advanced sprinkling and micro irrigation and improve thetechnology of surface irrigation according to the different requirements by various cropsin different regions.
Sprinkling worksThe semi-fixed and movable irrigation system is selected rationally according to thefactors of crop types, topographical conditions and investment of works. Theproject is going to construct 23,500 ha sprinkling irrigation works.
Micro irrigation works
13
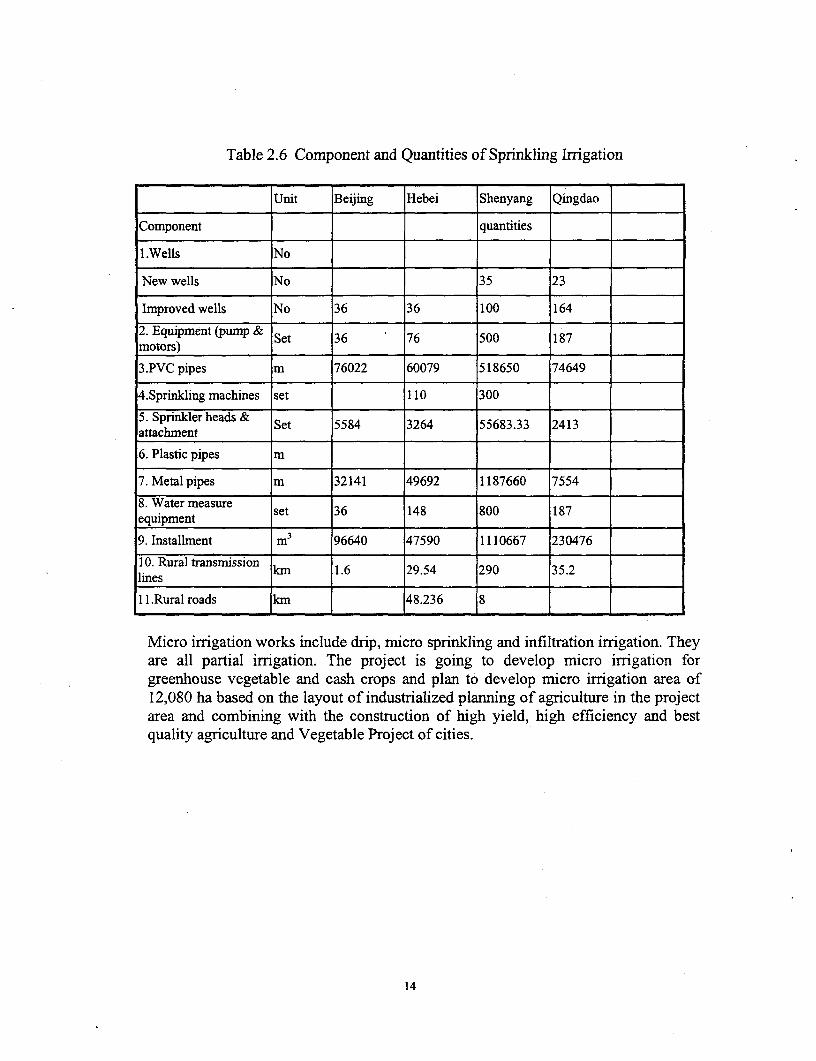
Table 2.6 Component and Quantities of Sprinkling Irrigation
Unit Beijing Hebei Shenyang Qingdao
Component quantities
l .Wells No
New wells No 35 23
Improved wells No 36 36 100 164
2. Equipment (pump & Set 36 76 500 187motors)
3.PVC pipes m 76022 60079 518650 74649
4.Sprinlcing machines set 110 300
5. Sprinkler heads & Set 5584 3264 55683.33 2413attachment
6. Plastic pipes m
7. Metal pipes m 32141 49692 1187660 7554
8. Water measure set 36 148 800 187equipment
9. Installment m3 96640 47590 1110667 230476
10. Rural transmission km 1.6 29.54 290 35.2lines__ _ _ ___ _ _ _ _ _ _ _ _ _ _ _
I I.Rural roads km 48.236 8
Micro irrigation works include drip, micro sprinkling and infiltration irrigation. Theyare all partial irrigation. The project is going to develop micro irrigation forgreenhouse vegetable and cash crops and plan to develop micro irrigation area of12,080 ha based on the layout of industrialized planning of agriculture in the projectarea and combining with the construction of high yield, high efficiency and bestquality agriculture and Vegetable Project of cities.
14

Table 2.7 Component and Quantities of Drip Irrigation
Component Unit Beijing Hebei Shenyang Qingdao
I .Wells No. quantities
New wells No. 36 10 40
Improved wells No. 8 12 60 35
2. Equipment (pump & motors) Set 203 56 530 256
3.aPrnaryequipment& Set 6690 71 530 956attachment _ _ _ _ _ __ _ _ _ _
4.Main/branch pipes m 629488 430730 216402
5. Fieldpipes m 12052541 3766496 84038 4219421
6.Water measure equipment Set 249 98 61450 641
7. Installment m3 691350 275500 4E+06 256838
9.Rural transmission lines Km 1.02 33.308 16.67 13.74
10. Rural roads Km 28.712 5
Improving the technology of surface irrigationThe main measures for improving the technology of surface irrigation are asfollows: 1) land leveling; 2) to design the size of rectangular plots in field or thelength of ditches rationally according to the discharge of irrigation; and 3) tostrengthen the management of irrigation and control irrigation time based onirrigation water demand. The project is going to introduce the technology of laserland leveling and develop leveled border irrigation. The technology of filmcovering irrigation, such as cotton or wide row crops will be extended. 48,000 ha.(720,000 mu) improved surface irrigation technology is planed to be applied andextended in the project.
2.2.2 Agricultural Support & Service
Relevant agricultural technologies are to be adopted according to natural features andcrop type in different regions:
15
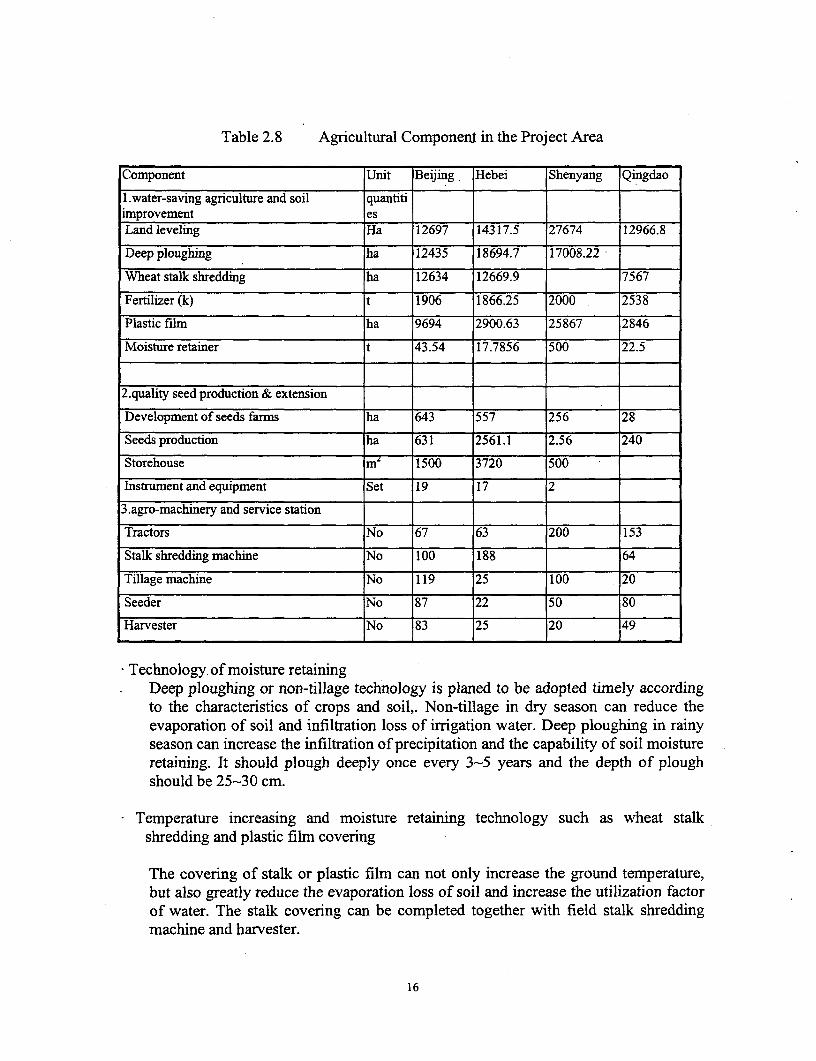
Table 2.8 Agricultural Componernt in the Project Area
Component Unit Beijing Hebei Shenyang Qingdao
1.water-saving agriculture and soil quantitiimprovement esLand leveling Ha 12697 14317.5 27674 12966.8
Deep ploughing ha 12435 18694.7 17008.22
Wheat stalk shredding ha 12634 12669.9 7567
Fertilizer (k) t 1906 1866.25 2000 2538
Plastic film ha 9694 2900.63 25867 2846
Moisture retainer t 43.54 17.7856 500 22.5
2.quality seed production & extension
Development of seeds farms ha 643 557 256 28
Seeds production ha 631 2561.1 2.56 240
Storehouse mi 1500 3720 500
Instrument and equipment Set 19 17 2
3.agro-machinery and service station
Tractors No 67 63 200 153
Stalk shredding machine No 100 188 64
Tillage machine No 119 25 100 20
Seeder No 87 22 50 80
Harvester No 83 25 20 49
Technology of moisture retainingDeep ploughing or non-tillage technology is planed to be adopted timely accordingto the characteristics of crops and soil,. Non-tillage in dry season can reduce theevaporation of soil and infiltration loss of irrigation water. Deep ploughing in rainyseason can increase the infiltration of precipitation and the capability of soil moistureretaining. It should plough deeply once every 3-5 years and the depth of ploughshould be 25-30 cm.
Temperature increasing and moisture retaining technology such as wheat stalkshredding and plastic film covering
The covering of stalk or plastic film can not only increase the ground temperature,but also greatly reduce the evaporation loss of soil and increase the utilization factorof water. The stalk covering can be completed together with field stalk shreddingmachine and harvester.
16

* Comprehensive management technology of water and fertilizerAccording to water and fertilizer demand, it will adopt the method of applyingfertilizer through soil measuring and formula for balance fertilizer application. Themethod of deep applying and increasing the utilization ratio of fertilizer arerecommended.
* Rationally regulating the planting structure of cropsAccording to the requirements of industrialized agriculture and in order to meetsocial demands and achieve the optimum economic and ecological benefits, planingstructure of crops should be regulated rationally and the multiple crop index shouldbe increased. In the regions where advanced irrigation technologies have adoptedand the assurance coefficient of irrigation is higher should enlarge the plantingproportion of cash crops for increasing economic benefits and farmers income.
* Seed selection and cultivation technology of drought-resistance cropsSeed base will be established to select and cultivate fine varieties of drought-resistance and high yield and realize the ratio of fine varieties in the project areasreaching at least 95%. Advanced cultivation technology and in association withmoisture retaining technology to realize biological water conservation.
2.2.3 Forestry
Table 2.9 Component of Forestry
Beijing Hebei Qingdao ShenyangComponent unit without With Without With Without With Without With
project project project project project project project project
I. field forest shelter
Protected area ha 24799.5 24799.5 29447.0 29447.0 21330.7 21330.7 39200.0 39200.0
Deserved area ha 1532.35 1668.25 1231.60 1231.60 1712.00 1712.00 232.80 232.80
Present area ha 1245.50 923.17 1089.70 0.00 1048.59
Planed area ha 410.45 308.43 622.30
2. soil and waterconservation forest
Deserved area ha 21890.1 21890.1 4586.00 4586.00 1141.00 1391.00
Present area ha 17668.4 4506.00 1376.00 146.34
Planed area ha 4221.70 80.00 15.00
3. fruit tree
Present area ha 4589.91 26.80 1663.00 800.00
Planed area ha 167.00 800.00
4. nursery _
17
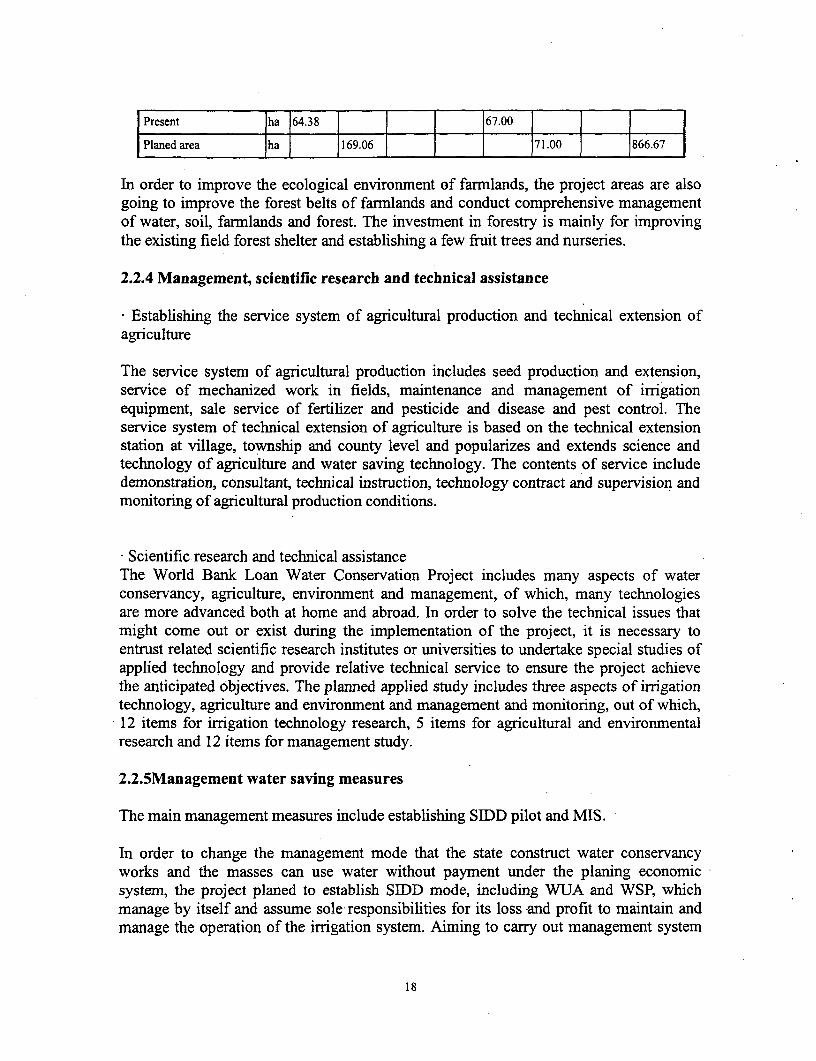
Present |ha |64.38 | l 67.00 |
Planed area ha 169.06 71.00 866.67
In order to improve the ecological environment of farmlands, the project areas are alsogoing to improve the forest belts of farmlands and conduct comprehensive managementof water, soil, farmlands and forest. The investment in forestry is mainly for improvingthe existing field forest shelter and establishing a few fruit trees and nurseries.
2.2.4 Management, scientific research and technical assistance
* Establishing the service system of agricultural production and technical extension ofagriculture
The service system of agricultural production includes seed production and extension,service of mechanized work in fields, maintenance and management of irrigationequipment, sale service of fertilizer and pesticide and disease and pest control. Theservice system of technical extension of agriculture is based on the technical extensionstation at village, township and county level and popularizes and extends science andtechnology of agriculture and water saving technology. The contents of service includedemonstration, consultant, technical instruction, technology contract and supervision andmonitoring of agricultural production conditions.
* Scientific research and technical assistanceThe World Bank Loan Water Conservation Project includes many aspects of waterconservancy, agriculture, environment and management, of which, many technologiesare more advanced both at home and abroad. In order to solve the technical issues thatmight come out or exist during the implementation of the project, it is necessary toentrust related scientific research institutes or universities to undertake special studies ofapplied technology and provide relative technical service to ensure the project achievethe anticipated objectives. The planned applied study includes three aspects of irrigationtechnology, agriculture and environment and management and monitoring, out of which,12 items for irrigation technology research, 5 items for agricultural and environmentalresearch and 12 items for management study.
2.2.5Management water saving measures
The main management measures include establishing SIDD pilot and MIS.
In order to change the management mode that the state construct water conservancyworks and the masses can use water without payment under the planing economicsystem, the project planed to establish SIDD mode, including WUA and WSP, whichmanage by itself and assume sole responsibilities for its loss -and profit to maintain andmanage the operation of the irrigation system. Aiming to carry out management system
18
reform, improve the management of water resources, increase irrigation costs recovery,the autonomous management capacity and increase the irrigation efficiency of the wholeproject.
MIS is mainly used in computer system for design, construction, management,supervision and assessment of the project, produces various diagram report for analysisand decision making.
2.3 Project analysis
Water saving irrigation is the center of the project and agricultural, forest andmanagement measures are also given consideration in order to achieve the goal of savingwater, promoting the agricultural development, the sustainable utilization of waterresources and increase the farmers' revenue. It had been demonstrated from theories andpractices that advanced water saving irrigation technologies and the correspondingagricultural measures will exert an important impact on agricultural production ineconomic, social and environmental benefit. As to the water saving project itself, it won'tproduce any waste gas, water and residue during construction and belongs to non-pollution project. But water resources reallocating process dose exist in water savingirrigation and may exert a certain impact on the environment. Moreover, theimprovement irrigation conditions, regulation of planting structures of crops, increase ofmultiple crop index and pesticide and fertilizer application to a certain extent and theconstruction process in order to increase the yield will also exert certain impact on theenvironment.
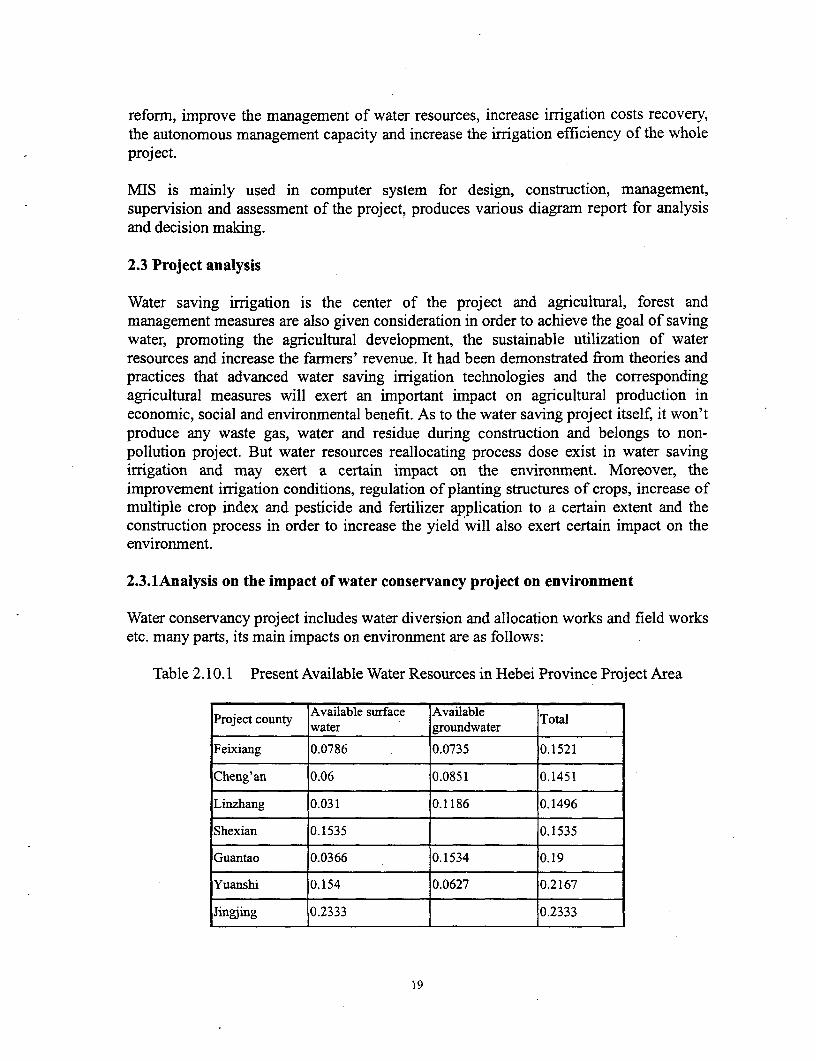
2.3.lAnalysis on the impact of water conservancy project on environment
Water conservancy project includes water diversion and allocation works and field worksetc. many parts, its main impacts on environment are as follows:
Table 2.10.1 Present Available Water Resources in Hebei Province Project Area
Available surface AvailableProject county wtrgonaer Totalwater groundwater
Feixiang 0.0786 0.0735 0.1521
Cheng'an 0.06 0.0851 0.1451
Linzhang 0.031 0.1186 0.1496
Shexian 0.1535 0.1535
Guantao 0.0366 0.1534 0.19
Yuanshi 0.154 0.0627 0.2167
Jingjing 0.2333 0.2333
19
-Yehe |0.2369 10.0204 10.2573
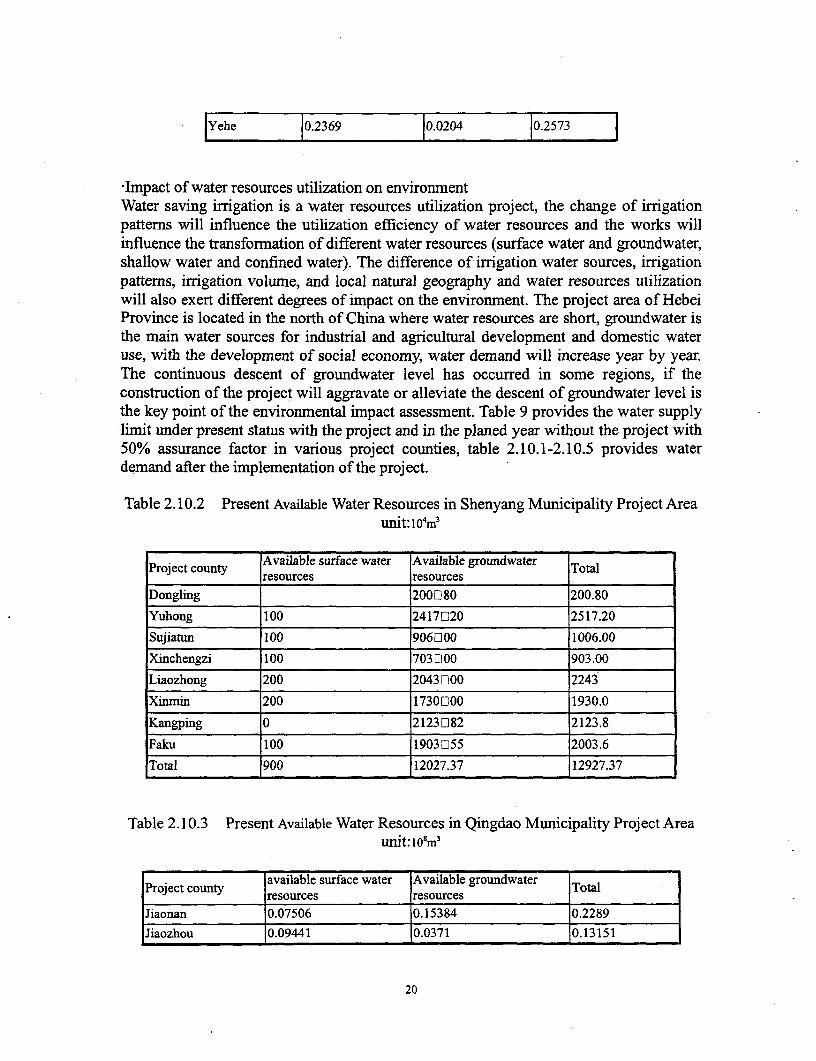
-Impact of water resources utilization on environmentWater saving irrigation is a water resources utilization project, the change of irrigationpattems will influence the utilization efficiency of water resources and the works willinfluence the transformation of different water resources (surface water and groundwater,shallow water and confined water). The difference of irrigation water sources, irrigationpatterns, irnigation volume, and local natural geography and water resources utilizationwill also exert different degrees of impact on the environment. The project area of HebeiProvince is located in the north of China where water resources are short, groundwater isthe main water sources for industrial and agricultural development and domestic wateruse, with the development of social economy, water demand will increase year by year.The continuous descent of groundwater level has occurred in some regions, if theconstruction of the project will aggravate or alleviate the descent of groundwater level isthe key point of the environmental impact assessment. Table 9 provides the water supplylimit under present status with the project and in the planed year without the project with50% assurance factor in various project counties, table 2.10.1-2.10.5 provides waterdemand after the implementation of the project.
Table 2.10.2 Present Available Water Resources in Shenyang Municipality Project Areaunit: 104m3
Project county Available surface water Available groundwater Totalresources resources
Dongling 200fl80 200.80
Yuhong 100 2417020 2517.20
Sujiatun 100 906D100 1006.00
Xinchengzi 100 703300 903.00
Liaozhong 200 2043 ooo 2243
Xinmin 200 17300O00 1930.0
Kangping 0 2123082 2123.8
Faku 100 19030155 2003.6
Total 900 12027.37 12927.37
Table 2.10.3 Present Available Water Resources in Qingdao Municipality Project Areaunit: 108m3
Project county available surface water Available groundwater1Pro.ject county rsucseoresjTotal
resources resourcesJiaonan 0.07506 0.15384 0.2289Jiaozhou 0.09441 0.0371 0.13151
20
Pingdu 0.058 0.1608 0.2188
Laixi 0.02 0.1461 0.1661
Jimo 0.03491 0.0863 0.12121
Chengyang 0.01113 0.02548 0.03661
Total 6.8964 6.8032 13.6996
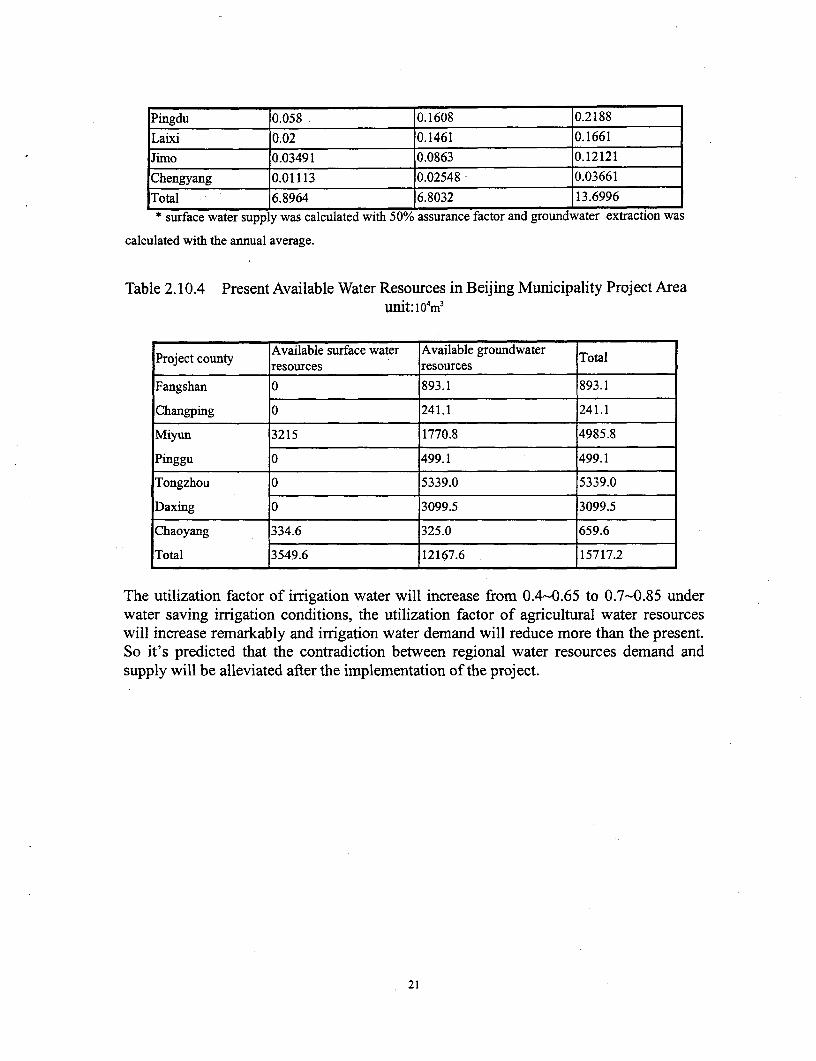
* surface water supply was calculated with 50% assurance factor and groundwater extraction was
calculated with the annual average.
Table 2.10.4 Present Available Water Resources in Beijing Municipality Project Areaunit: 10
4 m3
Available surface water Available groundwaterProject county resources resources Total
Fangshan 0 893.1 893.1
Changping 0 241.1 241.1
Miyun 3215 1770.8 4985.8
Pinggu 0 499.1 499.1
Tongzhou 0 5339.0 5339.0
Daxing 0 3099.5 3099.5
Chaoyang 334.6 325.0 659.6
Total 3549.6 12167.6 15717.2
The utilization factor of irrigation water will increase from 0.4-0.65 to 0.7-0.85 underwater saving irrigation conditions, the utilization factor of agricultural water resourceswill increase remarkably and irrigation water demand will reduce more than the present.So it's predicted that the contradiction between regional water resources demand andsupply will be alleviated after the implementation of the project.
21
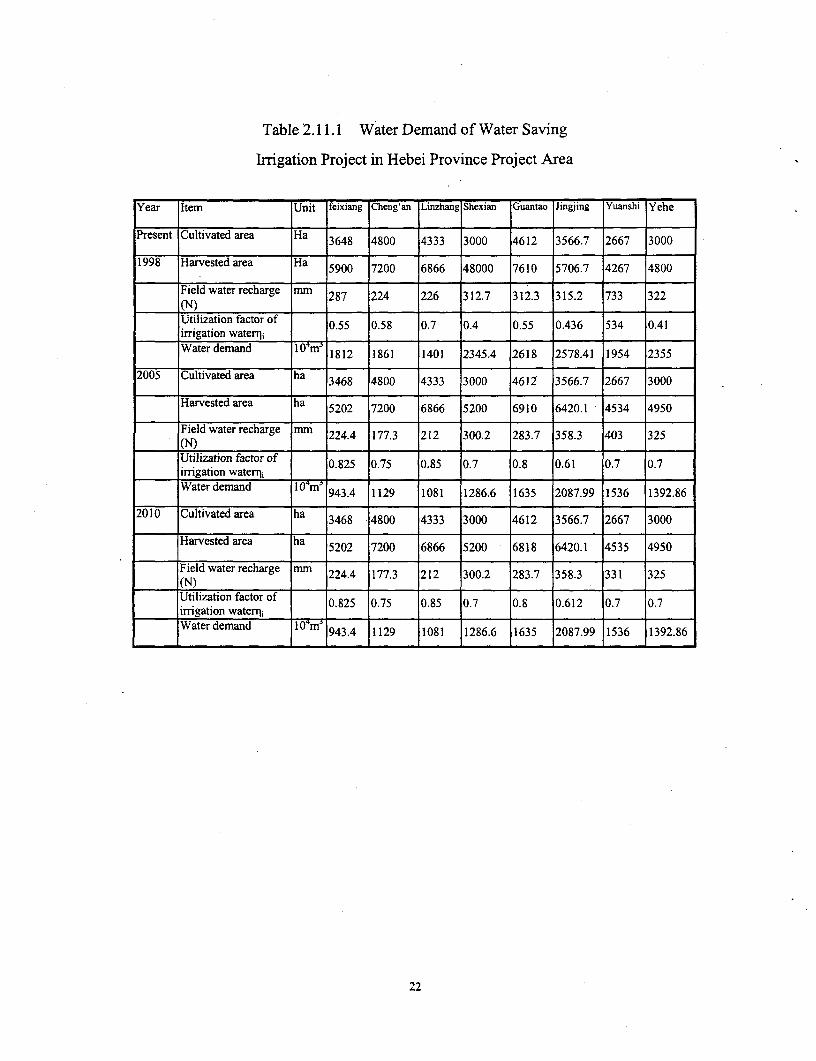
Table 2.11.1 Water Demand of Water Saving
Irrigation Project in Hebei Province Project Area
Year Item Unit feixiang Cheng'an Linzhang Shexian Guantao Jingjing Yuanshi Yehe
Present Cultivated area Ha 3648 4800 4333 3000 4612 3566.7 2667 3000
1998 Harvested area Ha 5900 7200 6866 48000 7610 5706.7 4267 4800
Field water recharge mnu 287 224 226 312.7 312.3 315.2 733 322(N)_ _
Utilization factor of 0.55 0.58 0.7 0.4 0.55 0.436 534 0.41irrigation water7l, _______ 0 0_04 5 0
Water demand 104mf 1812 1861 1401 2345.4 2618 2578.41 1954 2355
2005 Cultivated area ha 3468 4800 4333 3000 4612 3566.7 2667 3000
Harvested area ha 5202 7200 6866 5200 6910 6420.1 4534 4950
Field water recharge mmn 224.4 177.3 212 300.2 283.7 358.3 403 325_ _ (N)_ __ _
Utilization factor of 0.825 0.75 0.85 0.7 0.8 0.61 0.7 0.7!_____ irrigation watern i = _ _
Water demand fI~ - __rn_943.4 1129 1081 1286.6 1635 2087.99 1536 1392.86
:2010 Cltivated area Iha 3468 4800 4333 3000 4612 3566.7 2667 3000
Harvested area ha 5202 7200 6866 5200 6818 6420.1 4535 4950
Fieldwaterrecharge m 224.4 177.3 212 300.2 283.7 358.3 331 325
Utilization factor of 0.825 0.75 0.85 0.7 0.8 0.612 0.7 0.7irrigation waterrl, _
= Water demand 1 943.4 1129 1081 1286.6 1635 2087.99 1536 1392.86
22

Table 2.11.2 Water Demand of Water Saving Irrigation Project in Shenyang
Municipality Project Area
Year Item unit Dongling Yuhong Sujiatun Xinchengzi Liaozho Xinrmin Kangping Faku______ ~~~ng _ _ _ _ _ _ _ _ _
Cultivated area Ha 1800 4333.4 3333.3 3866.7 6666.6 6666.7 6666.3 6200
Harvested area Ha 1300 5313.4 2833.3 3533.3 6333.3 6000 6167 5966.5
Field water mm 86.2 171.2 63.2 107.6 85.2 108.8 42.6 31.31998 recharge (N)
Utilization factorof irrigation 0.6 0.55 0.6 0.5 0.65 0.5 0.5 0.42waternj
Water demand 104m3 258.6 1348.9 351.1 831.8 873.8 1450.0 539.6 462.0
Cultivated area ha 1800 4333.3 3333.3 3866.7 6666.6 6666.7 6333.3 6200
Harvested area ha 1300 5833.3 4166.6 4400 9666.7 8666.7 11833 10700
.Field water nmr 73.6 267.1 231.9 183.83 270.9 238 278.6 282.032005 recharge (N)
Utilization factorof irrigation 0.84 0.8 0.8 0.82 0.82 0.84 0.85 0.85watenji I I
Water demand 104m3 157.71 1446.8 966.24 866.85 2202.4 1888.9 2076 2057.2
Cultivated area ha 1800 4333.4 3333.3 3866.7 6666.6 6666.7 6333.3 6200
Harvested area ha 1300 5833.3 4166.6 4400 9666.7 8666.7 11833 10700
2010 recharge (N) mTn 73.6 267.1 231.9 183.83 270.9 238 278.6 282.03
Utilization factorof irrigation 0.84 0.8 0.8 0.82 0.82 0.84 0.85 0.85waterI1i =
Waterdemand 104m3 157.71 1446.8 |966.24 |866.85 2202.4 1888.9 2076 2057.2
23
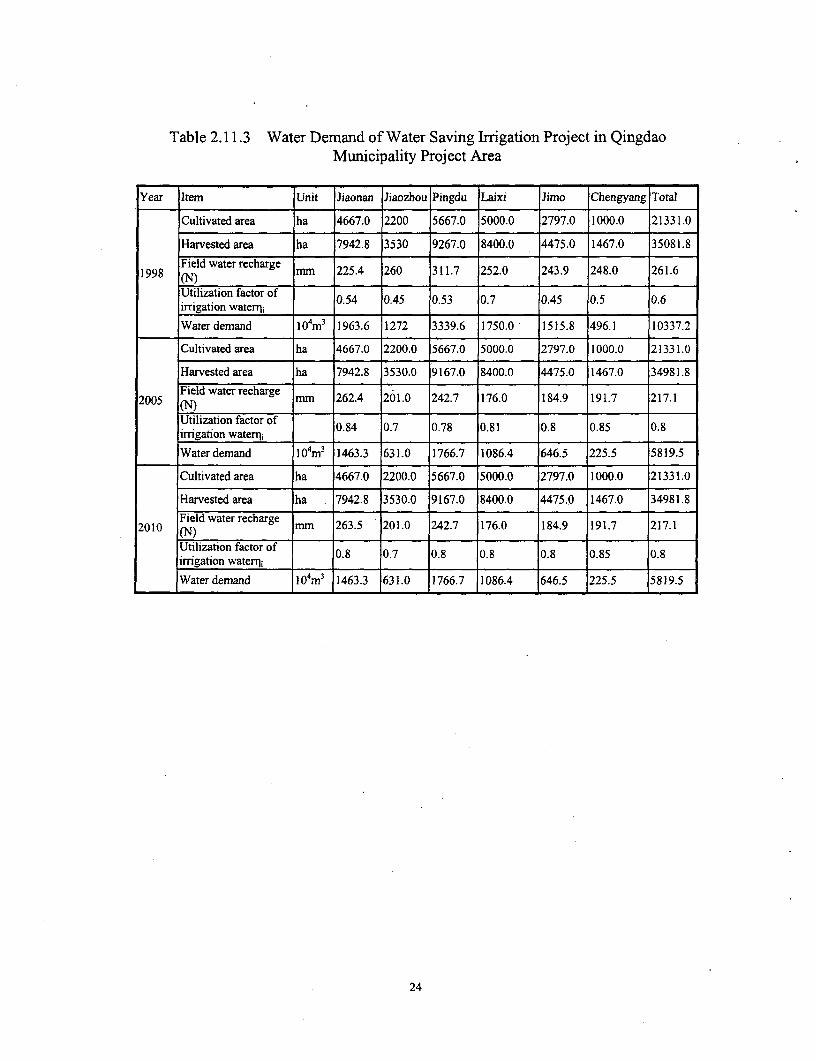
Table 2.11.3 Water Demand of Water Saving Irrigation Project in QingdaoMunicipality Project Area
Year Item Unit Jiaonan Jiaozhou Pingdu Laixi Jimo Chengyang Total
Cultivated area ha 4667.0 2200 5667.0 5000.0 2797.0 1000.0 21331.0
Harvested area ha 7942.8 3530 9267.0 8400.0 4475.0 1467.0 35081.8
1998 Field water recharge rmI 225.4 260 311.7 252.0 243.9 248.0 261.6(N ) _ _ _ _ _ _ _ _ _
Utilization factor of 0.54 0.45 0.53 0.7 0.45 0.5 0.6irrigation waten_jiI
Water demand 104m3 1963.6 1272 3339.6 1750.0 1515.8 496.1 10337.2
Cultivated area ha 4667.0 2200.0 5667.0 5000.0 2797.0 1000.0 21331.0
Harvested area ha 7942.8 3530.0 9167.0 8400.0 4475.0 1467.0 34981.8Field water recharge
2005 Fil mm 262.4 201.0 242.7 176.0 184.9 191.7 217.1Utilization factor of 0.84 0.7 0.78 0.81 0.8 0.85 0.8irrigation wateril_
Water demand 104m3 1463.3 631.0 1766.7 1086.4 646.5 225.5 5819.5
Cultivated area ha 4667.0 2200.0 5667.0 5000.0 2797.0 1000.0 21331.0
Harvested area ha 7942.8 3530.0 9167.0 8400.0 4475.0 1467.0 34981.8
2010 Field water recharge mm 263.5 201.0 242.7 176.0 184.9 191.7 217.1
Utilization factor of 0.8 0.7 0.8 0.8 0.8 0.85 0.8irrigation waterrl, I
Water demand 104m3 1463.3 631.0 1766.7 1086.4 646.5 225.5 5819.5
24
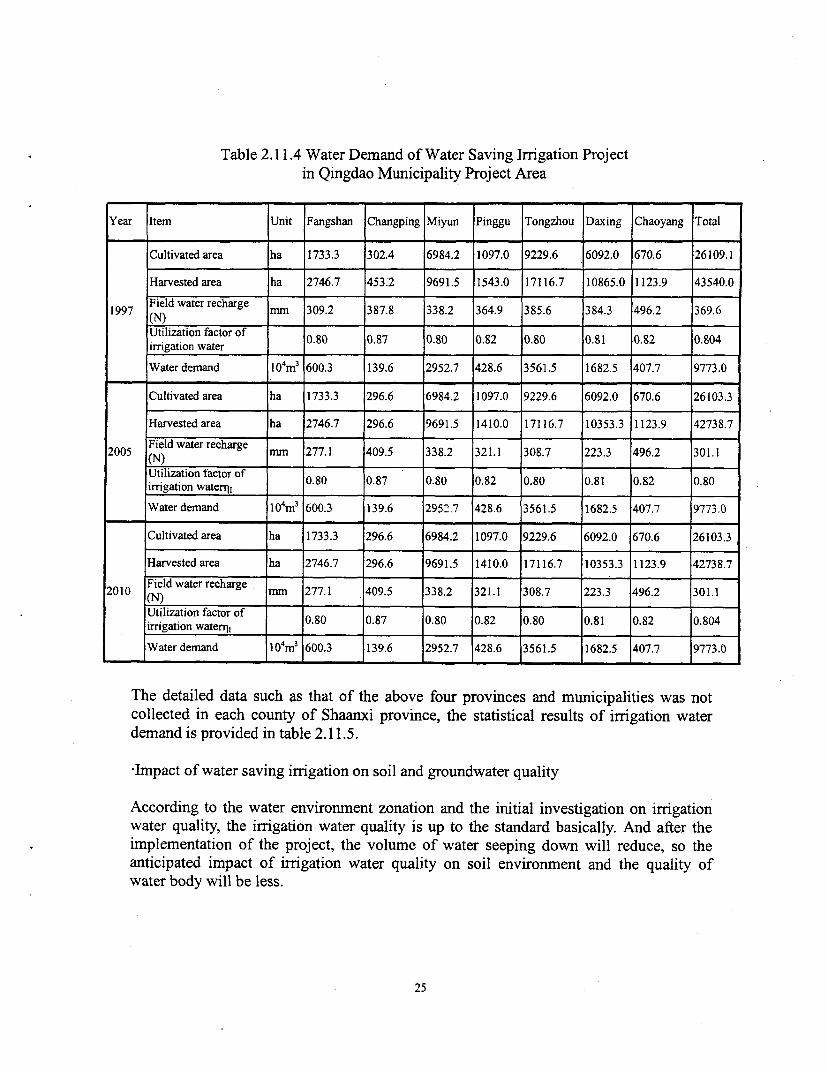
Table 2.11.4 Water Demand of Water Saving Irrigation Projectin Qingdao Municipality Project Area
Year Item Unit Fangshan Changping Miyun Pinggu Tongzhou Daxing Chaoyang Total
Cultivated area ha 1733.3 302.4 6984.2 1097.0 9229.6 6092.0 670.6 26109.1
Harvested area ha 2746.7 453.2 9691.5 1543.0 17116.7 10865.0 1123.9 43540.0
1997 Field water Techarge mm 309.2 387.8 338.2 364.9 385.6 384.3 496.2 369.6
Utilization factor of 0.80 0.87 0.80 0.82 0.80 0.81 0.82 0.804irrigation water .
Water demand 104m
3 600.3 139.6 2952.7 428.6 3561.5 1682.5 407.7 9773.0
Cultivated area ha 1733.3 296.6 6984.2 1097.0 9229.6 6092.0 670.6 26103.3
Harvested area ha 2746.7 296.6 9691.5 1410.0 17116.7 10353.3 1123.9 42738.7
2005 Field water recharge min 277.1 409.5 338.2 321.1 308.7 223.3 496.2 301.1(N )__ _ _ __ _ _ ___ _ _
Utilization factor of 0.80 0.87 0.80 0.82 0.80 0.81 0.82 0.80
Water demand 104m3 600.3 139.6 2952.7 428.6 3561.5 1682.5 407.7 9773.0
Cultivated area ha 1733.3 296.6 6984.2 1097.0 9229.6 6092.0 670.6 26103.3
Harvested area ha 2746.7 296.6 9691.5 1410.0 17116.7 10353.3 1123.9 42738.7
2010 Field water recharge mrn 277.1 409.5 338.2 321.1 308.7 223.3 496.2 301.1(N )__ _ _ _ _ _ _ ___ _ _ __ _ _
Utilization factor of 0.80 0.87 0.80 0.82 0.80 0.81 0.82 0.804irrgation waterr__
Water demand 104 m3 600.3 139.6 2952.7 428.6 3561.5 1682.5 407.7 9773.0
The detailed data such as that of the above four provinces and municipalities was notcollected in each county of Shaanxi province, the statistical results of irrigation waterdemand is provided in table 2.11.5.
-Impact of water saving irrigation on soil and groundwater quality
According to the water environment zonation and the initial investigation on irrigationwater quality, the irrigation water quality is up to the standard basically. And after theimplementation of the project, the volume of water seeping down will reduce, so theanticipated impact of irrigation water quality on soil environment and the quality ofwater body will be less.
25
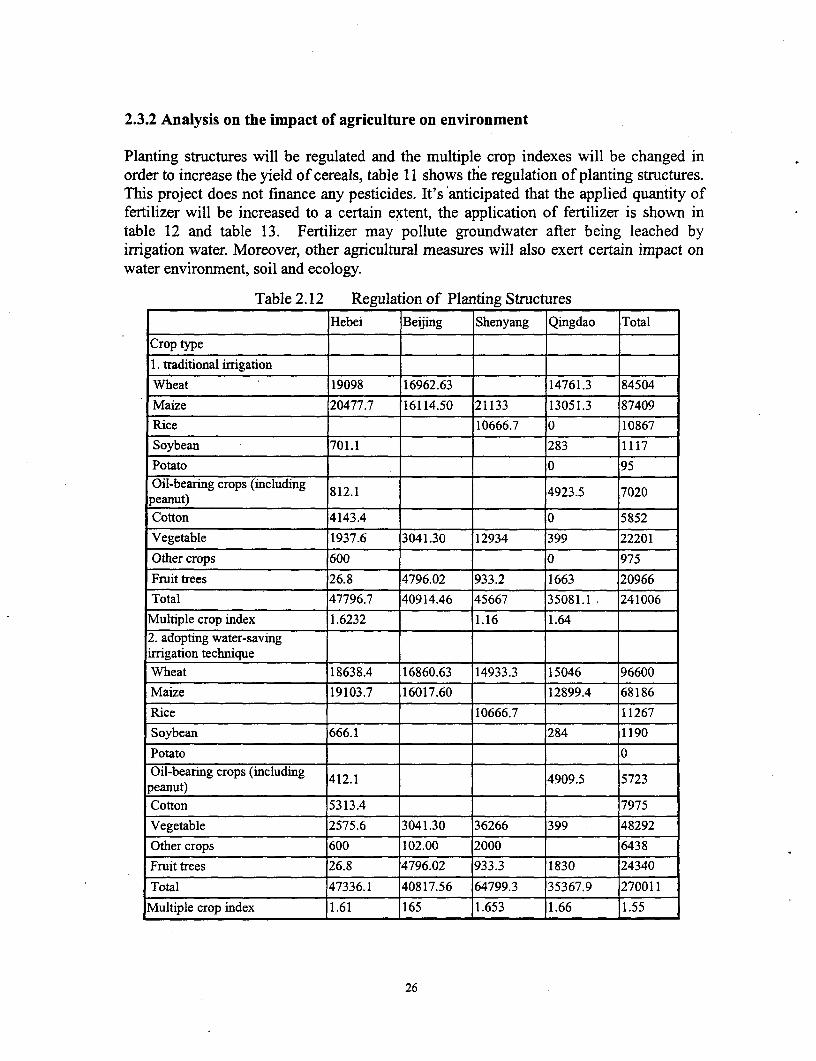
2.3.2 Analysis on the impact of agriculture on environment
Planting structures will be regulated and the multiple crop indexes will be changed inorder to increase the yield of cereals, table 11 shows the regulation of planting structures.This project does not finance any pesticides. It's 'anticipated that the applied quantity offertilizer will be increased to a certain extent, the application of fertilizer is shown intable 12 and table 13. Fertilizer may pollute groundwater after being leached byirrigation water. Moreover, other agricultural measures will also exert certain impact onwater environment, soil and ecology.
Table 2.12 Regulation of Planting StructuresHebei Beijing Shenyang Qingdao Total
Crop type
1. traditional irrigation
Wheat 19098 16962.63 14761.3 84504
Maize 20477.7 16114.50 21133 13051.3 87409
Rice 10666.7 0 10867
Soybean 701.1 283 1117
Potato 0 95Oil-bearing crops (including 812.1 4923.5 7020peanut) 812__493_5 702
Cotton 4143.4 0 5852
Vegetable 1937.6 3041.30 12934 399 22201
Other crops 600 0 975
Fruit trees 26.8 4796.02 933.2 1663 20966
Total 47796.7 40914.46 45667 35081.1 241006
Multiple crop index 1.6232 1.16 1.642. adopting water-savingirrigation technique
Wheat 18638.4 16860.63 14933.3 15046 96600
Maize 19103.7 16017.60 12899.4 68186
Rice 10666.7 11267
Soybean 666.1 284 1190
Potato 0Oil-bearing crops (including 412.1 4909.5 5723
Cotton 5313.4 7975
Vegetable 2575.6 3041.30 36266 399 48292
Other crops 600 102.00 2000 6438
Fruit trees 26.8 4796.02 933.3 1830 24340
Total 47336.1 40817.56 64799.3 35367.9 270011
Multiple crop index 1.61 165 1.653 1.66 1.55
26
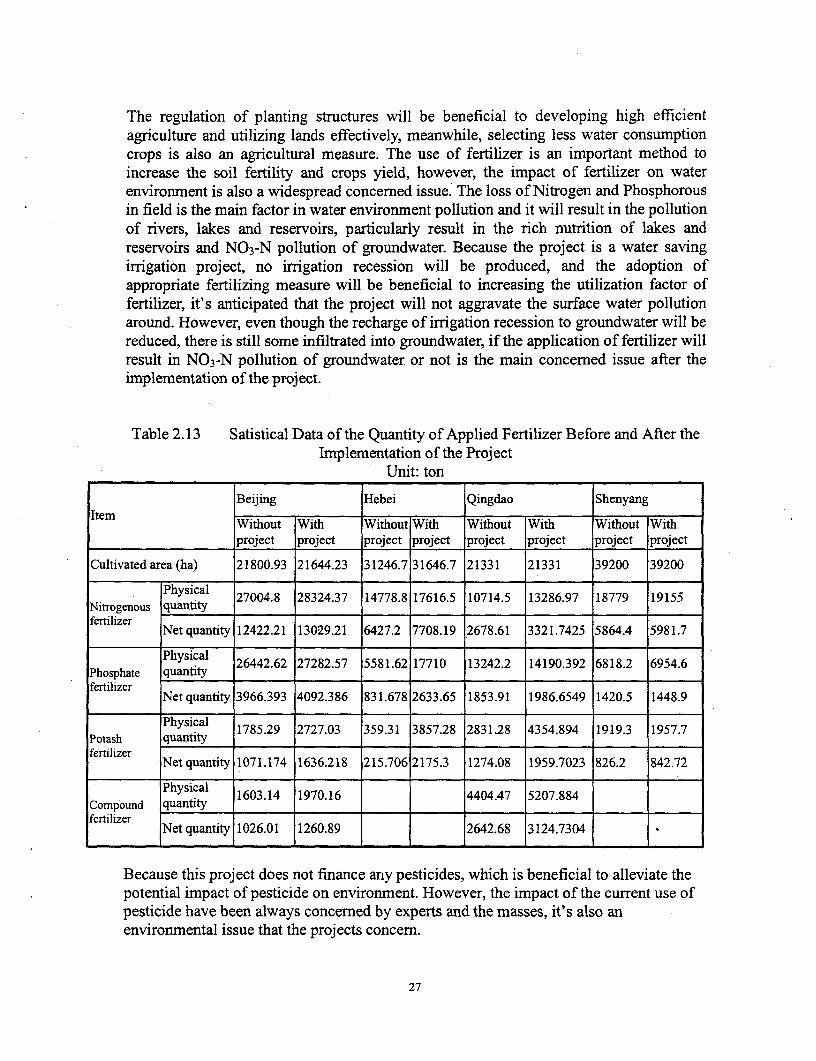
The regulation of planting structures will be beneficial to developing high efficientagriculture and utilizing lands effectively, meanwhile, selecting less water consumptioncrops is also an agricultural measure. The use of fertilizer is an important method toincrease the soil fertility and crops yield, however, the impact of fertilizer on waterenvironment is also a widespread concerned issue. The loss of Nitrogen and Phosphorousin field is the main factor in water environment pollution and it will result in the pollutionof rivers, lakes and reservoirs, particularly result in the rich nutrition of lakes andreservoirs and N0 3-N pollution of groundwater. Because the project is a water savingirrigation project, no irrigation recession will be produced, and the adoption ofappropriate fertilizing measure will be beneficial to increasing the utilization factor offertilizer, it's anticipated that the project will not aggravate the surface water pollutionaround. However, even though the recharge of irrigation recession to groundwater will bereduced, there is still some infiltrated into groundwater, if the application of fertilizer willresult in N0 3-N pollution of groundwater or not is the main concerned issue after theimplementation of the project.
Table 2.13 Satistical Data of the Quantity of Applied Fertilizer Before and After theImplementation of the Project
Unit: ton
Beijing Hebei Qingdao Shenyang
Item Without With Without With Without With Without With
project project project project project project project project
Cultivated area (ha) 21800.93 21644.23 31246.7|31646.7 21331 21331 39200 39200
Physical27004.8 28324.37 14778.8 17616.5 10714.5 13286.97 18779 19155
Nitrogenous quantityfertilizer
Net quantity 12422.21 13029.21 6427.2 7708.19 2678.61 3321.7425 5864.4 5981.7
Pa ysical |26442.62 27282.57 5581.62 17710 13242.2 14190.392 6818.2 6954.6Phosphate quantity _ _ _ _ _ _ _ _ _ _ _ _ _ _ _ _ _ _ _ _ _ _
fertilizerNet quantity 3966.393 4092.386 831.678 2633.65 1853.91 1986.6549 1420.5 1448.9
Physical 1785.29 2727.03 359.31 3857.28 2831.28 4354.894 1919.3 1957.7
Potash quantityfertilizer
Net quantity 1071.174 1636.218 215.706 2175.3 1274.08 1959.7023 826.2 842.72
Physical 1603.14 1970.16 4404.47 5207.884Compound quantity _____ _____ ___ ____
fertilizerNet quantity 1026.01 1260.89 = 12642.68 3124.7304 =
Because this project does not finance any pesticides, which is beneficial to alleviate thepotential impact of pesticide on enviromnent. However, the impact of the current use ofpesticide have been always concerned by experts and the masses, it's also anenvironmental issue that the projects concern.
27
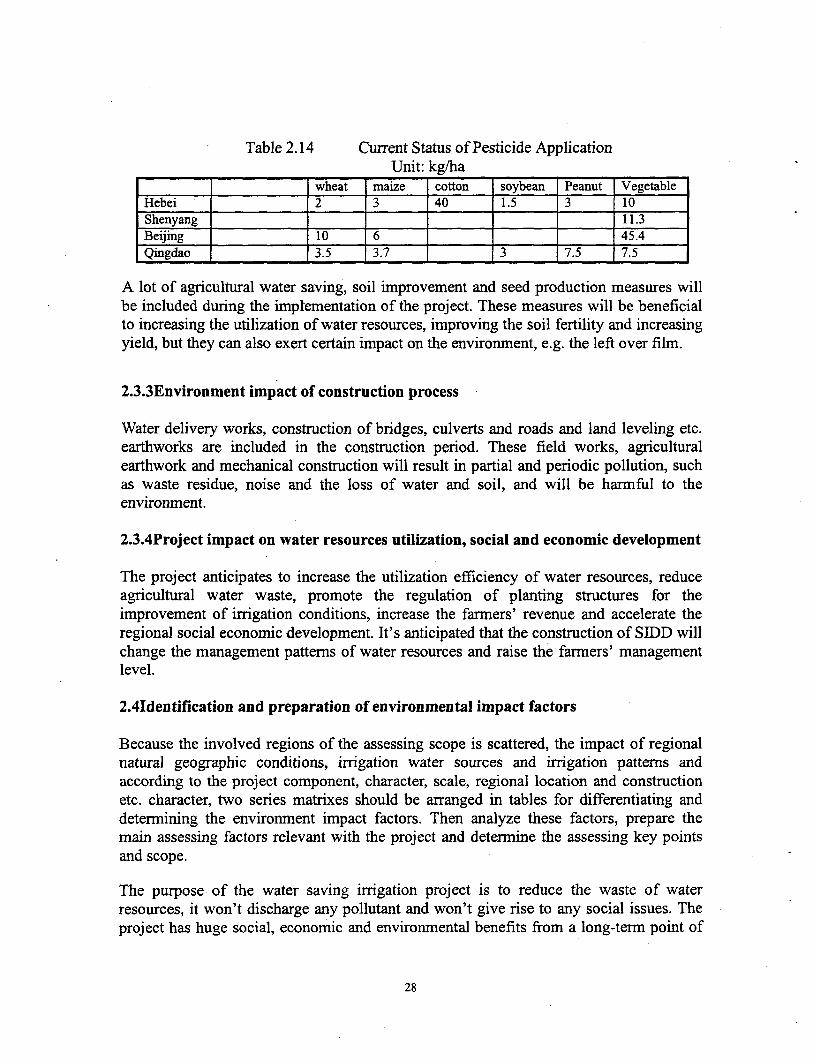
Table 2.14 Current Status of Pesticide ApplicationUnit: kg/ha
wheat maize cotton soybean Peanut VegetableHebei 2 3 40 1.5 3 10Shenyang 11.3Beijing E 10 6 45.4Qingdao 3.5 3.7 3 7.5 7.5
A lot of agricultural water saving, soil improvement and seed production measures willbe included during the implementation of the project. These measures will be beneficialto increasing the utilization of water resources, improving the soil fertility and increasingyield, but they can also exert certain impact on the environment, e.g. the left over film.
2.3.3Environment impact of construction process
Water delivery works, construction of bridges, culverts and roads and land leveling etc.earthworks are included in the construction period. These field works, agriculturalearthwork and mechanical construction will result in partial and periodic pollution, suchas waste residue, noise and the loss of water and soil, and will be harmful to theenvironment.
2.3.4Project impact on water resources utilization, social and economic development
The project anticipates to increase the utilization efficiency of water resources, reduceagricultural water waste, promote the regulation of planting structures for theimprovement of irrigation conditions, increase the farmers' revenue and accelerate theregional social economic development. It's anticipated that the construction of SIDD willchange the management patterns of water resources and raise the farmers' managementlevel.
2.4Identification and preparation of environmental impact factors
Because the involved regions of the assessing scope is scattered, the impact of regionalnatural geographic conditions, irrigation water sources and irrigation patterns andaccording to the project component, character, scale, regional location and constructionetc. character, two series matrixes should be arranged in tables for differentiating anddetermining the environment impact factors. Then analyze these factors, prepare themain assessing factors relevant with the project and detennine the assessing key pointsand scope.
The purpose of the water saving irrigation project is to reduce the waste of waterresources, it won't discharge any pollutant and won't give rise to any social issues. Theproject has huge social, economic and environmental benefits from a long-term point of
28
view, however, it will exert some adverse impacts on the environment for the utilizationof water resources, application of fertilizer and pesticide and the construction of theproject.
On the basis of integrating the character and component of the project and consultingsome experts of water conservancy, agriculture and environment, we selected someenvironmental impact factors from its positive and adverse impact on the environmentand society, impact degree, impact time and impact scale during the construction andoperation of the project. The project's main adverse impacts were primarily determinedas follows:
-Partial discarded soil, soil and water loss and noises of machines etc. environmentalissues during the construction period of the project.
-If the water intake of the project will aggravate the continuous descent of groundwaterlevel in the northern water short districts or not.
*If the application of fertilizer and pesticide will give rise to or aggravate soil and waterpollution or not.
-Impact of other agricultural measures on the environment.
29
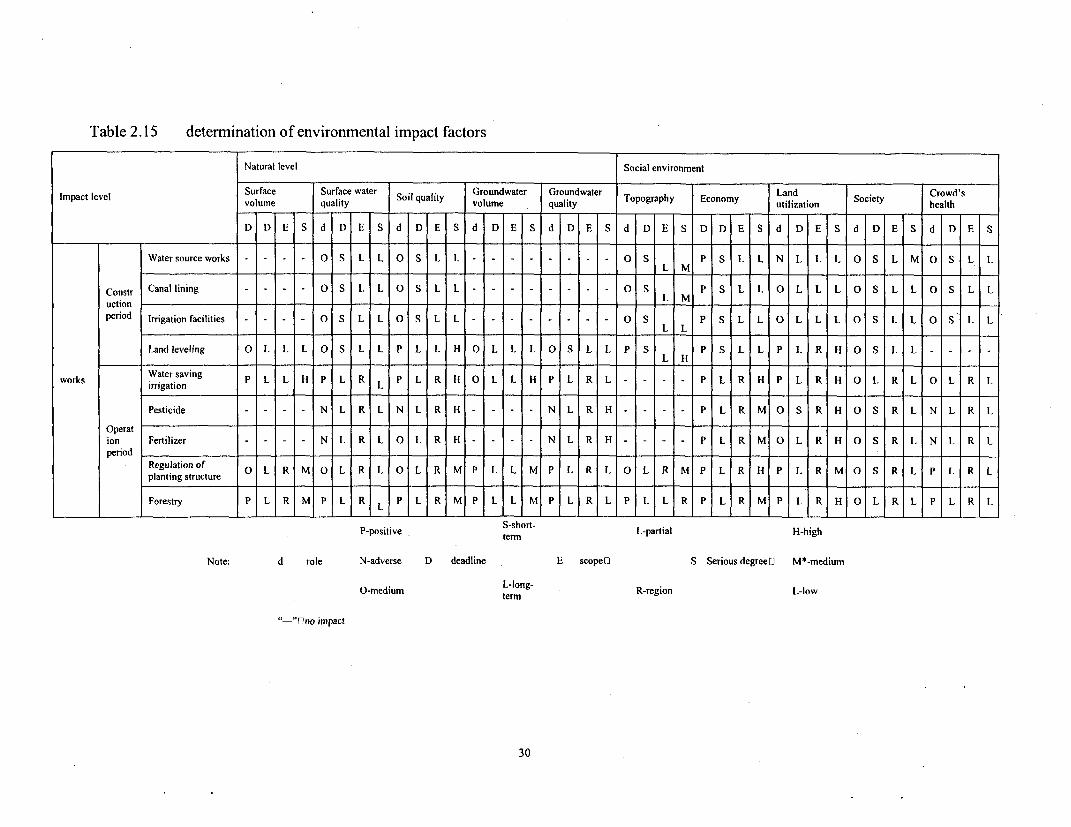
Table 2.15 determination of environmental impact factors
Natural level Social environment
fmpact level Surface Surface water SOii quality Groundwater Groundwater Topography Economy Land Society Ctowd'sfmpact level ~~~~~~volume quality Solqaiy volume quality Toorpy Eooyutilization Soi~'health
D D E S d D E S d D E S E d D E S d DE D E S D D S d D| EI S d D E I S d D E I S
Water source works - - - 0 S L L 0 L LS -0 5 p S L L N L L L 0 M L M 0 5 L L
Constr Canal lining - - - L S LL S L L - O S L-M - S L L O L L L O S L L O S L L
period Irrigation facilities _ OS L L O S L L - PS L L |O L L O S L L ° S | L L
Landleveling 0 L L L 0 S L L P L L H 0 L L L 0 S L L P S P S L HL P L R H 0 S L L | | | -
works itTigation _ L L H P L R L P L R H 0 L L H P L R L P L R H P L R H 0 L R L 0 L R |1
| Pesticide - - - -N L R L N L R H - N L R H - - - P L R M S R H O S R L N L R L
ion Fertilizer - - - - N L R L L R H N L R H _- - - P° LL R | H S R L N L R LperiodIIII I
Regulation of O L RMOL R LOL R MP L LM PL RLO0L MPLH LR SRL LLplanting structure I I I R M _ L R P L R | M S R L P L R L
Forestry P L R M P L R M R L M P L L R |MP L R HOLRL P L R L
P-positive S-short- L-partial H-hightermn
Note: d role N-adverse D deadline E scopeO S Serious degreer] M*-medium
0-medium L-long- R-region L-lowternm
"-"Pno impact
30
3.Project area
3.1Geography
3.1.1 Topography
Most of the pilot projects are distributed in plains and rolling basins while the othersare in valley plains. The terrain is flat and open- wide mostly. Among them, theBeijing project area is located in the north part of North- China plain with the terrainchanging from mountain, hilly land and rolling area to alluvial- diluvial upland andplain gradually from west to east, north to south. The surface relief in plain area iswide and open. The sub-projects of Beijing project are located mainly in thepediments areas of Yongding River, Chaobai River, Jiyun River and Daqing Riverwith flat and open terrain and 55%-65% cultivated lands. The projects in HebeiProvince are mainly located in the rolling areas to the east of Taihang Mountain andwest and middle part of Haihe plain. The terrain slopes from west to east. Among ofthem, Shexian and Jingsing, Yuanshi and Yehe projects are distributed in thetransition belt of rolling areas and plains when the projects in Linzhang, Feixiang,Guantao and Chengan are in the upper and middle streams of Zhangweihe plain withflat and open- wide terrain. The areas of cultivated land account for nearly 65% to75% of the total areas. The projects in Qingdao city are located in rolling basin andvalley plain. The areas of cultivated land account for nearly 60% to 70% of the totalareas. The landscape in Shenyang City varies from hilly rolling areas in north andeast part to broad plain in west part. The terrain slopes from east to west. The projectareas are distributed mainly in alluvial plains of Liao River and Hun River whensome of them are in roling areas or in the transition belt of rolling area and plain. Theaverage altitude above sea level varies from 30 to 50 meters. The area of cultivatedlands is make up of nearly 60% to 70% of the total areas.
3.1.2 Climate
The whole project covers three climatic zones. The Qingdao project areas are locatedin marine and monsoon climate zone when the climate of Hebei, Beijing andShenyang projects are semi-arid and semi- humid continental monsoon climate oftemperate zone. The common characters of the three climatic zones are distinctiveseasons, windy spring, hot and rainy summer and cold and dry winter. Nearly 70% ofrainfall is concentrated in June, July, August and September with great varietiesannually. The rain comes together with hot weather, which is beneficial for thegrowth of crops. But the cold and drought winter and windy spring is unfavorable forthe growth of winter wheat and the seeding, budding and growing of crops seeding inspring. Owing to the shortage and uneven distribution of rainfall in time and space,the efficient amount of rainfall is less than the normal demand of crops during theeach growth period of main crops. The water shortage is the reason that irrigation isthe basic measures to guarantee the high- yield of crops in these areas. Theprecipitation in most of the counties (cities and districts) in project areas is only500mm to 650 mm when the rainfall in a few areas is 650mm to 700 mm or less than500 mm. It indicates that these areas are the ones lack of water resources, either
31

surface water or groundwater or both of them. High efficient water saving measuresshould be the guarantee of sustainable utilization of water resources.
3.1.3 Soil and plant
The type of soil has influence not only on the growth of crops but also on the seepageand recharge of groundwater, storage of water and soil moisture in agricultural landsand water-saving irrigation. The geographic distribution of soil is very complex. Thesoil type in the whole project areas can be divided into three catagories mainly, whenthe soil in projects in Qingdao city and Shenyang City is of brown soil (yellowish-brown earth) of Jiaodong- Liaodong rolling areas , deposit soil in Liaohe plain andsmall part of sandy yellow and black soil. The soil of Beijing project areas and 8counties of Hebei projects are yellow wet soil, Lou soil, brown soil when the one inBeijing and Hebei is of wet- yellow soil of Haihe plain with middle soil quality.
All types of soil mentioned above are suitable for the growth of many kinds of cropssuch as wheat, corn, bean, cotton, vegetable and fruits. The major crops planted in theproject areas now are winter wheat, spring wheat, spring corn, summer corn, rice,bean, peanut, cotton, patato, watermelon, vegetables, apple, pear, peach, apricot andgrape, etc.
3.1.4 River system
The 62 project counties (cities and districts) are distributed in the mid-downstreamor mid-upperstream areas of 34 large rivers. Both the surface water and groundwaterare the main sources of the project areas. There are main stems or major tributariesof 5 large rivers flowing through the project areas in Beijng, which are YongdingRiver, Chaobai River, Wenyu River, Jiyuan River and Dashi River. Because theserivers have plentiful water resources with midium or coarse sand or sandy cobble asthe river beds, all the rivers recharge the surface and ground water in the projectareas. In Hebei areas, there are main stems or major tributary of 4 large riverspassing by which are Zhanghe River, Weihe River, Fuyang River and Futuo River.The conditions of water resources are similar to that of in Beijing. The main stemsor major tributary of rivers passing by Qingdao city are Dagu River, Xiaogu River,Jiaolai River, Zehe River, Taoyuan River and Ziyang River. The conditions here aresimilar, too. The 8 project counties in Shenyang city are located in middle streamsof Liaohe River and Hunhe River when all the 12 major tributaries and main stemsare passing by the project areas. As the quantity of water resources passing by isabundant and the seepage capability of river bed are strong, the surface water andgroundwater in these areas are recharged substantially.
3.1.5 Hodrogeography
According to the geological structure, landform, topography and the storageconditions of groundwater, the whole project areas are divided into 2 major hydro-geological units which are mountainous areas and plain areas. The mountainous areasare divided into intermontane basin, valley plain and terrace area of loess plateauwhereas the plain area are divided into alluvial- diluvial plain in the front ofmountains and diluvial- lake plain in the middle section with regard to the landscape,
32
lithological feature and hydrogeologic conditions.
The Beijing projects are located between the middle section of North- China uplandand west section of Yanshan Mountain deposit belt. The mountainous regions areformed by Archacozoic ear gneiss, Upper and Middle Proterozoic erathem clasticrocks, Lower Paleozoic erathem dolomite and limestone, etc. The Quatemary systemis well- developed. Groundwater is stored in Quatemary system pore while theaquiferous strata of Quaternary system are distributed in alluvial- diluvial plainregions. The potential yield of groundwater in the front of mountains is not high
(single well capacity generally within 1500m3 /d to 3000 m3 /d). In the top sections ofalluvial - diluvial fan, the potential yield is quite good with single well capacity
within 3000- 5000 m3 /d. Following is the middle section of alluvial - alluvial fan
with single well capacity within 1500-3000 m3 /d. This area is the main exploitedarea with the depth to water varying from 4 to 1Om or even more higher than that. Forthe plain areas in the middle and lower part of alluvial - alluvial fan, the aquifersstrata is composed of multiple layers of sand and some gravels with several layer and
fine articles , of which the single well capacity is over 1OOOm3/d, less than 500 m3/din some parts and the confined depth to water is 4- 1 Om or over 20m seldom. Theprojects of Beijing are mainly distributed in the upper, middle and lower part ofalluvial - alluvial fan.
The Hebei projects are mainly located in the east section of Haihe plain and therolling areas in the front of Taihang Mountain, whereas the Shexian project area andJingxing project area is in rolling areas irrigated by surface water and Yuanshi andYehe project area are irrigated by surface water and groundwater combined withsurface water as the main source. The other project areas exist in the middle region ofZhanghe river and Weihe river while groundwater is the main source of irrigation.The aquifer systems in Jingxing, Yuanshi and Yehe project areas belong to the typeof bedrock pore- fissure water with carbonate- karst water in some cases whileamong them there is alluvial- diluvial aquiferous system in valley plain areas androlling basin. Situated in the upper stream of Zhanghe river, the project areas inShexian belongs to mountainous hydorgeologic unit with well developed carbonatekarst auriferous system and alluvial- alluvial aquifer in valley basin areas. The projectareas in Feixiang, Chengan, Linzhang and Guantao county exist in the alluvial-lakeplain areas in the south of Hebei province with 3 main aquifers in vertical which are:the first aquifer is belt- like developed along the direction of east- north to east. Itslithological feature is fine sand and clayey sand with the thickness within 10 to 30m
and the coefficient of hydraulic conductivity varies within 100- 300 m2 /d, and 300-
500 m2 /d in old riverbed areas. Saline-water is well developed in this area with freshwater containing mineral concentration within 3 to 5g/L. The depth to water is lessthan 1Om. The water is of fresh- saline or saline type. The second aquifers strata ismainly composed of medium fine sand and fine sand formed by the alluvial and lakeaction of rivers from Taihang Mountain, stretching from north to east like a belt.There is a thicker layer of clay soil or sub-clay soil between the first and secondaquifer usually. So the recharge condition in vertical direction is poor due to the wellconfined layers. Influenced by ancient climate, saline layer is well developed in theseareas especially in the upper part of this strata with the fresh and salt- water
33
distributing inter layers and the amount of mineral concentration is less than 2 g/L.The thickness of saline layer is increasing along the direction of west to east and themineral concentration is within 2 to 5g/L. The third aquifer situated in the middleplain is composed of medium and fine sand. The aquifer is developed along thedirection of east-north and east to east-north as a line. The mineral concentration is0.5-0.7g/L while single well capacity varying within 10 to 50m3/(h.m) and the depthto water is 10 to 30m. There is usually a sub-clay layer more than I Om thick existingbetween this aquifer and the second aquifer which leads to a bad recharge conditionamong aquifers. The fourth aquifer is composed mainly of medium and fine sand andfined sand with the thickness within 20 to 50m. It is formed by the action of thickclay, sub-clay and aquatic sand layer with bad seepage capability and weak quantityyield. The depth to water is in the order of 8 to 20m with the mineral concentrationamount less than 1.Og/L and the single well capacity generally within 5 to 20 m3/(h.m).
All the projects in Qingdao City are located in lower rolling areas with differentgeological layers. In north and east part of Jiaodong area, it is composed ofArchaeozoic ear and Proterozoic erathem metamorphosed granite with welldeveloped Mesozoic ear intruded granite in the north - east of Pingdu City, north partof Laixi county and south-east part of Jiaonan area. In these areas Cenozoic erathemQuatemary system layers are well distributed over the rocks directly which aremainly in lower rolling areas and plain areas. According to the storage condition ofgroundwater, the lithological feature and characteristic of hydrology, the aquiferousstrata was divided into 4 types, including loose rocks pore- fissure water as the firstaquifer which mainly exists besides the intermontane valleys. It is formed by alluvial-alluvial layer, which is usually in double structure. The upper part of it is of clayeysand soil or sandy soil while the lower part of it is of sand and gravel with thethickness within 1 to 20m. The depth to water is less than 15m. The thickness of sandlayer of water in Jiaolai plain varies within 3- 10 m with the depth to water from 2 to5 m. In the middle and upper part of Dagu River, the thickness of sand layer of wateris of 5 - lOm with the single well capacity within 1000-3000m3/d and 500-l000m 3 /dor less than that in the frontier of valley areas. Most of the projects in Qingdao arelocated in this hydrogeologic unit. The second type is clastic rocks fissure waterdistributed mainly in Laizhou, Jimo, west part of Laoshan mountain, north and westpart of Pingdu and south and east part of Laixi, etc. The single well capacity is less
than 100 m3/d. The karst regions are developed near fracture zone with increasedsurge capacity. The third type is carbonate fissure water. The karst regions aredeveloped in the rolling area of Laixi and Pingdu. The regions with slope structurehas good potential yield with the single well capacity within 500- I000m 3/d and overI000m 3 /d in some part of Pingdu, less than 100m3/d in karst regions in rolling areasof Jiaonan. The fourth type is metamorphose rock and karst water with small singlewell capacity.
The Shenyang projects are mainly located in the intersection of Liaodongmountainous regions and Liaohe plain. The landfonn changes from denudation lowermountainous rolling areas, denudation terrace upland to alluvial-diluvial fan andplains between fan and alluvial-diluviai plain. The geographic layer of Quartenary
34
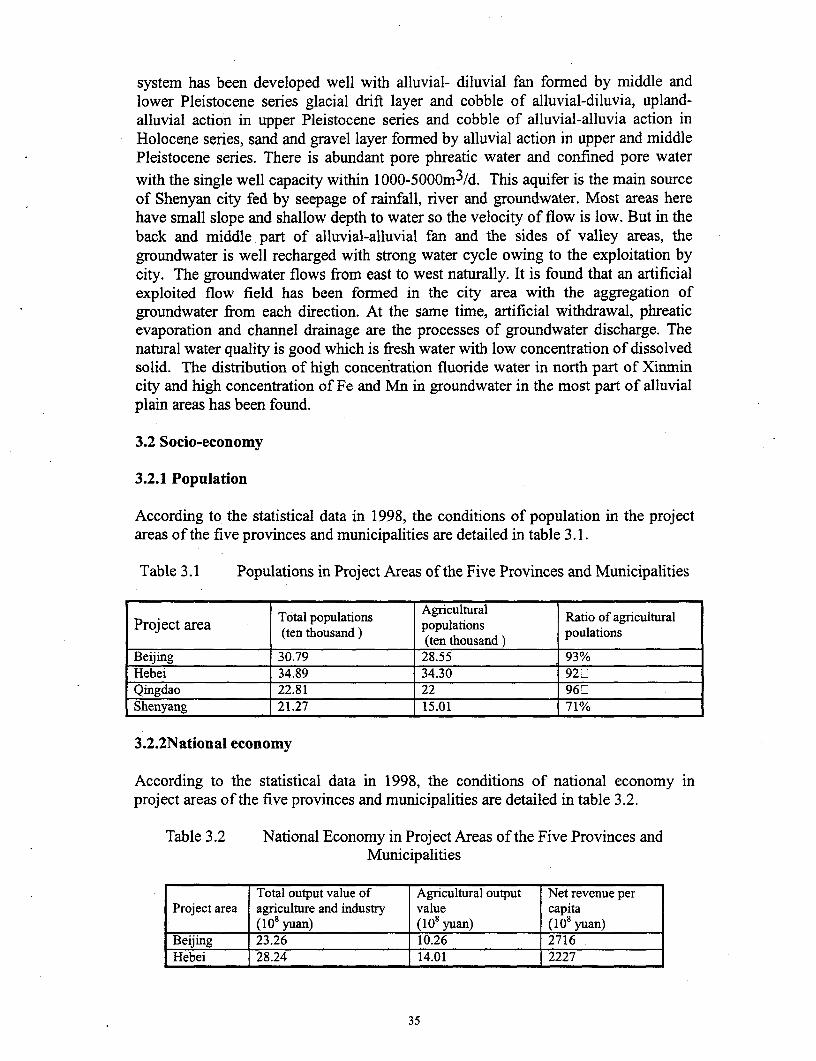
system has been developed well with alluvial- diluvial fan formed by middle andlower Pleistocene series glacial drift layer and cobble of alluvial-diluvia, upland-alluvial action in upper Pleistocene series and cobble of alluvial-alluvia action inHolocene series, sand and gravel layer formed by alluvial action in upper and middlePleistocene series. There is abundant pore phreatic water and confined pore water
with the single well capacity within 1000-5000m3 /d. This aquifer is the main sourceof Shenyan city fed by seepage of rainfall, river and groundwater. Most areas herehave small slope and shallow depth to water so the velocity of flow is low. But in theback and middle part of alluvial-alluvial fan and the sides of valley areas, thegroundwater is well recharged with strong water cycle owing to the exploitation bycity. The groundwater flows from east to west naturally. It is found that an artificialexploited flow field has been formed in the city area with the aggregation ofgroundwater from each direction. At the same time, artificial withdrawal, phreaticevaporation and channel drainage are the processes of groundwater discharge. Thenatural water quality is good which is fresh water with low concentration of dissolvedsolid. The distribution of high concentration fluoride water in north part of Xinmincity and high concentration of Fe and Mn in groundwater in the most part of alluvialplain areas has been found.
3.2 Socio-economy
3.2.1 Population
According to the statistical data in 1998, the conditions of population in the projectareas of the five provinces and municipalities are detailed in table 3. 1.
Table 3.1 Populations in Project Areas of the Five Provinces and Municipalities
Total poulations AgriculturalProject area (ten thousand) populations Ratio of agricultural
(ten______thousand________(ten thousand poulationsBeijing 30.79 28.55 93%Hebei 34.89 34.30 920Qingdao 22.81 22 g6nShenyang 21.27 15.01 71%
3.2.2National economy
According to the statistical data in 1998, the conditions of national economy inproject areas of the five provinces and municipalities are detailed in table 3.2.
Table 3.2 National Economy in Project Areas of the Five Provinces andMunicipalities
Total output value of Agricultural output Net revenue perProject area agriculture and industry value capita
(108 yuan) (108 yuan) (108 yuan)Beijing 23.26 10.26 2716Hebei 28.24 14.01 2227
35
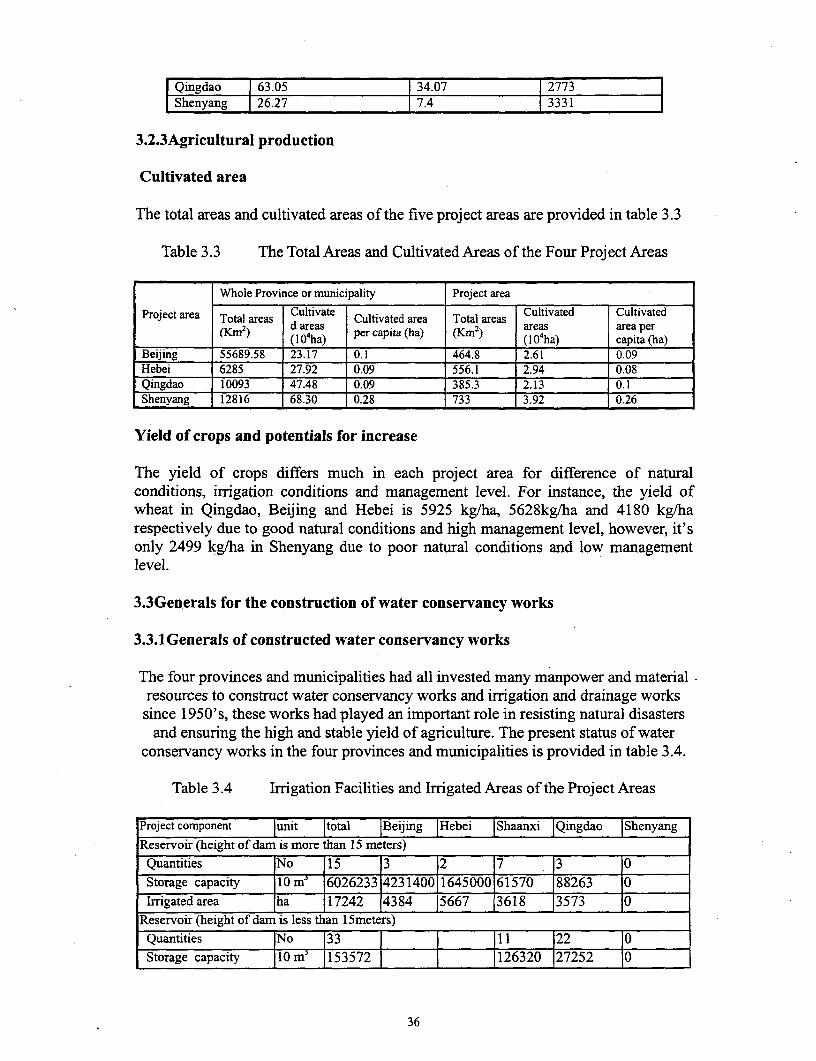
Qingdao | 63.05 34.07 | 2773 IShenyang 26.27 7.4 3331
3.2.3Agricultural production
Cultivated area
The total areas and cultivated areas of the five project areas are provided in table 3.3
Table 3.3 The Total Areas and Cultivated Areas of the Four Project Areas
Whole Province or municipality Project area
Project area Total areas Cultivate Cultivated area Total areas Cultivated Cultivated(Kin2) dareas areas area per
(Km") ((104ha) per capita (ha) (Krn') (1 O4ha) capita (ha)Beijing 55689.58 23.17 0.1 464.8 2.61 0.09Hebei 6285 27.92 0.09 556.1 2.94 0.08Qingdao 10093 47.48 0.09 385.3 2.13 0.1Shenyang 12816 68.30 0.28 733 3.92 0.26
Yield of crops and potentials for increase
The yield of crops differs much in each project area for difference of naturalconditions, irrigation conditions and management level. For instance, the yield ofwheat in Qingdao, Beijing and Hebei is 5925 kg/ha, 5628kg/ha and 4180 kg/harespectively due to good natural conditions and high management level, however, it'sonly 2499 kg/ha in Shenyang due to poor natural conditions and low managementlevel.
3.3Generals for the construction of water conservancy works
3.3.1Generals of constructed water conservancy works
The four provinces and municipalities had all invested many manpower and material .resources to construct water conservancy works and irrigation and drainage workssince 1950's, these works had played an important role in resisting natural disasters
and ensuring the high and stable yield of agriculture. The present status of waterconservancy works in the four provinces and municipalities is provided in table 3.4.
Table 3.4 Irrigation Facilities and Irrigated Areas of the Project Areas
Project component |unit |total |Beijing IHebei IShaanxi |Qingdao IShenyang
Reservoir (height of dam is more than 15 meters)
Quantities No 115 3 12 7 3 0Storage capacity 10 lm5 60 2 6233 423140011645000 61570 188263 0Irrigated area ha 117242 4384 15667 3618 3573 0
Reservoir (height of dam is less than 15meters)Quantities JNo 33 1 11 22 0Storage capacity lOm e 153572 _1 126320 27252 10
36
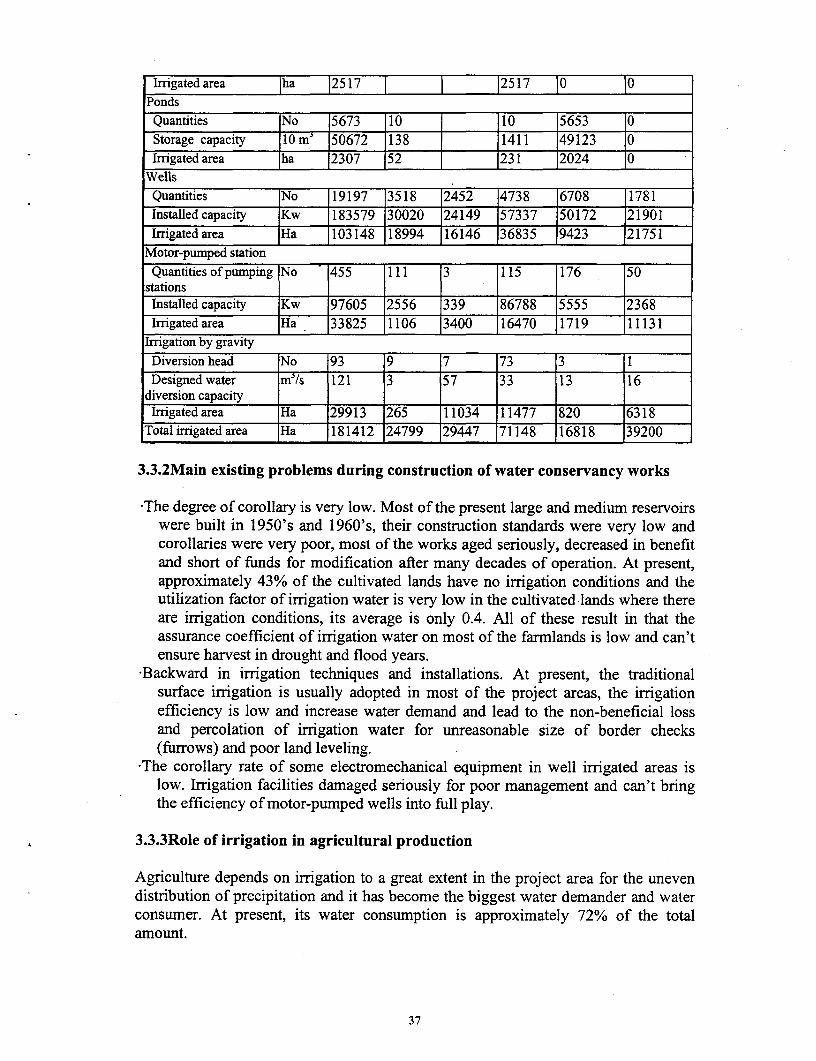
Imigatedarea Iha 12517 l l 12517 10 10PondsQuantities No 5673 10 I 110 15653 10
Storage capacity 10 m' 50672 138 J 11411 149123 0Irigated area ha 2307 152 1231 2024 0
WellsQuantities No 19197 3518 12452 14738 6708 1781Installed capacity Kw 183579 30020 124149 57337 50172 21901Irrigated area Ha 103148 18994 116146 136835 9423 121751
Motor-pumped station
Quantities of pumping No 455 11i 3 115 176 50stationsInstalled capacity Kw 97605 2556 339 86788 5555 2368Irrigated area Ha 33825 1106 3400 16470 1719 11131
Irrigation by gravity
Diversion head No 93 9 7 73 3 1Designed water mrs 121 3 57 33 13 16
diversion capacity _Irrigated area Ha 29913 265 11034 11477 820 6318
Total irgated area Ha 181412 24799 29447 71148 16818 39200
3.3.2Main existing problems during construction of water conservancy works
*The degree of corollary is very low. Most of the present large and medium reservoirswere built in 1950's and 1960's, their construction standards were very low andcorollaries were very poor, most of the works aged seriously, decreased in benefitand short of funds for modification after many decades of operation. At present,approximately 43% of the cultivated lands have no irrigation conditions and theutilization factor of irrigation water is very low in the cultivated lands where thereare irrigation conditions, its average is only 0.4. All of these result in that theassurance coefficient of irrigation water on most of the farmlands is low and can'tensure harvest in drought and flood years.
*Backward in irrigation techniques and installations. At present, the traditionalsurface irrigation is usually adopted in most of the project areas, the irrigationefficiency is low and increase water demand and lead to the non-beneficial lossand percolation of irrigation water for unreasonable size of border checks(furrows) and poor land leveling.
*The corollary rate of some electromechanical equipment in well irrigated areas islow. Irrigation facilities damaged seriously for poor management and can't bringthe efficiency of motor-pumped wells into full play.
3.3.3Role of irrigation in agricultural production
Agriculture depends on irrigation to a great extent in the project area for the unevendistribution of precipitation and it has become the biggest water demander and waterconsumer. At present, its water consumption is approximately 72% of the totalamount.
37
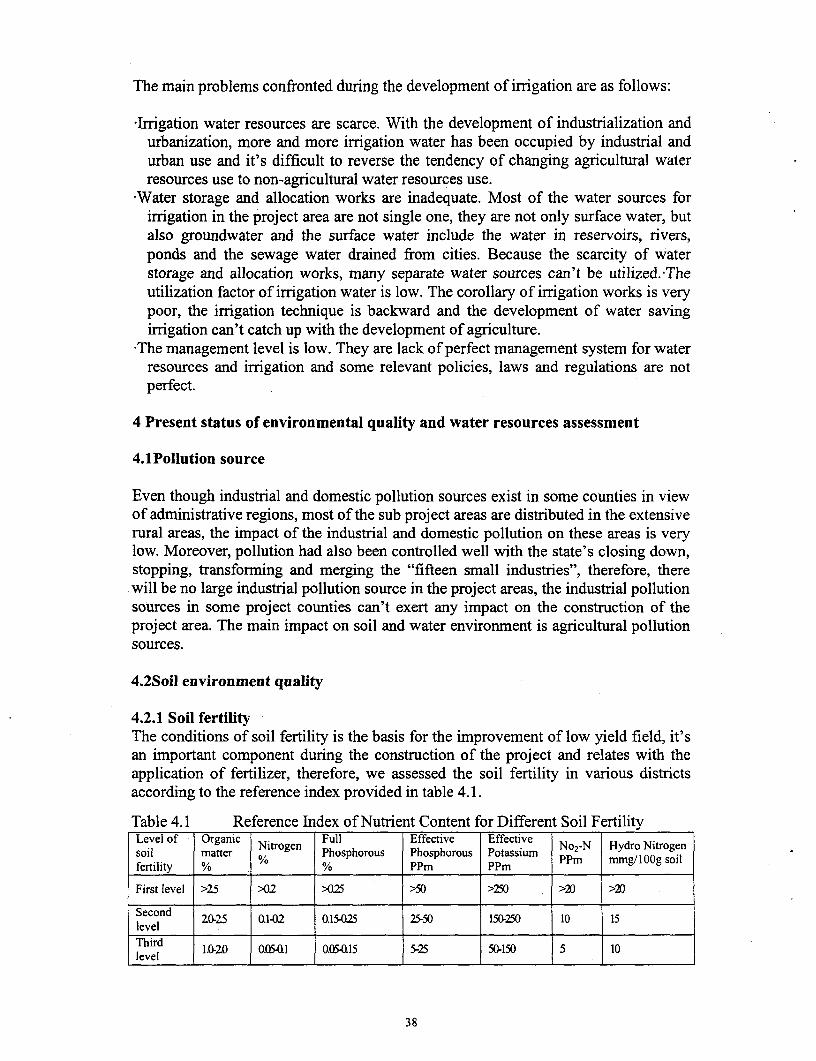
The main problems confronted during the development of irrigation are as follows:
-Irrigation water resources are scarce. With the development of industrialization andurbanization, more and more irrigation water has been occupied by industrial andurban use and it's difficult to reverse the tendency of changing agricultural waterresources use to non-agricultural water resources use.
*Water storage and allocation works are inadequate. Most of the water sources forirrigation in the project area are not single one, they are not only surface water, butalso groundwater and the surface water include the water in reservoirs, rivers,ponds and the sewage water drained from cities. Because the scarcity of waterstorage and allocation works, many separate water sources can't be utilized. Theutilization factor of irrigation water is low. The corollary of irrigation works is verypoor, the irrigation technique is backward and the development of water savingirrigation can't catch up with the development of agriculture.
-The management level is low. They are lack of perfect management system for waterresources and irrigation and some relevant policies, laws and regulations are notperfect.
4 Present status of environmental quality and water resources assessment
4.lPollution source
Even though industrial and domestic pollution sources exist in some counties in viewof administrative regions, most of the sub project areas are distributed in the extensiverural areas, the impact of the industrial and domestic pollution on these areas is verylow. Moreover, pollution had also been controlled well with the state's closing down,stopping, transforming and merging the "fifteen small industries", therefore, therewill be no large industrial pollution source in the project areas, the industrial pollutionsources in some project counties can't exert any impact on the construction of theproject area. The main impact on soil and water environment is agricultural pollutionsources.
4.2Soil environment quality
4.2.1 Soil fertilityThe conditions of soil fertility is the basis for the improvement of low yield field, it'san important component during the construction of the project and relates with theapplication of fertilizer, therefore, we assessed the soil fertility in various districtsaccording to the reference index provided in table 4.1.
Table 4.1 Reference Index of Nutrient Content for Different Soil FertilityLevel of Organic Full Effective Effective
fertlit mater Nitrogen Phshru hshru PnNo 2-N Hydra Nitrogensoil matter %Phosphorous Phosphorous Potassium PPm mmg/l IOOg soilfertility % ____ PPm PPm___
First level >25 >02 >025 >50 >250 >2D >20
Second 20-25 0.1Q-02 0.1502 25-50 150-250 10 15level _ _ _ _ __ _ _ _ _ _ _
Third 1.0-20 0S.(U 0.(>41l5 5-25 50-150 5 10
38
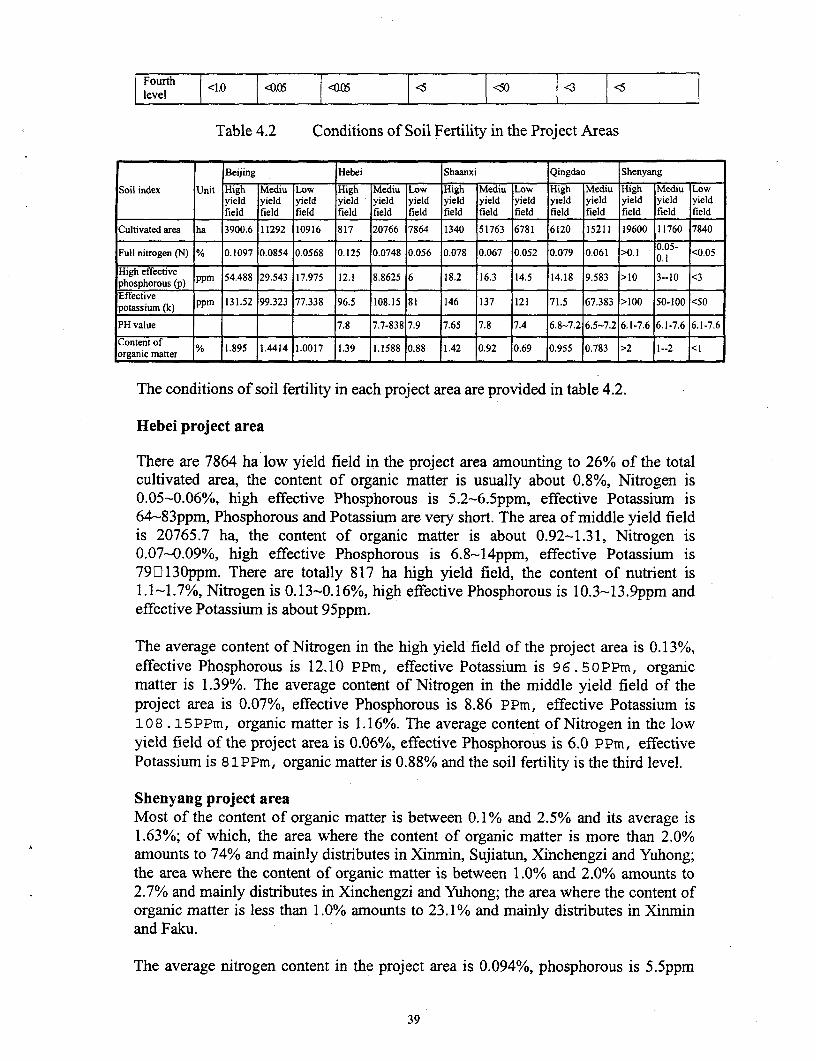
Fourth <1.0 4| <0.Q <50 |<3 <5level IIIIII
Table 4.2 Conditions of Soil Fertility in the Project Areas
Beijing Hebei Shaanxi Qingdao Shenyang
Soil index Unit High Mediu Low High Mediu Low High Mediu Low High Mediu High Mediu Lowyield yield yield yield yield yield yield yield yield yield yield yield yield yieldfield field field field field field field field field field field field field field
Cultivated area ha 3900.6 11292 10916 817 20766 7864 1340 51763 6781 6120 15211 19600 11760 7840
Full nitrogen (N) % 0.1097 0.0854 0.0568 0.125 0.0748 0.056 0.078 0.067 0.052 0.079 0.061 >0.1 05- <0.05
High effectivephosphorous (p) ppm 54.488 29.543 17.975 12.1 8.8625 6 18.2 16.3 14.5 14.18 9.583 >10 3--10 <3Effectivepotassium (k) ppm 131.52 99.323 77.338 96.5 108.15 81 146 137 121 71.5 67.383 >100 50-100 <50
PH value 7.8 7.7-838 7.9 7.65 7.8 7.4 6.8-7.2 6.5-7.2 6.1-7.6 6.1-7.6 6.1-7.6Content oforganic matter % 1.895 1.4414 1.0017 I.39 1.1588 0.88 1.42 0.92 0.69 0.955 0.783 >2 1--2 <i
The conditions of soil fertility in each project area are provided in table 4.2.
Hebei project area
There are 7864 ha low yield field in the project area amounting to 26% of the totalcultivated area, the content of organic matter is usually about 0.8%, Nitrogen is0.05-0.06%, high effective Phosphorous is 5.2-6.5ppm, effective Potassium is64-83ppm, Phosphorous and Potassium are very short. The area of middle yield fieldis 20765.7 ha, the content of organic matter is about 0.92-1.31, Nitrogen is0.07-0.09%, high effective Phosphorous is 6.8-14ppm, effective Potassium is7910130ppm. There are totally 817 ha high yield field, the content of nutrient is1.1-1.7%, Nitrogen is 0.13-0.16%, high effective Phosphorous is 10.3-13.9ppm andeffective Potassium is about 95ppm.
The average content of Nitrogen in the high yield field of the project area is 0.13%,effective Phosphorous is 12.10 PPm, effective Potassium is 96.5OPPm, organicmatter is 1.39%. The average content of Nitrogen in the middle yield field of theproject area is 0.07%, effective Phosphorous is 8.86 PPm, effective Potassium is108 . 15 P Pm, organic matter is 1.16%. The average content of Nitrogen in the lowyield field of the project area is 0.06%, effective Phosphorous is 6.0 PPm, effectivePotassium is 8 1PPm, organic matter is 0.88% and the soil fertility is the third level.
Shenyang project areaMost of the content of organic matter is between 0.1% and 2.5% and its average is1.63%; of which, the area where the content of organic matter is more than 2.0%amounts to 74% and mainly distributes in Xinmin, Sujiatun, Xinchengzi and Yuhong;the area where the content of organic matter is between 1.0% and 2.0% amounts to2.7% and mainly distributes in Xinchengzi and Yuhong; the area where the content oforganic matter is less than 1.0% amounts to 23.1% and mainly distributes in Xinminand Faku.
The average nitrogen content in the project area is 0.094%, phosphorous is 5.5ppm
39
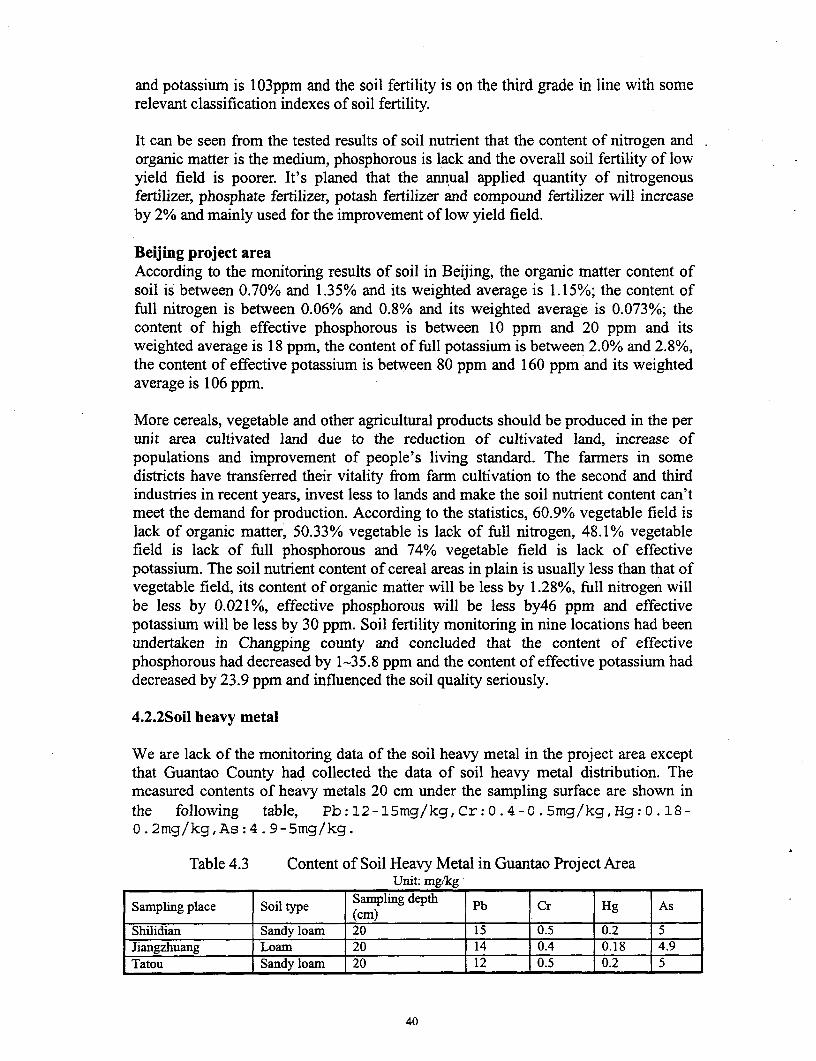
and potassium is 103ppm and the soil fertility is on the third grade in line with somerelevant classification indexes of soil fertility.
It can be seen from the tested results of soil nutrient that the content of nitrogen andorganic matter is the medium, phosphorous is lack and the overall soil fertility of lowyield field is poorer. It's planed that the annual applied quantity of nitrogenousfertilizer, phosphate fertilizer, potash fertilizer and compound fertilizer will increaseby 2% and mainly used for the improvement of low yield field.
Beijing project areaAccording to the monitoring results of soil in Beijing, the organic matter content ofsoil is between 0.70% and 1.35% and its weighted average is 1.15%; the content offull nitrogen is between 0.06% and 0.8% and its weighted average is 0.073%; thecontent of high effective phosphorous is between 10 ppm and 20 ppm and itsweighted average is 18 ppm, the content of full potassium is between 2.0% and 2.8%,the content of effective potassium is between 80 ppm and 160 ppm and its weightedaverage is 106 ppm.
More cereals, vegetable and other agricultural products should be produced in the perunit area cultivated land due to the reduction of cultivated land, increase ofpopulations and improvement of people's living standard. The farmers in somedistricts have transferred their vitality from farm cultivation to the second and thirdindustries in recent years, invest less to lands and make the soil nutrient content can'tmeet the demand for production. According to the statistics, 60.9% vegetable field islack of organic matter, 50.33% vegetable is lack of full nitrogen, 48.1% vegetablefield is lack of full phosphorous and 74% vegetable field is lack of effectivepotassium. The soil nutrient content of cereal areas in plain is usually less than that ofvegetable field, its content of organic matter will be less by 1.28%, full nitrogen willbe less by 0.021%, effective phosphorous will be less by46 ppm and effectivepotassium will be less by 30 ppm. Soil fertility monitoring in nine locations had beenundertaken in Changping county and concluded that the content of effectivephosphorous had decreased by 1-35.8 ppm and the content of effective potassium haddecreased by 23.9 ppm and influenced the soil quality seriously.
4.2.2Soil heavy metal
We are lack of the monitoring data of the soil heavy metal in the project area exceptthat Guantao County had collected the data of soil heavy metal distribution. Themeasured contents of heavy metals 20 cm under the sampling surface are shown inthe following table, Pb:12-15mg/kg,Cr:0.4-0.5mg/kg,Hg:0.18-0.2mg/kg,As:4.9-5mg/kg.
Table 4.3 Content of Soil Heavy Metal in Guantao Project AreaUnit: mg/kg
Sampling place Soil type Sampling depth Pb Cr Hg I As_ _ _ _ _ _ _ _ _ _ _ _ _ _ _ _ _ (cm )_ _ _ _ _ _ _ _ _ _ _
Shilidian Sandy loam 20 15 0.5 0.2 5Jiangzhuang Loam 20 14 0.4 0.18 4.9Tatou Sandy loam 20 12 0.5 0.2 5
40
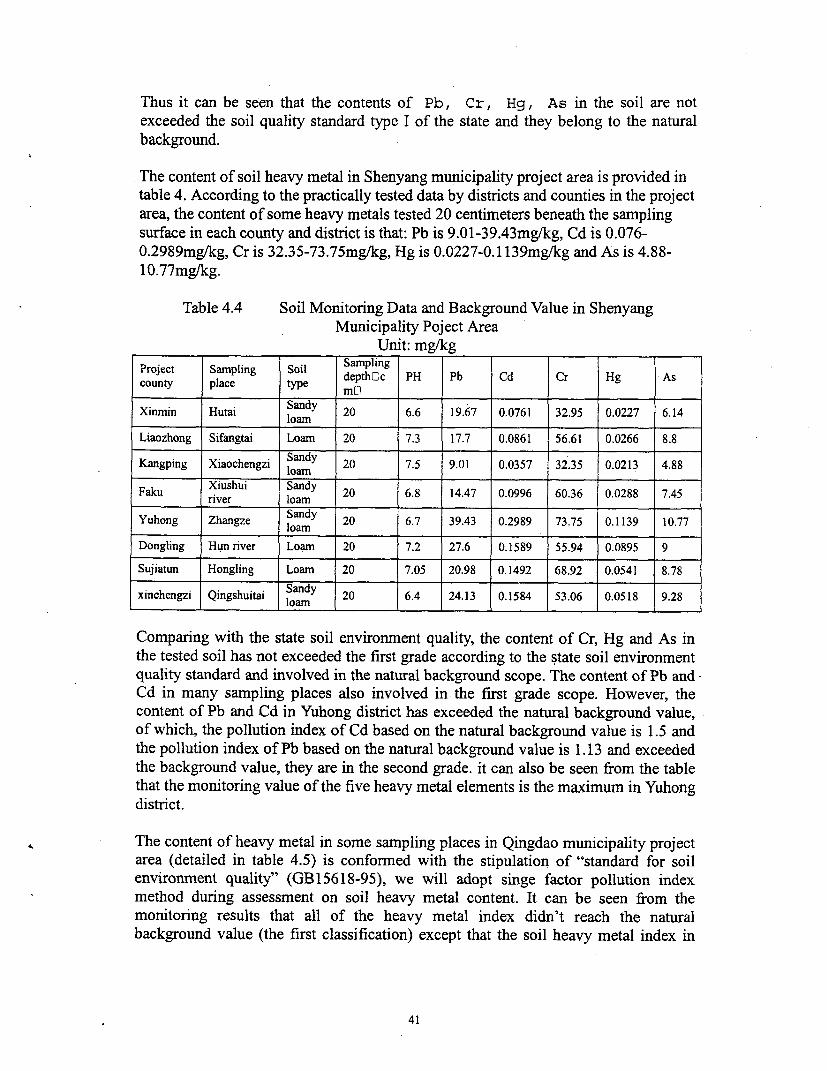
Thus it can be seen that the contents of Pb, Cr, Hg, As in the soil are notexceeded the soil quality standard type I of the state and they belong to the naturalbackground.
The content of soil heavy metal in Shenyang municipality project area is provided intable 4. According to the practically tested data by districts and counties in the projectarea, the content of some heavy metals tested 20 centimeters beneath the samplingsurface in each county and district is that: Pb is 9.01-39.43mg/kg, Cd is 0.076-0.2989mg/kg, Cr is 32.35-73.75mg/kg, Hg is 0.0227-0.1139mg/kg and As is 4.88-10.77mg/kg.
Table 4.4 Soil Monitoring Data and Background Value in ShenyangMunicipality Poject Area
Unit: mg/kgProject Sampling Soil Samplingo u n ty plamceP [g t yp e depth C c PH Pb Cd Cr Hg As
Xirnin Hutai loSam 20 6.6 19.67 0.0761 32.95 0.0227 6.14
Liaozhong Sifangtai Loam 20 7.3 17.7 0.0861 56.61 0.0266 8.8
SandyKangping Xiaochengzi loamt 20 7.5 9.01 0.0357 32.35 0.0213 4.88
Faku Xiushui Sandy 20 6.8 14.47 0.0996 60.36 0.0288 7.45river loam
Yuhong Zhangze Sandy 20 6.7 39.43 0.2989 73.75 0.1139 10.77__________ ~~~loamnI
Dongling Hun river Loam 20 7.2 27.6 0.1589 55.94 0.0895 9
Sujiatun Hongling Loam 20 7.05 20.98 0.1492 68.92 0.0541 8.78
xinchengzi Qingshuitai Sandy 20 6.4 24.13 0.1584 53.06 0.0518 9.28_______ __ _ _ _ _ _ _ _ _ _ _ loa m _n_ _
Comparing with the state soil environment quality, the content of Cr, Hg and As inthe tested soil has not exceeded the first grade according to the state soil environmentquality standard and involved in the natural background scope. The content of Pb andCd in many sampling places also involved in the first grade scope. However, thecontent of Pb and Cd in Yuhong district has exceeded the natural background value,of which, the pollution index of Cd based on the natural background value is 1.5 andthe pollution index of Pb based on the natural background value is 1.13 and exceededthe background value, they are in the second grade. it can also be seen from the tablethat the monitoring value of the five heavy metal elements is the maximum in Yuhongdistrict.
The content of heavy metal in some sampling places in Qingdao municipality projectarea (detailed in table 4.5) is conformed with the stipulation of "standard for soilenvironment quality" (GB15618-95), we will adopt singe factor pollution indexmethod during assessment on soil heavy metal content. It can be seen from themonitoring results that all of the heavy metal index didn't reach the naturalbackground value (the first classification) except that the soil heavy metal index in
41
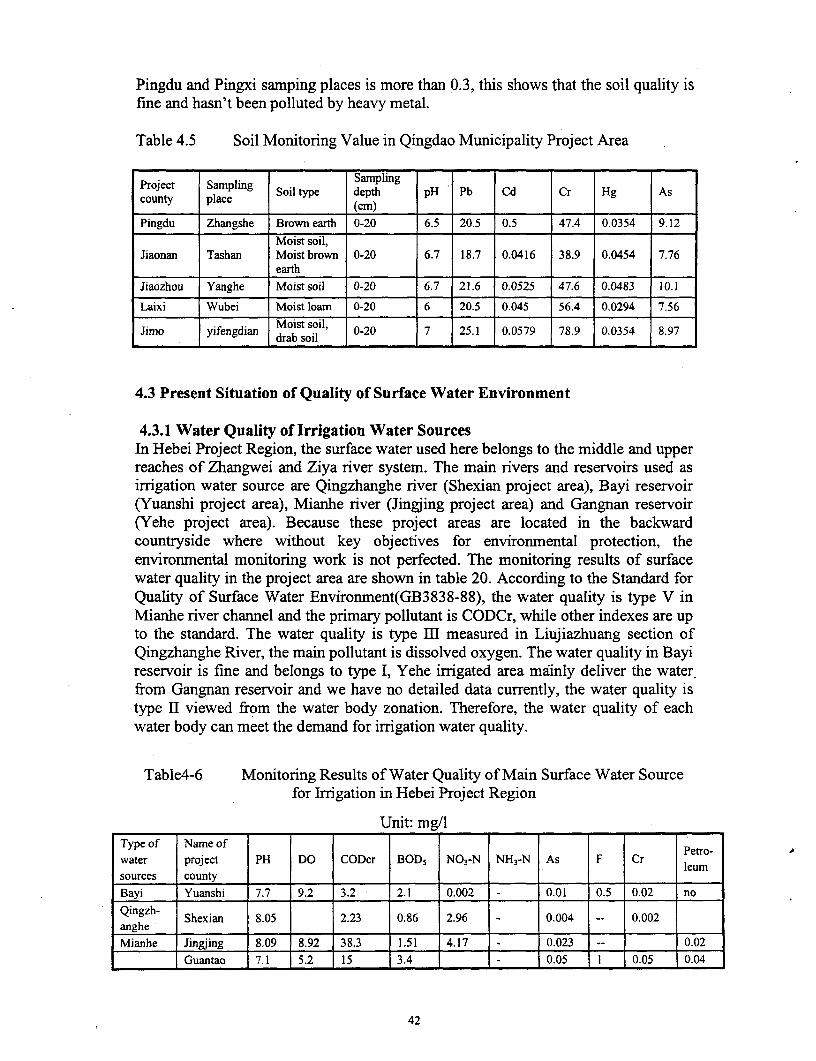
Pingdu and Pingxi samping places is more than 0.3, this shows that the soil quality isfine and hasn't been polluted by heavy metal.
Table 4.5 Soil Monitoring Value in Qingdao Municipality Project Area
Project Sampling Samplingcounty place Soil type depth pH Pb Cd Cr Hg As
COUflty ~~~~~~(cm) ___
Pingdu Zhangshe Brown earth 0-20 6.5 20.5 0.5 47.4 0.0354 9.12
Moist soil,Jiaonan Tashan Moist brown 0-20 6.7 18.7 0.0416 38.9 0.0454 7.76
_______ __ ____ ______ earth I__ __ _ _ I__ _ I__ _ _ _ _ _
Jiaozhou Yanghe Moist soil 0-20 6.7 21.6 0.0525 47.6 0.0483 10.1
Laixi Wubei Moist loam 0-20 6 20.5 0.045 56.4 0.0294 7.56
Jimo yifengdian Moist soil, 0-20 7 25.1 0.0579 78 9 0.0354 8.97______ __ ___ ______ drab soil _ _ _ _ _
4.3 Present Situation of Quality of Surface Water Environment
4.3.1 Water Quality of Irrigation Water SourcesIn Hebei Project Region, the surface water used here belongs to the middle and upperreaches of Zhangwei and Ziya river system. The main rivers and reservoirs used asirrigation water source are Qingzhanghe river (Shexian project area), Bayi reservoir(Yuanshi project area), Mianhe river (Jingjing project area) and Gangnan reservoir(Yehe project area). Because these project areas are located in the backwardcountryside where without key objectives for environmental protection, theenvironmental monitoring work is not perfected. The monitoring results of surfacewater quality in the project area are shown in table 20. According to the Standard forQuality of Surface Water Environment(GB3838-88), the water quality is type V inMianhe river channel and the primary pollutant is CODCr, while other indexes are upto the standard. The water quality is type III measured in Liujiazhuang section ofQingzhanghe River, the main pollutant is dissolved oxygen. The water quality in Bayireservoir is fine and belongs to type I, Yehe irrigated area mainly deliver the water.from Gangnan reservoir and we have no detailed data currently, the water quality istype II viewed from the water body zonation. Therefore, the water quality of eachwater body can meet the demand for irrigation water quality.
Table4-6 Monitoring Results of Water Quality of Main Surface Water Sourcefor Irrigation in Hebei Project Region
Unit: mg/lType of Name of Petro-water project PH DO CODcr BOD5 N0 3-N NH3-N As F Cr leum
sources county
Bayi Yuanshi 7.7 9.2 3.2 2.1 0.002 - 0.01 0.5 0.02 no
Qingzh- Shexian 8.05 2.23 0.86 2.96 - 0.004 -- 0.002anghe _ .Mianhe Jingjing 8.09 8.92 38.3 1 .51 4.17 0.023 0.02
Guantao 7.1 5.2 15 3.4 0.05 1 0.05 0.04
42
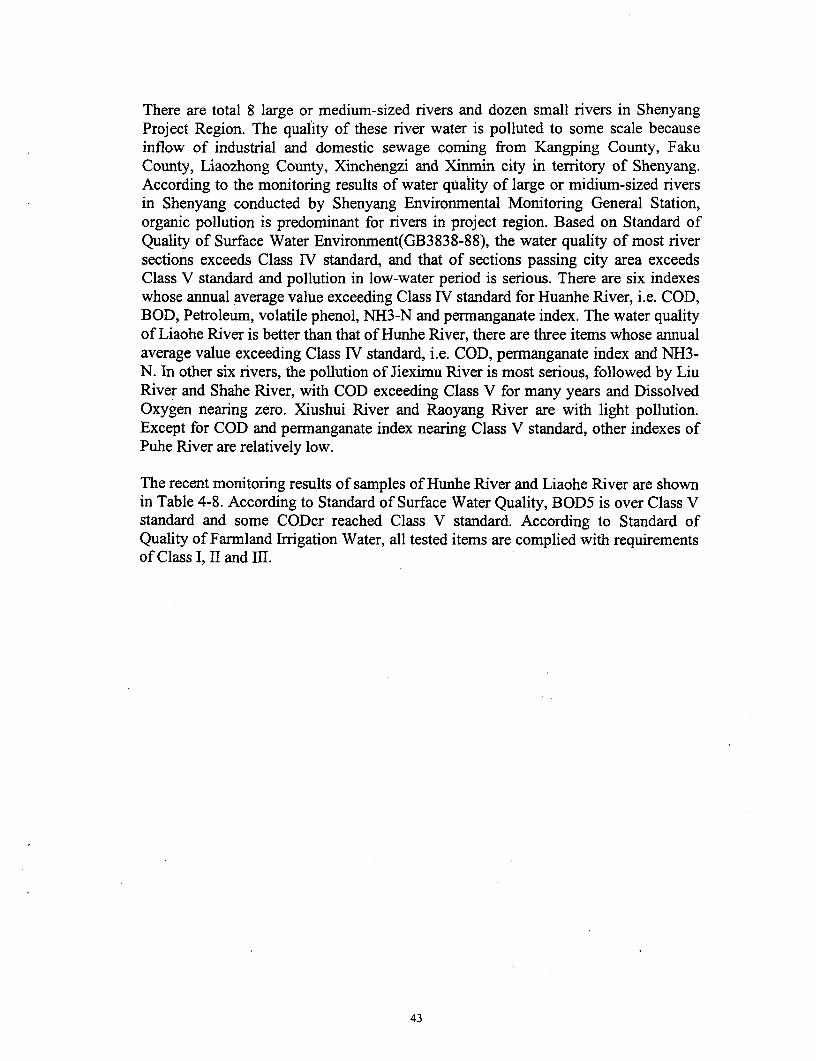
There are total 8 large or medium-sized rivers and dozen small rivers in ShenyangProject Region. The quality of these river water is polluted to some scale becauseinflow of industrial and domestic sewage coming from Kangping County, FakuCounty, Liaozhong County, Xinchengzi and Xinmin city in territory of Shenyang.According to the monitoring results of water quality of large or midium-sized riversin Shenyang conducted by Shenyang Environmental Monitoring General Station,organic pollution is predominant for rivers in project region. Based on Standard ofQuality of Surface Water Environment(GB3838-88), the water quality of most riversections exceeds Class IV standard, and that of sections passing city area exceedsClass V standard and pollution in low-water period is serious. There are six indexeswhose annual average value exceeding Class IV standard for Huanhe River, i.e. COD,BOD, Petroleum, volatile phenol, NH3-N and permanganate index. The water qualityof Liaohe River is better than that of Hunhe River, there are three items whose annualaverage value exceeding Class IV standard, i.e. COD, pernanganate index and NH3-N. In other six rivers, the pollution of Jieximu River is most serious, followed by LiuRiver and Shahe River, with COD exceeding Class V for many years and DissolvedOxygen nearing zero. Xiushui River and Raoyang River are with light pollution.Except for COD and permanganate index nearing Class V standard, other indexes ofPuhe River are relatively low.
The recent monitoring results of samples of Hunhe River and Liaohe River are shownin Table 4-8. According to Standard of Surface Water Quality, BOD5 is over Class Vstandard and some CODcr reached Class V standard. According to Standard ofQuality of Farmland Irrigation Water, all tested items are complied with requirementsof Class I, II and III.
43
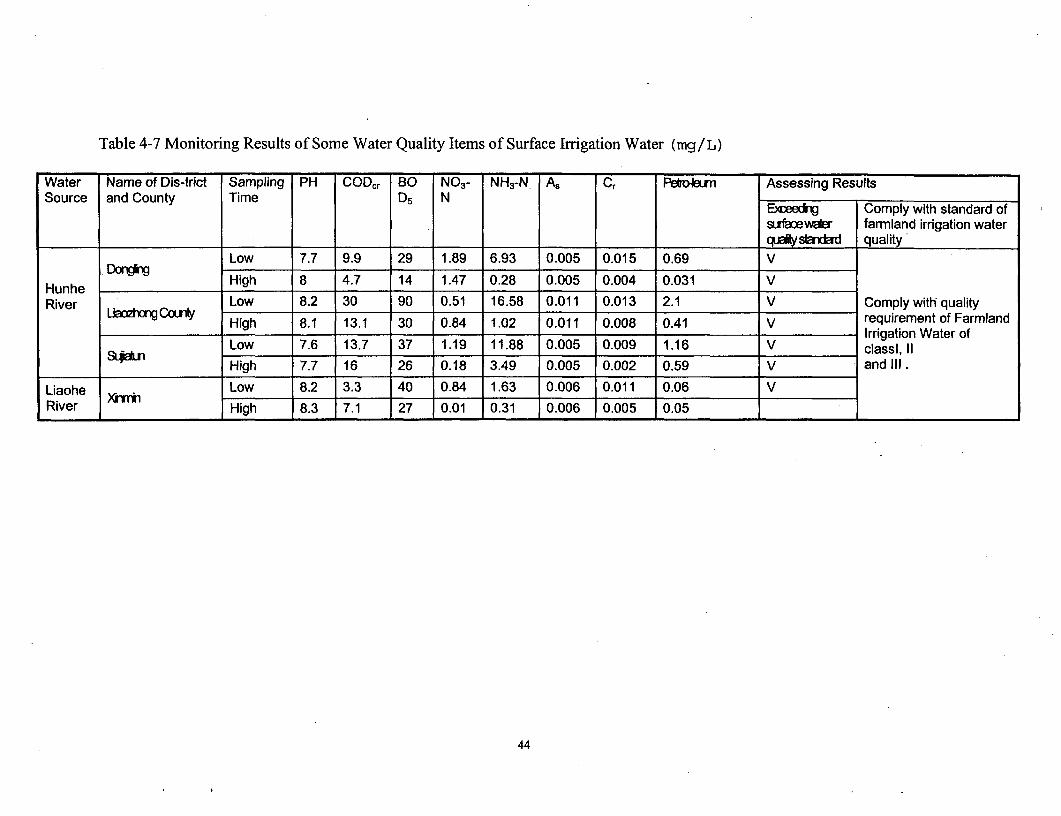
Table 4-7 Monitoring Results of Some Water Quality Items of Surface Irrigation Water (mg/L)
Water Name of Dis-trict Sampling PH CODcr BO NO3- NI-3-N A, Cr Peruoin Assessing ResultsSource and County Time D5 N _E)aeci Comply with standard of
sutfaewa$er farmland irrigation water._____ q.uRtystbndEd quality
Low 7.7 9.9 29 1.89 6.93 0.005 0.015 0.69 VDHunh _High 8 4.7 14 1.47 0.28 0.005 0.004 0.031 V
Hunhe_River Low 8.2 30 90 0.51 16.58 0.011 0.013 2.1 V Comply with quality
Lboeav Ca* High 8.1 13.1 30 0.84 1.02 0.011 0.008 0.41 V requirement of FarmlandIrrigation Water of
Low 7.6 13.7 37 1.19 11.88 0.005 0.009 1.16 V classi, 11______ ______________ High 7.7 16 26 0.18 3.49 0.005 0.002 0.59 V and ll.
Liaohe X Low 8.2 3.3 40 0.84 1.63 0.006 0.011 0.06 VRiver High 8.3 7.1 27 0.01 0.31 0.006 0.005 0.05
44
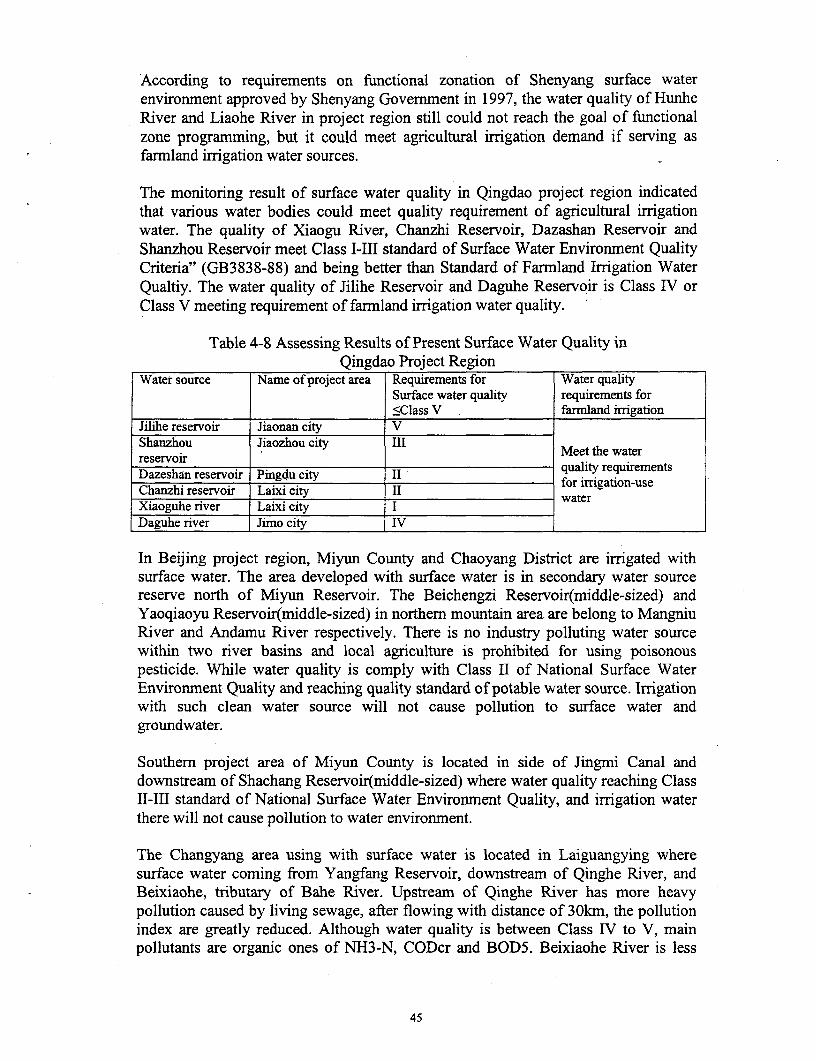
According to requirements on functional zonation of Shenyang surface waterenvironment approved by Shenyang Government in 1997, the water quality of HunheRiver and Liaohe River in project region still could not reach the goal of functionalzone programming, but it could meet agricultural irrigation demand if serving asfarmland irrigation water sources.
The monitoring result of surface water quality in Qingdao project region indicatedthat various water bodies could meet quality requirement of agricultural irrigationwater. The quality of Xiaogu River, Chanzhi Reservoir, Dazashan Reservoir andShanzhou Reservoir meet Class I-III standard of Surface Water Environment QualityCriteria" (GB3838-88) and being better than Standard of Farmland Irrigation WaterQualtiy. The water quality of Jilihe Reservoir and Daguhe Reservoir is Class IV orClass V meeting requirement of farmland irrigation water quality.
Table 4-8 Assessing Results of Present Surface Water Quality inQingdao Project Region
Water source Name of project area Requirements for Water qualitySurface water quality requirements for<_Class V farmland irrigation
Jilihe reservoir Jiaonan city VShanzho-u Jiaozhou city IIIreservoir Meet the waterDazeshan reservoir Pingdu city II quality requirementsChanzhi reservoir Laixi city for irrigation-useXiaoguhe river Laixi city waterDaguhe river Jimo city IV
In Beijing project region, Miyun County and Chaoyang District are irrigated withsurface water. The area developed with surface water is in secondary water sourcereserve north of Miyun Reservoir. The Beichengzi Reservoir(middle-sized) andYaoqiaoyu Reservoir(middle-sized) in northern mountain area are belong to MangniuRiver and Andamu River respectively. There is no industry polluting water sourcewithin two river basins and local agriculture is prohibited for using poisonouspesticide. While water quality is comply with Class II of National Surface WaterEnviromnent Quality and reaching quality standard of potable water source. Irrigationwith such clean water source will not cause pollution to surface water andgroundwater.
Southern project area of Miyun County is located in side of Jingmi Canal anddownstream of Shachang Reservoir(middle-sized) where water quality reaching Class11-III standard of National Surface Water Environment Quality, and irrigation waterthere will not cause pollution to water environment.
The Changyang area using with surface water is located in Laiguangying wheresurface water coming from Yangfang Reservoir, downstream of Qinghe River, andBeixiaohe, tributary of Bahe River. Upstream of Qinghe River has more heavypollution caused by living sewage, after flowing with distance of 30km, the pollutionindex are greatly reduced. Although water quality is between Class IV to V, mainpollutants are organic ones of NH3-N, CODcr and BOD5. Beixiaohe River is less
45
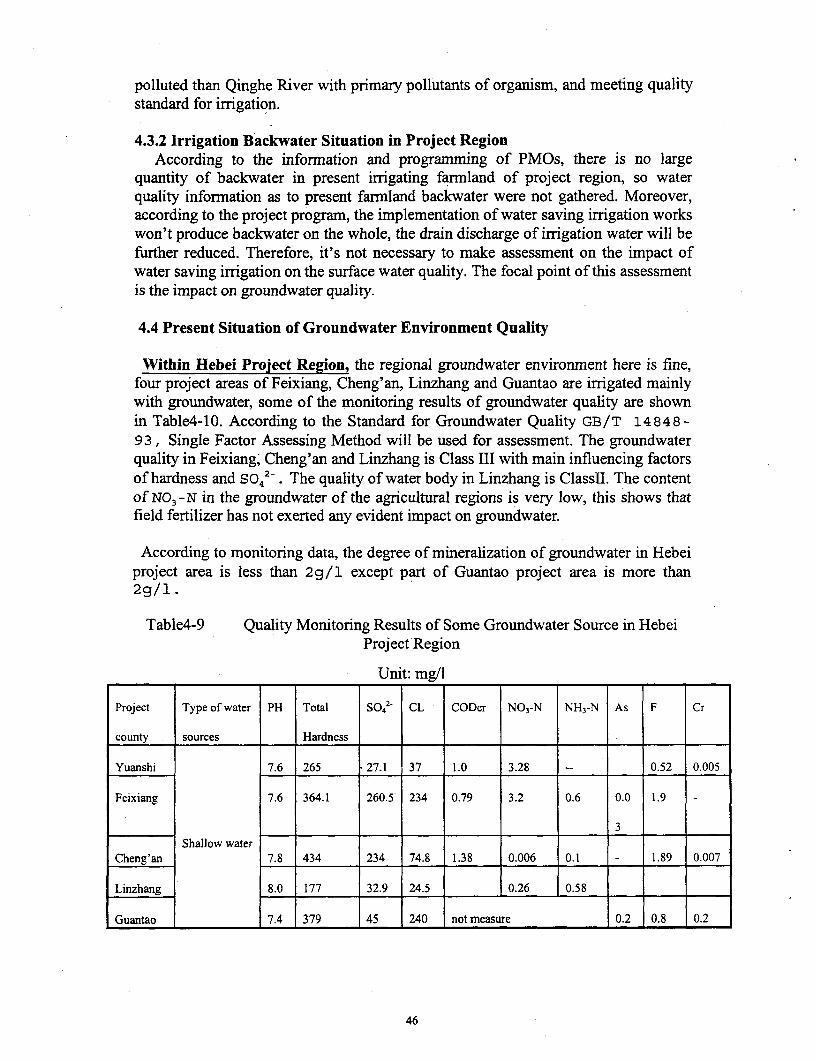
polluted than Qinghe River with primary pollutants of organism, and meeting qualitystandard for irrigation.
4.3.2 Irrigation Backwater Situation in Project RegionAccording to the information and programming of PMOs, there is no large
quantity of backwater in present irrigating farmland of project region, so waterquality information as to present farmland backwater were not gathered. Moreover,according to the project program, the implementation of water saving irrigation workswon't produce backwater on the whole, the drain discharge of irrigation water will befurther reduced. Therefore, it's not necessary to make assessment on the impact ofwater saving irrigation on the surface water quality. The focal point of this assessmentis the impact on groundwater quality.
4.4 Present Situation of Groundwater Environment Quality
Within Hebei Project Region, the regional groundwater environment here is fine,four project areas of Feixiang, Cheng'an, Linzhang and Guantao are irrigated mainlywith groundwater, some of the monitoring results of groundwater quality are shownin Table4-1O. According to the Standard for Groundwater Quality GB/T 14848-93, Single Factor Assessing Method will be used for assessment. The groundwaterquality in Feixiang, Cheng'an and Linzhang is Class III with main influencing factorsof hardness and S0 4
2- . The quality of water body in Linzhang is ClassII. The contentof NO3 -N in the groundwater of the agricultural regions is very low, this shows thatfield fertilizer has not exerted any evident impact on groundwater.
According to monitoring data, the degree of mineralization of groundwater in Hebeiproject area is less than 2g/1 except part of Guantao project area is more than2g/1.
Table4-9 Quality Monitoring Results of Some Groundwater Source in HebeiProject Region
Unit: mg/l
Project Type of water PH Total 5O,2 CL CODcr NO,-N NH3-N As F Cr
county sources Hardness
Yuanshi 7.6 265 27.1 37 1.0 3.28 -- 0.52 0.005
Feixiang 7.6 364.1 260.5 234 0.79 3.2 0.6 0.0 1.9
3
Shallow waterCheng'an 7.8 434 234 74.8 1.38 0.006 0.1 - 1.89 0.007
Linzhang 8.0 177 32.9 24.5 0.26 0.58
Guantao 7.4 379 45 240 not measure 0.2 0.8 0.2
46
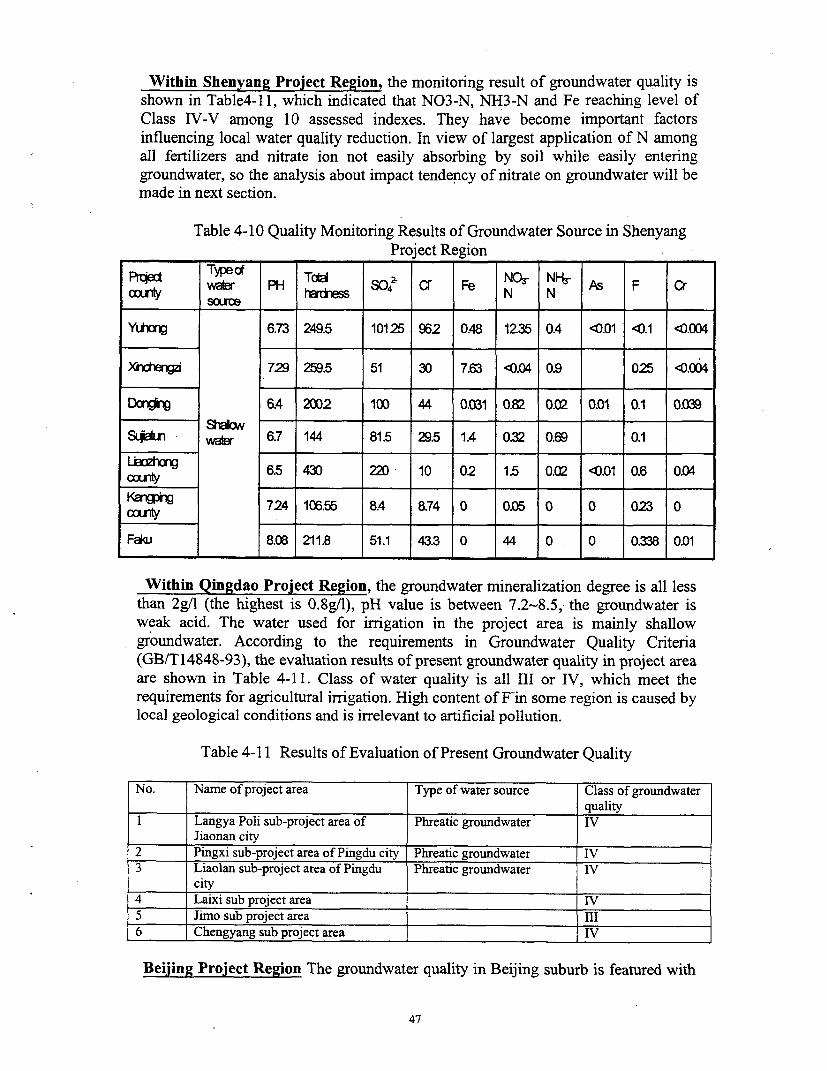
Within Shenyang Project Region, the monitoring result of groundwater quality isshown in Table4-1 1, which indicated that N03-N, N1H3-N and Fe reaching level ofClass IV-V among 10 assessed indexes. They have become important factorsinfluencing local water quality reduction. In view of largest application of N amongall fertilizers and nitrate ion not easily absorbing by soil while easily enteringgroundwater, so the analysis about impact tendency of nitrate on groundwater will bemade in next section.
Table 4-10 Quality Monitoring Results of Groundwater Source in ShenyangProject Region
Rl*d Typeof Tod NO~- NI~-IwaTer PH haFI _T SO04 a Fe N N As F Cr
Y .icng 6.73 249.5 10125 962 0.48 1235 0.4 <0.01 <01 <0.004
XIidAigzi 729 259.5 51 30 7.63 <0.04 0.9 025 <0.004
Dari*g 64 2002 100 44 0.031 0.82 0.02 0.01 0.1 0.039
ShaoNwaler 6.7 144 81.5 295 14 0.32 0.69 0.1
Layxrig 6.5 430 220 10 02 15 0.02 0.01 0.6 0.04
Klgpng 724 106.55 84 8.74 0 0.05 0 0 023 0
8.08 211.8 51.1 43.3 0 44 0 0 0.338 0.01
Within Qingdao Project Region, the groundwater mineralization degree is all lessthan 2g/l (the highest is 0.8g/1), pH value is between 7.2-8.5, the groundwater isweak acid. The water used for irrigation in the project area is mainly shallowgroundwater. According to the requirements in Groundwater Quality Criteria(GB/T14848-93), the evaluation results of present groundwater quality in project areaare shown in Table 4-11. Class of water quality is all III or IV, which meet therequirements for agricultural irrigation. High content of F-in some region is caused bylocal geological conditions and is irrelevant to artificial pollution.
Table 4-11 Results of Evaluation of Present Groundwater Quality
No. Name of project area Type of water source Class of groundwaterquality
Langya Poli sub-project area of Phreatic groundwater IVJiaonan city
2 Pingxi sub-project area of Pingdu city Phreatic groundwater IV3 Liaolan sub-project area of Pingdu Phreatic groundwater IV
city_ _ _ _ _ _ _ _
4 Laixi sub project area IV5 Jino sub project area III6 Chengyang sub project area IV
Beijing Project Region The groundwater quality in Beijing suburb is featured with
47
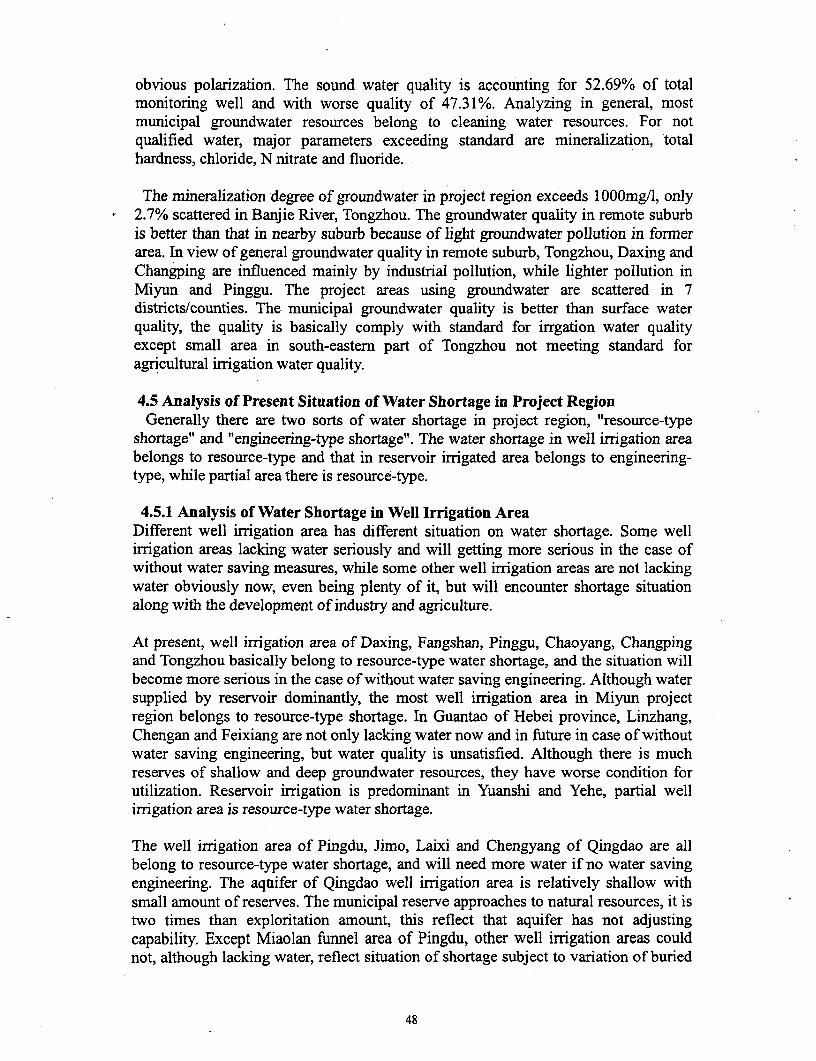
obvious polarization. The sound water quality is accounting for 52.69% of totalmonitoring well and with worse quality of 47.31%. Analyzing in general, mostmunicipal groundwater resources belong to cleaning water resources. For notqualified water, major parameters exceeding standard are mineralization, totalhardness, chloride, N nitrate and fluoride.
The mineralization degree of groundwater in project region exceeds 1OOOmg/l, only2.7% scattered in Banjie River, Tongzhou. The groundwater quality in remote suburbis better than that in nearby suburb because of light groundwater pollution in formerarea. In view of general groundwater quality in remote suburb, Tongzhou, Daxing andChangping are influenced mainly by industrial pollution, while lighter pollution inMiyun and Pinggu. The project areas using groundwater are scattered in 7districts/counties. The municipal groundwater quality is better than surface waterquality, the quality is basically comply with standard for irrgation water qualityexcept small area in south-eastern part of Tongzhou not meeting standard foragricultural irrigation water quality.
4.5 Analysis of Present Situation of Water Shortage in Project RegionGenerally there are two sorts of water shortage in project region, "resource-type
shortage" and "engineering-type shortage". The water shortage in well irrigation areabelongs to resource-type and that in reservoir irrigated area belongs to engineering-type, while partial area there is resource-type.
4.5.1 Analysis of Water Shortage in Well Irrigation AreaDifferent well irrigation area has different situation on water shortage. Some wellirrigation areas lacking water seriously and will getting more serious in the case ofwithout water saving measures, while some other well irrigation areas are not lackingwater obviously now, even being plenty of it, but will encounter shortage situationalong with the development of industry and agriculture.
At present, well irrigation area of Daxing, Fangshan, Pinggu, Chaoyang, Changpingand Tongzhou basically belong to resource-type water shortage, and the situation willbecome more serious in the case of without water saving engineering. Although watersupplied by reservoir dominantly, the most well irrigation area in Miyun projectregion belongs to resource-type shortage. In Guantao of Hebei province, Linzhang,Chengan and Feixiang are not only lacking water now and in future in case of withoutwater saving engineering, but water quality is unsatisfied. Although there is muchreserves of shallow and deep groundwater resources, they have worse condition forutilization. Reservoir irrigation is predominant in Yuanshi and Yehe, partial wellirrigation area is resource-type water shortage.
The well irrigation area of Pingdu, Jimo, Laixi and Chengyang of Qingdao are allbelong to resource-type water shortage, and will need more water if no water savingengineering. The aquifer of Qingdao well irrigation area is relatively shallow withsmall amount of reserves. The municipal reserve approaches to natural resources, it istwo times than exploritation amount, this reflect that aquifer has not adjustingcapability. Except Miaolan funnel area of Pingdu, other well irrigation areas couldnot, although lacking water, reflect situation of shortage subject to variation of buried
48
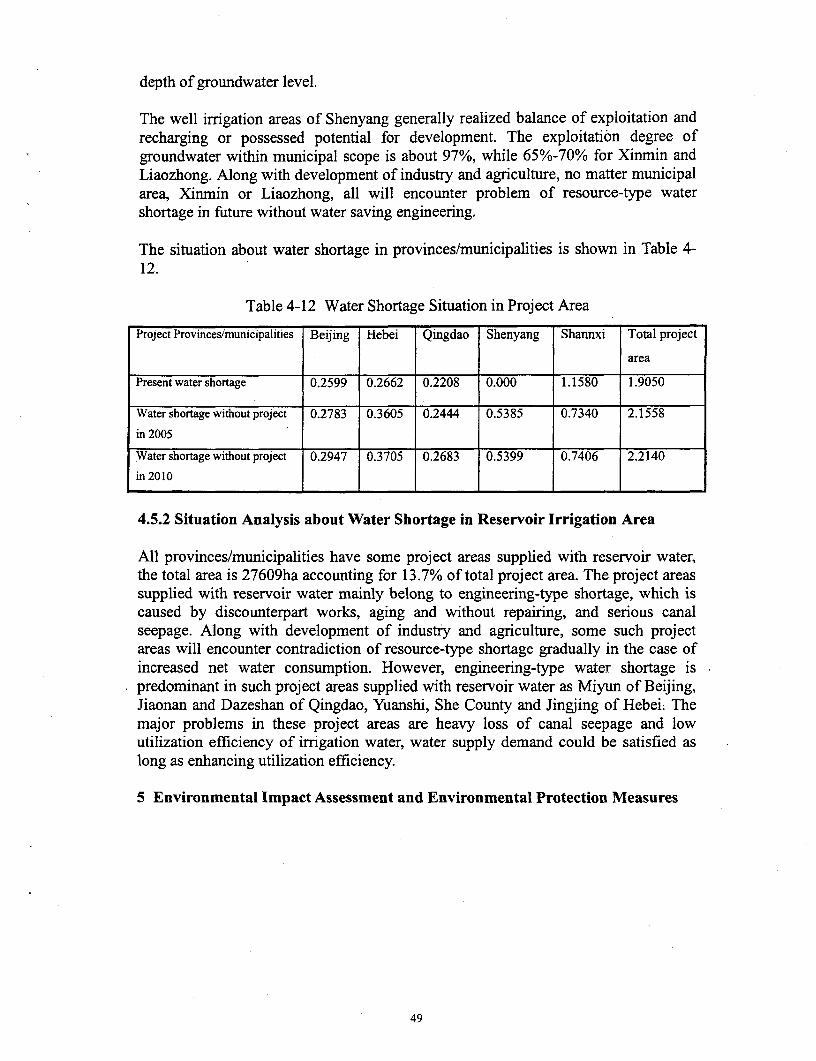
depth of groundwater level.
The well irrigation areas of Shenyang generally realized balance of exploitation andrecharging or possessed potential for development. The exploitation degree ofgroundwater within municipal scope is about 97%, while 65%-70% for Xinmin andLiaozhong. Along with development of industry and agriculture, no matter municipalarea, Xinmin or Liaozhong, all will encounter problem of resource-type watershortage in future without water saving engineering.
The situation about water shortage in provinces/municipalities is shown in Table 4-12.
Table 4-12 Water Shortage Situation in Project Area
Project Provinces/municipalities Beijing Hebei Qingdao Shenyang Shannxi Total project
area
Present water shortage 0.2599 0.2662 0.2208 0.000 1.1580 1.9050
Water shortage without project 0.2783 0.3605 0.2444 0.5385 0.7340 2.1558
in 2005
Water shortage without project 0.2947 0.3705 0.2683 0.5399 0.7406 2.2140
in 2010
4.5.2 Situation Analysis about Water Shortage in Reservoir Irrigation Area
All provinces/municipalities have some project areas supplied with reservoir water,the total area is 27609ha accounting for 13.7% of total project area. The project areassupplied with reservoir water mainly belong to engineering-type shortage, which iscaused by discounterpart works, aging and without repairing, and serious canalseepage. Along with development of industry and agriculture, some such projectareas will encounter contradiction of resource-type shortage gradually in the case ofincreased net water consumption. However, engineering-type water shortage ispredominant in such project areas supplied with reservoir water as Miyun of Beijing,Jiaonan and Dazeshan of Qingdao, Yuanshi, She County and Jingjing of Hebei. Themajor problems in these project areas are heavy loss of canal seepage and lowutilization efficiency of irrigation water, water supply demand could be satisfied aslong as enhancing utilization efficiency.
5 Environmental Impact Assessment and Environmental Protection Measures
49

5.lProject positive impact on the environment
Table 5-1 Positive Impact on Environment
Project Project component Environment impactWater Water diversion works: Reduce the seepage of canal, increase the utilization efficiency
canal lining, piping of water resources and alleviate the descent of groundwaterconserva level.ncy Field works: dripping Increase the utilization coefficient of irrigation water and the
ent irrigation, sprinkler guarantee rate of irrigation.et irrngation
Stalks used in field Increase the content of organic matter of soil, improve the soilmoisture, increase the soil capacity of water retention, waterstorage and water supply, reduce ineffective evaporation andregulate the field temperature.
Film covering Increase the land temperature, keep soil moisture, promote the
Agricult growth of crops and reduce ineffective evaporation.ural Deep plowing Increase the soil water storage capacity and the seepage depthcompon of soil moisture, accept more precipitation and irrigation water,ent combining deep plowing and applying fertilizer in layers can
improve the nutrient situations of root system.Water retention agent Keep water, save water and restrict the evaportransporation of
crops.
Fertilizer Improve the soil nutrient situations.Regulation of planting Save waste, reduce land pollution and improve the fieldstructure ecological environment.
Forest Field shelter forest Prevent wind, stabilize sand, conserve soil and water, improvecompon field microclimate and reduce soil evaporation and cropent evaportransporation.
-Manage Combined dispatch of Increase the utilization rate of precipitation and surface watermanage surface water and and increase the volume of groundwater recharging.
compon groundwaterent SIDD Improve water resources management
MIS system Raise the management level of resources and environment.
Increasing the utilization efficiency, improving the field ecological environment,increasing the yield of grains and promoting the coordinated development ofagriculture, the utilization of water resources and environmental protection is themain objectives of the project, so the project is an environmental improvementproject to a great extent. The main positive impact of water conservancy, agriculture,forestry and management water saving measures of the project on water resourcesenvironment are shown in table 5-1.
5.2 Analysis on the Impact of Water Saving Irrigation on GroundwaterEnvironment
50
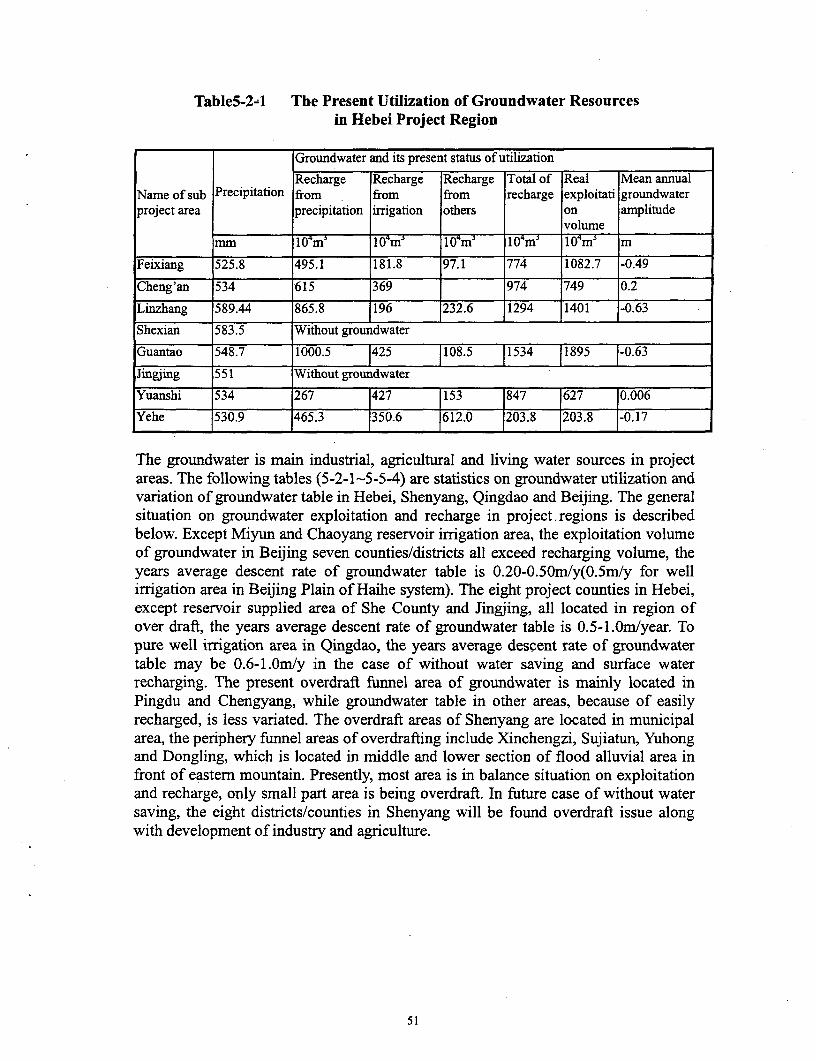
Table5-24 The Present Utilization of Groundwater Resourcesin Hebei Project Region
Groundwater and its present status of utilizationRecharge Recharge Recharge Total of Real Mean annual
Name of sub Precipitation from from from recharge exploitati groundwaterproject area precipitation irrigation others on amplitude
volumemm 17m-¶ 104m T1'IW 0iie fmW m
Feixiang 525.8 495.1 181.8 97.1 774 1082.7 -0.49
Cheng'an 534 615 369 974 749 0.2
Linzhang 589.44 865.8 196 232.6 1294 1401 -0.63
Shexian 583.5 Without groundwater
Guantao 548.7 1000.5 J425 1108.5 11534 11895 1-0.63
Jingjing 551 Without groundwater
Yuanshi 534 267 427 1153 1847 1627 10.006
Yehe 530.9 465.3 350.6 1612.0 1203.8 1 80.17
The groundwater is main industrial, agricultural and living water sources in projectareas. The following tables (5-2-1-5-5-4) are statistics on groundwater utilization andvariation of groundwater table in Hebei, Shenyang, Qingdao and Beijing. The generalsituation on groundwater exploitation and recharge in project.regions is describedbelow. Except Miyun and Chaoyang reservoir irrigation area, the exploitation volumeof groundwater in Beijing seven counties/districts all exceed recharging volume, theyears average descent rate of groundwater table is 0.20-O.5Om/y(O.5m/y for wellirrigation area in Beijing Plain of Haihe system). The eight project counties in Hebei,except reservoir supplied area of She County and Jingjing, all located in region ofover draft, the years average descent rate of groundwater table is 0.5-I.Om/year. Topure well irrigation area in Qingdao, the years average descent rate of groundwatertable may be 0.6-1.Om/y in the case of without water saving and surface waterrecharging. The present overdraft funnel area of groundwater is mainly located inPingdu and Chengyang, while groundwater table in other areas, because of easilyrecharged, is less variated. The overdraft areas of Shenyang are located in municipalarea, the periphery finnel areas of overdrafting include Xinchengzi, Sujiatun, Yuhongand Dongling, which is located in middle and lower section of flood alluvial area infront of eastern mountain. Presently, most area is in balance situation on exploitationand recharge, only small part area is being overdraft. In future case of without watersaving, the eight districts/counties in Shenyang will be found overdraft issue alongwith development of industry and agriculture.
51

Table 5-2-2 The Present Exploitation of Groundwater Resourcesin Shenyang Project Region
Groundwater Resources and Its Present Utilization Status
Name ofSub-project Piei. Reigeia n Oit1 Tdal . ArunRiMn
tatim Ph M104 F Rvge RWige R b vanadngeofrrm mn3 lay 1gi 104m3 -g m
Dongling 718 246 51.72 831.4 246 170.68 0.05
Yuhong 672 1377.9 36.0 527.1 2772.4 1369.9 0.01
Sujiatun 678.8 855.7 63.2 86.0 1042 263.85 0.86
Xinchengzi 671.1 736 174.7 0 827 643.85 0.3
Liaozhong 646.6 1747 148.5 520.8 22738 637.9 0.85County__ _ _ _ _ _ _ _ _ _ _ __ _ _ _ __ _ _ _
Xinmin City 618 1670.0 362.5 220.8 1947.0 1250.0 0.55
Kangping 624 1418.7 222.9 594.0 2235.6 578 0.01
Faku County 623.3 1545.8 127.22 330.7 2003.7 471.7 0.05
Total 56-718 9101.6 121.35 4245.94 13347.54 4394.60 0.01-0.86
Table 5-2-3 Present Status of Groundwater Utilization in Qingdao ProjectCounties in Typical Year
Project Precipitation Irrigation Other Total Real Yearlycounty replenishment replenishment replenishment replenishment extraction average
variation of____________ ______ __ _ _ _ groundwater
Name w 104my 104mi lni 04 10 4mi MJiaonan 719.5 913.2 128 1760.72 1217.6 0.05Jiaozhou 257 93 238 588 62.78 0.03Pingdu 499.5 772 673 1780.6 2033.1 -0.087Laixi 669.5 180 493 1623.4 1075 0.01Jimo 327.2 270.9 446.4 598.06 173.56 0.04Chengyang 115.8 74.1 117 259.9 263.8 -0.02Total of the 101088.9 10012.1 5800 116901 109863whole city
52

Table5-24 Present Status of Groundwater Utilization inBeijing Project Region in Typical Year
Recharge Irrigation Recharge Recharge Other Total Available PresentName from Recharge from river from side recharge recharge Exploitation exploitation
Precipi- seepage volume volume__ _ _ _ _tation
10 mo 10 mf T04¶ 10 mf lOTm f04¶T 10m f°
Fangshan 477.9 292.4 122.8 0.0 893.1 893.1 1034.5
Changping 67.9 36.1 137.1 241.1 241.1 248.9
Miyun 1476.9 885.8 268.1 -860.0 1770.8 1770.8 1972.1
Pinggu 321.0 146.9 31.1 499.1 499.1 614.6
Tongzhou 2739.4 1668.3 873.6 57.7 5339.0 5339.0 5989.2
Daxing 1814.8 1276.9 7.7 3099.5 3099.5 4540.7
Chaoyang 145.2 158.9 20.9 325.0 325.0 367.0
total 7043.2 4465.3 1453.6 -860.0 65.4 12167.6 12167.6 14767.0
5.2.1 Impact of Water Saving Irrigation on Groundwater LevelAssessing theory and method Balance method(l) will be adopted in the assessment,the process of nourishment of precipitation, field evaportransporation, runoff and
drainage will be considered mainly, they can be summarized as the following chart.
Figure5-1 Chart of Water Balance Elements and Flow
P ET ET.n
RS; > f fWR nfWL RSaP EG CRS ,Ir 0
. i! t; ; ~AeratiorL
t Ah Water leve gradient
RG RG0
aquifer
The meaning of each parameter in the figure is shown as below:
P- precipitation;
ETf-evaportransporation in cultivated area, mm;
ETfnf-evaportransporation in non-cultivated area, mm;
WR- water supply from reservoiroused for irrigation, mm;
WIR- pumped groundwater volume for irrigation, mm;
53
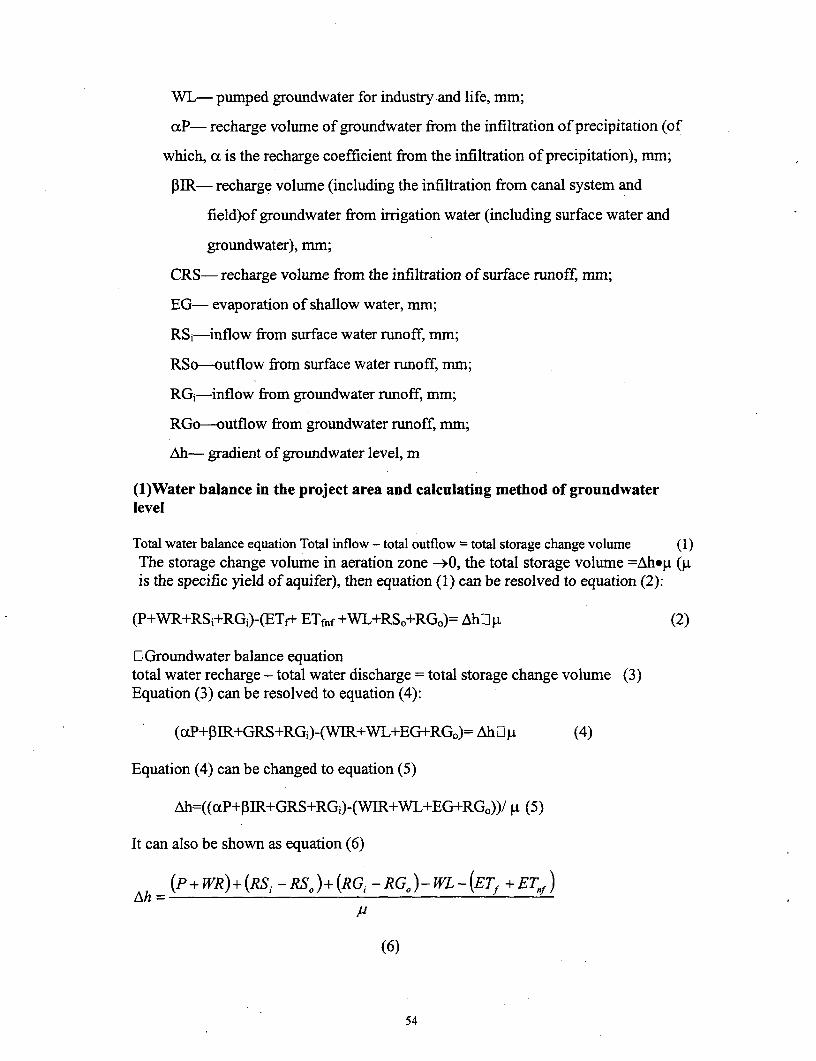
WL- pumped groundwater for industry and life, mm;
aP- recharge volume of groundwater from the infiltration of precipitation (of
which, a is the recharge coefficient from the infiltration of precipitation), mm;
IR- recharge volume (including the infiltration from canal system and
field)of groundwater from irrigation water (including surface water and
groundwater), mm;
CRS- recharge volume from the infiltration of surface runoff, mm;
EG- evaporation of shallow water, mm;
RS 1 -inflow from surface water runoff, mm;
RSo-outflow from surface water runoff, mm;
RG 1 -inflow from groundwater runoff, mm;
RGo-outflow from groundwater runoff, mm;
Ah- gradient of groundwater level, m
(1)Water balance in the project area and calculating method of groundwaterlevel
Total water balance equation Total inflow - total outflow = total storage change volume (1)The storage change volume in aeration zone -*O0, the total storage volume =Ahep (jiis the specific yield of aquifer), then equation (1) can be resolved to equation (2):
(P+WR+RSi+RGi)-(ETf+ ETfnf +WL+RS0 +RG0 )= AhOXi (2)
Fl Groundwater balance equationtotal water recharge - total water discharge = total storage change volume (3)Equation (3) can be resolved to equation (4):
(aP+,IR+GRS+RGj)-(WIR+WL+EG+RGO)= AhOp (4)
Equation (4) can be changed to equation (5)
Ah=((aP+f3IR+GRS+RG 1 )-(WIR+WL+EG+RG 0 ))/ p. (5)
It can also be shown as equation (6)
(P-+ WR)+ (RS, -RSo)+ (RG, -RGo)-WL-(ETf + ETf)Ah=
'U
(6)
54
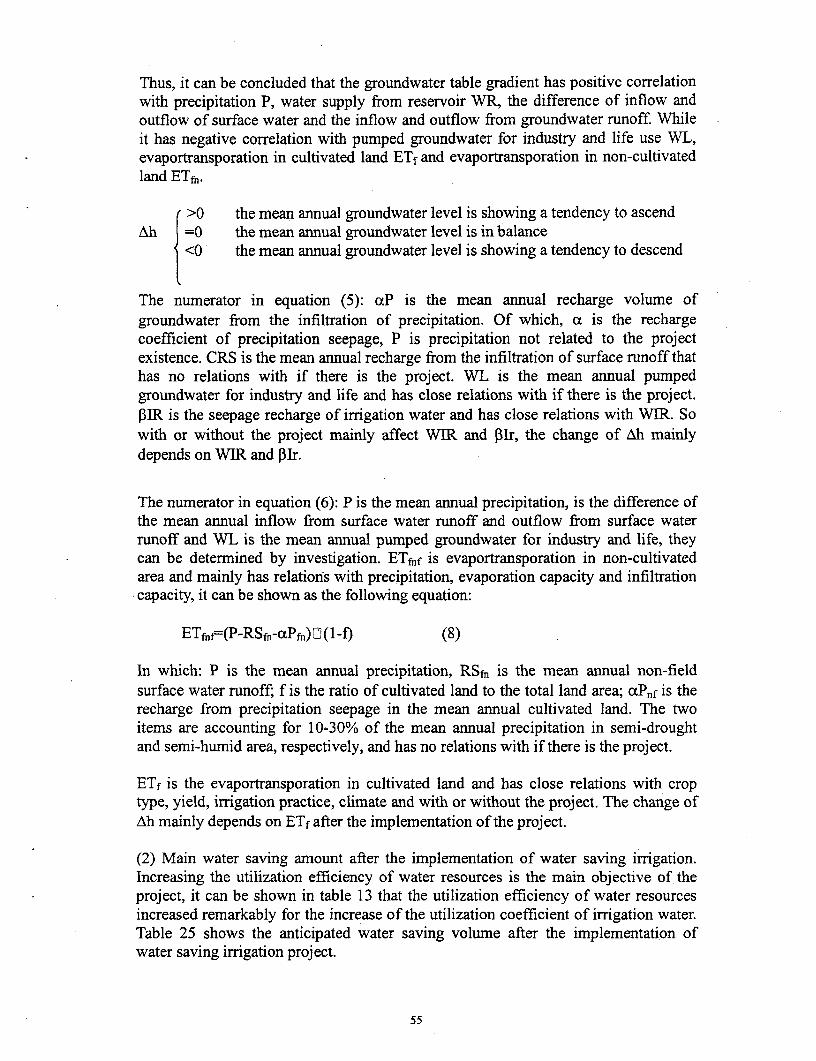
Thus, it can be concluded that the groundwater table gradient has positive correlationwith precipitation P, water supply from reservoir WR, the difference of inflow andoutflow of surface water and the inflow and outflow from groundwater runoff. Whileit has negative correlation with pumped groundwater for industry and life use WL,evaportransporation in cultivated land ETf and evaportransporation in non-cultivatedland ETfn.
>0 the mean annual groundwater level is showing a tendency to ascendAh =0 the mean annual groundwater level is in balance{<0 the mean annual groundwater level is showing a tendency to descend
The numerator in equation (5): aP is the mean annual recharge volume ofgroundwater from the infiltration of precipitation. Of which, a is the rechargecoefficient of precipitation seepage, P is precipitation not related to the projectexistence. CRS is the mean annual recharge from the infiltration of surface runoff thathas no relations with if there is the project. WL is the mean annual pumpedgroundwater for industry and life and has close relations with if there is the project.PIR is the seepage recharge of irrigation water and has close relations with WIR. Sowith or without the project mainly affect WIR and 3Ir, the change of Ah mainlydepends on WIR and ,lr.
The numerator in equation (6): P is the mean annual precipitation, is the difference ofthe mean annual inflow from surface water runoff and outflow from surface waterrunoff and WL is the mean annual pumped groundwater for industry and life, theycan be determined by investigation. ETffif is evaportransporation in non-cultivatedarea and mainly has relations with precipitation, evaporation capacity and infiltrationcapacity, it can be shown as the following equation:
ETfnf=(P-RSf,.-aPfn) 0 (1 -f) (8)
In which: P is the mean annual precipitation, RSf, is the mean annual non-fieldsurface water runoff; f is the ratio of cultivated land to the total land area; aPnf is therecharge from precipitation seepage in the mean annual cultivated land. The twoitems are accounting for 10-30% of the mean annual precipitation in semi-droughtand semi-humid area, respectively, and has no relations with if there is the project.
ETf is the evaportransporation in cultivated land and has close relations with croptype, yield, irrigation practice, climate and with or without the project. The change ofAh mainly depends on ETf after the implementation of the project.
(2) Main water saving amount after the implementation of water saving irrigation.Increasing the utilization efficiency of water resources is the main objective of theproject, it can be shown in table 13 that the utilization efficiency of water resourcesincreased remarkably for the increase of the utilization coefficient of irrigation water.Table 25 shows the anticipated water saving volume after the implementation ofwater saving irrigation project.
55

Table 5-3-1 Water Saving Amount after the Project Implementation in Hebei
Name of sub project areaSource of some main water saving Totalvolume Feixiang Cheng'an Linzhang Shexian Guantao Jingjing Yuanshi Yehe
Canal lining in canal irrigated area 90 676.9 without 586 881.2 2234.1
land leveling in canal irrigated area 42 15.4 15.3 51.6 124.3
Improvement of management in 15.4 16 31.4canal irrigated areaChanging surface irrigation with 527.7 159 467 700 1853.7low pressure pipe irrigation andsmall block irrigationChanging surface irrigation with 261.2 30 51.8 343sprinkler irrigationChanging surface irrigation of fruit 5.8 5.8trees with dripping and microsprinkler irrigationChanging surface irrigation of 79.6 81.1 160.7vegetable with dripping and microsprinkler irrigation
Other special water saving volume 144.3 144.3
Total 868.5 321 467 707.7 983 0 601.3 948.8 4897.3
The objective of this project is to increase utilization efficiency of water resources.For increasing of utilization efficiency of irrigation water, the utilization efficiency ofwater resources is enhanced obviously. The following tables(5-3-1-5-3-4) show theinformation about anticipated water saving amount in Hebei, Shenyang, Qingdao andBeijing after project implemented.
Table 5-3-2 Water Saving Amount with Irrigation Works in Project Counties ofShenyang Municipality (unit: 1 04mV)
Source of some main water saving Name of sub-project areavolume
Dongling Yuhong Sujiatun Xinchengzi Liaozhogn Xinmin Kangping Faku
Canal lining in canal irrigated 13.26 55.41 36.71 107.21 60.7 144.69 73.02areaChanging surface irrigation with 66.76 63.4 71.24 159.05low pressure pipe irrigation andsmall block irrigationChanging surface irrigation with 313.3 137.73 274.82 379.72 701.96 899.87 830.94sprinkler irrigationChanging surface irrigation of 1 6.8 9.86 4.8fruit trees with dripping and microsprinkler irrigationChanging sprinkler of fruit trees 46.41 47.71with drip irrigation and microsprinkler irrigationChanging surface irrigation of 37.84 206.7 140.82 99.46 64.44 134.5 45.2 91.64vegetable with dripping and microsprinkler irrigation
56
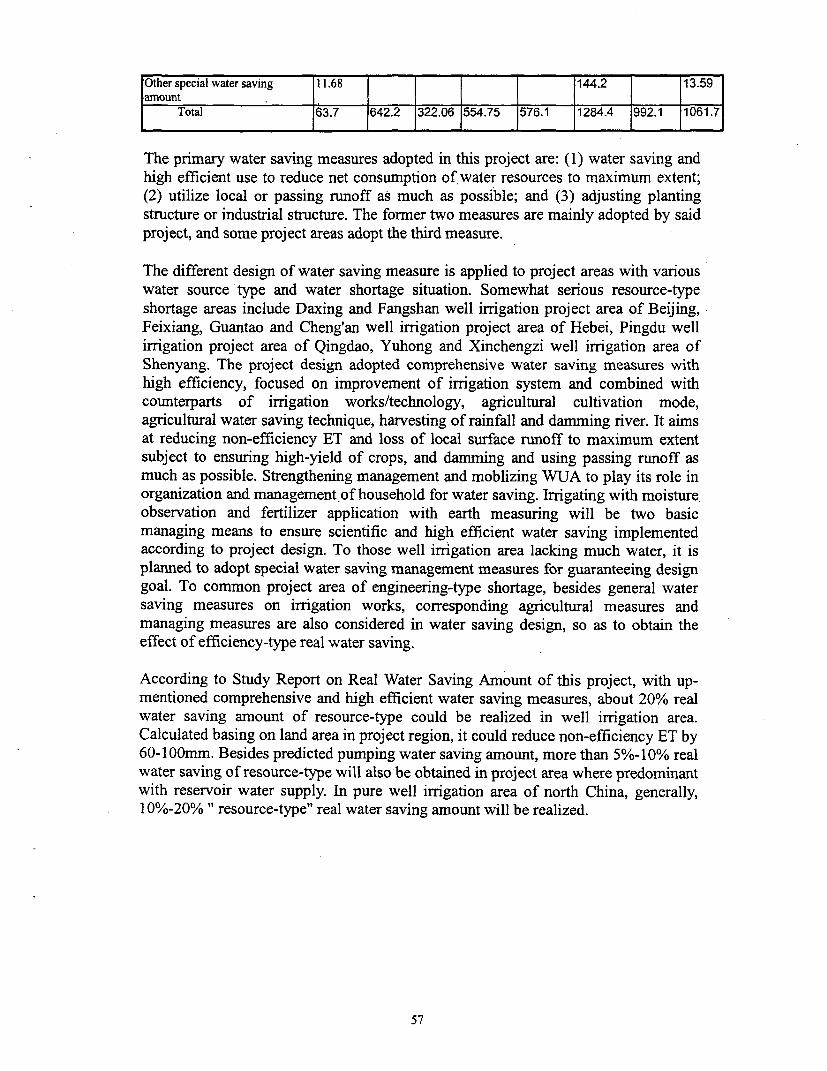
Other special water saving 11.68 144.2 13.59amount
Total 63.7 642.2 322.06 554.75 576.1 1284.4 992.1 1061.7
The primary water saving measures adopted in this project are: (1) water saving andhigh efficient use to reduce net consumption of water resources to maximum extent;(2) utilize local or passing runoff as much as possible; and (3) adjusting plantingstructure or industrial structure. The former two measures are mainly adopted by saidproject, and some project areas adopt the third measure.
The different design of water saving measure is applied to project areas with variouswater source type and water shortage situation. Somewhat serious resource-typeshortage areas include Daxing and Fangshan well irrigation project area of Beijing,Feixiang, Guantao and Cheng'an well irrigation project area of Hebei, Pingdu wellirrigation project area of Qingdao, Yuhong and Xinchengzi well irrigation area ofShenyang. The project design adopted comprehensive water saving measures withhigh efficiency, focused on improvement of irrigation system and combined withcounterparts of irrigation works/technology, agricultural cultivation mode,agricultural water saving technique, harvesting of rainfall and damming river. It aimsat reducing non-efficiency ET and loss of local surface runoff to maximum extentsubject to ensuring high-yield of crops, and damming and using passing runoff asmuch as possible. Strengthening management and moblizing WUA to play its role inorganization and management of household for water saving. Irrigating with moistureobservation and fertilizer application with earth measuring will be two basicmanaging means to ensure scientific and high efficient water saving implementedaccording to project design. To those well irrigation area lacking much water, it isplanned to adopt special water saving management measures for guaranteeing designgoal. To common project area of engineering-type shortage, besides general watersaving measures on irrigation works, corresponding agricultural measures andmanaging measures are also considered in water saving design, so as to obtain theeffect of efficiency-type real water saving.
According to Study Report on Real Water Saving Amount of this project, with up-mentioned comprehensive and high efficient water saving measures, about 20% realwater saving amount of resource-type could be realized in well irrigation area.Calculated basing on land area in project region, it could reduce non-efficiency ET by60-100mm. Besides predicted pumping water saving amount, more than 5%-10% realwater saving of resource-type will also be obtained in project area where predominantwith reservoir water supply. In pure well irrigation area of north China, generally,10%-20% " resource-type" real water saving amount will be realized.
57

Table5-3-3 Water Saving Amount with Irrigation Works in Project Counties ofQingdao City (unit :1 04 m 3 )
Name of Project CountyMajor Water Saving Source Jiaonan Jiaozhou Pingdu Laixi Jimo Chengyang Total
Canal lining in canal irrigated area 174.8 421 164.6 760.4
land leveling in canal irrigated area 68.5 220 124.2 412.7
Improvement of management in 98.5 98.5canal irrigated areaOther irrigation works in canal 40.1 40.1irrigation areaChanging earth canal divery in well 338.5irrigation area with canal liningChanging surface irrigation with low 104 487 491.6 496 171.3 1749.9pressure pipe irrigation and smallblock irrigationChanging surface irrigation with 153 320 473sprinkler irrigationChanging surface irrigation with fruit 60 252.1 53.6 365.7tree drip irrigation and microsprinkler irrigation :Chaning surface irrigation of 112 45.6 157.6vegetable field with drip irrigationand mini-sprinkler irrigationChanging sprinkler of vegetable field 121with drip irrigation and niini-irrigationTotal 500.3 641 1572.9 663.6 869.1 270.5 4517.4
Table5-3-3 Water Saving Amount with Irrigation Works in Project Counties ofBeijing Municipality
Unit: 1000Om 3
Name of Project County
Main Water Saving Source Fangshan Changping Miyun Pinggu Tongzhou Daxing Chaoyang Total
Canal anti-seepage in canal irrigation 436.4 436.4area or canal delivery water savingChanging surface irrigation with low 304.5 1045.3 136.6 1112.2 1236.2 154.1 3988.9pressure pipe irrigation and smallblock irrigation _
Changing surface irrigatuib of 34.1 108.3 125.0 73.7 341.0vegetable field with drip irrigationand mini-irrigationOther special water saving amount 69.7 6.7 0.0 0.0 887.3 1212.7 0.0 2176.4
Total 374.2 40.8 1590.0 136.6 1999.5 2573.9 227.8 6942.8
58
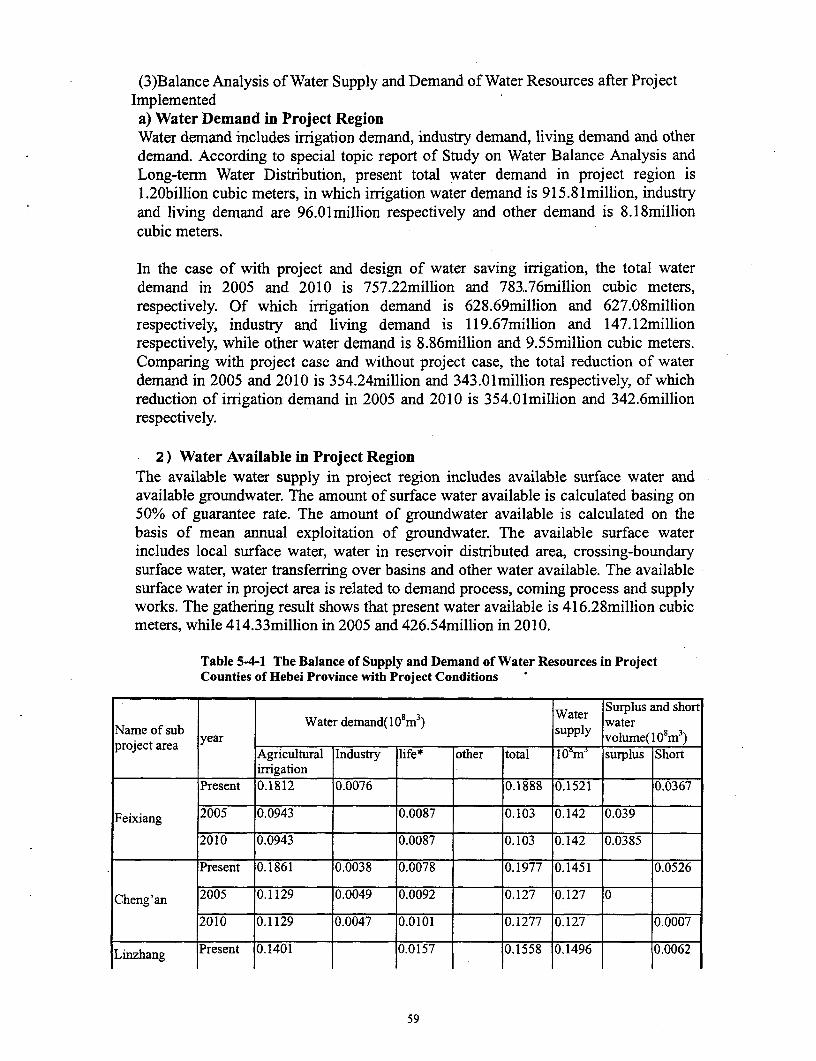
(3)Balance Analysis of Water Supply and Demand of Water Resources after ProjectImplementeda) Water Demand in Project RegionWater demand includes irrigation demand, industry demand, living demand and otherdemand. According to special topic report of Study on Water Balance Analysis andLong-term Water Distribution, present total water demand in project region is1.20billion cubic meters, in which irrigation water demand is 915.81million, industryand living demand are 96.01million respectively and other demand is 8.18millioncubic meters.
In the case of with project and design of water saving irrigation, the total waterdemand in 2005 and 2010 is 757.22million and 783.76million cubic meters,respectively. Of which irrigation demand is 628.69million and 627.08millionrespectively, industry and living demand is 119.67million and 147.12millionrespectively, while other water demand is 8.86million and 9.55million cubic meters.Comparing with project case and without project case, the total reduction of waterdemand in 2005 and 2010 is 354.24million and 343.01million respectively, of whichreduction of irrigation demand in 2005 and 2010 is 354.01million and 342.6millionrespectively.
- 2) Water Available in Project RegionThe available water supply in project region includes available surface water andavailable groundwater. The amount of surface water available is calculated basing on50% of guarantee rate. The amount of groundwater available is calculated on thebasis of mean annual exploitation of groundwater. The available surface waterincludes local surface water, water in reservoir distributed area, crossing-boundarysurface water, water transferring over basins and other water available. The availablesurface water in project area is related to demand process, coming process and supplyworks. The gathering result shows that present water available is 416.28million cubicmeters, while 414.33million in 2005 and 426.54million in 2010.
Table 54-1 The Balance of Supply and Demand of Water Resources in ProjectCounties of Hebei Province with Project Conditions
WtrSurplus and shortWater demand(1 08m3) Water water
Name of sub yersupply VOIUMe(1I08M3)
project area year Agricultural Industry life* other total Ispl surplus Shortrrigation
Present 0.1812 0.0076 0.1888 0.1521 0.0367
Feixiang 2005 0.0943 0.0087 0.103 0.142 0.039
2010 0.0943 0.0087 0.103 0.142 0.0385
Present 0.1861 0.0038 0.0078 0.1977 0.1451 0.0526
Cheng'an 2005 0.1129 0.0049 0.0092 0.127 0.127 0
2010 0.1129 0.0047 0.0101 0.1277 0.127 0.0007
Linzhang Present 0.1401 0.0157 0.1558 0.1496 0.0062
59
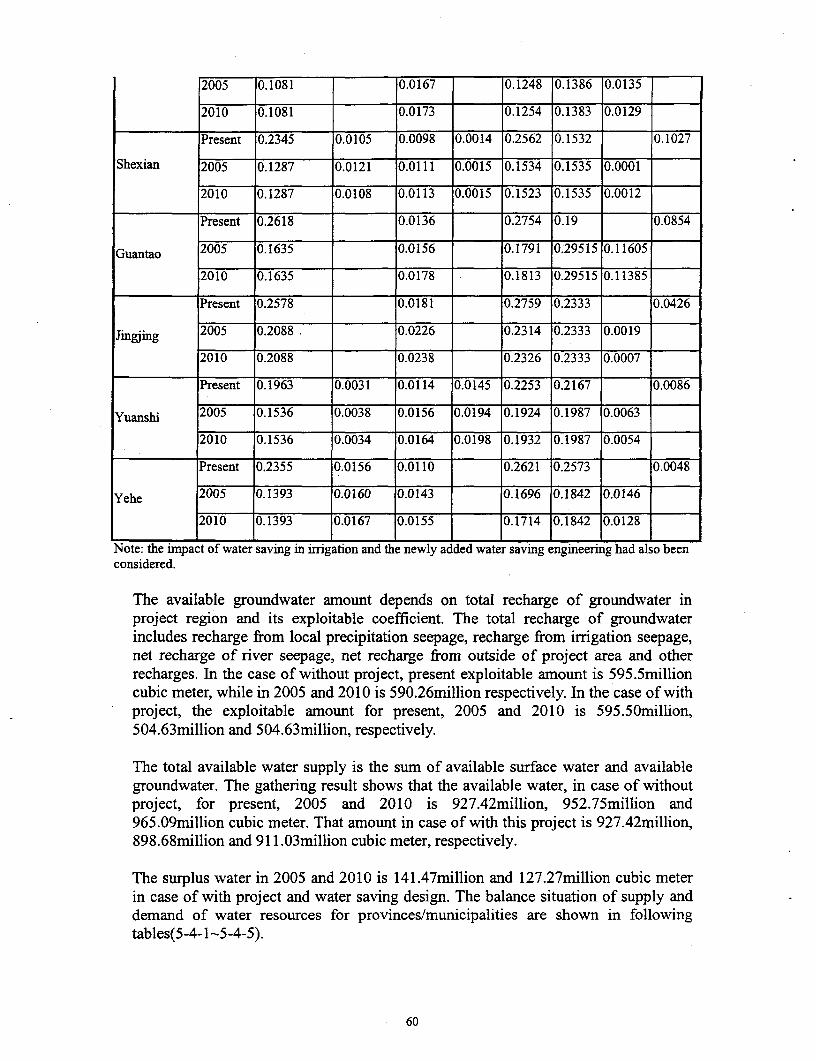
2005 0.1081 0.0167 0.1248 0.1386 0.0135
2010 0.1081 0.0173 0.1254 0.1383 0.0129
Present 0.2345 0.0105 0.0098 0.0014 0.2562 0.1532 0.1027
Shexian 2005 0.1287 0.0121 0.0111 0.0015 0.1534 0.1535 0.0001
2010 0.1287 0.0108 0.0113 0.0015 0.1523 0.1535 0.0012
Present 0.2618 0.0136 0.2754 0.19 0.0854
Guantao 2005 0.1635 0.0156 0.1791 0.29515 0.11605
2010 0.1635 0.0178 0.1813 0.29515 0.11385
Present 0.2578 0.0181 0.2759 0.2333 0.0426
Jingjing 2005 0.2088 0.0226 0.2314 0.2333 0.0019
2010 0.2088 0.0238 0.2326 0.2333 0.0007
Present 0.1963 0.0031 0.0114 0.0145 0.2253 0.2167 0.0086
Yuanshi 2005 0.1536 0.0038 0.0156 0.0194 0.1924 0.1987 0.0063
2010 0.1536 0.0034 0.0164 0.0198 0.1932 0.1987 0.0054
Present 0.2355 0.0156 0.0110 0.2621 0.2573 0.0048
Yehe 2005 0.1393 0.0160 0.0143 0.1696 0.1842 0.0146
2010 0.1393 0.0167 0.0155 0.1714 0.1842 0.0128
Note: the impact of water saving in irrigation and the newly added water saving engineering had also beenconsidered.
The available groundwater amount depends on total recharge of groundwater inproject region and its exploitable coefficient. The total recharge of groundwaterincludes recharge from local precipitation seepage, recharge from irrigation seepage,net recharge of river seepage, net recharge from outside of project area and otherrecharges. In the case of without project, present exploitable amount is 595.5millioncubic meter, while in 2005 and 2010 is 590.26million respectively. In the case of withproject, the exploitable amount for present, 2005 and 2010 is 595.50million,504.63million and 504.63million, respectively.
The total available water supply is the sum of available surface water and availablegroundwater. The gathering result shows that the available water, in case of withoutproject, for present, 2005 and 2010 is 927.42million, 952.75million and965.09million cubic meter. That amount in case of with this project is 927.42million,898.68million and 911.03million cubic meter, respectively.
The surplus water in 2005 and 2010 is 141.47million and 127.27million cubic meterin case of with project and water saving design. The balance situation of supply anddemand of water resources for provinces/municipalities are shown in followingtables(5-4-1-5-4-5).
60
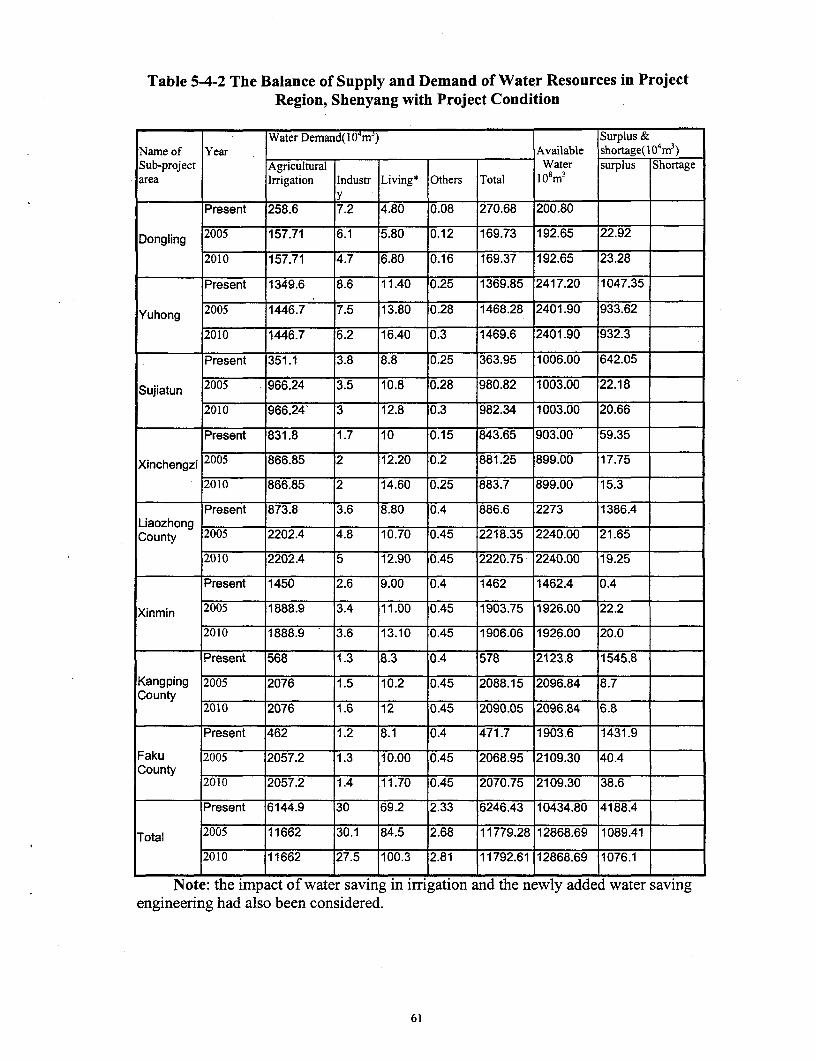
Table 54-2 The Balance of Supply and Demand of Water Resources in ProjectRegion, Shenyang with Project Condition
Water Demand(I O4m) Surplus &Name of Year Available shortage(l0 4m3)Sub-project Agricultural Water surplus Shortagearea Inrigation Industr Living* Others Total I 08m3
yPresent 258.6 7.2 4.80 0.08 270.68 200.80
Dongling 2005 157.71 6.1 5.80 0.12 169.73 192.65 22.92
2010 157.71 4.7 6.80 0.16 169.37 192.65 23.28
Present 1349.6 8.6 11.40 0.25 1369.85 2417.20 1047.35
Yuhong 2005 1446.7 7.5 13.80 0.28 1468.28 2401.90 933.62
2010 1446.7 6.2 16.40 0.3 1469.6 2401.90 932.3
Present 351.1 3.8 8.8 0.25 363.95 1006.00 642.05
Sujiatun 2005 966.24 3.5 10.8 0.28 980.82 1003.00 22.18
2010 966.24 3 12.8 0.3 982.34 1003.00 20.66
Present 831.8 1.7 10 0.15 843.65 903.00 59.35
Xinchengzi 2005 866.85 2 12.20 0.2 881.25 899.00 17.75
2010 866.85 2 14.60 0.25 883.7 899.00 15.3
Present 873.8 3.6 8.80 0.4 886.6 2273 1386.4LiaozhongCounty 2005 2202.4 4.8 10.70 0.45 2218.35 2240.00 21.65
2010 2202.4 5 12.90 0.45 2220.75 2240.00 19.25
Present 1450 2.6 9.00 0.4 1462 1462.4 0.4
Xinmin 2005 1888.9 3.4 11.00 0.45 1903.75 1926.00 22.2
2010 1888.9 3.6 13.10 0.45 1906.06 1926.00 20.0
Present 568 1.3 8.3 0.4 578 2123.8 1545.8
Kangping 2005 2076 1.5 10.2 0.45 2088.15 2096.84 8.7County _ _ _ _ _ _ _ _
2010 2076 1.6 12 0.45 2090.05 2096.84 6.8
Present 462 1.2 8.1 0.4 471.7 1903.6 1431.9
Faku 2005 2057.2 1.3 10.00 0.45 2068.95 2109.30 40.4County I_I__
2010 2057.2 1.4 11.70 0.45 2070.75 2109.30 38.6
Present 6144.9 30 69.2 2.33 6246.43 10434.80 4188.4
Total 2005 11662 30.1 84.5 2.68 11779.28 12868.69 1089.41
2010 11662 27.5 100.3 2.81 11792.61 12868.69 1076.1
Note: the impact of water saving in irrigation and the newly added water savingengineering had also been considered.
61
Table 5-4-3 The Balance of Supply and Demand of Water Resources in ProjectCounties of Qingdao City
Water Demand(l WM) ~~~~~~~~Surplus &Name of Water Demand(104m3) shortage( 104M)Sub- Agricultu Availableproject Year ral Indus Living* Total surplus ShortagecountyInuty Lvn*Ohr Toa 10M
Irrigation
Present 0.19636 0.002513 0.01458 0.213453 0.2289 0.015447
Jiaonan 2005 0.14633 0.003302 0.01594 0.165572 0.16814 0.002568
2010 0.14633 0.003841 0.01724 0.167411 0.16814 0.000729
Present 0.1272 0.00087 0.0048 0.00053 0.1334 0.13151 0.00189
Jiaozhou 2005 0.0631 0.00119 0.005 0.00053 0.06982 0.09864 0.02882
2010 0.0631 0.00191 0.0052 0.00053 0.07074 0.09864 0.0279
Present 0.33396 0.01588 0.34984 0.2188 0.13104
Pingdu 2005 0.17667 0.01975 0.19642 0.198 0.00158
2010 0.17667 0.02025 0.19692 0.198 0.00108
Present 0.175 0.022 0.01128 0.20828 0.1661 0.00552
Laixi 2005 0.10864 0.0334 0.01624 0.15828 0.17945 0.02117
2010 0.10864 0.0429 0.0213 0.17284 0.17945 0.00661
Present 0.15158 0.00531 0.156895 0.12121 0.09624
5
2005 0.06465 0.00622 0.070879 0.10121 0.030331Jimo
9
2010 0.06465 0.00709 0.071745 0.10121 0.029465
5
Present 0.04961 0.00789 0.0046 0.0621 0.03661 0.02549Chengya 2005 0.02255 0.013 0.00495 0.0405 0.04829 0.00779
ng__ _ _ _ _ _ _ _ _
2010 0,02255 0.016 0.0051 0.04365 0.04829 0.00464
Present 1.03371 0.033273 0.05645 0.00053 1.123968 0.90313 0.220838
5
2005 0.58194 0.050892 0.06810 0.00053 0.701471 0.79373 0.092259Total
9
2010 0.58194 0.064651 0.07618 0.00053 0.723306 0.79373 0.070424
5
Note: the impact of water saving in irrigation and the newly added water savingengineering had also been considered.
62

Table 5-4-4 The Balance of Supply and Demand of Water Resources in beijingProject Region with Project Conditions
Name of Sub- Surplus &project county Year Water Demand( 104m3) Available shortage( 104m3)
Agricultural I olmr surplus ShortageIrrigation Industry Living* Others Total I s
Present 974.6 5.2 25.9 28.8 1034.5 893.1 141.4
Fangshan 2005 600.3 7.7 27.9 28.8 664.7 677.9 13.2
2010 600.3 9.1 29.4 28.8 667.7 677.9 10.2
Present 180.4 36.0 6.4 26.1 248.9 241.1 7.8
Changping 2005 139.6 40.9 7.0 26.1 213.6 219.0 5.4
2010 139.6 44.3 7.7 26.1 217.7 219.0 1.3
Present 4542.7 64.3 289.5 290.6 5187.1 4985.8 201.4
Miyun 2005 2952.7 71.7 342.9 311.2 3678.5 4395.2 716.7
2010 2952.7 76.8 397.7 325.7 3752.9 4395.2 642.3
Present 565.2 6.3 35.6 7.6 614.6 499.1 115.5
Pinggu 2005 428.6 8.7 43.7 7.6 488.5 395.0 93.5
2010 428.6 10.1 51.8 7.6 498.0 395.0 103.0
Present 5561.0 38.2 156.4 233.6 5989.2 5339.0 650.1
Tongzhou 2005 3561.5 56.5 166.7 233.6 4018.3 4062.5 44.1
2010 3561.5 62.3 187.6 233.6 4045.0 4062.5 17.5
Present 4256.4 78.8 128.8 76.8 4540.7 3099.5 1441.2
Daxing 2005 1682.5 101.5 153.5 80.4 2017.9 2075.0 57.1
2010 1682.5 113.5 178.6 84.5 2058.9 2075.0 16.0
Present 635.4 44.5 11.6 10.1 701.6 659.6 42.0
Chaoyang 2005 407.7 48.9 13.9 5.7 476.2 545.6 69.4
2010 407.7 53.2 16.5 3.4 480.7 545.6 64.9
Present 16715.7 273.2 654.1 673.6 18316.6 15717.2 2599.4
Total 2005 9773.0 335.8 755.6 693.4 11557.7 12370.1 812.4
2010 9773.0 369.2 869.2 709.6 11721.0 112370.1 649.1
5.2.2 Impact of water saving irrigation on groundwater level
The continuous descent of groundwater level is one primary issue for groundwaterenvironment in some project areas, such as Beijing and Hebei. Although most projectareas are not located in the center of the regional drawdown funnel, the descent ofgroundwater level is very evident. The embedded depth of groundwater in thebeginning of 1980's was three to five meters, at present, it is about ten to thirtymeters. Table5-5-1 shows that the exploitation of groundwater will be reducedremarkably after implementation of the project, it won't only further aggravate the
63
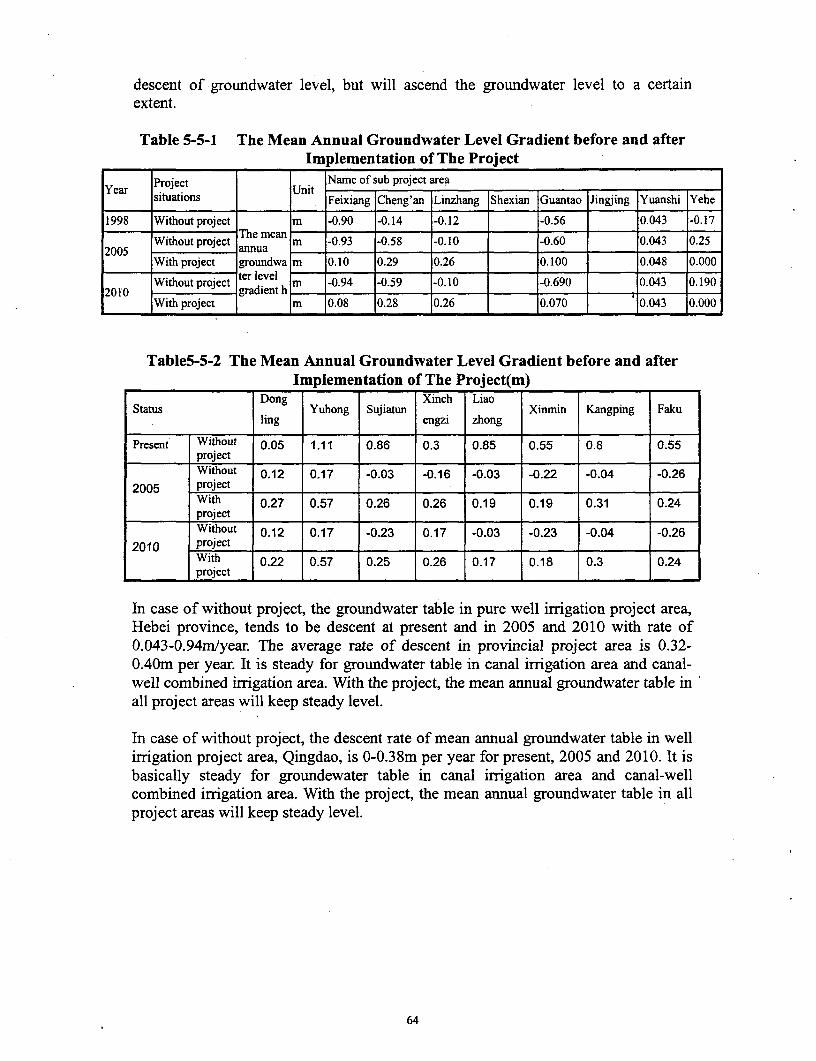
descent of groundwater level, but will ascend the groundwater level to a certainextent.
Table 5-5-1 The Mean Annual Groundwater Level Gradient before and afterImplementation of The Project
Year Project Unit Name of sub project areasituations Feixiang Cheng'an Linzhang Shexian Guantao Jingjing lYuanshi Yehe
1998 Without project m -0.90 -0.14 -0.12 -0.56 10.043 -0.17
2 Without project Theuman m -0.93 -0.58 -0.10 -0.60 0.043 0.252005 wihpoet annua n 09 05 01
_ With pToject groundwa m 0.10 0.29 0.26 0.100 0.048 0.000withot proect tr level -
.Without project te lm -0.94 -0.59 -0.10 -0.690 0.043 0.1902010 gradient h
With project m 0.08 0.28 0.26 0.070 0.043 0.000
Table5-5-2 The Mean Annual Groundwater Level Gradient before and afterImplementation of The Project(m)
Dong Xinch LiaoStatus Yuhong Sujiatun Xinmin Kangping Faku
ling engzi zhong
Present Without 0.05 1.11 0.86 0.3 0.85 0.55 0.8 0.55project __ _ _ __ _ _ _ __ _ _ ___ _ _ _ __ _ _ _
Without 0.12 0.17 -0.03 -0.16 -0.03 -0.22 -0.04 -0.26
2005 project
With 0.27 0.57 0.26 0.26 0.19 0.19 0.31 0.24project I__ _ _ __ _ _ _ I__ _ _ _ _ __ _ _ _ _ _ _
Without 0.12 0.17 -0.23 0.17 -0.03 -0.23 -0.04 -0.26
2010 project
with 0.22 0.57 0.25 0.26 0.17 0.18 0.3 0.24_____ ____ project I_ _ __ _ __I__ _ __ _ _I_ _
In case of without project, the groundwater table in pure well irrigation project area,Hebei province, tends to be descent at present and in 2005 and 2010 with rate of0.043-0.94m/year. The average rate of descent in provincial project area is 0.32-0.40m per year. It is steady for groundwater table in canal irrigation area and canal-well combined irrigation area. With the project, the mean annual groundwater table inall project areas will keep steady level.
In case of without project, the descent rate of mean annual groundwater table in wellirrigation project area, Qingdao, is 0-0.38m per year for present, 2005 and 2010. It isbasically steady for groundewater table in canal irrigation area and canal-wellcombined irrigation area. With the project, the mean annual groundwater table in allproject areas will keep steady level.
64
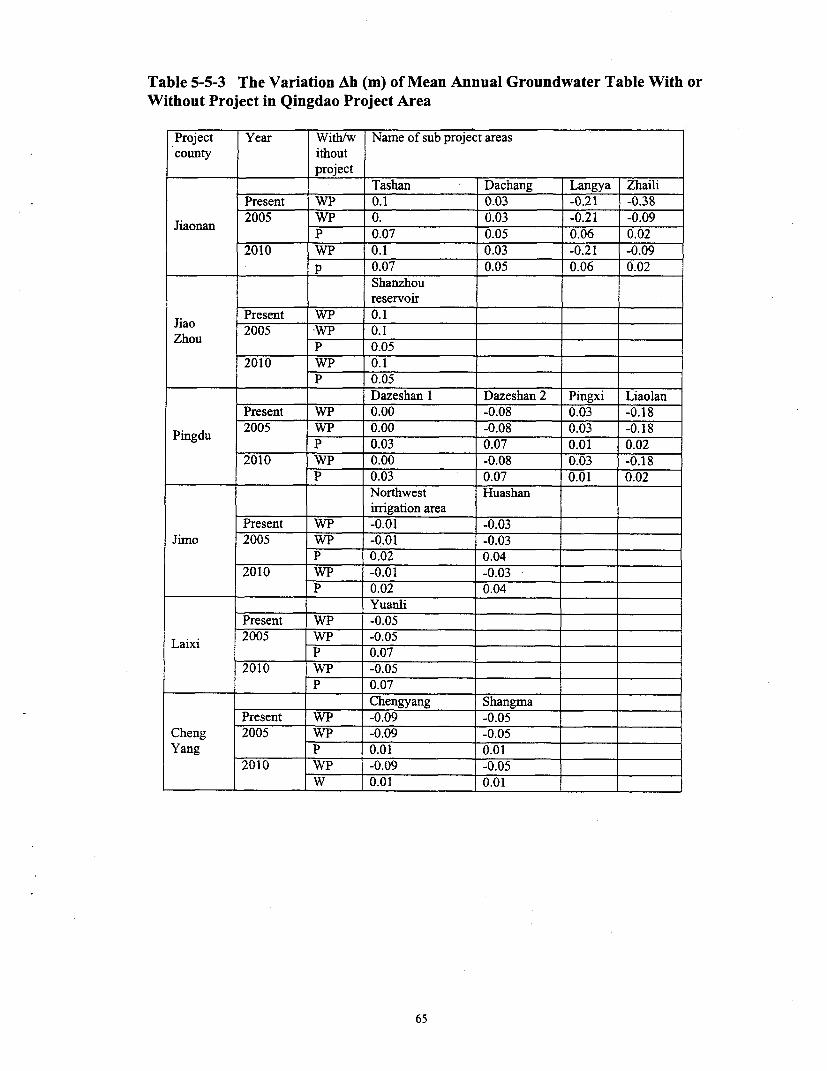
Table 5-5-3 The Variation Ah (m) of Mean Annual Groundwater Table With orWithout Project in Qingdao Project Area
Project Year With/w Name of sub project areascounty ithout
projectTashan Dachang Langya Zhaili
Present W'P 0.1 0.03 -0.21 -0.38Jiaonan 2005 WP 0. 0.03 -0.21 -0.09
Jiaonan P 0.07 0.05 0.06 0.022010 WP 0.1 0.03 -0.21 -0.09
_ _ _ _ _ p 0.07 0.05 0.06 0.02Shanzhoureservoir
Jiao Present WP 0.1Zhou 2005 WP 0.1
Zhou_____ P 0.052010 WP 0.1
P 0.05Dazeshan 1 Dazeshan 2 Pingxi Liaolan
Present WP 0.00 -0.08 0.03 -0.18Pingdu 2005 WVP 0.00 -0.08 0.03 -0.18
Pmngdu P 0.03 0.07 0.01 0.022010 WP 0.00 -0.08 0.03 -0.18
P 0.03 0.07 0.01 0.02Northwest Huashanirrigation area
Present WP -0.01 -0.03Jimo 2005 WIA -0.01 -0.03
p 0.02 0.042010 WP -0.01 -0.03
P 0.02 0.04Yuanli
Present WP -0.05Laixi 2005 WIP -0.05
I' 0.072010 WI' -0.05
P 0.07_ Chengyang Shangma
Present WP -0.09 -0.05Cheng 2005 WP -0.09 -0.05Yang P _ 0.01 0.01
2010 W _P -0.09 _-0.05W 0.01 0.01 6
65

Table5-54 The Variation(m) of Mean Annual Groundwater Table With orWithout the Project in Beijing Project AreaName of Project County
Unit Fang Changping Miyun Pinggu Tongzhou Daxing Chaoyang Totalshan I _ _ _ _ _ _ _ _ _ _ _ _ _ _ _
1998 WP m -0.24 -0.10 -0.09 -0.37 -0.23 -0.56 -0.20 -0.32
2005 WP m -0.243 -0.179 -0.119 -0.404 -0.239 -0.577 -0.210 -0.339
P im 0.02 0.07 0.30 -0.30 0.02 0.02 0.33 0.14
2010 WP m -0.248 -0.234 -0.151 -0.434 -0.248 -0.593 -0.232 -0.350
P im 0.017 0.017 0.271 -0.331 0.006 0.006 0.308 0.037
P: with project WP: without project
In case of without project, the variation of mean annual groundwater table in allproject areas, Shenyang, is above zero except for obvious descent of mean annualgroundwater table in six project counties at rate of 0.03-0.26m per year. With theproject, the mean annual groundwater table in all project areas will keep steady level.According to local hydrogeological condition, the amount of irrigation water willdirectly influence dynamic process of groundwater. Unreasonable irrigation anddrainage way resulted in descent of groundwater table in water source area, whilegroundwater table rose sharply because of flush irrigation in irrigation area, whichhad exceeded critical depth of groundwater and caused secondary salinization of soil.At present, the utilization coefficient of irrigation water in Shenyang irrigation area isonly 0.45-0.5, the waste of water resources is serious. The buried depth ofgroundwater in Shenyang and nearing area is lOm that caused regional descentfunnel. The buried depth of groundwater in few areas is only 1-2m, less than criticaldepth of 1.8m, which resulted in partial returning saline. After adoption of watersaving irrigation measures, the water use will be saved by 30%, and overdraft ofwater resources will be controlled. Meantime, a series of water saving measures, suchas sprinkler, drip irrigation, low-pressure pipeline irrigation and groove irrigation,reduced water loss, made irrigation even in time-space and easily absorbed by crops,decreased water seepage and promoted dynamic variation of groundwater.
5.3 Impact of fertilizer application on the soil and water environment
There is little irrigation backwater after adopting water saving measures, the projectimpact on surface water environment is relatively little, and the main impact isfertilizer on soil and groundwater.
5.3.1 Fertilizer application situations
In provincial project areas, the per unit area applied quantity of fertilizer of differentcrops is shown in table 5-6. It can be shown that the applied quantity of fertilizer willincrease to a certain extent after the implementation of the project, and there is anotable difference of applied quantity among crops, for example, in Qingdao, theapplied quantity of nitrogenous fertilizer is greatest when greenstuff planted thanothers.
66

Generally speaking, phosphorous is easy sedimenting in soil and not easy moving,and the groundwater pollution of phosphorous is very little. The main pollution offertilizer to groundwater is nitrate; therefore, the assessment will focus on the impactof nitrogenous fertilizer on groundwater.
67
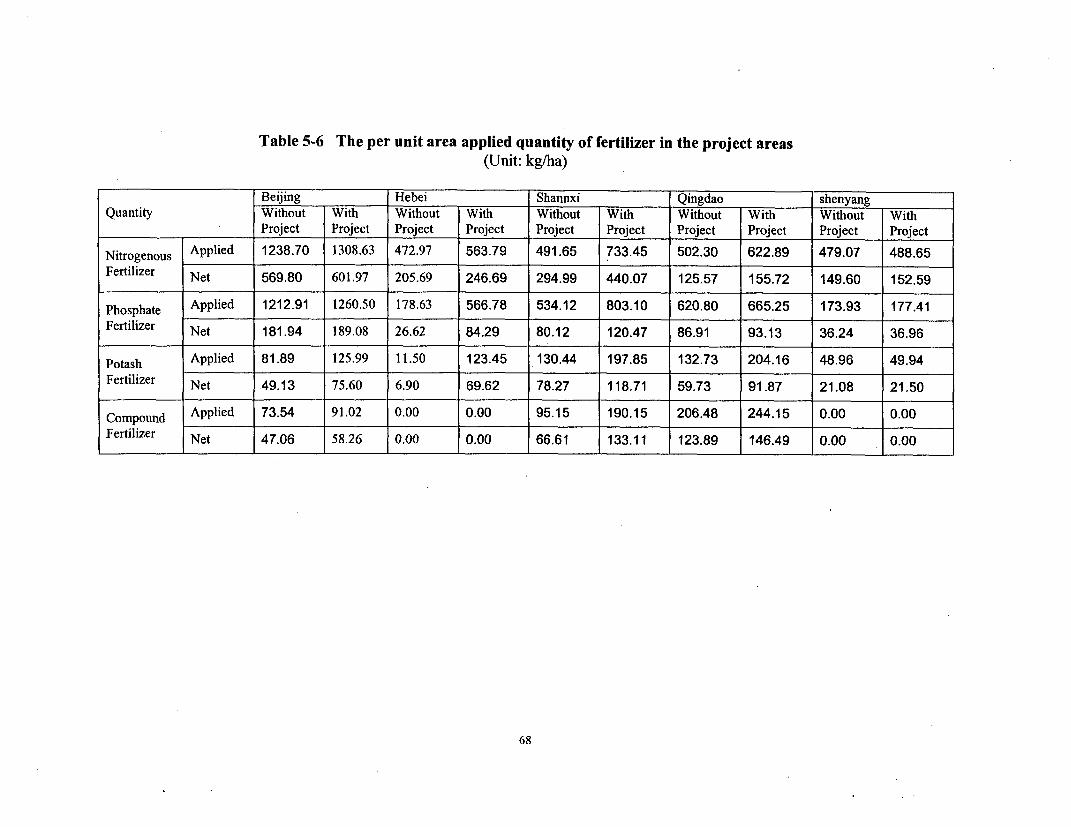
Table 5-6 The per unit area applied quantity of fertilizer in the project areas(Unit: kg/ha)
Beijing Hebei Shannxi Qingdao shenyangQuantity Without With Without With Without With Without With Without With
Project Project Project Project Project Project Project Project Project Project
Nitrogenous Applied 1238.70 1308.63 472.97 563.79 491.65 733.45 502.30 622.89 479.07 488.65
Fertilizer Net 569.80 601.97 205.69 246.69 294.99 440.07 125.57 155.72 149.60 152.59
Phosphate Applied 1212.91 1260.50 178.63 566.78 534.12 803.10 620.80 665.25 173.93 177.41Fertilizer Net 181.94 189.08 26.62 84.29 80.12 120.47 86.91 93.13 36.24 36.96
Potash Applied 81.89 125.99 11.50 123.45 130.44 197.85 132.73 204.16 48.96 49.94
Fertilizer Net 49.13 75.60 6.90 69.62 78.27 118.71 59.73 91.87 21.08 21.50
Compound Applied 73.54 91.02 0.00 0.00 95.15 190.15 206.48 244.15 0.00 0.00Fertilizer Net 47.06 58.26 0.00 0.00 66.61 133.11 123.89 146.49 0.00 0.00
68
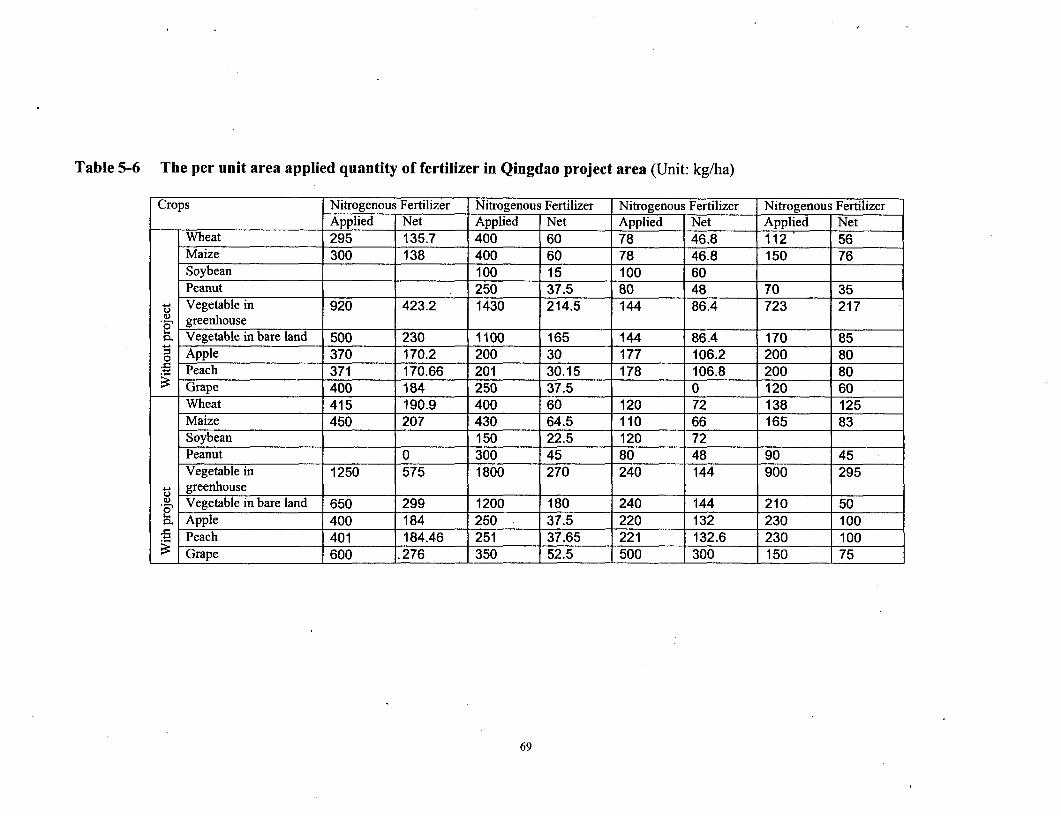
Table 5-6 The per unit area applied quantity of fertilizer in Qingdao project area (Unit: kg/ha)
Crops Nitrogenous Fertilizer Nitrogenous Fertilizer Nitrogenous Fertilizer Nitrogenous FertilizerApplied Net Applied Net Applied Net Applied Net
Wheat 295 135.7 400 60 78 46.8 112 56Maize 300 138 400 60 78 46.8 150 76Soybean 100 15 100 60Peanut . 250 37.5 80 48 70 35
c Vegetable in 920 423.2 1430 214.5 144 86.4 723 217. greenhouseoo Vegetable in bare land 500 230 1100 165 144 86.4 170 855 Apple 370 170.2 200 30 177 106.2 200 80A Peach 371 170.66 201 30.15 178 106.8 200 80_ Grape 400 184 250 37.5 0 120 60
Wheat 415 190.9 400 60 120 72 138 125Maize 450 207 430 64.5 110 66 165 83Soybean 150 22.5 120 72Peanut 0 300 45 80 48 90 45Vegetable in 1250 575 1800 270 240 144 900 295
Q greenhouse. Vegetable in bare land 650 299 1200 180 240 144 210 50v Apple 400 184 250 37.5 220 132 230 100
. Peach 401 184.46 251 37.65 221 132.6 230 100.-Grape 600 .276 350 52.5 500 300 150 75
69
5.3.2 Main influencing factors to the formation of N0 3 -N in field groundwater
The moving and transforming process of nitrogen is very complicated in crop-soil-groundwater system, involving a series of physical and chemical process, such ascrop absorption, soil adsorption, nitration, anti-nitration, troposphere and spreadaction etc. These also act on the pollution of the applied nitrogenous fertilizer to thegroundwater. The crop's nitrogen absorbing and utilizing degree changes much and itcan absorbs more than 80% nitrogen under appropriate conditions, but the utilizingrate of nitrogen is usually less than 50%, therefore, the application of nitrogenousfertilizer is the potential pollutant of groundwater. Of which, Nitrate is the mostpopular pollutant in groundwater.
There are many factors that influence the moving and transforming of nitrogen in soiland groundwater, of which, the main influencing factors are:
Climate precipitation and its distributionEvaportransporationIrrigation (time and times)
Soil topography (flat land, sloping land)Soil quality and layer of soil qualityMineralization of organic nitrogen in soil
Land use cropCrop's absorption to moisture and nitrogenCrop's covering time and season on landSoil cultivating intensity
Nitrogen type of fertilizerApplying timeApplied quantity and times
The formation of groundwater pollution in field environment is comprehensivelyacted by these factors.
5.3.3 Impact of nitrogenous fertilizer on groundwater pollution under watersaving irrigation
Assessing theory and method Stream is the carrier for the nitrate in crop root zonemoving to groundwater. It has been demonstrated from some researches that theleached loss of N0 3-N has evident positive correlation with the quantity of seepageunder certain soil quality. Water saving irrigation will increase the utilization factor ofwater resources and reduce the quantity of seepage. It's predicted that the impact ofthe applied nitrogenous fertilizer on groundwater N0 3-N pollution will be reducedduring water saving irrigation. However, the natural condition and nitrogen appliedcondition differ much in different project area, the impact of these factors ongroundwater N0 3-N pollution must be taken into account during assessment.
70
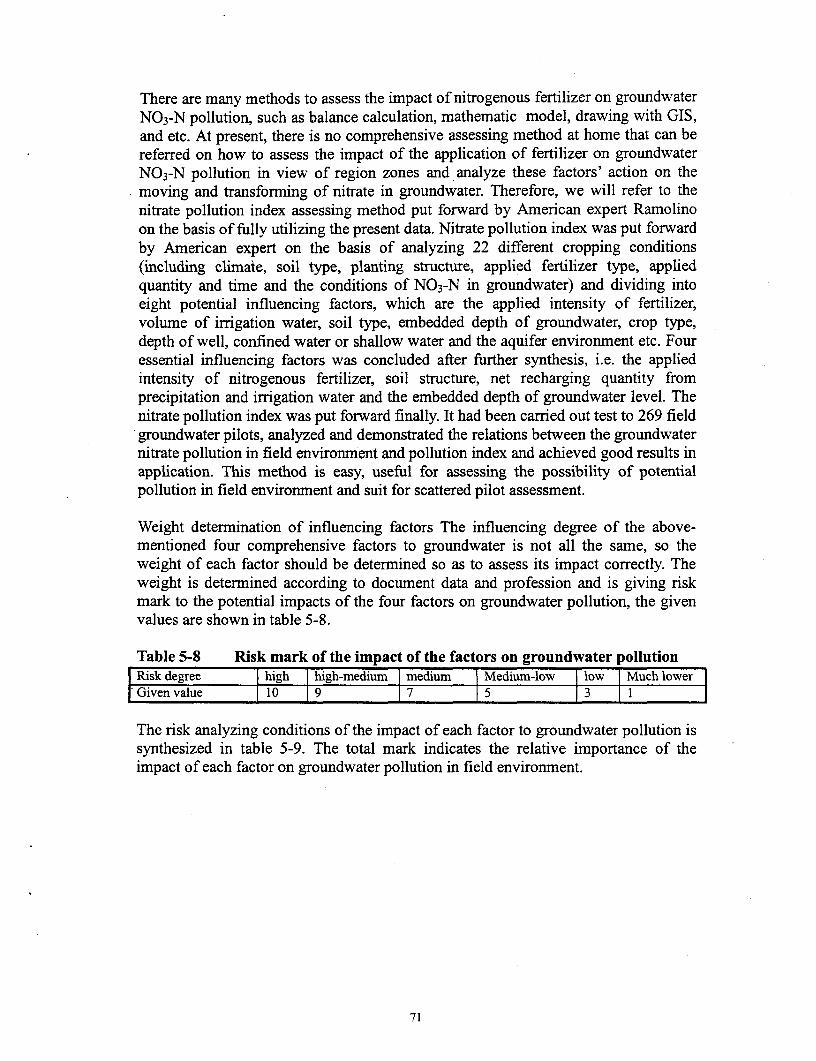
There are many methods to assess the impact of nitrogenous fertilizer on groundwaterN0 3 -N pollution, such as balance calculation, mathematic model, drawing with GIS,and etc. At present, there is no comprehensive assessing method at home that can bereferred on how to assess the impact of the application of fertilizer on groundwaterN0 3 -N pollution in view of region zones and analyze these factors' action on themoving and transforming of nitrate in groundwater. Therefore, we will refer to thenitrate pollution index assessing method put forward by American expert Ramolinoon the basis of fully utilizing the present data. Nitrate pollution index was put forwardby American expert on the basis of analyzing 22 different cropping conditions(including climate, soil type, planting structure, applied fertilizer type, appliedquantity and time and the conditions of N0 3-N in groundwater) and dividing intoeight potential influencing factors, which are the applied intensity of fertilizer,volume of irrigation water, soil type, embedded depth of groundwater, crop type,depth of well, confined water or shallow water and the aquifer environment etc. Fouressential influencing factors was concluded after further synthesis, i.e. the appliedintensity of nitrogenous fertilizer, soil structure, net recharging quantity fromprecipitation and irrigation water and the embedded depth of groundwater level. Thenitrate pollution index was put forward finally. It had been carried out test to 269 fieldgroundwater pilots, analyzed and demonstrated the relations between the groundwaternitrate pollution in field environment and pollution index and achieved good results inapplication. This method is easy, useful for assessing the possibility of potentialpollution in field environment and suit for scattered pilot assessment.
Weight determination of influencing factors The influencing degree of the above-mentioned four comprehensive factors to groundwater is not all the same, so theweight of each factor should be determined so as to assess its impact correctly. Theweight is determined according to document data and profession and is giving riskmark to the potential impacts of the four factors on groundwater pollution, the givenvalues are shown in table 5-8.
Table 5-8 Risk mark of the impact of the factors on groundwater pollutionRisk degree high high-medium medium Medium-low low Much lowerGivenvalue 10 9 7 5 3 1
The risk analyzing conditions of the impact of each factor to groundwater pollution issynthesized in table 5-9. The total mark indicates the relative importance of theimpact of each factor on groundwater pollution in field environment.
71
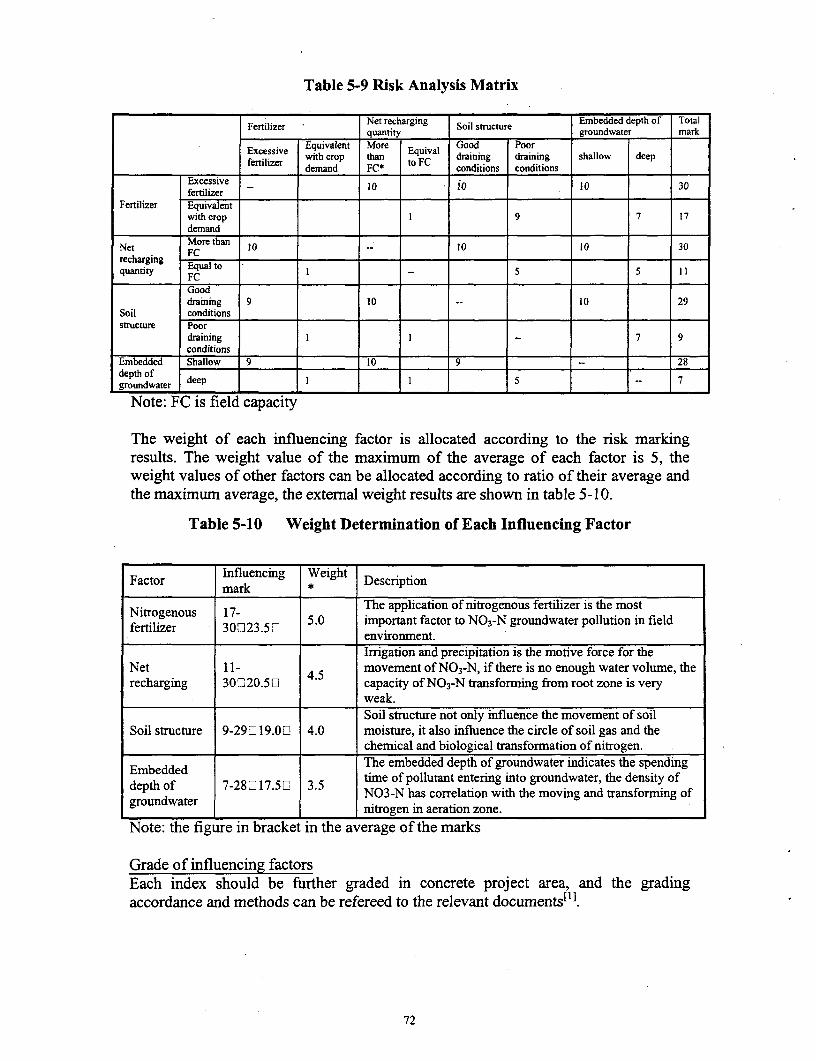
Table 5-9 Risk Analysis Matrix
Net recharging Embedded depth of TotalFertilizer quantity Soil structure groundwater mark
Equivalent More Equival Good PoorExertiizer with crop than t C draining draining shallow deepfertilizer demand FC* to FC conditions conditions
Excessive o0 I 10 30fertilizer _ _ _ _ _ _ ______
Fertilizer Equivalentwith crop I 9 7 17demand
Net More than 10 10 10 30FC _ _ _ _ _ _ _ _ _ _ _ _
recharging Equal toquantity FC IS 5 1 1
Gooddraining 9 10 10 29
Soil conditionsstructure Poor
draining l I _ 7 9conditions
Embedded Shallow 9 10 _ 9 - 28depth ofgroundwater deep 5 7
Note: FC is field capacity
The weight of each influencing factor is allocated according to the risk markingresults. The weight value of the maximum of the average of each factor is 5, theweight values of other factors can be allocated according to ratio of their average andthe maximum average, the external weight results are shown in table 5-10.
Table 5-10 Weight Determination of Each Influencing Factor
Factor Influencing Weight Descriptionmark
Nitrogenous 17- The application of nitrogenous fertilizer is the mostfertilizer 30523.5] O 5.0 important factor to N0 3-N groundwater pollution in field
environment.Irrigation and precipitation is the motive force for the
Net 11- 4 5 movement of N03 -N, if there is no enough water volume, therecharging 30C20.50 . capacity of N0 3-N transforming from root zone is very
weak.Soil structure not only influence the movement of soil
Soil structure 9-290 19.00 4.0 moisture, it also influence the circle of soil gas and thechemical and biological transformation of nitrogen.
Embedded The embedded depth of groundwater indicates the spendingdepth of 7-28 17.55 3.5 time of pollutant entering into groundwater, the density of
dpo7] .5 N03-N has correlation with the moving and transforming ofgroundwater nitrogen in aeration zone.
Note: the figure in bracket in the average of the marks
Grade of influencing factorsEach index should be further graded in concrete project area, and the gradingaccordance and methods can be refereed to the relevant documents[li.
72
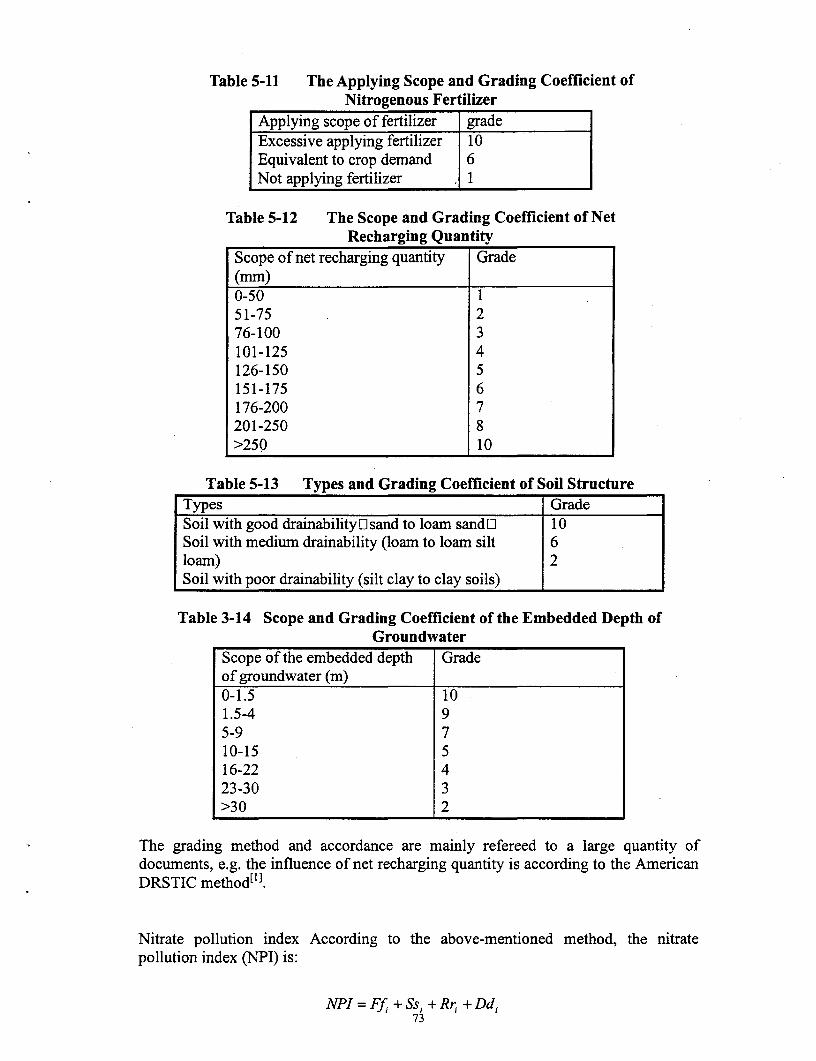
Table 5-11 The Applying Scope and Grading Coefficient ofNitrogenous Fertilizer
Applying scope of fertilizer gradeExcessive applying fertilizer 110Equivalent to crop demand 6Not applying fertilizer 1
Table 5-12 The Scope and Grading Coefficient of NetRecharging Quantity
Scope of net recharging quantity Grade(mm)0-50 151-75 276-100 3101-125 4126-150 5151-175 6176-200 7201-250 8>250 10
Table 5-13 Types and Grading Coefficient of Soil StructureTypes GradeSoil with good drainability[ sand to loam sandE] 10Soil with medium drainability (loam to loam silt 6loam) 2Soil with poor drainability (silt clay to clay soils) I
Table 3-14 Scope and Grading Coefficient of the Embedded Depth ofGroundwater
Scope of the embedded depth Gradeof groundwater (m)0-1.5 101.5-4 95-9 710-15 516-22 423-30 3>30 2
The grading method and accordance are mainly refereed to a large quantity ofdocuments, e.g. the influence of net recharging quantity is according to the AmericanDRSTIC method['].
Nitrate pollution index According to the above-mentioned method, the nitratepollution index (NPI) is:
NPI = Ffi + Ss, + Rr, + Ddi73
Where F, R, S, D is the weight of applied nitrogenous fertilizer, net rechargingquantity, soil structure and embedded depth of groundwater respectively, and f,, ri, si,di is the grading index of the above-mentioned four influencing factors respectively.
The above-mentioned model can be used to determine the potential possibilities ofgroundwater N0 3-N pollution under different geographical conditions, the more ofthe indexes, the more of the N0 3 -N polluting possibilities.
Even though we can't get the one-by-one corresponding value between pollutionindex and N0 3 -N density through the above-mentioned relations, we can get theinfluencing scope of the applied fertilizer to groundwater pollution.
Analysis on the impact of the implementation of the water saving irrigation project ongroundwater N0 3-N pollution The applied quantity of nitrogenous fertilizer will beincreased after the implementation of the project, however, the moving andtransforming of nitrogenous fertilizer in soil-water-crop system depends on manyfactors. The change of soil moisture condition and crop planting structure and theappropriate fertilizer have great relations with the utilization factor of nitrogenousfertilizer, the above-mentioned measures can all increase crop absorption to nitrogen.It's difficult to determine the utilized quantity of nitrogenous fertilizer, thepossibilities of the application of nitrogenous fertilizer to groundwater potentialpollution are also considered in assessment under the disadvantageous conditions (i.e.excessive fertilizer) and adopting appropriate fertilizer applying measures andapplying fertilizer according to the measurement of soil fertility.As an example, in Shenyang project area, the influencing characteristic factors andthe seeping and recharging groundwater conditions of precipitation and irrigationbackwater are shown in table 5-15, and the influencing factors in Hebei,Qingdao andBeijing project area are shown from table 5-16-1 to table 5-16-3.
74
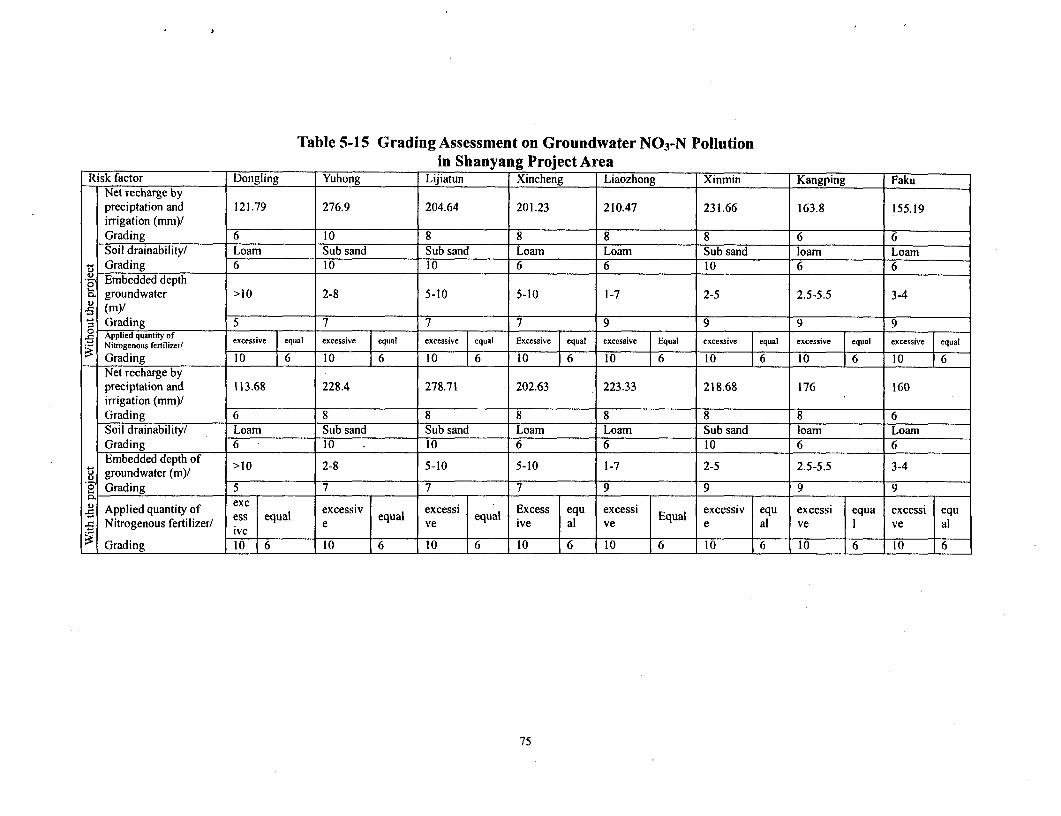
Table 5-15 Grading Assessment on Groundwater N0 3 -N Pollutionin Shanyang Project Area
Risk factor Dongling Yuhong Lijiatun Xincheng Liaozhong Xinmin Kangping FakuNet recharge bypreciptation and 121.79 276.9 204.64 201.23 210.47 231.66 163.8 155.19irrigation (mm)/
Grading 6 10 8 8 8 8 6 6Soil drainability/ Loam Sub sand Sub sand Loam Loam Sub sand loam Loam
u Grading 6 10 10 6 6 10 6 6. Embedded depthc. groundwater >10 2-8 5-10 5-10 1-7 2-5 2.5-5.5 3-4Q (mi)z Grading 5 7 7 7 9 9 9 9C Applied quantity of_. Aitpliedouquanrtityzeof excessive equal excessive equal excessive equal Excessive equal excessive Equal excessive equal excessive equal excessive equal
:Grading 10 6 10 6 1 0 6 10 6 10 10 6 10 6 10 6Net recharge bypreciptation and 113.68 228.4 278.71 202.63 223.33 218.68 176 160irrigation (mm)/Grading 6 8 8 8 8 8 8 6Soil drainability/ Loam Sub sand Sub sand Loam Loam Sub sand loam LoamGrading 6 10 10 6 6 10 6 6
i Embedded depth of >10 2-8 5-10 5-10 1-7 2-5 2.5-5.5 3-4groundwater (mn)! ______ _ _ _ _ _ _ _
. Grading 5 7 7 7 9 9 9 9
Applied quantity of equal Excess equ excessi excessiv equ excessi equa excessi equess equal equal equal Equal e al yeea7.~Nitrogenous fertilizer!/ v e ye ive al yeeal vI vel
~Grading 10 6 10 6 10 6 10 6 10 6 10F 6 10 6 10 6
75
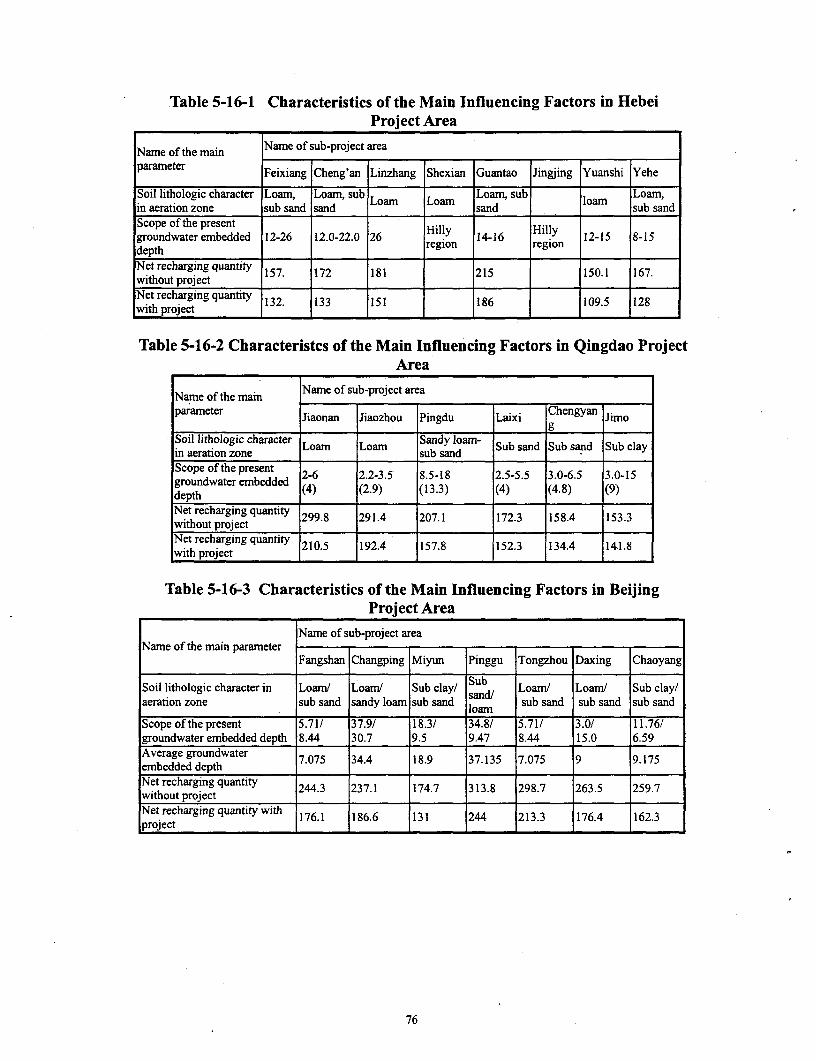
Table 5-16-1 Characteristics of the Main Influencing Factors in HebeiProject Area
Name of the main Name of sub-project areaparameter Feixiang Cheng'an Linzhang Shexian Guantao Jingjing Yuanshi Yehe
Soil lithologic character Loam, Loam sub Loam, sub Loam,in aeration zone sub sand sand Loam Loam sand loam sub sandScope of the present Hillygroundwater embedded 12-26 12.0-22.0 26 .Y 14-16 Hiy 12-15 8-15depth region regionNet recharging quantity 157. 172 181 215 150.1 167.without project INet recharging quantity 132. 133 151 186 109.5 128with project
Table 5-16-2 Characteristcs of the Main Influencing Factors in Qingdao ProjectArea
Name ofheName of sub-project areaNamne of the main
parameter Jiaonan Jiaozhou Pingdu Laixi Chengyan Jimo
Soil lithologic character Loam Loam Sandy loam- Sub sand Sub sand Sub clayin aeration zone Loam sub sandScope of the present 2-6 2.2-3.5 8.5-18 2.5-5.5 3.0-6.5 3.0-15groundwater embedded (4) (2-9) (13.3) (4) (4.8) (9)depth _ _ _ _ _ _ _ _ _ _ _ _
Net recharging quantity 299.8 291.4 207.1 172.3 158.4 153.3without project I I INet recharging quantity 210.5 192.4 157.8 152.3 134.4 141.8with project I
Table 5-16-3 Characteristics of the Main Influencing Factors in Beijing_Project Area
Name of sub-project areaName of the main parameter
Fangshan Changping Miyun Pinggu Tongzhou Daxing Chaoyang
Soil lithologic character in Loam/ Loam/ Sub clay/ Sub Loam/ Loam/ Sub clay/aeration zone sub sand sandy loam sub sand sand/ sub sand sub sand sub sand
___ ___ _ _ ___ __ loam _ _ _ _
Scope ofthe present 5.71/ 37.9/ 18.3/ 34.8/ 5.71/ 3.0/ 11.76/groundwater embedded depth 8.44 30.7 9.5 19.47 8.44 15.0 6.59Average groundwater 7.075 34.4 18.9 37.135 7.075 9 9.175embedded depth l l I
Net recharging quantity 244.3 237.1 174.7 313.8 298.7 263.5 259.7without project I _ I I IINet recharging quantity with 176.1 186.6 131 244 213.3 176.4 162.3project I_I_I_I
76
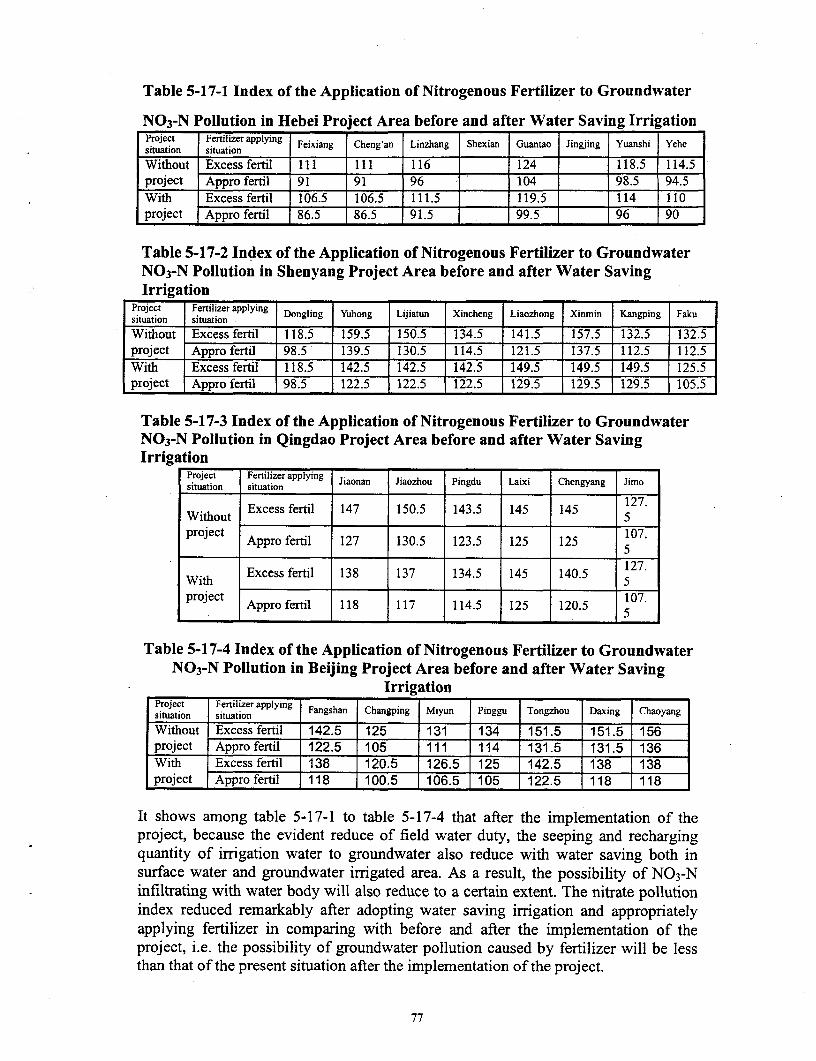
Table 5-17-1 Index of the Application of Nitrogenous Fertilizer to Groundwater
N0 3 -N Pollution in Hebei Project Area before and after Water Saving IrrigationProject Fertilizer applying Feixiang Cheng'an Linzhang Shexian Guantao Jingjing Yuanshi Yehesituation situation I____
Without Excess fertil 111 111 116 124 118.5 114.5project Appro fertil 91 91 96 104 98.5 94.5With Excess fertil 106.5 106.5 111.5 119.5 114 110project Appro fertil 86.5 86.5 91.5 99.5 96 90
Table 5-17-2 Index of the Application of Nitrogenous Fertilizer to GroundwaterN0 3 -N Pollution in Shenyang Project Area before and after Water SavingIrrigation
situaton Fertlize applying Dongling Yuihong Lijiatun Xincheng Liaozhong Xinmin Kangping FakuWithout Excess fertil 118.5 159.5 150.5 134.5 141.5 157.5 132.5 132.5project Appro fertil 98.5 139.5 130.5 114.5 121.5 137.5 112.5 112.5With Excess fertil 118.5 142.5 142.5 142.5 149.5 149.5 149.5 125.5project Appro fertil 98.5 122.5 122.5 122.5 129.5 129.5 129.5 105.5
Table 5-17-3 Index of the Application of Nitrogenous Fertilizer to GroundwaterN0 3-N Pollution in Qingdao Project Area before and after Water SavingIrrigation
Project Fertilizer applying iaonan J.iaozhou Pingdu Laixi Chengyang Jimosituation situation
127.Without Excess fertil 147 150.5 143.5 145 145prtojet 107project Appro fertil 127 130.5 123.5 125 125 107.
With Excess fertil 138 137 134.5 145 140.5 127.
project Appro fertil 118 117 114.5 125 120.5 107.
Table 5-17-4 Index of the Application of Nitrogenous Fertilizer to GroundwaterN0 3 -N Pollution in Beijing Project Area before and after Water Saving
* _______ _____________ _______ IrrigationProject Fertilizer applying Fangshan Changping Miyun Pinggu Tongzhou Daxing Chaoyangsituation situation
Without Excessfertil 142.5 125 131 134 151.5 151.5 156project Appro fertil 122.5 105 il1 114 131.5 131.5 136With Excess fertil 138 120.5 126.5 125 142.5 138 138project |Approfertil 118 100.5 106.5 | 105 122.5 118 118
It shows among table 5-17-1 to table 5-17-4 that after the implementation of theproject, because the evident reduce of field water duty, the seeping and rechargingquantity of irrigation water to groundwater also reduce with water saving both insurface water and groundwater irrigated area. As a result, the possibility of N0 3-Ninfiltrating with water body will also reduce to a certain extent. The nitrate pollutionindex reduced remarkably after adopting water saving irrigation and appropriatelyapplying fertilizer in comparing with before and after the implementation of theproject, i.e. the possibility of groundwater pollution caused by fertilizer will be lessthan that of the present situation after the implementation of the project.
77

Even though we can't get the one-by-one corresponding value between theapplication of fertilizer and the groundwater N0 3-N pollution, it's clear that theimplementation of the project will reduce the impact the application of fertilizer togroundwater potential pollution. Appropriately applying fertilizer, applying fertilizeraccording to the measurement of soil fertility and the increase of the rationalcoordinating technology of water and fertilizer will all be beneficial to reduce theleached quantity of N0 3-N.
5.4 Impacts of Pesticide on Soil and Groundwater
The project does not finance any pesticides. However, farmers have been increasingthe applied amounts of pesticides, for various types of pesticide, to alleviate impactsand hazards of plant diseases and insect pests on crops and increase grain yields, andthis trend is likely to continue regardless of the project. Detailed studies on pesticideuse in China are not adequate for projection of environmental impacts, and there areno detailed statistics available in China.
Study on pesticide behavior in the environment is still in the theoretical stage atpresent due to the various types of pesticides and their complicated chemicalcompositions. Many aspects are still unknown. It is very difficult to accuratelydetermine the impact of pesticide on environment when the results of theoreticalstudy and survey are not perfect, and emphasis is on the prevention in the actualapplication. Therefore, macro-assessment of impacts of pesticides on environment isdone with reference to theoretical study results of United States and European Union,and measures of current pesticide control have been proposed in view of control ofgroundwater pollution.
5.4.1 Current application of pesticides in project areas
Table 5-18 shows the current application of pesticides in project areas. There are
quite differences of pesticide application for different crops. As regard to application
of pesticide, China has issued "Standard for Safety Application of
Pesticide"(GB4245-89).
Table 5-18 Pesticides Currently Used for different crops in project areasCrop name Hebei Shenyang Qingdao Beijing
Paddy Dingcao AnRogor oxide, Seed dressing Rogor
Wheat triketone Dibaichong preparation, oxide,Wheat methamidophos, Fenxiuning,Bichon DDV
rogor, pyrethrin glin,dicofolMethyl- 1605, No.1 of Seed dressing
Maize methamidophos, Shaming preparationpyrethrin Ling, Bichonglin
BE emulsion
78
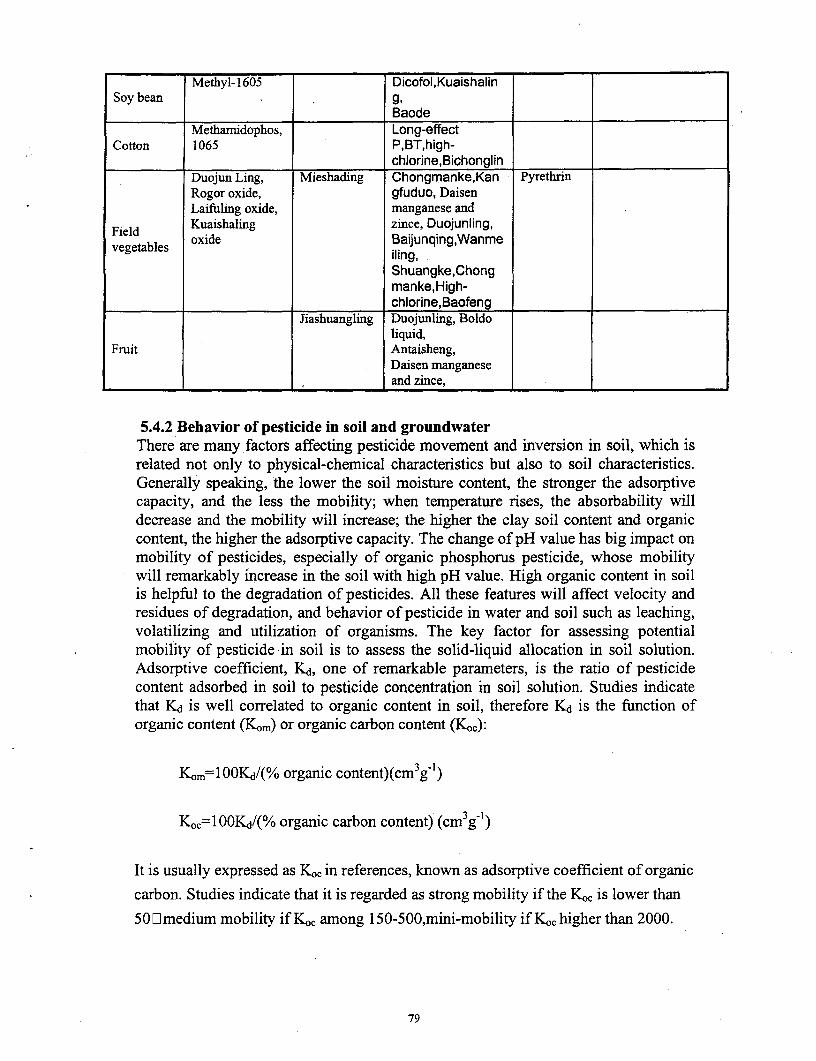
Methyl- 1605 Dicofol,KuaishalinSoy bean 9,
BaodeMethaiiidophos, Long-effect
Cotton 1065 P,BT,high-chlorine,Bichonglin
Duojun Ling, Mieshading Chongmanke,Kan PyrethrinRogor oxide, gfuduo, DaisenLaifuling oxide, manganese and
Field Kuaishaling zince, Duojunling,vegetables oxide Baijunqing,Wanme
iling,Shuangke,Chongmanke,High-chlorine,Baofeng
Jiashuangling Duojunling, Boldoliquid,
Fruit Antaisheng,Daisen manganeseand zince,
5.4.2 Behavior of pesticide in soil and groundwaterThere are many factors affecting pesticide movement and inversion in soil, which isrelated not only to physical-chemical characteristics but also to soil characteristics.Generally speaking, the lower the soil moisture content, the stronger the adsorptivecapacity, and the less the mobility; when temperature rises, the absorbability willdecrease and the mobility will increase; the higher the clay soil content and organiccontent, the higher the adsorptive capacity. The change of pH value has big impact onmobility of pesticides, especially of organic phosphorus pesticide, whose mobilitywill remarkably increase in the soil with high pH value. High organic content in soilis helpful to the degradation of pesticides. All these features will affect velocity andresidues of degradation, and behavior of pesticide in water and soil such as leaching,volatilizing and utilization of organisms. The key factor for assessing potentialmobility of pesticide in soil is to assess the solid-liquid allocation in soil solution.Adsorptive coefficient, Kd, one of remarkable parameters, is the ratio of pesticidecontent adsorbed in soil to pesticide concentration in soil solution. Studies indicatethat Kd is well correlated to organic content in soil, therefore Kd is the fanction oforganic content (Kom) or organic carbon content (Koc):
Koml°=OOKd/(% organic content)(cm3g-1)
K.C=lOOKd/(% organic carbon content) (cm3g 1)
It is usually expressed as KOc in references, known as adsorptive coefficient of organic
carbon. Studies indicate that it is regarded as strong mobility if the Ko, is lower than
50Lilmedium mobility if K0 , among 150-500,mini-mobility if K,c higher than 2000.
79

Another parameter for pesticide degradation in soil is on-farm half-lift period (To.5),which is a comprehensive, index and includes all processes of degradation such asdegradation of organisms and non-organisms, volatizing, leaching and plantadsorption. It is also related to soil, climate, activities of 'microbes in soil.
Gustafson studied 22 pesticides and proposed mobility index GUS (Ground
Ubiquity Score) based on T0.5 and Ko,
GUS = lg(To.5)(4-lgK0c)
GUS can be used for classification of leaching probability. When GUS is higher than2.8, this pesticide is leaching-prone; when 1.8<GUS<2.8, medium leaching pesticide;when GUS<1.8, low leaching pesticide. No adequate study on pesticide behavior insoil has been done in China and no conclusions have been drawn theoretically. Theassessment will focus on prevention measures for controlling pesticide pollution tosoil and groundwater after project, with reference to available studies abroad.
5.4.3 Impact of the current use of pesticide on groundwater and its controlIt can be known from above theoretical analysis that mobility of pesticide togroundwater relies on its physicochemical characteristics, soil and water flow.Pesticides used in China include weedicide and insecticide. Insecticide can beclassified as four types of organic chlorine, organic phosphorus, carbamic acid esterand pyrethrin. Most of organic chlorine has been forbidden due to its very slowdegradation in soil, for example DDT. Organic phosphorus is the most popularpesticide in Hebei project areas, such as methamidophos, rogor, methyl-1056, 1065etc. T0.5 of this kind of pesticides is short, and it is degradation-prone. So it isgenerally regarded as short detention period in soil and less probability of pollution togroundwater. Table 5-19 shows the chemical characteristics and mobility of somepesticides.
Table 5-19 Chemical Characteristics and Mobility of Pesticides in Soil
Pesticide solubility Vapor pressure Henry KOC GUS(gil) (Pa) constant (cm3/g)
Methaniid-790 2.3e-4 5.2e-8 3 2 1.80
ophos
Rogor 0.023 1.le-3 1.le-4 7 20 0.83
Dibaichong 120 2.1e4 1.7e-6 29 29 3.71
Duojunlin 0.008 9e-5 - 5.2 129 3.24
Long-effectPhosphorous Liquefiable 2.9e-4 30 1 5.9
80
It can be seen that GUS of methamidophos and rogor are lower than 1.8, so they aredifficult leaching pesticides. GUS of trichlorfon is 3.71 and that of Long-effectphosphorus is 5.9>2.8, which belongs to easy leaching pesticide. Trichlorfon hasstrong leaching feature and easy immigrating feature in soil, and its higher solubilitywhich increased risk for groundwater polluted. However, the semi-decay time oftrichlorfon and Long-effect phosphorous is short, on the basis of strictly obey ofSafety Standard of State Pesticide Application and irrigated water, it is possible toavoid or reduce pollution to groundwater through their own decay.
GUS of methyl- 1065 and 1065 are not known because of inadequate data, but studiesshow that half-life period of 1065 is 7.8 days in neutral to slight-alkalinity soil. Itdissolves rather quickly in soil and will not be accumulated in soil. The content andTo.5 of methyl-1065 in soil relies on pH of soil. In acid soil, methyl-1065 may remainmore than five months in soil, while in alkalinity soil, it is unstable and will bedegraded by 95% with the role of microbes within 7 days. Soil in northern regions ofChina is slightly alkalinity. It is expected that the use of above pesticides has smallimpacts to soil and groundwater. However, it is found in some studies that pesticideresidue is high in irrigated cotton field. Therefore, residue of pesticide in soil isaffected by many factors, and accurate conclusion is difficult to draw at present.Pyrethrin(??) has been used in some project areas. Theoretically speaking, it hascharacteristics of more effectiveness, lower-poison and lower residue comparing toorganic phosphorus. Impact of pyrethrin to environment is lower than that of organicphosphorus. It is difficult to assess the impact of Shennongdan pesticide used in theproject areas since there are no reference materials available. The application ofpesticides in the project areas will follow the principle of high efficiency, low poisonand low residue. Efforts will be made to reduce the threat of pesticide to soil andgroundwater.
Adopting water-saving irrigation will reduce irrigation water volume, andgroundwater recharge by irrigation returning water will also be reduced at the sametime. In particular when drip and micro irrigation is used, water will not penetrate intogroundwater and basically no impact will be resulted in. Water leaching is the causeof pesticide mobility. Probability of pesticide movement into groundwater forsprinkler and improved surface irrigation is much smaller than that of traditionalirrigation, but possibility still exists, especially in sandy soil.
Measures such as straw returning to field in the project areas are good for pesticidedegradation. The impact of straw returning to field is the increase of organic contentin soil. As discussed above, high organic content is good for adsorption anddegradation of pesticides.
From the point view of water saving and agricultural measures, the project willreduce the potential pollution possibility to groundwater comparing to the traditionalagricultural conditions without project, but behavior of pesticide to environment isstill unknown in many aspects. The efforts in many countries are focusing on theprevention of pesticide pollution. Although the project does not finance thepesticides, the whole process monitoring should be carried out under the project to
51
monitor amount, methodology of application and residue of pesticide, strictlyfollowing the principles of high efficiency, low toxicity and low residue.
5.5 Environmental Impact during Construction PeriodThe construction quantities of the project are mainly shown among table 2-4 to table2-7. Some environmental impact in temporary and in local will be raised duringconstruction period. The main impacts are followings.
(1) Spoiled materials
Spoiled materials are from civil works of water delivery canals, bridges and culverts,land leveling, rural roads, etc and concrete of canal lining. Average earth excavationper project area is relative small due to extensive distribution of project scopes. Manyworks, such as pipe laying, are excavated immediately followed by back filling,which produce less spoiled materials. Land leveling, water and soil conservation, andimprovement of medium and low yield land are belonging to optimized use of land.
(2) Dust
Theoretically speaking, construction of the civil works may cause dust in local areas,especially in windy dry period of Spring. But the construction areas are located inrare populated land, which has less impact on people. Construction in strong windclimate should be avoided.
(3)Water and soil lossesMost lining is implemented in the existing canals, and only small part of canalexcavation will damage local vegetation. Construction in rainy season may causesome water and soil losses.
Construction of rural roads may result in severe water and soil losses if in rainyseason or improper construction method used. In rainy season, if drainage is not good,roads are prone to damage, which will have adverse impacts on nearby land in floodseason.
(4) NoiseMachine excavation, aggregate processing and concrete mixing is the constant sourceof noise and vehicle causes temporary noises. Constant noise will not affect people'slife since the construction sites are far from density-populated residential areas.Vehicles at night may produce small noises to residential areas.
5.6 Social Impact Assessment
5.6.1 The project alleviates the regional conflicts of water supply and demandThe project is located in serious water shortage regions, water saving irrigation willnot only improve the agricultural water efficiency but also alleviate the conflicts ofagriculture use and industrial and domestic uses for waters to some extend.
82
5.6.2 Impact on rural production method after projectThere are following impacts on rural production method after project:(l)Water saving irrigation promotes the adjustment of crop patterns.Construction ofwater conservancy works and improvement of medium and low yield farm land,turning flooding irrigation into advanced irrigation such as sprinkler and dripirrigation, are of advantages to the adjustment of crop patterns and farming system.The adjustment with the combination of local characteristics will make the croppatterns more reasonable, increasing crops with low water consumption and higheconomic returns.
(2)Bases construction and extension of high quality seed The project areas haveestablished high quality seed bases and seed companies of main crops, such as wheat,paddy, corn, cotton, soybean and rape, with the consideration of their own cropstructures. Seed service systems at all levels will promote the use of high qualityseeds. The coverage of high quality seeds of grain, cotton and rapeseed will increaseafter project, and unified seed supply of main crops will reach 85% from present60%. Seed companies will guarantee the quality of seeds. All these have optimizedcrop patterns in the project areas and protected benefits of farmers.
(3) Agricultural mechanization enhancedAgricultural machinery will be procured in the component of agricultural technologyand machinery service systems in the project areas. These include large combineharvester, paddy planter, seed planter, thresher, tractor, fertilizer deeper and machineof returning straw into field, etc. Using of these machines will enhance agriculturalmechanization, increase the productivity, reduce labor strength of farmers and shortenworking time in the project area. In particular, using of machinery of returning strawinto field and fertilizer deeper has changed farming method.
(4) Improve scientific farming and on-farm managementThe extension of agriculture technologies, with project, will improve scientificfarming, which is of advantages to proper use of fertilizer, pesticide and agriculturefilm.In general, the project will improve the agricultural production conditions andenhance farming method, turning the individual contract economy to larger scaleagricultural mechanization and improving from extensive on-farm management toscientific management. Yield and income increase is expected and project areas willbecome the production bases of grain, cotton and oil.
5.6.3 Impact on agricultural economyOutput of grain, oil crops, vegetable, cotton and fruit is expected to increase due toimprovement of irrigation facilities and adjustment of crop patterns with project,which will promote the development of agricultural economy.
83
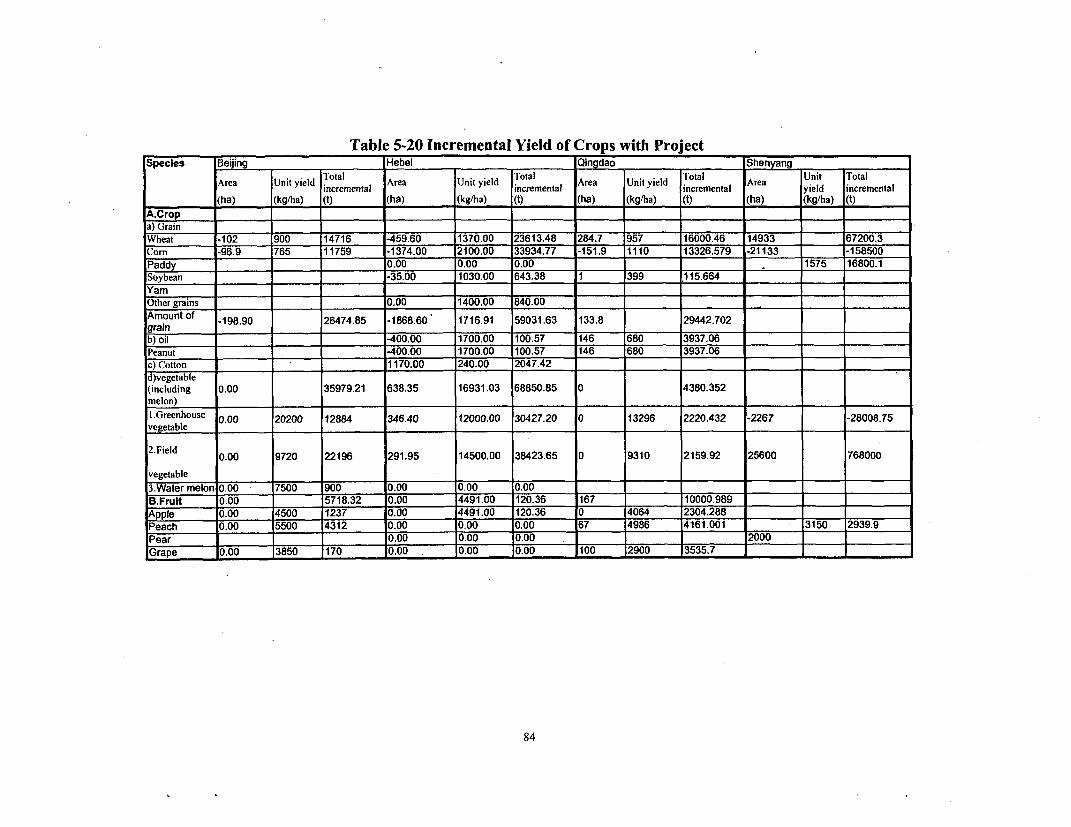
Table 5-20 Incremental Yield of Crops with ProjectSpecies Beijing Hebei ._.___Qingdao Shenyang
Area Unit yield Total Area Unit yield Total Area Unit yield Total Area Unit Totalincremental incremental incremental yield incremental(ha) (kg/ha) (t) (ha) (kg/ha) (t) (ha) (kg/ha) (t) (ha) (kg/ha) (t)A.Crop _ . . .a) Grain .Wheat -102 900 14716 -459.60 1370.00 23613.48 284.7 957 16000.46 14933 67200.3Com -96.9 765 11759 -1374.00 2100.00 33934.77 -151.9 1110 13326.579 -21133 -158500Paddy 0.00 0.00 0.00 1575 16800.1Soybean -35.00 1030.00 643.38 1 399 115.664Ym ~
Other grains _0.00 1400.00 840.00 _ Amount of -198.90 26474.85 -1868.60 1716.91 59031.63 133.8 29442.702grain _ _ _ _ _ _ _ _ __ _ _ _ _ _ _ _
b) oil -400.00 1700.00 100.57 146 680 3937.06Peanut -400.00 1700.00 100.57 146 680 3937.06c) Cotton 1170.00 240.00 2047.42d)vegetable(including 0.00 35979.21 638.35 16931.03 68850.85 0 4380.352melon) _I .Greenhouse 0.00 20200 12884 346.40 12000.00 30427.20 0 13296 2220.432 -2267 -28008.75vegetable _
2.Field 0.00 9720 22196 291.95 14500.00 38423.65 0 9310 2159.92 25600 768000
vegetable3.Water melon 0.00 7500 900 0.00 0.00 0.00B.Frult 0.00 5718.32 0.00 4491.00 120.36 167 10000.989Apple 0.00 4500 1237 0.00 4491.00 120.36 0 4064 2304.288Peach 0.00 5500 4312 0.00 0.00 0.00 67 4986 4161.001 3150 2939.9Pear _ .00 0.00 0.00 . 2000Grape 0.00 3850 170 0.00 . 0.00 0.00 100 2900 3535.7 =
84
5.6.4 Women's role in projectAt present, most of rural. women in the project areas receive low education andpossess little agricultural techniques. Most of them engage in agricultural planting,some of small portions of surplus labors are household wives, some go outsidelooking for causal work. Most of rural women engage in strength labor work with lowincome.
The project will not only improve the rural social environment but also enable womenplay more important role in agricultural economy. First, the project will provide moreemployment opportunities to women. For instance, women after training from localagricultural technology centers can engage in extension, seed service and plantprotection as well as rural project management. Second, the project enhancesagricultural mechanization and thus reduces the work strength of women, shorteningworking time. Third, some women attend agricultural machinery and technologytraining programs and they will learn some skills of modem technology andmanagement, which also provide technical basis for development of diversified sidebusiness.In a word, the project will raise women's scientific and cultural knowledgeand their incomes. With women's increase portion in household income, theypositions will be raised and family life will also be improved.
5.6.5 SIDD's impact on social environment
(1) Features of management and operation of present water worksa. The central or/and local governments mainly finance present water works, andfarmers contribute their labors.
b. Operation and management of water projects are the responsibilities of variouswater authorities including provincial, prefectural (city) and county water bureaus andwater users. Provincial water authority is in charge of inter-prefecture (city) watersource projects; prefectural water department is responsible for inter-county irrigationschemes; county and township water agencies takes responsibility of works of localand below-branch canals; and maintenance of lateral and sub-lateral canals is done bywater users.
c. Water use is managed according to plan and supplied by different levels.
d. Water charge is measured to township and collected by township or by mu in area.
(2) The main problems of present management and operationa. Lack of completion of field works after key water works being built due to short offunds;b. Most projects were built in 1960's and have been operated for more than thirtyyears. They are now in ill-operation because of maintenance fund shortage;c. Construction, maintenance and normal operation of water project need subsidiesfrom central or/and local governments, which is a burden of governments.
(3) SIDD impact
85
SIDD, breaking through the original management system and operation method, willestablish legal economic entities. It will break off administrative and financialrelations with the government and its agencies, realizing self-management, self-operation, self-financing, and self-development. The main feature is privatelyoperated, and water users directly participate in its management. Water is used ascommodity, and water charge is based on cost and demand. SIDD impacts are asfollows:
a. Implementation of SIDD, supplying water as commodity, will enhance users'awareness of water saving and thus promote the implementation of water savingtechniques. First, from the view of water user association and users, they willstrengthen the maintenance and management of on-farm facilities and reduce thewaste of water in irrigation in order to reduce water charges. In the mean while, theywill adopt scientific irrigation method, properly arrange irrigation frequency andtiming, thus reduce waste of water. Second, from the view of water supply company(WSC), it will adopt all kind of measures to raise its benefits in the long run, giventhe certain amount of water supply available.
b. Water price is sensitive issue. SIDD requires the determination of water price basedon cost of water supply. No conflicts are expected in sufficient water supply areas. Inwater shortage areas in China, water balance will be reached basically in 50%frequency year. In dry years, water quota for water supply companies will decrease,and water price will certainly rise. There are two reasons. First, water price of watersupply companies is determined by supply cost. The decrease of water supply canonly reduce the electric cost of water lifting, while the cost of system maintenance,depreciation and labor is the same as the normal year. That is to say that in dry yearswater supply cost will increase and thus water price rises. Second, water price alsorelies on water demand. Demand in dry years will certainly increase. Driven byeconomic benefit, WSC may raise the water price, which means production cost ofusers will increase. In dry years, if users can get enough irrigation water that does notresult in a yield decrease, slightly higher cost would be easily accepted. But if usersfail to get enough irrigation water that results in a decrease of output, rise of waterprice may not be accepted since grain market will not be fluctuate just because ofgrain output decrease in some local areas. Therefore, dry years make the users evenworse. It is expected to resolve this problem in the pilot SIDD program.
c. The cost of depreciation, operation and maintenance for large key water works ishigh, and water charge may be higher than that of small projects. Water users mayfeel their burdens high, which may affect the full use of existent water works andconversely affect the maintenance of these facilities.d. SIDD renovates the present water resource management model based onadministrative boundaries, and it will play some govemmental water managementfunction. When inter-basin or inter-department conflicts occur, it remains an unsolvedproblem for SIDD to coordinate regional water resource allocation, i.e. how to obtainnecessary water volume and ensure users demand as well as realize its own economictarget in the mean while. Implementation of SIDD may promote the government'sreform on water pricing and water management.
86
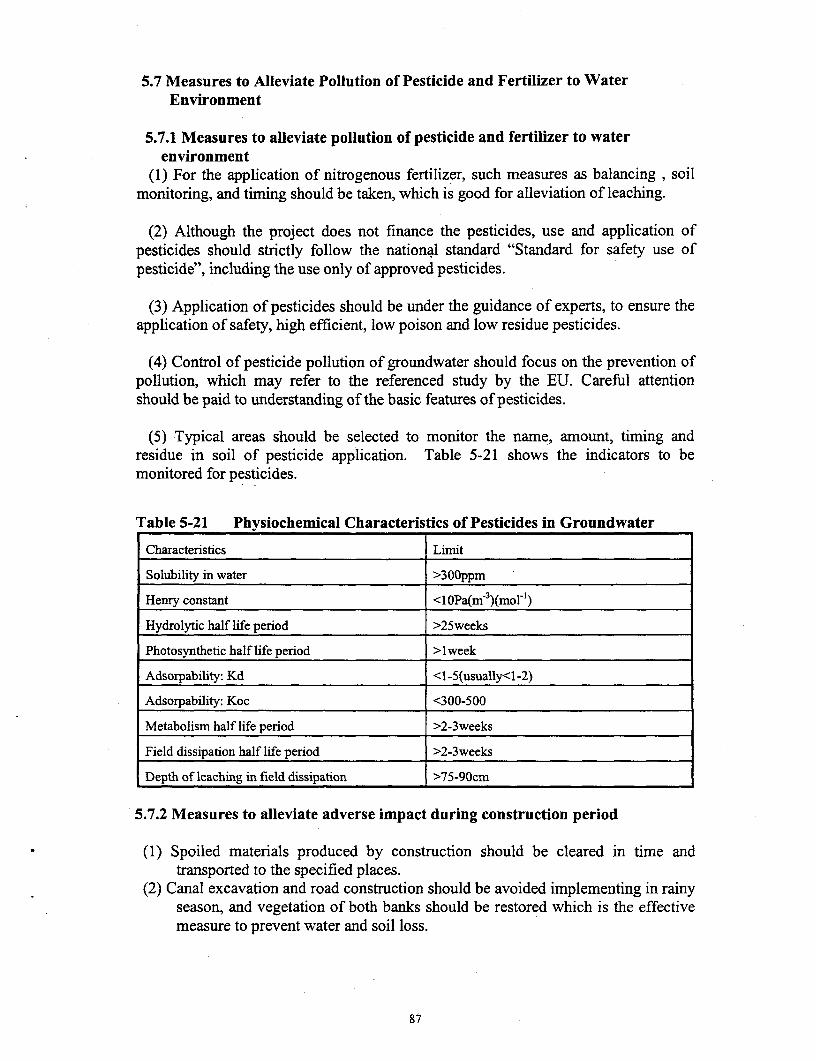
5.7 Measures to Alleviate Pollution of Pesticide and Fertilizer to WaterEnvironment
5.7.1 Measures to alleviate pollution of pesticide and fertilizer to waterenvironment
(1) For the application of nitrogenous fertilizer, such measures as balancing, soilmonitoring, and timing should be taken, which is good for alleviation of leaching.
(2) Although the project does not finance the pesticides, use and application ofpesticides should strictly follow the national standard "Standard for safety use ofpesticide", including the use only of approved pesticides.
(3) Application of pesticides should be under the guidance of experts, to ensure theapplication of safety, high efficient, low poison and low residue pesticides.
(4) Control of pesticide pollution of groundwater should focus on the prevention ofpollution, which may refer to the referenced study by the EU. Careful attentionshould be paid to understanding of the basic features of pesticides.
(5) Typical areas should be selected to monitor the name, amount, timing andresidue in soil of pesticide application. Table 5-21 shows the indicators to bemonitored for pesticides.
Table 5-21 Physiochemical Characteristics of Pesticides in Groundwater
Characteristics Limit
Solubility in water >300ppm
Henry constant <IOPa(m-3)(mor')
Hydrolytic half life period >25weeks
Photosynthetic half life period >lweek
Adsorpability: Kd <1-5(usually<1-2)
Adsorpability: Koc <300-500
Metabolism half life period >2-3weeks
Field dissipation half life period >2-3weeks
Depth of leaching in field dissipation >75-90cm
5.7.2 Measures to alleviate adverse impact during construction period
(1) Spoiled materials produced by construction should be cleared in time andtransported to the specified places.
(2) Canal excavation and road construction should be avoided implementing in rainyseason, and vegetation of both banks should be restored which is the effectivemeasure to prevent water and soil loss.
87

(3) Construction vehicles should slow down when travel through residential areas,and no tooting is allowed. Try to avoid moving through residential areas atnight.
5.7.3 Other environmental issues and their control measuresOther environmental issues in low impacting, in temporary and in local will be
arose during construction period. Mains of them are shown in table 5-22.
TableS-22 Other Environmental Issues and Their Control Measures
Job Impact Controlling measure
Construction land-occupied Impact on land utilization Reasonable selection, and notoccupy basic farmland
Impact on land utilization andvegetation. The larger density Building motor well in
Constructing machine-well of motor well or unreasonable agricultural spare time andlayout may result in decline of make reasonable layoutwater table.Changing phsical
Film residue characteristic of soil, the use easily decomposedwhite pollution will fu linfluence landscape view.Destroy mature earth on Maintain matured earth
Leveling land soil surface and influence possibly to cover onbalance of water and heat. surface layer of soil.Mechanical noise and
Applying farm machinery mechanical oil seepage Strict operation ruleswill pollute soil.
6. Environmental Benefit Analysis
6.1 Project Investment
88
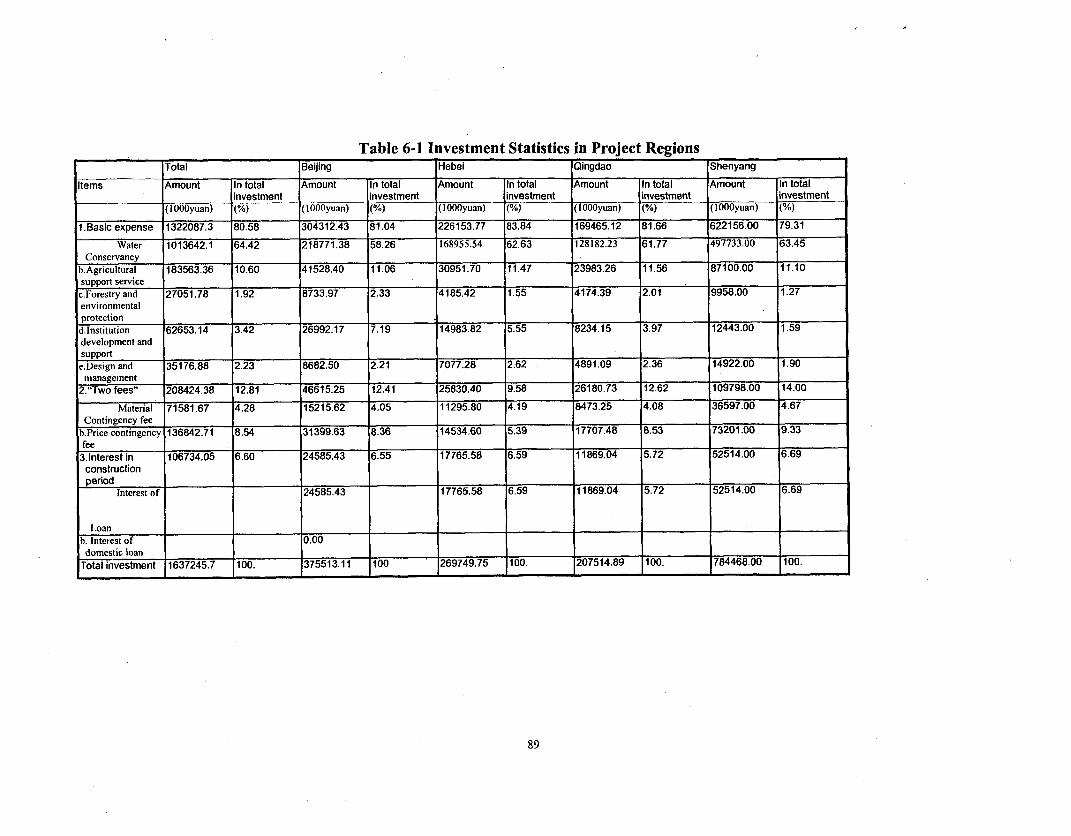
Table 6-1 Investment Statistics in Project RegionsTotal Beijing Hebei Qingdao Shenyang
Items Amount In total Amount In total Amount In total Amount In total Amount In totalinvestment investment investment _investment investment(1OOOyuan) (%) (IOOyuan) (%) (1OOOyuan) (%) (IOOyuan) (%) (lOOOyuan) (%)
1.Basic expense 1322087.3 80.58 304312.43 81.04 226153.77 83.84 169465.12 81.66 622156.00 79.31Water 1013642.1 64.42 218771.38 58.26 168955.54 62.63 128182.23 61.77 497733.00 63.45
C onservancy I__ _ _ _ _ _ _ _ _ _ _ _ _ _ _ _ _ _ _ _ _ _ _ _ _ _ _ _ _ _ _ _ _ _ _ _ _ _ _ _ _ _ _ _ _ _ _ _b.Agricultural 183563.36 10.60 41528.40 11.06 30951.70 11.47 23983.26 11.56 87100.00 11.10support service ______
c. Forestry and 27051.78 1.92 8733.97 2.33 4185.42 1.55 4174.39 2.01 9958.00 1.27environmentalprotection__ _ _ _ _ _ _ _ _ _ _ _ _ _ __ _ _ _ _ _ ___ _ _ _ _ _ _dInstitution 62653.14 3.42 26992.17 7.19 14983.82 5.55 8234.15 3.97 12443.00 1.59development andsupport__
_ _ _ _ __ _ _ _ _ _e.Design and 35176.88 2.23 8682.50 2.21 7077.28 2.62 4891.09 2.36 14922.00 1.90management_________________
____2nTwo fees" 208424.38 12.81 46615.25 12.41 25830.40 9.58 26180.73 12.62 109798.00 14.00
Material 71581.67 4.28 15215.62 4.05 11295.80 4.19 8473.25 4.08 36597.00 4.67Contingency fee _____________
b.Price contingency 136842.71 8.54 31399.63 8.36 14534.60 5.39 17707.48 8.53 73201.00 9.33fee3.Interest in 106734.05 6.60 24585.43 6.55 17765.58 6.59 11869.04 5.72 52514.00 6.69construction
Interest of 24585.43 17765.58 6.59 11869.04 5.72 52514.00 6.69
Loan _ _ _ _ _ _ _ _ _ _ _ _ _ __ _ _ _ _ _ _b. Interest of 0.00domestic loan _ _ _ _ _ _ _ _ _ _ _ _ _ _ _ _ _ _ _ _ _ _ _ _Total investment 1637245.7 100. 375513.11 100 269749.75 100. 207514.89 100. 784468.00 100.
89
6.2 Economic Benefit Analysis
6.2.1 Adjusting Planting StructureAfter implementation, the project would develop irrigation area of 167500 ha, inwhich 46700ha of canal lining, 69600ha of low pressure pipeline irrigation, 29800 haof sprinkler and 21400 ha of mini-irrigation, improve irrigation condition in projectarea and increase guarantee rate of irrigation. Meantime, the project will increasecropping index through construction of agricultural supporting service system andcounterpart forestry measures. Especially, enhancement of cultural capability offarmers and establishment of managing system will benefit for adjustment of cropplanting structure, adding seeding area of cash crops featured with high-yield, goodquality, high efficiency and high adding value, as well as increasing cropping index inproject area from 129% without project to 141.4%. According to gathering report byfive provinces/municipalities, the seeding area will increased by 20700ha.
6.2.2 The output of new-increased agriculture and forestry product
(1) Incremental Production of Crops After implementation, along with thedevelopment of water saving irrigation engineering and combined with agricultureand forestry measures, the agricultural yields in project area will increase year by yearand reach steady production level within 2-3 years. Vegetable will reach steadyproduction level in current year. Grain crop and cash crop will be increased by 15-20% and 10-15% respectively. The total incremental production of grain is 72103tons, and 3055 tons for oil material, 2685 tons for cotton and 898818 tons for melonsand vegetables.
(2) Incremental Production Forest and Fruit Products There is a longer cutting periodfor forest wood about 15 years with 120-130 sqare meter per ha. The normal cuttingperiod for firewood is 10 years with 25-35 squar meter per ha. There is greatdifference for different variety of fruit tree such as apple, peach and grape. The totalincremental fruit products is 48339 tons in this project.
Calculated with current financial price, up mentioned items will totally increaseoutput value of 133.4694 million yuan and net income is 660.8671 million yuan.
(3) Typical Household and Income Impact
In order to correctly inflect real information on household income and expense,
sampling method is adopted for investigation. Each project province or municipality
should select three kinds of household according to different irrigation way as
representative of various income level. The items of investigation include population,
labor force, cultivated land area, seeding area of various crops, income of agricultural
by-products, income of tertiary industry, input of production and worker payment.
90

Table6-2 Impact on Typical Household IncomePresent condition Sixth year in future Actual increase
Per ~~~~~AverageHousehold Scale Income Per Income Per capital groath to Total growth
(person) (yuan) (capan) (yuan) (yuan) sixth year (%/6)
Canal irrigation district
High income 5 9494 1899 10822 2164 2.6 14Middle income 5 7992 1598 9287 1857 3 16
Hebei Low income 5 7220 1440 9320 1864 5.3 29Well irrigation district
High income 4 8093 2023 10135 2534 3.8 25.3Middle income 4 6714 1678 8530 2133 4.1 27.1
Low income 4 4874 1218 7014 1754 6.3 44Canal irrigation district
High income 3 4514.10 1504.70 5160.90 1720.30 2.39 14.33Middle income 4 3870.60 967.65 4964.70 1241.18 4.71 28.27
Shanmxi Low income 3 2090.40 696.80 2592.00 864.00 4.00 24.00Well irrigation district
High income 4 3065.00 1766.25 3669.00 917.25 3.28 19.71Middle income 7 7560.00 1080.00 8763.00 1251.86 2.65 15.91
Low income 3 3980.00 1326.67 4591.00 1530.33 2.56 15.35Canal irrigation district l _
High income 7 22820.0 3260.00 26243.0 3749.00 _15.00
Qingdao Middle income 5 15450.0 3090.00 17768.0 3553.50 15.00Low income 4 11360.0 2840.00 13064.0 3266.00 15.00Well irrigation district
High income 3 9960.00 3330.00 13545.0 4515.00 7.20 36.00Shenyang Middle income 2 4065.00 2000.00 6665.00 3333.00 12.80 64.00
l______ Low income 3 4520.00 1500.00 6870.00 2290.00 17.30 52.00Well irrigation district l | | |
High income 5 194624.3 18924.8 123009.9 24602.00 24.00 28.50Beijing Middle income 4 148730 12182.5158526.70 14631.68 8.40 17.10
Low income 4 17336.0 1834.1318632.95 2158.24 12.52 16.38
6.3 Social Benefit Analysis
6.3.1 Disaster alleviation and preventionDrought, flood and waterlogging are the main natural disasters affecting production inproject areas. The counterpart standard of on farm irrigation and drainage works isenhanced after project implementation, irrigation guarantee degree can be improvedwhich will alleviate the impact of drought and flood disasters on agriculturalproduction. In conjunction with agriculture measures the extension of anti-drought,anti-wind and high quality species will enhance anti-disaster and prevention ability ofcrops. Implementation of forestry components, such as farm protection forest and treeplanting around farm land, will reduce the damages of wind and sand to agriculturalproduction and preserve water and soil.
6.3.2 Mitigation of water right conflictsThe project will reduce water losses and enhance the effective use of water resources,which will easy up the conflicts among industrial, agricultural and domestic water
91
uses and among different administrative boundaries, promoting social stability.
6.3.3 Accelerate regional economic developmentWorld Bank loan is used to develop water saving irrigation projects and improve theagricultural production, which not only brings great development for agriculture butalso promotes development of forestry, animal husbandry, side industry and fishery.Development of these sectors offers large amount of raw materials for processingindustry and inspires development of transportation and township enterprises. Byvalue added processing and subsiding agriculture, all round economic developmentwill realize in the project areas. Economic development in project areas willcontribute a lot to the realization of strategic targets of two cities.
6.3.4 Promote social stabilityAs the development of regional economy and decrease of water conflicts, therelationship between people, their living conditions, infrastructure facilities, andcultural and recreation facilities will be improved. Employment opportunities will riseand people will enhance their cultural understanding, which promote social stability.
Establishment of SIDD, WSC and WUA will change the management mechanismand improve water resources management. It will be responsible for projectconstruction, operation and management. It will supply water according to cost andrecover project cost, which preserves and increases the value of fixed assets andpromote sustainable development.
6.4 Environmental Benefit Analysis6.4.1 Environmental benefit of forestryDevelopment of farm protection forestry and fruit trees can achieve bio-environmental benefit of wind prevention, sand consolidation and climateimprovement. The project will increase farm protection forestry of 132,500 ha.According to data from Changli Agriculture Zoning Office, wind velocity with fruittrees is 25 0 D 35 [ lower than that without fruit trees, and temperature decreases insummer and increases in winter 1-2 [ 1 evaporation decrease by about 20 0. Farmprotection forestry is the major component of bio-agriculture construction. Naturalenvironment will be improved after completion of forestry components.
6.4.2 Environmental benefit of agriculture
Development of agriculture, forestry, animal husbandry, side industry and fishery willenrich farmers choice for commodities, which can make full use of energy andresources, and make the recycle of energy and commodities more reasonable.
6.4.3 Environmental benefit of water conservancy projects
Water projects will make the development and utilization of water resourcesreasonable, mitigating disasters of drought, flood and alkalinity and bringing many
92
environment benefits.
Development of water saving irrigation projects can increase regional water resourcesefficiency and reduce volume of groundwater drafting. It will ease up water conflictsof various departments and realize good recycling of bio-environment, achievingmaximum benefits of water resources.
Implementation and extension of water saving irrigation turns the every householdland irrigation into large-scale land irrigation, which makes the scientific and in timewatering possible and is of advantages to scientific regulation of surface and groundwater, and to effectively control of water table, degradation of soil and fertilizerlosses. All these are not only saving water but also preserve good bio-environment offarmland.
7. Environment Monitoring Plan and Protection and ManagementPlan
7.1 Environment Monitoring Plan
7.1.10bjective
Erivironment monitoring is the basic work of pollution control and management Afterwater saving projects implemented, the change of irrigation method, crop patterns andenvironment elements around will result in change of regional environment system.In order to reflect the present quality and future trend of environment in time andaccurately, and to provide scientific data for environment management and pollutioncontrol, it is necessary to strengthen environment monitoring and evaluation. Thepurposes of monitoring are as follows:
(1) Impact on water table after project;(2) Impact of irrigation water quality on groundwater quality and soil in project
areas;(3) Application of pesticide and fertilizer, their impact on and residue in soil and
groundwater.
7.1.2 Monitoring plan
(1) Principle of monitoring points selectiona. Ground water table: subproject area is as basic unit. Based on hydrogeologicalconditions, typical monitoring point is selected, making use of existing normalmonitoring point.b. Water environment (quality) monitoring: try to use normal sampling points aspossible and add some points according to pollution status.c. Soil monitoring: new points should be added on the basis of the existing countylevel agricultural environmental sampling points.
93
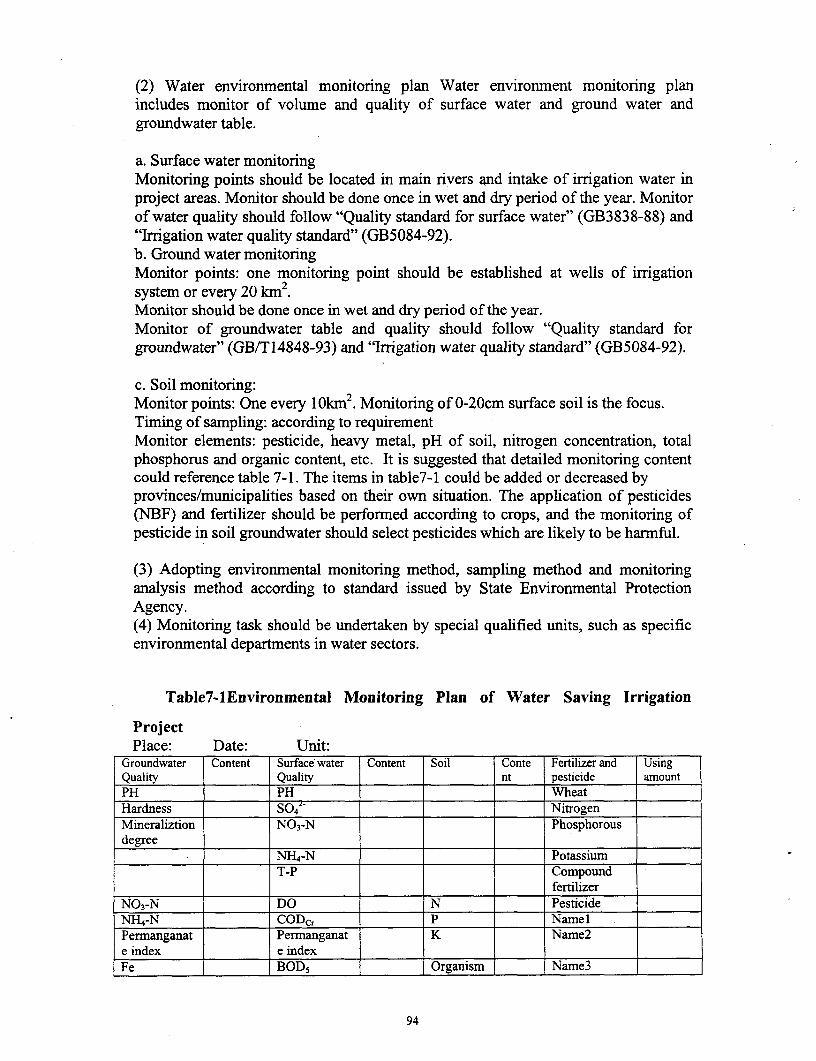
(2) Water enviromnental monitoring plan Water environment monitoring planincludes monitor of volume and quality of surface water and ground water andgroundwater table.
a. Surface water monitoringMonitoring points should be located in main rivers and intake of irrigation water inproject areas. Monitor should be done once in wet and dry period of the year. Monitorof water quality should follow "Quality standard for surface water" (GB3838-88) and"Irrigation water quality standard" (GB5084-92).b. Ground water monitoringMonitor points: one monitoring point should be established at wells of irrigationsystem or every 20 km2.Monitor should be done once in wet and dry period of the year.Monitor of groundwater table and quality should follow "Quality standard forgroundwater" (GB/T14848-93) and "Irrigation water quality standard" (GB5084-92).
c. Soil monitoring:Monitor points: One every IOkm2. Monitoring of 0-20cm surface soil is the focus.Timing of sampling: according to requirementMonitor elements: pesticide, heavy metal, pH of soil, nitrogen concentration, totalphosphorus and organic content, etc. It is suggested that detailed monitoring contentcould reference table 7-1. The items in table7-1 could be added or decreased byprovinces/municipalities based on their own situation. The application of pesticides(NBF) and fertilizer should be performed according to crops, and the monitoring ofpesticide in soil groundwater should select pesticides which are likely to be harmful.
(3) Adopting environmental monitoring method, sampling method and monitoringanalysis method according to standard issued by State Environmental ProtectionAgency.(4) Monitoring task should be undertaken by special qualified units, such as specificenvironmental departments in water sectors.
Table7-lEnvironmental Monitoring Plan of Water Saving Irrigation
ProjectPlace: Date: Unit:
Groundwater Content Surface water Content Soil Conte Fertilizer and UsingQuality Quality nt pesticide amountPH PH WheatHardness S04 - NitrogenMineraliztion N0 3-N Phosphorousdegree
NH4-N Potassium
T-P Compoundfertilizer
N0 3 -N DO N Pesticide
NH 4 -N CODcr P Name l
Pernanganat Permanganat K Name2e index e indexFe BOD 5 Organism Name3
94
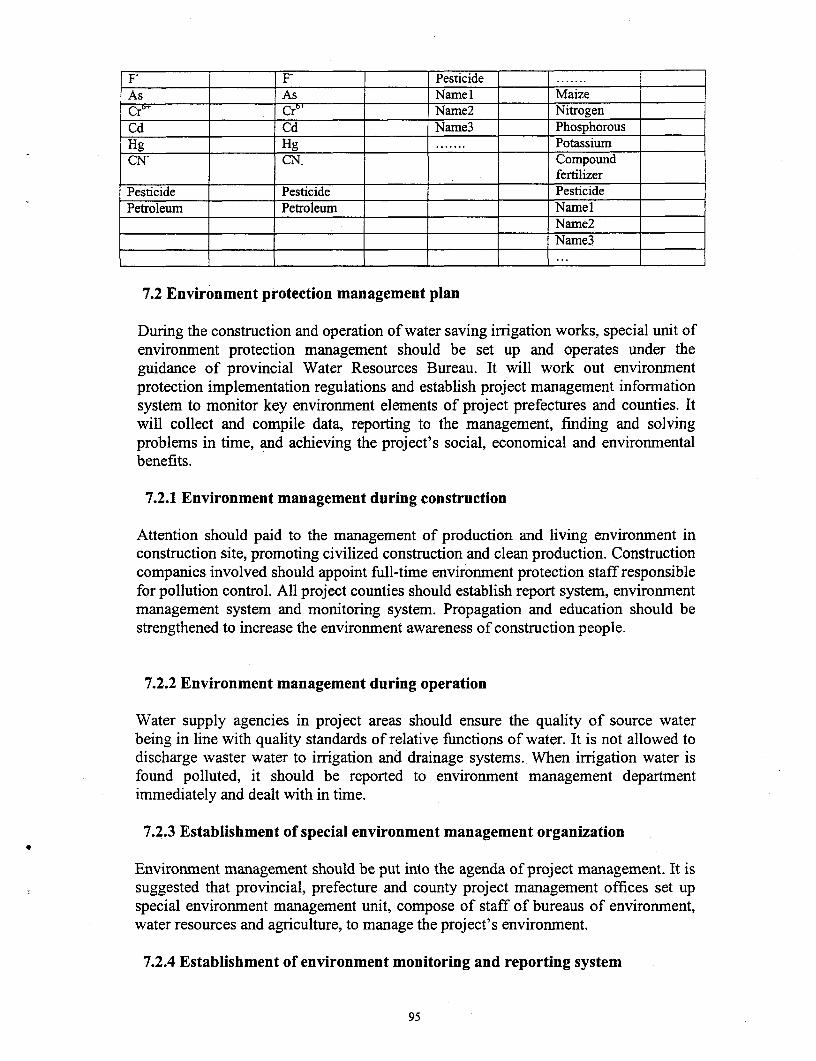
F F Pesticide .......As As Namel MaizeCr` Crb+ Name2 NitrogenCd Cd Name3 PhosphorousHg Hg ....... PotassiumCN- CN_ Compound
fertilizerPesticide Pesticide PesticidePetroleum Petroleum Name 1
Name2Name3
7.2 Environment protection management plan
During the construction and operation of water saving irrigation works, special unit ofenvironment protection management should be set up and operates under theguidance of provincial Water Resources Bureau. It will work out environmentprotection implementation regulations and establish project management informationsystem to monitor key environment elements of project prefectures and counties. Itwill collect and compile data, reporting to the management, finding and solvingproblems in time, and achieving the project's social, economical and environmentalbenefits.
7.2.1 Environment management during construction
Attention should paid to the management of production and living environment inconstruction site, promoting civilized construction and clean production. Constructioncompanies involved should appoint full-time environment protection staff responsiblefor pollution control. All project counties should establish report system, environmentmanagement system and monitoring system. Propagation and education should bestrengthened to increase the environment awareness of construction people.
7.2.2 Environment management during operation
Water supply agencies in project areas should ensure the quality of source waterbeing in line with quality standards of relative functions of water. It is not allowed todischarge waster water to irrigation and drainage systems. When irrigation water isfound polluted, it should be reported to environment management departmentimmediately and dealt with in time.
7.2.3 Establishment of special environment management organization
Environment management should be put into the agenda of project management. It issuggested that provincial, prefecture and county project management offices set upspecial environment management unit, compose of staff of bureaus of environment,water resources and agriculture, to manage the project's environment.
7.2.4 Establishment of environment monitoring and reporting system
95

Environment monitoring and reporting system is an effective measure of environmentmanagement.(1) Monitoring stations at all levels will draft environment-monitoring reportaccording to the monitoring plan.(2) All subproject areas will report monitoring results to county project managementoffices (PMOs), thus report to provincial PMO by county PMOs.(3) Project city environment protection bureau will summarize the countyenvironment monitoring reports. It will present environment monitoring andmanagement proposals following the national and local environment laws orregulations and dispatch to lower level environment departments.(4) The above monitoring report and proposal of city environment protection bureauswill be reported to CPMO. PMOs at all levels should adjust and implementmonitoring plan under the guidance of CPMO.
8. Public Involvement
Water saving irrigation will play a positive role in local rural social and economicdevelopment and the improvement of farmer's living standard. The publicparticipation is very necessary, we should give the public participation andsupervision into fill play, eliminate and alleviate the adverse impact during theconstruction and operation of the project, realize the coordinated development ofeconomic construction and environmental protection and guarantee the numerousmass's benefits.
8.1 Survey objects and method
Survey objects: include farmers in the project area, local governmental officials,administrative personnel of the project and water conservancy, agricultural,environmental and forest experts, etc. Sex, age, educational level, occupation andrevenue were all taken into account.
Survey method: granting "questionnaire for the public participation" to the numerousfarmers and carrying out sampling survey are the majority, and concurrently holdingsymposium and experts' consultation.
8.2 Survey results
Table 8-1 Statistical Analysis of Public Comments in Shenyang Project Area
Investigated content Cornnents People Number Prn-
I.Do you know this water saving Yes 85 87.6irrigation project? No 12 12.4
2.Your attitude to this project Agree 91 95.8construction? Oppose 0 0
No matter 4 4.2
3 .How about impact of this project on Disadvantageous 727 77.8yourself?Disadvantageous 77 77.8
96
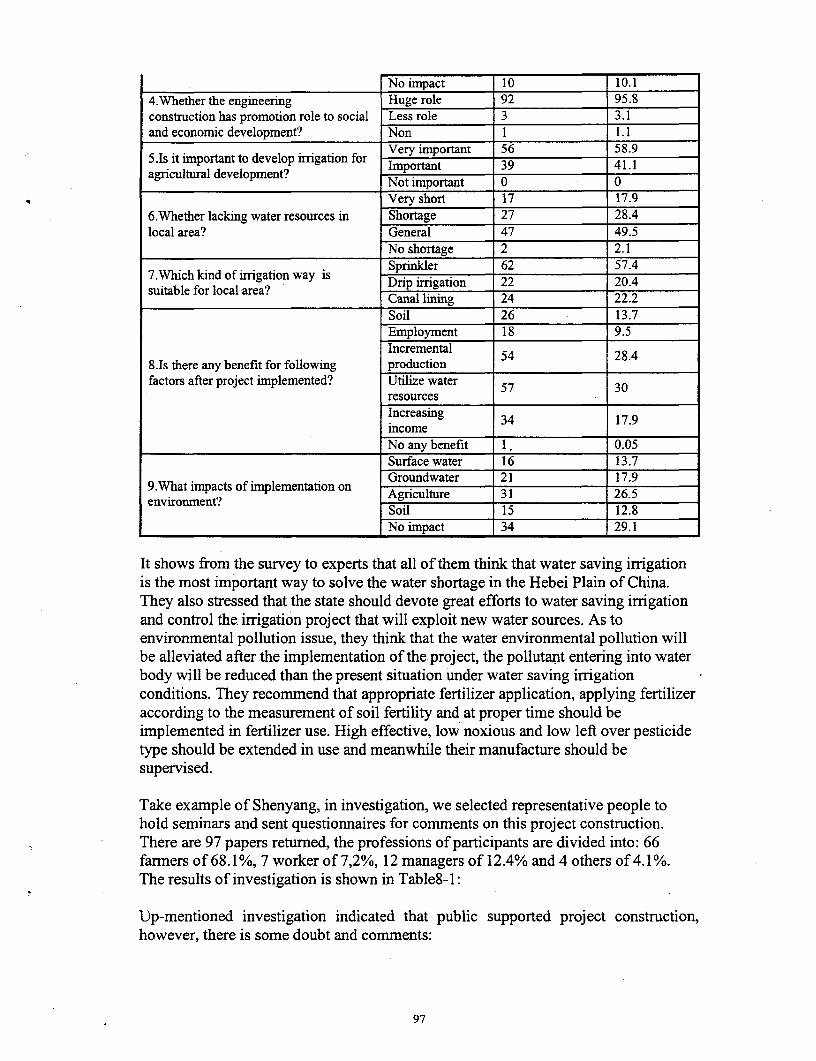
No impact 10 10.14.Whether the engineering Huge role 92 95.8construction has promotion role to social Less role 3 3.1and economic development? Non 1 1.1
5.Is it important to develop irrigation for Very important 56 58.9
agricultural development? Important 0 0Not important 0 0Very short 17 17.9
6.Whether lacking water resources in Shortage 27 28.4local area? General 47 49.5
No shortage 2 2.1. ~Sprinkler 62 57.4
7.Which kind of irrigation way is Drip irrigation 22 20.4suitable for local area? Cana linin 24 22.2
Canal lining 24 22.2Soil 26 13.7Employment 18 9.5Incremental 54 28.4
8.Is there any benefit for following productionfactors after project implemented? Utilize water 57 30
resourcesIncreasing 34 17.9incomeNo any benefit 1 0.05Surface water 16 13.7
9Wh ofimlmetaGroundwater 21 17.99.What impacts of iplemenAgriculture 26.5environmnent? Soil 15 12.8
No impact 34 29.1
It shows from the survey to experts that all of them think that water saving irrigationis the most important way to solve the water shortage in the Hebei Plain of China.They also stressed that the state should devote great efforts to water saving irrigationand control the irrigation project that will exploit new water sources. As toenvironmental pollution issue, they think that the water environmental pollution willbe alleviated after the implementation of the project, the pollutant entering into waterbody will be reduced than the present situation under water saving irrigationconditions. They recommend that appropriate fertilizer application, applying fertilizeraccording to the measurement of soil fertility and at proper time should beimplemented in fertilizer use. High effective, low noxious and low left over pesticidetype should be extended in use and meanwhile their manufacture should besupervised.
Take example of Shenyang, in investigation, we selected representative people tohold seminars and sent questionnaires for comments on this project construction.There are 97 papers returned, the professions of participants are divided into: 66farmers of 68.1%, 7 worker of 7,2%, 12 managers of 12.4% and 4 others of 4.1%.The results of investigation is shown in Table8-1:
Up-mentioned investigation indicated that public supported project construction,however, there is some doubt and comments:
97
(1) There is 87.6% of people know about this project and all thought that importantor very important to agricultural development. Who agreed this project accounting for95.8% and 77% of people thought this project has benefits to themselves.
(2) As to lack of local water resources, there is 49.5% of people thought local waterresource is general, 46.5% thought it is lacking water. There is 99.5% people agreethat this project will bring benefits on utilization of water resources, soilimprovement, incremental production and adding employment.
(3) As to water saving irrigation way, 57.4% are agree sprinkler, and 20% and 22%agree drip irrigation and canal lining, respectively
(4) As to impact of the project on environment, there is a scattered result, 29.1%thought it was no impact, and 10-26% thought it would bring impact on surfacewater, groundwater, soil and crops. Furthermore, farmers had some doubt onengineering quality and guarantee rate of water supply, and also proposed somecomments on water rate, power charges.
The farmers have very higher understanding to the project, they think that it can solvethe local water shortage, increase the yield of crops and the farmers' revenue andpromote the local social economic development, they recommend the project beimplemented soon. However, they have not clear understanding to environmentalissue and most of them think that the project won't exert any environment impact,and in another issue, they put forward its potential impact on groundwater, surfacewater, soil and agriculture. This indicates that the masses' environmentalconsciousness in the project area is very weak and they have not any knowledge inenvironmental pollution and environmental monitoring. Therefore, the farmer'senvironmental education should be strengthened during the construction of the projectand their consciousness in environmental protection should also be improved so as tocontrol the disadvantageous environmental impact to the minimum extent.
9. Conclusion and Suggestion
9.1 Environmental Impact Assessment Conclusions
-The content of soil nutrient in the project area is at the third level under the presentapplied quantity of fertilizer and cropping pattern. Content of heavy metal in soilbelongs to Class I natural background value scope, but Cd index in Yuhong ofShenyang reached Class II level exceeding original polluting concentration. Thereis no basic monitoring data as to pesticide pollution in project area.-The present quality of surface water environment in project area is polluted byorganic one and N fertilizer basically. The farmland irrigation water can meetquality requirement for farmland irrigation water. There is no large quantity ofbackwater in farmland irrigation in project area, so information on quality offarmland drainage has not been collected.-According to classifying standard for groundwater quality, the groundwater bodycan meet water quality standard, major influencing factors are hardness and N03-.
98
Generally groundwater in project area is fresh water, only some saline water existedin Guantao of Hebei. The degree of groundwater mineralization is less than 2g/l thatmeet quality requirement for farmland irrigation water.-The shortage of water resources exist both in the cases of present condition andwithout project condition.
9.2 Primary Beneficial and Adverse Impact and Prevention Measures
Primary beneficial impact
A. The adopted water saving irrigation technology, such as sprinkler, mini- irrigation,pipeline irrigation, groove irrigation and canal lining, in project areas will increaseutilization coefficient of water resources in traditional flush irrigation from 0.4-0.65to 0.70-0.85, reduce irrigation quota of crops and enhance utilization rate of waterresources.
B. With water saving irrigation technology, the water is irrigated according todemand by crops in different time section of their growing period. These reasonableand scientific irrigation technology could reduce infiltration and loss of evaporation.
Water saving irrigation is beneficial for alleviation of tense status of water resourcesin project areas, it will not aggravate continuous decline of groundwater table inproject area, and will make table going up to some extent.
The scientific irrigation way, combined with agricultural measures of balancedapplication of fertilizer, increasing temperature and keeping moisture and strawreturning field, will be helpful for timely delivery of water and nutrient to soil aroundcrop root, as well as improvement of soil structure and increasing utilization rate offertilizer. With water saving irrigation, the cultivated land is leveled and forest andvegetation are developed. Meantime, it will reduce loss of water and soil, facilitatemechanization, save labor force and promote sound development of ecologicalenvironment.
After implementation of the project, the popularization and extension of science andtechnology would be accelerated, which enable farrners to grasp modern knowledgeon scientific production and management. It will not only enhance cultural capabilityof farmers, but change social environment in village.
The implementation of the project, along with utilization of water saving irrigationtechnology, will promote the extension of agricultural technology, enhancing of unityield and promoted economic development of project areas.
SIDD improved managing mode, increased farmers capability on water utilizationand management, which is beneficial for increasing utilization rate of water resourcesand maintenance of irrigation facilities.
Primary Adverse Impact
99
A. After implementation of this project, although the potential impact of fertilizer andpesticides (pesticides are not financed under the project) on soil and groundwaterpollution is lower than that under traditional farming condition, with measures ofwater saving, agriculture and management, its impact does still exist. To potentialimpact of fertilizer and pesticides, prevention is predominant. The managementshould be strengthened in application process, the concrete measures are shown asbelow:
a. As to utilization of nitrogen, balanced application, measuring application, timelyapplication and separated application of nitrogen should be strengthened, which willbe helpful for reduction of nitrogen solution.
b. In application of pesticides (NBF), the regulation in Standard of Pesticide SafetyUse should be carried out strictly.
c. As to use of pesticide (NBF), the one featured with safe, high-efficiency, lowtoxicity and low residue should be used under direction of plant protection expert.
d. Prevention should be conducted for treatment of groundwater pollution bypesticide, the study results of European Union could be referenced. In application, thecharacteristic of pesticide should be considered cautiously.
e. Making key monitoring on quantity, time and residue in soil of pesticideapplication in selected typical area.
B. Noise, dust and loss of water and soil may be caused in partial area and timesection by earth excavation and mechanical construction, but they could be alleviatedthrough strengthened environmental management. Related measures are shown asbelow:
a. Clearing up the waste earth and residue produced in construction and deliveringthem to designated site for piling up.b. Canal excavation and road building should avoid conducting in rainy season,rehabilitating vegetation beside canal so as to prevent loss of water and soil.c. Constructing vehicle should possibly avoid passing through dwelling area at night,if need to enter then, it should run with low speed and not tooting.
C. Other aspects should, such as recovering residential film and managing spilled oilfrom agricultural machine, be strengthened.
9.3 Assessing Conclusion and Suggestions
In general, this project is the one that will improve irrigation facilities, increaseutilization rate of water resources, promote local social and economic development invillage and improve environment. After the project implemented, it will obtain greatsocial, economic and environmental benefits.
It is suggested that, during implementation of the project, enabling balance of supply
100
and demand of water resources, especially to groundwater, the exploitation amountshould not be larger than mean annual recharge, which is safeguard to keep steadygroundwater level continuously. The policy of high-efficiency, low poison and lowresidue should be carried out in application of pesticides (NBF).
It is suggested that World Bank providing special fund to make study on pesticidebehavior in soil and groundwater, this issue should be emphasized in future projectconstruction.
References1. Larry.W Canter, "Nitrate in Groundwater", 19972. Michael R. Barreett, "The environmental impact of pesticide degrades in
groundwater, In herbicide metabolites in surface water and groundwater", ACEsymposium 630,19953. Pesticides and their degradation products?4. Papers of Pesticide Environmental Chemistry Behavior, Mohong han, China
Science and Technology Publishing House,1994
Accessory
101