World Bank Document · chapter III, Equilibre economique general en 1968, pp. 10, 17, 19, 32,...
81
RESTRICTED FILE COPY Report No. AF- 39a This report was prepared for use within the Bank and its affiliated organizations. They do not accept responsibility for its accuracy or completeness. The report may not be published nor may it be quoted as representing their views. INTERNATIONAL BANK FOR RECONSTRUCTION AND DEVELOPMENT INTERNATIONAL DEVELOPMENT ASSOCIATION REVIEW OF 1965 - 1968 DEVELOPMENT PLAN TUNISIA VOLUME II Statistical Appendices to Main Report November 22, 1965 :rica Department Public Disclosure Authorized Public Disclosure Authorized Public Disclosure Authorized Public Disclosure Authorized Public Disclosure Authorized Public Disclosure Authorized Public Disclosure Authorized Public Disclosure Authorized
Transcript of World Bank Document · chapter III, Equilibre economique general en 1968, pp. 10, 17, 19, 32,...

RESTRICTED
FILE COPY Report No. AF- 39a
This report was prepared for use within the Bank and its affiliated organizations.They do not accept responsibility for its accuracy or completeness. The report maynot be published nor may it be quoted as representing their views.
INTERNATIONAL BANK FOR RECONSTRUCTION AND DEVELOPMENT
INTERNATIONAL DEVELOPMENT ASSOCIATION
REVIEW OF 1965 - 1968 DEVELOPMENT PLAN
TUNISIA
VOLUME II
Statistical Appendices
to Main Report
November 22, 1965
:rica Department
Pub
lic D
iscl
osur
e A
utho
rized
Pub
lic D
iscl
osur
e A
utho
rized
Pub
lic D
iscl
osur
e A
utho
rized
Pub
lic D
iscl
osur
e A
utho
rized
Pub
lic D
iscl
osur
e A
utho
rized
Pub
lic D
iscl
osur
e A
utho
rized
Pub
lic D
iscl
osur
e A
utho
rized
Pub
lic D
iscl
osur
e A
utho
rized

CURRENCY EQUIVALENTS
Prior to September 1964 U.S. $ a . 420 Dinara
Since September 1965 U. S. $ a . 525 Dinars

LIST OF T'BLES
1. Estimated contractual service payments on external medium and
long-term debt.
2. External imiedium and long-term public debt outstanding
3. Gross domestic product at marlcet prices (1960 Dinars).
4. Gross domestic product at market prices (current Dinars).
5. Gross domestic product at factor cost (old series).
6. Gross domestic product at fact-or cost by sector (1960 Dinars).
7. Gross doLimestic product at factor cost by sector (current Dinars).
8. Gross value added by sector, 1960-1964, planned and actual.
9. Volume and value indexes and per cent distribution of gross
domestic product at factor cost.
10. Total production - annual raies of growth.
11. Gross value added by sector - annual rates of growth.
12. Population, labor force and employment.
13. Civilia.-, employment by sector.
14. Employment according to employment surveys.
15. Domestic fixed capital formation by branch: Pre-plan projecl:ion
1962 - 1964 (net) and actual 1962 - 1964 (gross).
16. Domestic capital formation by branch: Actual 1960 - 1964 (gross)and Plan - 1968 (net).
17. Gross domestic capital formation by agent.
18. Domestic capital formation by branch: Pre-plan projection
1962-1964 (net), Actual 1962-1964 (gross), and Four-year Plan
projection 1965-1968 (net).
19. Financing of investment and of operations with the rest of
the world (current Dinars).
20. Financing of investment (1960 Dinars).
21. Gross domestic savings.
22. Internal savings effort.
23. Central Government Savings.

- 2 -
24. Central Government capital budget; financing of operations.
25. Central Government operating expenditures.
20. Central Government Direct and indirect Taxes.
27. Central Government Revenues.
28. Central Governmenit - Fiscal Burden.
29. Four Year Plan - Direct and I direct Taxes.
30. Central Government-Service of public debt.
31. Public enterprises - Fixed investment and its financing.
32. Four Year Plan - Savings.
33. Four Year Plan - Gross Domestic Product and Factor Shares.
34. Four Year Plan - Household Savings.
35. Four Year Plan - Savings of corporate enterprises.
36. Four Year Pian - Savings of Administration.
37. Banking System claims, money supply and net foreign assets
position.
38. Monetary Survey.
39. Banking System-Claims on Non-Governmental Sector (including
public enterprises).
40. Banking System Short-term Credits - Sectoral Distribution.
41. Banking System Medium and Long-term credits - sectoral
Distriuution.
42. Banking System-Net foreign Exchange position.
43. Cost of Living In,dex.
44. Implicit price indexes for expenditure out of gross domestic
product at market prices.
45. Implicit price indexes for gross domestic product at factor
cost by sector.
46. Balance of Payments.
47. Balance of Payments (net).
48. Factor and Non-factor Services.
-3-
49. Exports.
50. Imports.
51. Export Prices.
52. Direction of Trade.
53. External Aid - Disbursements during the pre-plan period and
commitments for the Four-year plan..
54. Imports and exports of goods - Trade and Balance of payments
data.
55. Goods and non-factor services imports and gross domestic
product.
56. Four-year Plan - Total Foreign Financing Requirement.
57. Four-Year Plan - New Debt to be Contracted.
58. Four-Year Plan - Service of New Debt to be Contracted.
59. Capit:al Service Ratio.
60. Forei3n Financing Requirement and IrTport Companont of Four YDar P'an.
61. Tunisia - Estimwated contractual service payments on External
medium and long-term public debt - detailed schedules.
62. Projected net capital formation in pre-plan, 1962-1964,
rearrangsed to fit national accounts cacegories.
63. Estitnated breakdown of net inves-ments in Four-year Plan, with
key to national accounts classification.
64. Estimated Breakdown of net investments in Four-year Plan
according to national accounts classification.
65. Public Enterprises - Receipts and expenditures.
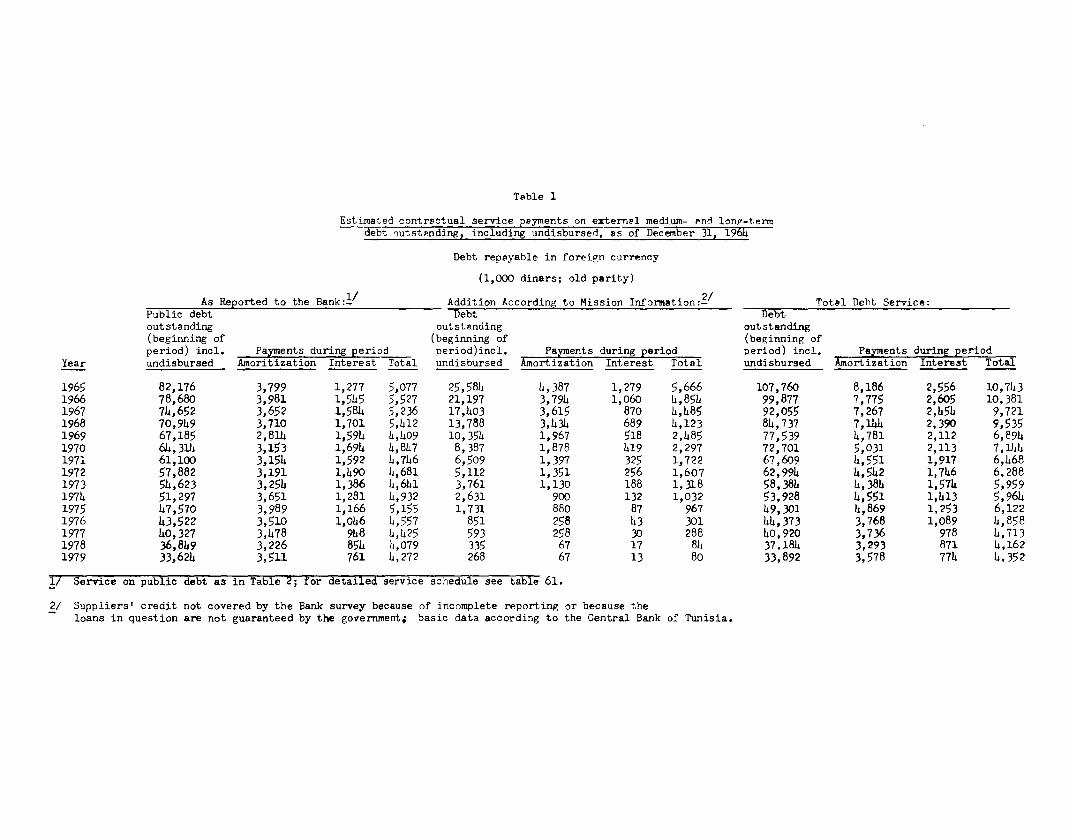
Table 1
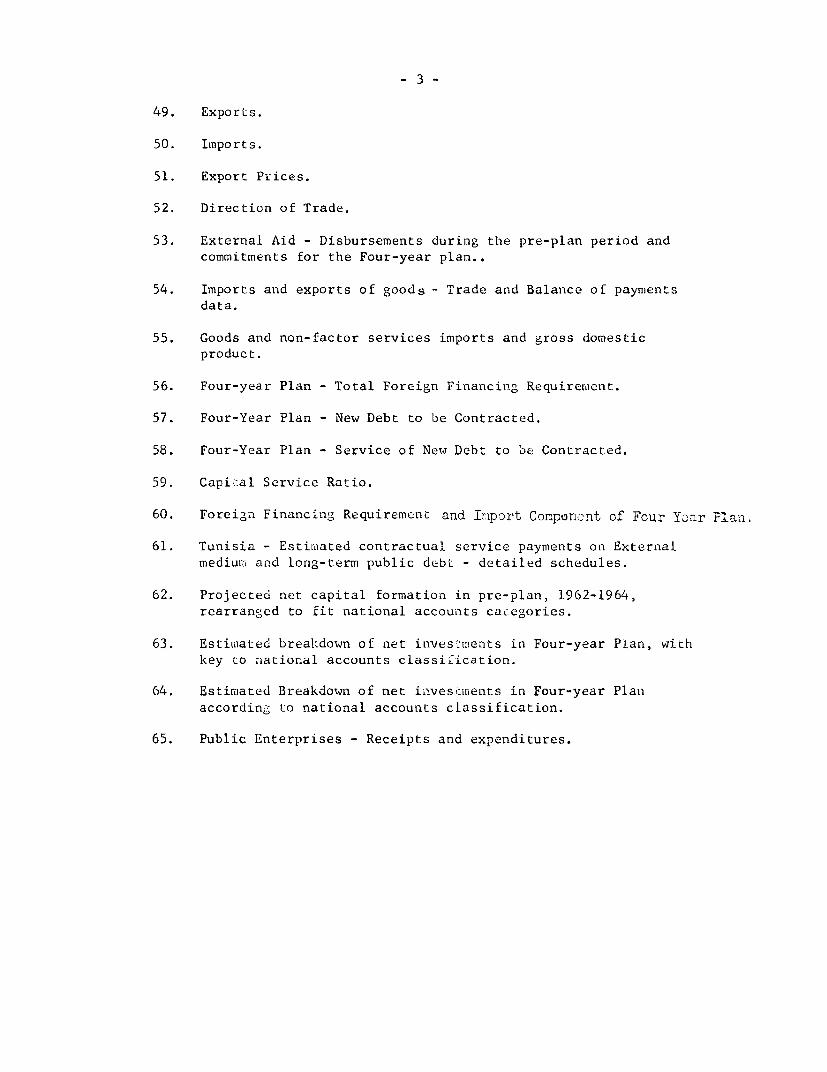
Estimated contractual service payments on externrl medium- Pnd loni-termdebt outstpnding, including undisbursed, as of December 31, 1964
Debt repayable in foreign currency
(1,000 dinars; old parity)
As Reported to the Bank:Y Addition According to Mission Information:i/ Total Debt Service:Public debt Debt Debtoutstanding outstanding outstanding(beginning of (beginning of (beginning ofperiod) incl. Payments during period period)incl. Payments during period period) incl. Payments during periodYear undisbursed Amoritization Interest Total undisbursed Amortization Interest Total undisbursed Amortization Interest Total1965 82,176 3,799 1,277 5,077 25,584 4,387 1,279 5,666 107,760 8,186 2,556 10,7431966 78,680 3,981 1,545 5,527 21,197 3,794 1,060 4,854 99,877 7,775 2,605 10,3811967 74,652 3,652 1,584 5,236 17,403 3,615 870 1,485 92,055 7,267 2,454 9,7211968 70,949 3,710 1,701 5,412 13,788 3,434 689 4,123 84,737 7,1U4 2,390 9,5351969 67,185 2,8 . 1,594 4,409 10,354 1,967 518 2,485 77,539 4,781 2,112 6,8941970 64,314 3,153 1,694 X,847 8,387 1,878 419 2,297 72,701 5,031 2,113 7,1141971 61,100 3,154 1,592 4,746 6,509 1,397 325 1,722 67,609 4,551 1,917 6,4681972 57,882 3,191 1,490 4,681 5,112 1,351 256 1,607 62,994 4,542 1,746 6,2881973 54,623 3,254 1,386 1,641 3,761 1,130 188 1,318 58,384 4,384 1,574 5,9591974 51,297 3,651 1,281 4,932 2,631 900 132 1,032 53,928 4,551 1,413 5,9641975 47,570 3,989 1,166 5,155 1,731 880 87 967 49,301 X,869 1,253 6,1221976 43,522 3,510 1,046 X,557 851 258 43 301 44,373 3,768 1,089 4,8581977 40,327 3,478 948 4,425 593 258 30 288 40,920 3,736 978 4,7131978 36,849 3,226 854 4,079 335 67 17 84 37,184 3,293 871 4,1621979 33,624 3,511 761 4,272 268 67 13 80 33,892 3,578 774 4,352
_/ Service on public debt as in Table 2; for detailed service schedule see table 61.
2/ Suppliers' credit not covered by the Bank survey because of incomplete reporting or because theloans in question are not guaranteed by the government; basic data according to the Central Bank of Tunisia.

Table 2
EXTERCAL MEDIUM AND LONG-TERM 1/PUBLIC DEBT OUTSTANDINGINCLUDING UNDISBURSED AS OF DECEMBER 31, 1964, WITH MAJOR REPORTED ADDITIONS
JANUARY 1 - JANUARY 31, 1965
Debt Repayable in Foreign Currency
(In thousands of U.S. dollar equivalents)
Debt outstanding Major reportedDecember 31. 196L additions
net of including January 1 -Item undisbursed undisbursed January 31, 1965
TOTAL EXTERNAL PUBLIC DEBT 125,393 204,125 800
Publicly-issued bonds 2,554 2,551 _
Privately-placed debt 214,963 32,632Suppliers' credits 7,796 7,796Other 17,167 24,836
IBRD loans - 7,000
IDA credits 1,591 5,000 _
Loans from Western governments 93,576 153,467 800France 51,587 60,366 -Germany 365 4,750Kuwait 18,670 28,000 -Sweden 53 1,160United States 22,901 59,191 800
Export-Import Bank 1,1491 4,091 -AID 21,1410 55,100 800
Loans from Sino-Soviet Bloc 2,709 3,474Poland d27 -27USSR 1,881 2,646
1/ Debt with an original or extended maturity of one year or more.
j Debt repayable in local currency amounted to $59,503,000 includingundisbursed, and to P34,76o,000 net of undisbursed as ofDecember 31, 1964.
Source: Statistics Division, IBRD - Economics Department

EXPENDITURE OUT OF GROSS DCIVIESTIC PRODUCT AT MARKET PRICES. 1960 1964 - 1968(in '000 of 1960 dinars)
1964 19681960 1961 1962 1963 Preliminary Plan
1. Private consumption 248,177 257,300 271,200 27h,800 ) 365 700 349,4o2. Public consumption 55,826 60,400 64,100 64,100 ) 9 101,8003. Gross domestic fixed capital formation 59,488 66,600 76,lcX 86,200 95Q000 110,0004. Changes in stocks -11,126 8,300 -6,300 -4,900 - -5. Net exports of goods and non-factor services -21,893 -36,300 -40,300 -37,600 -46,000 -212700
a. Exports (77,927) (72,700) (69,700) (73,5c00) (76,300)b. Less imports (-99,820) (-109,000) (-110,000) (-1ll,100) (-122,300)
6. Gross domestic product at market prices 3_0,472 356,300 364,800 382,600 414,700 5392500
Sources: 1960 - 1964: Service do la Comptabilite Nationale, Secretariat d'Etat au Plan et a 1'EconomieNationale, data available as of August 1965.
1968: S6cretariat d'Etat au Plan et a 1'Economie Naticnale, Plan Quadriennal 1965 - 1968,chapter III, Equilibre economique general en 1968, pp. 10, 17, 19, 32, tableaud'echange,s interindustriels 1968.

Table Li
EXPENDITURE OUT OF GROSS DOMESTIC PRODUCT AT MARKET PRICES, 1960 - 1964
(in 1000 of current dinars)
19641960 1961 1962 1963 Preliminary
1. Private consumption 248,177 260,346 279,840 290,348 ) 88,2
2. Public consumption 55,826 62,975 64,124 65,983 )3. Gross domestic fixed capital formation 59,488 68,308 76,112 88,557 102,400
4. Changes in stocks -11,126 8,154 -6,431 -5,415 -
5. Net exports of goods and non-factorservices -21,893 -35,939 -41,295 -38,701 -52,027
a. Expmrts (77,927) (72,239) (70,128) (76,494) (83,159)b. Less imports (-99,820) (-108,178) (-111,423) (-115,195) (-135,186)
6. Gross domestic product at market prices 330,472 363,844 372,35V 400,772 439,300
Source: 1960 - 1964: S6rvice de la Comptabilite Nationale, Secretariat d'Etat au Plan et a ltEconomie
Nationale, data available as of August 1965.

Table 5GROSS DOMESTIC PRODUCT AT FACTOR COST BY SCTn)R, 1950, 1955 - 1962, l964, 1971 (OLD SERIES)
(in million of 1957 dinars)
Pre-Plan PerspectivesSector
1950 1955 1956 1957 1958 1959 1960 1961 1962 1963 1964 1971Agriculture 60.2 54.1 75.4 68.4 90.6 77.4 84.6 57.5 79.0 100.0Mining 6.8 9.5 9.2 9.1 9.3 8.5 8.7 7.9 8.0 8.7Manufacturing
19.2 21.5 23.4 23.8 26.5 24.3 30.4 33.3 35.0 37.0Construction 12.3 12.2 9.6 7.1 9.3 lo.4 13.8 16.9 21.0 22.0Electricity, gas, water 2.3 3.7 3.8 4.o 3.9 4.o 4.4 4.5 4.7 5.0Transport, communication 13.8 17.0 17.1 17.4 17.7 17.9 19.6 19.3 20.0 21.0
Commerce, banking 41.6 42.0 47.7 43.2 46.5 hl.8 h9.2 53.0 54.0 59.0Other services (excluding government) 18.7 30.1 27.1 28.4 29.3 35.2 40.0 44.0 47.0 50.3Gross domestic production at factor cost 174.9 190.1 213.3 201.4 233.1 219.5 250.7 236.4 268.7 303.0 323.1 421.0Government employees 12.4 20.7 15.4 16.2 16.3 17.3 17.6 18.4 19.0 20.0 31.7 25.0Gross domestic product at factor cost 187.3 210.8 228.7 217.6 249.4 236.8 268.3 254.8 287.7 354.8 hL6.0Indirect taxes net of subsidies 16.9 22.4 20.0 20.8 20.1 21.4 21.8 24.6 27.0 30.0 32.0 40.0GDP at market prices 204.2 233.2 248.7 238.4 269.5 258.2 290.1 279.4 314.7 353.0 386.8 486.o
Sources: 1950, 1955, 1956: Perspectives dLcennales de d6veloppement, 1962 - 1971, p. 26, except for government employees.1957 - 1962: Annuaire Statistique de la Tunisie, 1961 et 1962, p. 229.1963: L'Economie de la Tunisie en ehiffres, 1963, p. 14.1964: Plan Priennal, 1962 - 194, pp. 20, 25, 27.1971: Perspectives dscennales de developpement, 1962 - 1971, pp. 55, 52, 63.
Note: The Servi-e de la Comptabilite Nationale de la Secr4tarie d'Etat au Plan et ia l'Economie Nationalehas prepared a new series of accounts starting in 1960 (Tables 3 and 4) which is not comparable tothis old series in 1957 prices.

Table 6
GROSS DOMESTIC PRODUCT AT FACITR COST BY SECTOR, 1960-1964-1968
(in '000 of 1960 dinars)
19-- 196dCode Branch 1960 1961 1962 1963 Preliminary Plan
00 Agriculture (includes rural households) 76,700 82,700 79,900 85,400 88,500 92,400 j19 Rural households (5,900) (6,200) (5,900) (5,900) (6,000) ..22 Electricity 2,700 2,700 2,800 3,200 3,500 6,90023 Water, other energy products 3,200 3,200 3,400 3,500 3,500 3,90010,21,31-37 Mining and manufacturing 38,900 44,600 40,800 42,800 49,200 86,90010 Agricultural industries, food processing 16,200 23,400 19,400 18,600 19,700 24,00021 Petroleum products - - - - 1,500 6,70031 Construction materials, ceramics, glass 3,400 3,200 3,600 3,600 4,300 5,10032 Extractive industries 6,300 6,000 5,300 6,400 7,000 10,90033 Mechanical and electrical industries 1,200 1,000 1,400 1,500 1,700 5,60034 Chemicals 1,000 1,100 800 1,000 1,100 9,80035 Textiles, clothing, leather 6,300 5,300 5,500 6,800 7,600 17,30036 Woodworking, furniture 2,000 2,300 2,100 2,000 2,900 2,70037 Paper, miscellaneous industries 2,500 2,300 2,700 2,900 3,400 4,80050 Buildings, public works 14,700 17,300 20,600 23,400 26,600 30,30060 Transportation, communications 19,100 20,300 23,200 26,200 29,600 33,90071 Rents 12,200 13,000 i4,200 15,000 15,600 18,50072 Services (other than government and domestics) 22,500 23,800 24,100 24,800 27,300 41,90079 Wholesale and retail trade 46,700 48,300 50,800 48,100 51,800 73,60081 Salaries of government employees 45,300 52,700 58,800 58,800 60,000 67,20082 Salaries of domestic servants 2,100 2,200 2,200 2,300 2,300 v
Gross domestic product at factor cost 284,100 310,800 320,800 333,500 357,900 455,500Indirect taxes net of subsidies 46,300 45,500 44,000 49,100 56,800 84,000
Gross domestic product at market prices 330,400 356,300 364,800 382,600 414,700 539,500
Notes: I/ Rural households apparently excluded in Plan projection.
2/ Probably overlooked, but may be ins72, Services (other than government and domestics).
.. Not available.
Sources: 1960-1964: Service de la ComptabilitiA Nationale, Secretariat d t Etat au Plan a 1'Economie Nationale, estimates as of August 1965.1968: Four-Year Plan, chapter III, Annex

Table 7
GROSS DOMESTIC PRODUCT AT FACTOR COST BY SECTOR, 1960 - 1964
(in '000 of current dinars)
PreliminaryCode Branch 1960 1961 1962 1963 1964
00 Agriculture (includes rural households) 76,730 85,352 81,383 90,593 92,90019 Rural households I (5,920) (6,155) (5,856) (5,937) (6,100)22 Electricity 2,684 2,846 3,134 3,374 3,60023 Water, other energy products 3,236 3,057 3,211 3,337 3,30010,21,31-37 Mining and manufacturing 38,784 45S199 42,503 45,631 53,60010 Agricultural industries, food processing 16,162 23,625 19,679 20,183 21,20021 Petroleum products 8 30 27 22 1,50031 Construction materials, ceramics, glass 3,348 3,244 3,715 3,778 4,60032 Extractive industries 6,258 5,900 5,256 5,876 6,90033 Mechanical and electrical industries 1,228 996 1,485 1,550 1,80034 Chemicals 993 1,168 787 997 1,20035 Textiles, clothing, leather 6,308 5,355 6,221 7,779 9,30036 Woodworking, furniture 1,983 2,600 2,339 2,203 3,30037 Paper, miscellaneous industries 2,496 2,641 2,994 3,243 3,80050 Buildings, public works 14,727 17,793 21,320 25,143 29,10060 Transportation, communications 19,136 20,879 24 #189 27,551 31,40071 Rents 12,215 12,980 14,,190 34,990 15,70072 Services (other than government and domestics) 22,504 24,S544 24j666 25,801 28,20079 Wholesale and retail trade 46,718 49,176 51,891 50,667 57,00081 Salaries of government employees 45,300 54,700 58,800 60,200 61,70082 Salaries of domestic servants 2,100 2,200 2,200 2,300 2,300
Gross domestic product at factor cost 284,134 319,086 327,487 349,587 378,800Indirect taxes net of subsidies 46,338 44,758 44,863 51,185 60,500
Gross domestic product at market prices 330,472 363,844 372,350 400s,772 439,300
Sources Service de la Comptabilit, Nationale, Secretariat d'Etat au Plan a 1'Economie Nationale, estimates as of August 1965.
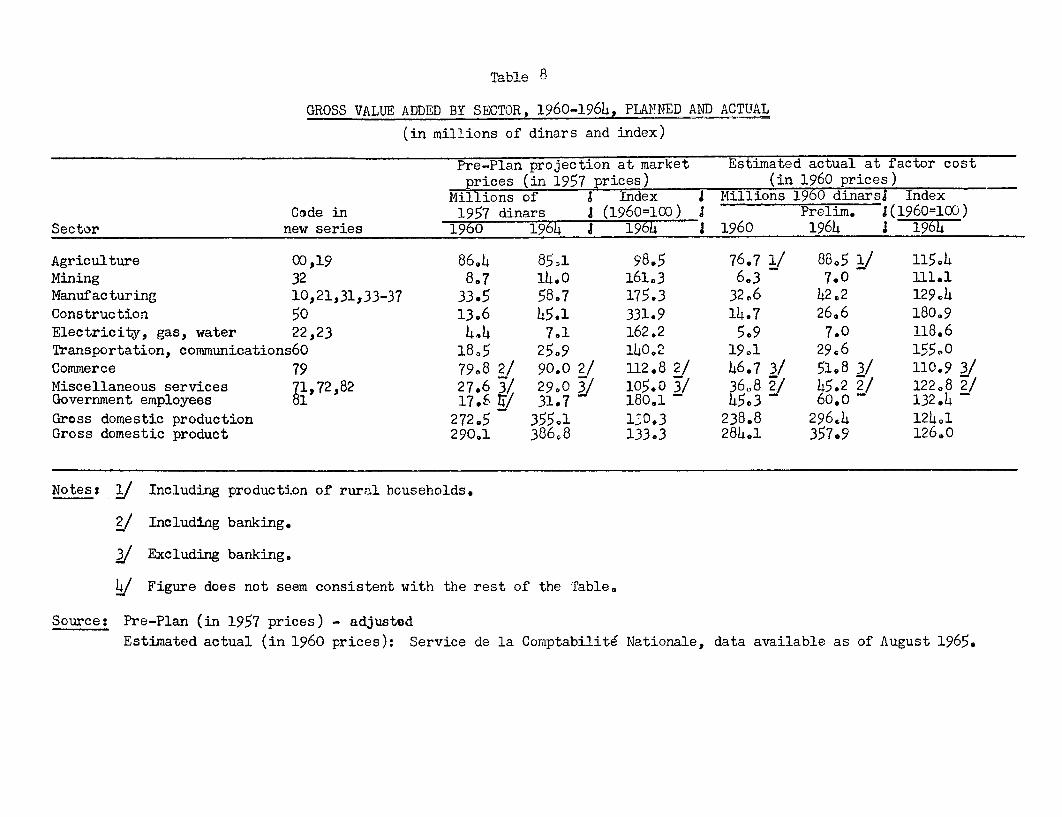
Table 8
GROSS VALUE ADDED BY SECTOR, 1960-1964, PLAMNED AND ACTUAL
(in millions of dinars and index)
Pre-Plan projection at market Estimated actual at factor costprices (in 1957 prices) (in 1960 prices)
Millions of I Index I Millions 1960 dinarsl IndexCode in 1957 dinars I (1960100) J Prelim. 1(1960=100)
Sector new series 1960 1964 J 1964 1 1960 1964 1 1964
Agriculture 00,19 86.4 85c1 98.5 76.7 1/ 88.5 1/ l15e4Mining 32 8.7 14h0 161.3 6.3 7.0 111.1Manufacturing 10,21,31,33-37 33.5 58.7 175.3 3206 42,2 129e4Construction 50 13.6 45.1 331.9 14.7 26.6 180.9Electricity, gas, water 22,23 4e4 7'1 162.2 5.9 7.0 118.6Transportation, communications60 18,5 25.9 140-. 19o1 29.6 155.0Commerce 79 79.8 2/ 90.0 2/ 112.8 :2 46.7 3/ 51.8 3/ 110.9 /Miscellaneous services 71,7282 27.6 3/ 29.0 / 105.0 3/ 3608 2/ 45.2 2/ 122.8 2/Government employees 81 17.- Ti 31.7 180.1 - 45.3 - 60.0 - 132.4Gross domestic production 272.5 355.1 130,3 238.8 296t4 124,1Gross domestic product 290.1 386,8 133e3 284.1 357.9 126.O
Notes: / Including production of rural households.
2/ Including banking.
31 Excluding banking.
4/ Figure does not seem consistent with the rest of the Table.
Source: Pre-Plan (in 1957 prices) - adjusted
Estimated actual (in 1960 prices): Service de la Comptabilitd Nationale, data available as of August 1965.

Table 9VOLUME AND VALUE INDEXES AND PERCENT DISTRIBUTION OF GROSS DOMESTIC PRODUCT AT FACTOR COST BY SECTJR, 1960, 1964, 1968 (NEW SERIES)
(index: 1960 - 100, and percent)
GDP at constant 1960 prices (1960M10) J GDP at current prices (1960-100) I GMP at constant 1960 prices jpercent)Code Branch
Preliminary 1964 Plan 1968 i Preliminary 1961 1 1960 Preliminary 1964 Plan 196800 Agriculture (includes rural households) 115.3 120.5 2/ 121.0 26.9 24,7 20.3 3/22 Electricity
129.6 255.6 134.1 1.0 1.0 1.523 Water, other energy products 109.4 121.9 102.0 1.1 1.0 0.810,21,31-37 Mining and manufacturing
126.5 223.4 138.2 13.7 13.7 19.110 Agricultural industries, food processing 121.6 148.2 131.2 5.7 5.5 5.321 Petroleum products 1/ xx xx xi - o.4 1.531 Construction materials, ceramics, glass 126.5 150.0 137.4 1.2 1.2 1.132 Extractive industries
111.1 173.0 110.3 2.2 2.0 2.433 Mechanical and electrical industries 141.7 466.7 146.6 0.4 0.5 1.23h Chemicals
110.0 980.0 120.9 0.4 0.3 2.235 Textiles, clothing, leather 120.6 274.6 147.4 2.2 2.1 3.836 Woodworking, furniture 1h5.0 135.0 166.4 0.7 0.8 o.637 Paper, miscellaneous industries 136.0 192.0 152.2 0.9 0.9 1.150 Buildings, public works 181.0 206.1 197.6 5.2 7.4 6.660 Transportation, communications 155.0 177.5 164.1 6.7 8.3 7.471 Rents
127.9 151.6 128.5 4.3 4.4 4.172 Services (other than government and domestics) 121.3 186.2 125.3 7.9 7.6 9.279 Wholesale and retail trade 110.9 157.6 122.0 16.4 14-5 16.281 Salaries of government employees 132.4 148.3 136.2 16.0 16.8 14.782 Salaries of domestic servants 109.5 109.5 0.7 o.6
Gross domestic product at factor cost 126.0 160.3 133.3 100.0 100.0 100.0Indirect taxes net of subsidies 122.7 181.4 130.6 xx xx xiGross domestic product at market prices 125.5 163.3 132.9 xx xi xi
Notes: 1/ Refinery introduced in 1964; 2/ 128.3 with allowance for rural households; 3/ 21.6, with allowance for rural households... Not available.
xx Not relevant.
Source: See Tables 6 and 7

Table 20
TOTAL PRODUCTION - AiNUAL RATES OF INCREASE (%)
GROSS DOMESTIC FRODUCT - MARKET PRICES
Constant Prices Current Prices(1960)
1960 - 1964 5.9 7.4
1961 - 1964 5.2 6.5
1962 - 1964 6.6 8.6
1963 - 1964 8,3 11.0
1964 - 1968 i/ 6.8
1960 - 1968 i/ 6.3
GROSS DOMESTIC FRODUCT - FACTOR COST
Constant Prices Current Prices(1960)
1960 - 1964 5.9 7,4
1961 - 1964 4.8 5.9
1962 - 1964 5.6 7.5
1963 - 1964 703 10.8
1964 - 1968 1/ 6.2
1960 - 1968 I/ 6.1
Notes: 1/ In accordance with Four-Year Planz the rates of GDP at market;prices- include an increase in indirect taxes faster Tnan the gr -wth of
productimn (see Table 6).
Szurce: Tables 3 and 6.
Table 11
AVERAGE ANNUAL PERCENT RATES OF GROWTH IN GROSS VALUE ADDED BY SECTOR
Average annual rate of growth (percent)1960 to J Preliminary 1964 to
Preliminary Plan I PlanCode Branch 1964 1968 1 1968
00 Agriculture (includes rural households) 3.7 2.4 1/ 1.1
19 Rural households 0.3 ..22 Electricity 6.7 12.5 18.523 Water, other energy products 2.3 2.5 2.71(,21,31-37 Mining and manufacturing 6.1 10.6 15.2
1( Agricultural industries, food processing 5.0 5.0 5.121 Petroleum products xx xx 47.5 2/31 Construction materials, ceramics, glass 6.1 5.2 4.4
32 Extractive industries 2.7 7.1 11.733 Mechancial and electrical industries / 9.1 21.0 34.531k Chemicals 2.5 33.0 73.0
35 Textiles, clothing, leather 4.8 13.5 22.436 Woodworking, furniture 9.8 4.8 1.73i' Paper, miscellaneous industries 8.0 8.5 9.0
5t) Buildings, public works 16.0 9.5 3.360 Transportation, communications 11.6 7.4 3.471 Rents 6.4 5.3 4.372 Services (other than government and domestics) 4.9 8.1 11.379 Wholesale and retail trade 2.6 5.9 9.281 Salaries of government employees 7.3 2.8 2.982 Salaries of domestic servants 2.3
(Gross domestic product at factor cost 5.9 6.1 6.2Indirect taxes net of subsidies 5.2 7.7 10.3
GIross domestic product at market prices 5.9 6.3 6.8
Notes: 1/ If a rough allowance is made for rural households, the Plan growth rate for 1964-68would be nearly 3% and 3.5% for 1960 - 68.
/ High figure may be due to inconsistency between estimates for 1964 and for Plan 1968,
/ Without the projected steel mill, this line wouldread: 9.1 18.1 27.7
O. Not available.
xx Refinery introduced in 1964. No crude oil production in 1960-1964.
Source: Derived from Table 6

Table 12
POPULATION, LABOR FORCE AND EMPLOYMENT 1960, 1964, 1968
(in '000 of persons)
Census Estim. Estim. Plan1956 1960 1964 1968
Population 3,943 .. 4,541 4,929 /Tunisian 3,602 . 4,386 4,802Foreign moslem 86 .. 100 100Foreign non-moslem 255 .. 55 22
Inactive population .. .. 3,156 3,459Labor force .. 1,385 1,470
Civilian employment .. 1,119 1,220 1,330Armed forces .. .. 25 30"Regional" works programs .. .. 20 20Unemployment (residual) .. .. 120 bJ 90
/ "Middle" hypothesis.
/ The "national" works programs provided an additional 90,000 full timeequivalent jobs in 1964, according to the Plan Quadriennal, chapter 1,
section 2, p. 1.Sources:
1960: Rapport sur les comptes economiques de la Nation pour l'annee 1960,tableaux annexes, pp. 42, 43.
1956, 1964, 1960c Plan Quadriennal, chapter 1, "La demographie etl'emploi", section 2, pp. 3, 6, 8, 9.
not available

Table 13
CIVILIAN EMPWLYENT BY SECTOR, 1960, 1964, 1968
(in tO0 of persons and per cent)
Estim. Estim. Plan Changes ('000) Per cent1960 1964 1968 1960 1964 1960 Estim. Estim. Planto to to
('000) ('ooo) ('o0) 1964 1968 1968 1960 1964 196800 Agriculture 647 680 699 33 19 52 57., 55.8 52.6Agriculture per se (635) ) (680) (699) (33) (19) (52)Wood, charcoal (12) )22, 23, 21 Electricity, water, petroleum 3 6 8 3 2 5 0.3 0.5 o.610, 31-37 Mining, manufacturing 128 181 229 53 48 101 11.4 14.8 17.110 Agricultural indastries, food processing, fishing 46 41 50 -5 9 4 4.1 3.4 3.831 Construction materials, ceramics, glass 10 8 11 -2 3 1 0.9 o.6 o.832 Extractive industries (incl. quarrying) 15 18 23 3 5 8 1.3 1.5 1.733 Mechanical and electrical industries 3 15 23 12 8 20 0.3 1.2 1.734 Chemicals 4 4 7 _ 3 3 o.4 0o3 o.535 Textiles, clothing, leather, footwear 34 76 88 42 12 54 3.0 6.2 6.6Textiles, clothing (30) (70) (80) (40) (10) (50)Leather, footwear (14) (6) (8) (2) (2) (4)36 Woodworking, furniture 6 6 8 2 2 o.5 o.5 o.637 Paper, printing, misc. industries 10 13 19 3 6 9 0.9 1.1 1.4Paper )(2) ((1) (2)) (1) (3) (14)Printing ) ((2) (14))Miscellaneous industries ( 8) (10) (13) ( 2) ( 3) ( 5)50 Buildings, public works a/ 60 85 94 25 9 34 5.4 7.0 7.160 Transport, communications 35 31 34 -4 3 -1 3.1 2.5 2.672 Services, banking, insurance (incl. domestics) 60 70 83 10 13 23 5.4 5.7 6.279 Wholesale and retail trade 100 87 90 -13 3 -10 8.9 7.1 6.881 Administration a/ 86 80 93 -6 13 7 7.7 6.6 7.0
TOTAL 1,119 1,220 1,330 101 110 211 100.0 100.0 100.0
a/ Does not include part time jobs provided under the unemployment works program. These amounted to 190,000 in 1960, and 200,000 in 1964.Sour^es:
1960: Rapport sur les comptes economigues de la Nation pour l'annee 1960, tableaux annexes, pp. 42, 43.1964, 1968: Plan Quadriennial, chapter 1, "La demographie et ltemploi", sect. 2, p. 8.

Table 14
EMlPLOYMENT IN 1963 AND 1964 ACCORDING TO EMPLOYMENT SURVEYS
(in '000 of persons)
1963 19614
Covered in employment surveys 285 295Agriculture, fishing 2/ 29 27Mining 14 15Manufacturing 68 72Buildings and public works 14 17Electricity, gas, water 3 3Commerce, banking, insurance 99 101Transport and comnunications 22 22Services 35 38
Not covered in employment surveys 925Agriculture 6 0Public administration 80Domestic service 30Artisans 135Manufacturing (textiles) (.) (65)Building and public works ( ) (60)
TOTAL .. 220
/ Employment in cooperatives and in establishments connectedwith agriculture (eg. harvesting).
Source: Bulletin mensuel statistique, June 1965, p.1.
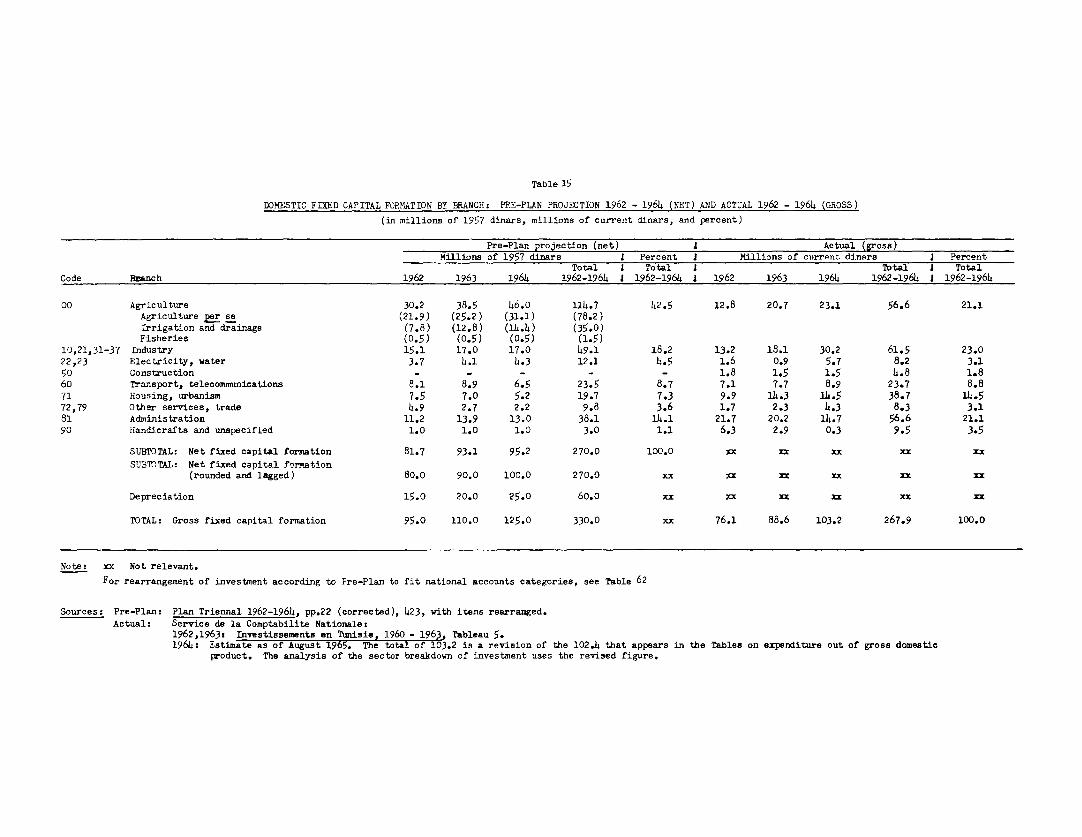
Table 15
DOMESTIC FIXED CAPITAL FORMATION BY BRANCH: PRE-PLAN PROJECTION 1962 - 1964 (NET) AND ACTUAL 1962 - 1964 (GROSS)(in millions of 1957 dinars, millions of current dinars, and percent)
Pre-Plan projection (net) J Actual (gross)Millions of 1957 dinars 1 Percent I Millions of culrrent dinars J PercentTotal I Total J Total I TotalCode Branch 1962 1963 1964 1962-1964 1 1962-1964 1 1962 1963 1964 1962-1964 1 1962-1964
00 Agriculture 30.2 38.5 46.0 114.7 42.5 12.8 20.7 23.1 56.6 21.1Agriculture per se (21.9) (25.2) (31.1) (78.2)Irrigation and drainage (7.8) (12.8) (1h.4) (35.0)Fisheries (0.5) (0.5) (O.5) (1.5)10,21,31-37 Industry 15.1 17.0 17.0 49.1 18.2 13.2 18.1 30.2 61.5 23.022,23 Electricity, water 3.7 4.1 h.3 12.1 14.5 1.6 0.9 5.7 8.2 3.150 Construction - - - - - 1.8 1.5 1.5 4.8 1.860 Transport, telecommunications 8.1 8.9 6.5 23.5 8.7 7.1 7.7 8.9 23.7 8.871 Housing, urbanism 7.5 7.0 5.2 19.7 7.3 9.9 14.3 14.5 38.7 14.572,79 Other services, trade 4.9 2.7 2.2 9.8 3.6 1.7 2.3 4.3 8.3 3.181 Administration 11.2 13.9 13.0 38.1 14.1 21.7 20.2 14.7 56.6 21.190 Handicrafts and unspecified 1.0 1.0 1.0 3.0 1.1 6.3 2.9 0.3 9.5 3-5
SUBTOTAL: Net fixed capital formation 81.7 93.1 95.2 270.0 100.0 xx xx xx xx xxSUBTOTAL: Net fixed capital formation(rounded and lagged) 80.0 90.0 100.0 270.0 xx xx xx xx xx xx
Depreciation 15.0 20.0 25.0 60.0 xx xx xx xx xx xxTOTAL: Gross fixed capital formation 95.0 110.0 125.0 330.0 xx 76.1 88.6 103.2 267.9 100.0
Note: xx Not relevant.
For rearrangement of investment according to Pre-Plan to fit national accounts categories, see Table 62
Sources: Pre-Plan: Plan Triennal 1962-1964, pp. 2 2(corrected), 423, with items rearranged.
Actuals Service de la Comptabilite Nationale:1962,1963: Investissements en Tunisie, 1960 - 1963. Tableau 5.1964: Estimate as of August 1965. The total Of 103.2 is a revision of the 102.4 that appears in the Tables on expenditure out of gross domesticproduct. The analysis of the sector breakdown of investment uses the revised figure.

TabUle 16
DOMFSTIC CAPITAL FORMATION BY BRANCH OF INSTALLATION: ACTUAL 1960 - 1964 (GROSS) PLAN - 1968 (NET)
(in '000 or current dinars)
Gross fixed capital formation by branch J Net fixed capital formation by branch - PlanCode Branch 1960 1961 1962 1963 196h 1 4 years 1965-196d i/
00 Agriculture 11,148 12,033 12,821 20,710 23,100 150,50022 Electricity, nuclear energy ) - - 1,584 863 5,700 21,00023 Water, miscellaneous energy products 8,ooo10,21,31-37 Mining and manufacturing 4,440 9,367 13,212 18,091 30,200 112,00010 Agricultural industries, foodprocessing 303 4,296 1,466 1,984 1,000
4 ,10021 Petroleum products 2,000 2,000 4,806 6,221 5,300 19,50031 Construction materials, ceramics, glass 137 114 467 1,681 2,000 3,00032 Extractive materials 760 916 727 1,988 2,400 16,50033 Mechanical and electrical industries 163 113 516 1,303 12,200 11,90034 Chemicals 237 573 572 2,013 3,60o 25,20035 Textiles, clothing, leather 565 1,111 732 1,315 3,500 20,20036 Woodworking, furniture 27 15 169 118 100 11,60037 Paper, miscellaneous industries 248 229 3,757 1,468 100 )50 Buildings, public works 1,516 671 1,788 1,530 1,500 _60 Transport, communications 14,607 7,003 7,143 7,660 8,900 55,00071 Housing 5,615 9,240 9,877 14,296 14 ,500 16,80072 Services (other than government anddomestics) 812 1,123 1,726 2,264 3,400 19,10079 Wholesale and retail trade - - - - 900 -81 Administration 15,499 17,112 21,667 20,231 14,700 67,60090 Unspecified 5,851 11,759 6,294 2,912 300 5,000 i/
Net fixed capital formation xx xx xx xx xx 455,000Depreciation xx xx xx xx xx
Gross domestic fixed capital formation 59,488 68,308 76,112 88,557 103,200
Notes: j In 1965 prices; according to later information supplied to the Mission, there have been some changes in the planned investmentin mining and manufacturin& and tourism services; see "Industry" section in "Investment Program".2/ Handicraf ts .
xx Not relevant... Not available.
For rearrangement of investment according to Four-Year Plan to fit the national accounts categories, see Table
Sources: Service de la Comptabilite Nationale:
1960-1963: Investissements en Tunisie 1960 - 1963, Tableau 5.1964: Estimate as of August 1965.
Secretariat d'Etat au Plan et aux Finances:
1965-1968t (4 year period): Note relative au Plan Quadriennal, pp.3-5, with petroleum products shifted from "energy" to "industry."Note: For rearrangement of investment according to the Four Year Plan to fit the national accounts categories, see Tables 63 and 64.

Table 17
GROSS DOMESTIC CAPITAT FORMATION BY AGENTS 1960 - 1964 (GROSS) 1968 (NET)
(in millions of current dinar-s and percent)
Preliminary rIan
196D 1961 1962 1963 1964 1965 - 1968 1/
A. Millions of dinars:Administration 29.3 29.1 35.3 38.3 4005 167Enterprises and households 30.2 39c2 40.8 50,3 62.7 288
Public 30153 7 ( ) 2$<3Private 20.9 18.9 142 10.7 ) 22.0 ) ( 25
Households 4.0 5.0 7.0 9.2 ) )25
TOTAL 59°5 68.3 76.e 88o 10332 455
B. Percent:Administration 49 43 46 43 39 37Enterprises and households gT 37 T T 6 3
Public 58 22 2 74 .Private 35 28 19 12) 2 58Households 7 7 9 11) 21 )5
TOTAL 100 100 100 100 100 100
Note: 1/ In 1965 prices.
Sources: 1960-1964: Service de la Comptabilite Nationale.1968: Four-Year Plan, Vol. 1, chapter III, p. 430
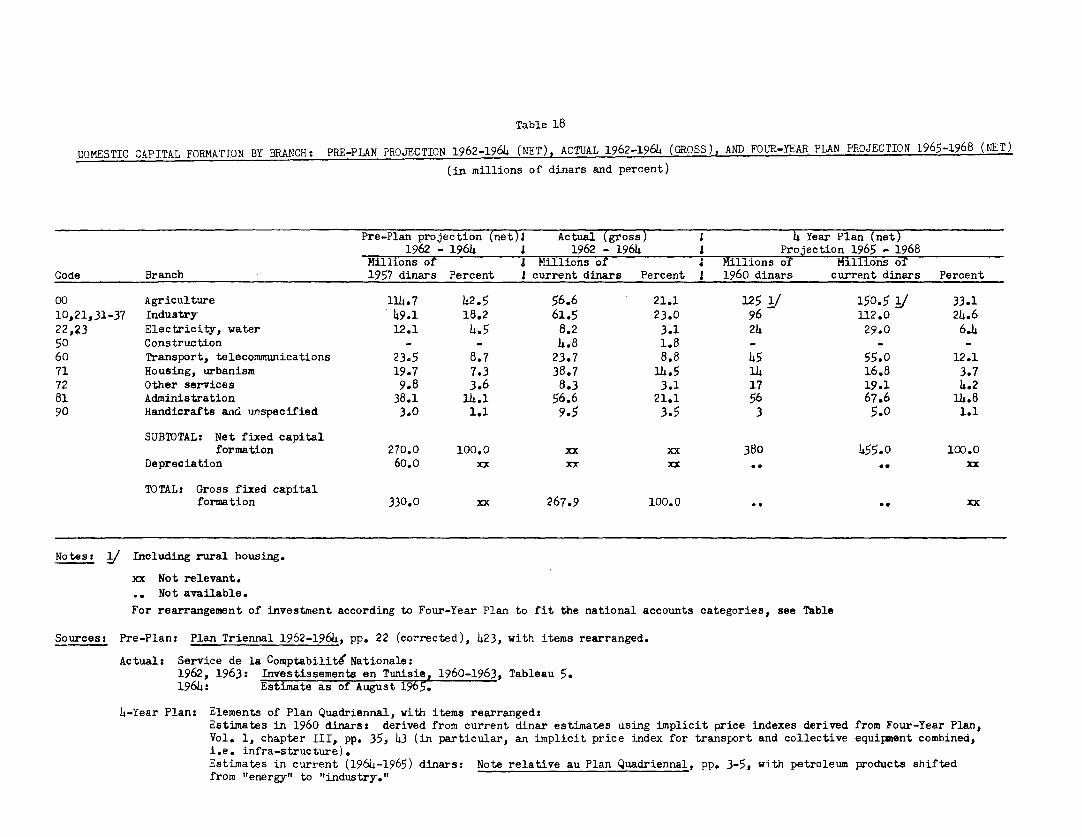
Table 18
DOMESTIC CAPITAL FORMATION BY BRANCH: PRE-PLAN PROJECTION 1962-1964 (NET), ACTUAL 1962-1964 (GROSS), AND FOUP-YEAR PLAN PFOJECTION 1965-1968 (NET)(in millions of dinars and percent)
Pre-Plan projection (net)J Actual (gross) 1 4 Year Plan (net)1962 - 19 64 A 1962 - 1964 £ Projection 1965 - 1968Millions of J Millions of I Millions of Millions ofCode Branch - 1957 dinars Percent J current dinars Percent A 1960 dinars current dinars Percent00 Agriculture 114.7 42.5 56.6 21.1 125 1/ 150.5 / 33.110,21,31-37 Industry 49.1 18.2 61.5 23.0 96 112.0 24.622,?3 Electricity, water 12.1 4.5 8.2 3.1 24 29.0 6.450 Construction - - 4.8 1.8 - -60 Transport, telecommunications 23.5 8.7 23.7 8.8 45 55.0 12.171 Housing, urbanism 19.7 7.3 38.7 14.5 14 16.8 3.772 Other services 9.8 3.6 8.3 3.1 17 19.1 4.281 Administration 38.1 14.1 56.6 21.1 56 67.6 14.890 Handicrafts andc unspecified 3.0 1.1 9.5 3.5 3 5.0 1.1
SUBTOTAL: Net fixed capitalformation 270.0 100.0 xx xx 380 455.0 100.0Depreciation 60.0 xx xx xx .. .. xx
TOTALs Gross fixed capitalformation 330.0 xx 267.9 100.0 .. .. xx
Notes: / Including rural housing.
xx Not relevant.INot available.
For rearrangement of investment according to Four-Year Plan to fit the national accounts categories, see TableSources: Pre-Plan: Plan Triennal 1962-1964, pp. 22 (corrected), 423, with items rearranged.
Actual: Service de la Comptabilit4 Nationale:1962, 1963: Investissements en Tunisie, 1960-1963, Tableau 5.1964s: Estimate as of August 1965.
4-Year Plan: Elements of Plan Quadriennal, with items rearrangedtEstimates in 1960 dinarss derived from current dinar estimates using implicit price indexes derived from Four-Year Plan,Vol. 1, chapter III, pp. 35, 43 (in particular, an implicit price index for transport and collective equipment combined,i.e. infra-structure).Estimates in current (1964-1965) dinars: Note relative au Plan Quadriennal, pp. 3-5, with petroleum products shiftedfrom "energy" to "industry."

Table 15
Financing of Investment and of Operations with the Rest of the World
millions of dinars - current prices1960 1961 1962 1963 1964
Gross domestic investment:
(a) gross fixed capitalformation 59.5 68.3 76.1 88.6 102.4
(b) changes in inventories -11.1 +8.2 -6.4 -5.4 -
(6) total 48.4 76.5 69.7 83.1 102.4
Financed by:
(a) gross domestic sAving 26.6 40.5 28.4 44.4 50.4
(b) net absorption ofresources from restof world (goods andnon-factor services) 21.9 35.9 41.3 38.7 52.0
(e) total 48.5 76.4 69.7 83.1 102.4
Financing of operations withrest of world:
(a) net absorption ofresources from rest ofworld (goods and non-factor services) 21.9 35.9 41.3 38.7 52.0
(b) net payment of factorservices -1.7 +0.6 +3.1 +6.1 7.5
1. investment income -1.0 -1.0 -0.8 +0.7 +1.9
2. other services -0.7 +1.6 +3.9 +5.4 +5.6
(c) total 20.2 36.5 44,4 44.8 59.5
Supplied by (net):
(a) transfers 12.8 22.6 13.1 17.1 10.5
1. current -3.2 +3.6 +2.4 -0.6 +1.8
2. capital 16.0 +19.0 10.7 17.7 8.7
(b) long term loans(more t,han a year) 6.1 5.6 14.8 22.3 39.0
1. public 0 +1.9 +10.2 +9.5 +29.8
2. private +6.1 +3.7 + 4.6 +12.8 +9.2
(c) short term loans, com-pensatory financing(IMF) and use ofreserves +1.3 +8.3 +16.2 + 5.4 +10.0
(d) total +20.2 +36.5 +44.4 +44.8 +59.5
Sources: Inves;tment - Table 4'inancing of operations with rest of world -"Le Compte ixterieur1960-1963" - Secretaire d'Etat au Plan et a l'Economie Nationale
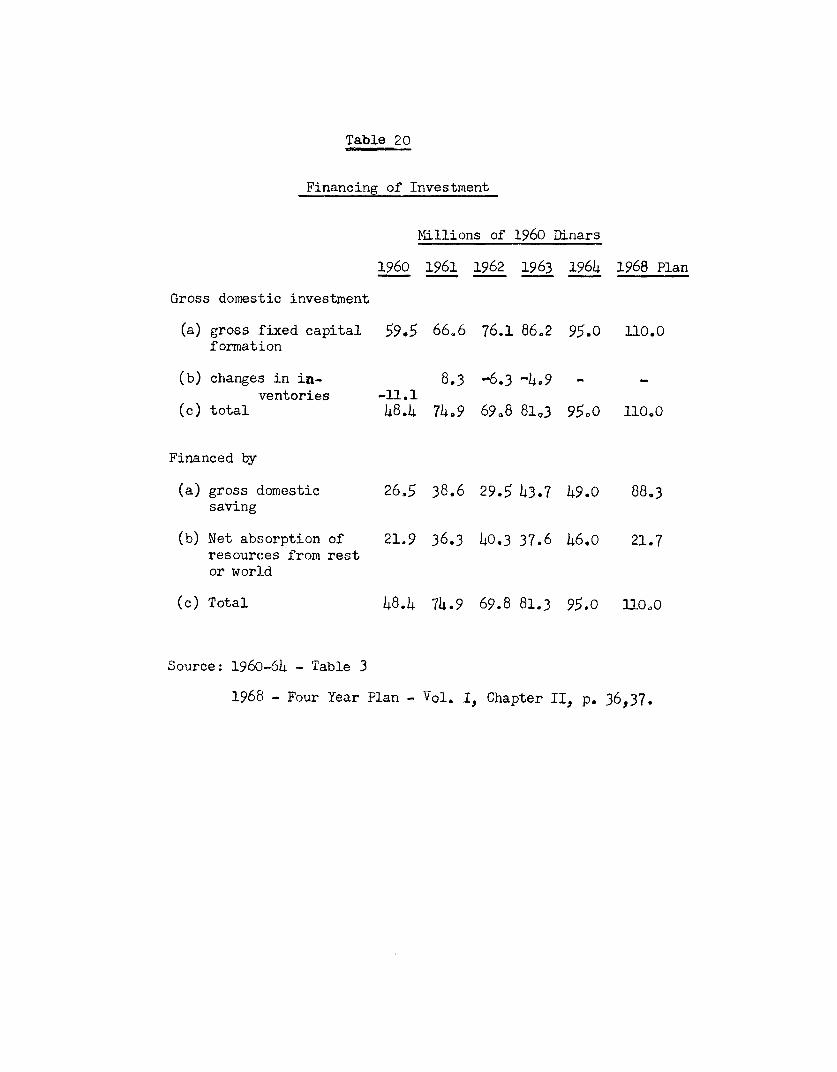
Table 20
Financing of Investment
Millions of 1960 Dinars
1960 1961 1962 1963 1964 1968 Plan
Gross domestic investment
(a) gross fixed capital 59.5 66.6 76.1 86.2 95.0 110.0formation
(b) changes in irn- 8.3 -6.3 -4.9 - _ventories -11.1
(c) total 48.4 74.9 69.8 81,3 95.0 110.0
Financed by
(a) gross domestic 26.5 38.6 29.5 43.7 49.0 88.3saving
(b) Net absorption of 21.9 36.3 40.3 37.6 46.0 21.7resources from restor world
(c) Total 48.4 74.9 69.8 81.3 95.0 llOoO
Source: 1960-64 - Table 3
1968 - Four Year Plan - Vol. II Chapter II, p. 36,37.

Table 21
Gross Domestic Savings
Gross domestic Savings Distribution according toTotal sectors - Current prices
Non-Central Government
Year Current 1960 CentralPrices Prices Govern. Total Public Non Public
Enterprises Enterp.(a)
(1) (2) (3) (4)=(1-3) (5) (6)=(4-5)
1960 26.6 26.6 13.6 13.0 3.7 9.3
1961 40.5 38.6 8.2 32.3 5.5 26.8
1962 28.4 29.5 6.6 21.8 6.o 15.8
1963 44.4 43.7 12.3 32.1 11.5 20.6
1964-I 50.4 49.0 16.1 34.3 12.0 22.3
1964-II 50.4 49.0 16.1 34.3 15.0 19.3
1968 O... 88.3 (b) 32.6 (b) ....
Sources - (1) - Table 19(2) - Table 0o(3) - Table 23.(5) - Table 31
Notes -(a) - Mainly private enterprises and households
(b) - Four Year Plan objective - 1960 prices

TABLE 22
Internal Savings sLffort
a) average rate of savings (%)
Year data in current data in constantprices prices (1960)
1960 8.0 8.0
1961 111 10.8
1962 7.6 8.1
1963 11.1 11e4
1964 11.5 11.8
b) margina4 savings rate (%)
Period data in current data in constantprices prices (1960)
1960-1964 21.9 26.8
Average1960-1961/ 18 7 25.1Average 1.2L963-1964
(1) Gross domestic savings calculated in relation to grossdomestic product - market prices.Source: Tables 3 and 4.

Table ?3
Central Government Savings
Millions of dinars 1968Plan7RZ Current1960 1961 1962 1963 1964 PiIces Prices (b)
Current receipts (I) 73.1 71.8 71.8 77.5 89.9 132.0 .....Direct and indirect taxes 67.2 65.7 62.3 68.7 80.0 121.4Direct taxes 18.0 18.3 15.3 15.9 17.9 32.3Indirect taxes 49.2 47.4 47.0 52.8 62.1 89.1 ...Other current receipts 5.9 6.1 9.5 8.8 9.9 10.6Royalties from pipeline 0.2 o.4 1.5 2.2 2.4 5.0Receipts from social - - o.5 0.6 o.8 ....security
Sundry items 5.7 5.7 7.5 6.0 6.7 .... .0...Current expenditures (II) 59.5 63.6 65.2 65.2 73.8 99.4 107.6Operating expenditures 52.2 54.1 55.4 58.8 67.4 92.4 100.1Budget - Title I (a) 42.2 44.6 46.7 49.4 57.2 82.1 (d) 89.1Other governmental accounts 10.0 9.5 8.7 9.4 10.2 10.3 11.oSubsidies to enterprises - 3.9 3.6 3.6 2.1 2.1 (c) 7.0 7.5operation
Sub-total 56.1 57.7 59.0 60.9 69.5 99.4 107.6"Fight against underdevelop-ment program" (LCSD) 3.4 5.9 6.2 4.3 *4.3Governmental Saving-excluding
service of public debt(III-n-II) 13.6 8.2 6.6 12.3 16.i 32.6
Service of public debt (IV) (e) 5.1 6.6 5.3 8.2 7.9 9.2 .Governmental Saving - includingservices of public debt
(V-III_IV) 8.5 1.6 1.3 4.1 8.2 23.4 ......->estiimate(a) does :-±ot include the Annex budgets covering the Postal and Telegraph System (P.T.T.) and the Radio ndTelevision of Tunisia ( R.T.T.), includes, however, the deficit of the R.T.T.

(b) current prices of early 1965; the item "operating expenditures - budget Title I was obtained directlyfrom the Four-Year Plan, as indicated in Table 25 ; the other items were adjusted on the basis ofinformation in the Plan - Vol. I - Chapter III, p.12
(c) isolated from the two items in "operating expenditures" on the basis of the proportion prevailingin 1964.
(d) See Table 25
(e) See Table 30
Source of basic information - Secretariat d'Etat au Plan et a l'Econamie Nationale.Plan estimates for 196. - Vol. Is Chapter III, pp.11, 12, 13 and Annex Tables.

Table 24
Central GovernmentCapital Budget;financing of operations
1968millions of dinars 1960 Prices
1960 1961 1962 1963 1964 Plan
Capital Budget
Capital Expenditures 27.4 24.8 27.8 35.8 35.0 39.0excluding "Fight againstunderdevelopment pro-gramt"(LCSD) 23.1 17.6 20.3 29.3 28.5Fight against under-development program"
(LCSD) 4.3 7.2 7.5 6.5 6.5Subsidies to enterprises-
investment 1.9 4.4 4.0 9.8 7.0 9.0Sub-total 29.3 29.2 31.8 45.6 42.0 48.o
Other operations inclu-ded in capital budget 1,6 2.0 1.4 2.9 1.1 -
Total 30.9 31.2 33.2 48.5 43.1 48.0
Financing of CentralGovernment operations 30.9 31.2 33.2 48.5 43.1 43.0
Governmental saving(including service ofpublic debt) 8.5 1.6 1.3 4.1 8.2 23.4
External sources 10.1 9.1 16.2 20.1 15.6 )grants 10.1 9.1 4.0 7.8 6.2 )loans - --- 12.2 12.3 9.4 )
long and med.term --- --- 8.0 10.3 9.4 )short term -- --- 4.2 2.0 --- )
Internal sources 12.3 20.5 15.7 24.3 19.3 )Banking system 1.7 6.0 8.2 23.3 9.3 )
Central Bank (a) 0.1 4.0 4.9 13.7 7.8 ) 26.6Banks (bonds) 1.6 2.0 3.3 9.6 1.5 )
Other short term Bans 1.3 0.1 1.1 ---- )Compulsory loans - )medium term --- -- ---- 5.4 )
"Correspondents"t of )Treasury (b) 8.5 11.8 6.3 1.4 7.2 )
Change in cash posi- )tion +0.8 +2.6 +o.1 -o.4 -2.6 )
(a) includes only changes in Postal Checking Account and medium term advances
(b) miscellaneous accounts of the Postal Checking System, Saving Funds,other government bodies, including public sector enterprises, andpaying and collector agents of the Gentral Government.
Source of basic information - Secretariat d'Etat au Plan et. a ltEconomieNationale. Four Year Plan, Vol Is Chap. III p.p. 15.

Tabl 25
Secrotaries of Stat.
I.. National Asembly 0.2 0.2 0.2 0.2 0.32. Foreign AffaSr 1.2 1.3 1.5 1.8 2.53. lational Defence 4.8 4.8 4.3 4.3 4.51L. Justice LS 1.5 1.4 L5 1.95. Interior 6.4 6.k 6.3 6.9 8.06. houuing and oentruction (a) 4.1 4.5 4.5 4.8 6.0
7 . Prelaid.ry of Republic 1.3 1.6 2.7 14.7 3.33. Inforuation and Tourism 0.5 0.7 0.9 0.69. Cultural Affairs --- - 1.0 1.4
10. Youth, Sport & Social Affair -- - 5.5Sub-total 7 to 10 1.8 2.3 3.6 5.7 10.8
U. Public Heath and Social Affairs 6.8 7.1 7.1 8.0 U.0Sub-total 7 to U 8.6 10.7 I 21.8
12. Plan and National Econmy (Financo)(b)l2.9 11.1 8.7 11.4 18.0Lime a. Subsidies to entorprices -
operation -1.0 -1.2 -1.2 -1.6 -5.7 (a)b. Subsidias to enterprises -
lnvestment -0.2 -0.2 -0.2 -0.2 -0.2c. Debt service( sodium ad long
term) -6.6 -5.3 -4.0 -5.8 --12.a Sub-total 12 LOeU aob,* 4.4 4.4 3.3 3.8 13.113. Agriculture 2.8 3.1 3.5 14.1 --
Sub-total 12.a plus 13 7 7.9 5 6.4 79 1114. blucatiorn IIi "7 *TM 1
Total 46.14 148.14 50.4 58.3 89.1
1kote - The diacrspencies betVuen ths totalo of tlis table ad for "operatingexpnditures"-Budget-Title 1 - in table do not pzvevt this table beingconsidered a satisfactory prssstation of their brsakdow. Due to changesin administrative orgnisation durlng the peotod, the Uidsrlizad sub-totalstry to group the agncies involved so as to obtain a reasonablj consiatentsereis over the period.
(0) Includes one-third of the expinditm. of the Secretwy of Todustry andComrce, extduuished in 1961; (b) includes the rsLaiming tW-thirds.
(c) Psa of total subsidies of 7 millo dinars, llocat" to the Budget-Title I,according to the proportion which prevailed in 19614.
Source of bi-aic infonuton - 3ecretariat d'Ftat au rlan et a 1'Zioonomic Niationale.Plan estimate - Four-Year Plan, Vol. I, Chapt. 114 &Ax V.

Table >6
Central Government
Direct and indirect TaxesMillion Dinars
Year Total Indirect Indirect Sub- Central GovernmentDirect & Taxes less Taxes of sidiesIndirect subsidies Local Total Indirect Indirect Total Direct DirectTaxes of (including authori- Indirect Taxes in Taxes in Direct Taxes in Taxes inCentral local au- ties Taxes Budget - Other Taxes Budget - OtherGovernment thorities) Title I Government Title I Government
Accounts Accounts
(a) (b) (c) (d) (e)-(b-c+d) (f) (g)-(e-f) (h)-(a_0) (i) (j)-(h-i)
1960 67,2 46,3 1,0 3,9 49,2 44.,6 4,6 18,0 11,1 6,9
1961 65,7 44,8 1,0 3,6 47.4 42,4 5,0 18,3 12,4 5,9
1962 62,3 44,9 1,5 3,6 47,0 42,7 5,7 15s3 10,0 5,3
1963 68,7 51,2 0,5 2,1 52,8 47,6 5,2 15,9 11,6 4,3
196L 80,0 60,5 (k) 0,5 2,1 62,1 55,1 7,0 17,9 13,3 4,6
(a),(d),(f) and (i) - Secretaire d'Etat au Plan et A lEconomie Nationale - 'Budget Consolid4'.
(b) - Table 7
(c) - Secretaire d'Etat au Plan et a lEconomie Nationale - 'Analyse des Finances des Administrations TunisiennesPour la periode 1960 A 1963'.
(k) - estimate
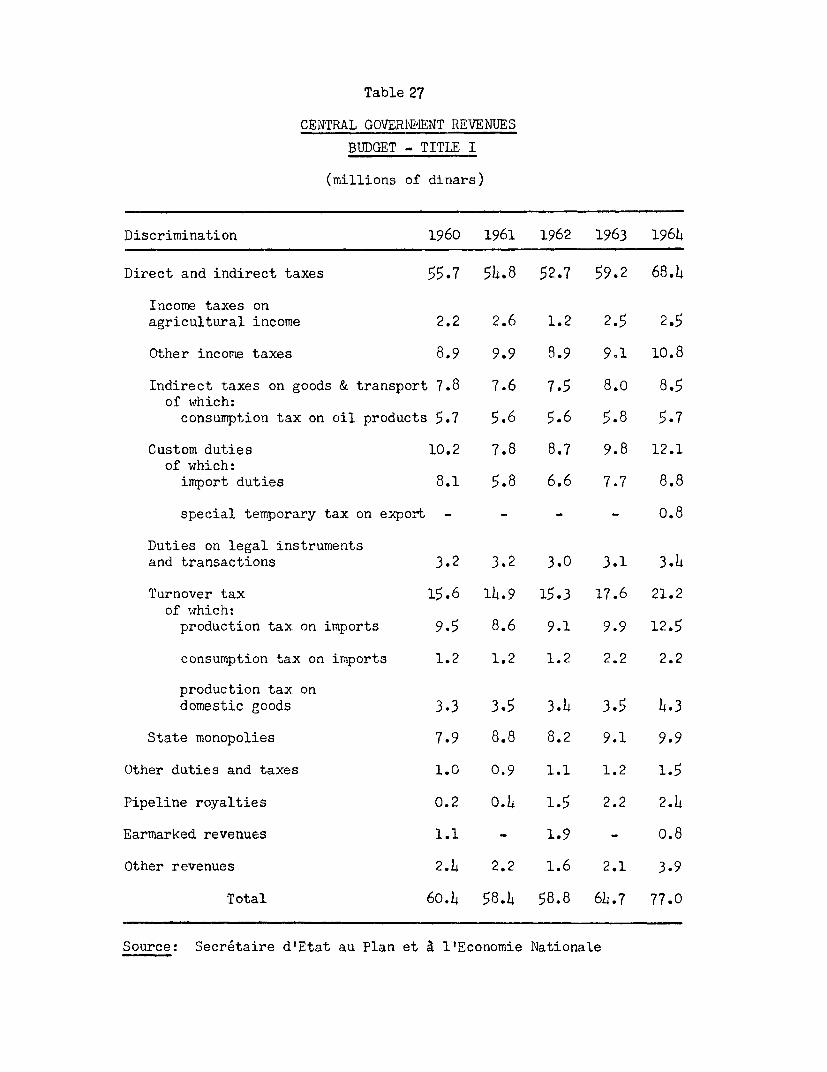
Table 27
CENTRAL GOVERNNENT REVENUES
BUDGET - TITLE I
(millions of dinars)
Discrimination 1960 1961 1962 1963 1964
Direct and indirect taxes 55.7 5h.8 52.7 59.2 68.4
Income taxes onagricultural income 2.2 2.6 1.2 2.5 2.5
Other income taxes 8.9 9.9 8.9 9Al 10.8
Indirect taxes on goods & transport 7.8 7.6 7.5 8.o 8.5
of which:consumption tax on oil products 5.7 5.6 5.6 5.8 5.7
Custom duties 10.2 7.8 8.7 9.8 12.1
of which:import duties 8.1 5.8 6.6 7.7 8.8
special temporary tax on export - - - - 0.8
Duties on legal instrumentsand transactions 3.2 3.2 3.0 3.1 3.4
Turnover tax 15.6 14.9 15.3 17.6 21.2
of which:production tax on imports 9.5 8.6 9.1 9.9 12.5
consumption tax on imports 1.2 1.2 1.2 2.2 2.2
production, tax ondomestic goods 3.3 3.5 3.4 3.5 4.3
State monopolies 7.9 8.8 8.2 9.1 9.9
Other duties and taxes 1.0 0.9 1.1 1.2 1.5
Pipeline royalties 0.2 0.4 1.5 2.2 2.4
Earmarked revenues 1.1 - 1.9 - 0.8
Other revenues 2.b 2.2 1.6 2.1 3.9
Total 60.L 58.4 58.8 64.7 77.0
Source: Secr6taire d'Etat au Plan et a 1'Economie Nationale

Table 28
Central Uovernment - Fiscal Burden
Year Gross Domestic Direct and Indirect Taxes Proportion over GDPProduct - Total Indirect Direct Total Indirect DirectFactor cost Taxes Taxes Taxes
Millions of Dinars Millions of Dinars %
1960 284,1 67,2 49,2 18,0 23,6 17,3 6,31961 319,1 65,7 47,4 18,3 20,6 14,9 5,71962 327,5 62,3 47,0 15,3 19,0 14,3 4,61963 349,6 68,7 52,8 15,9 19,6 15,1 4,51964 378,8 80,0 62,1 17,9 21,1 164 4,7
Sources - GD? - Table 7
Taxes - Table 26
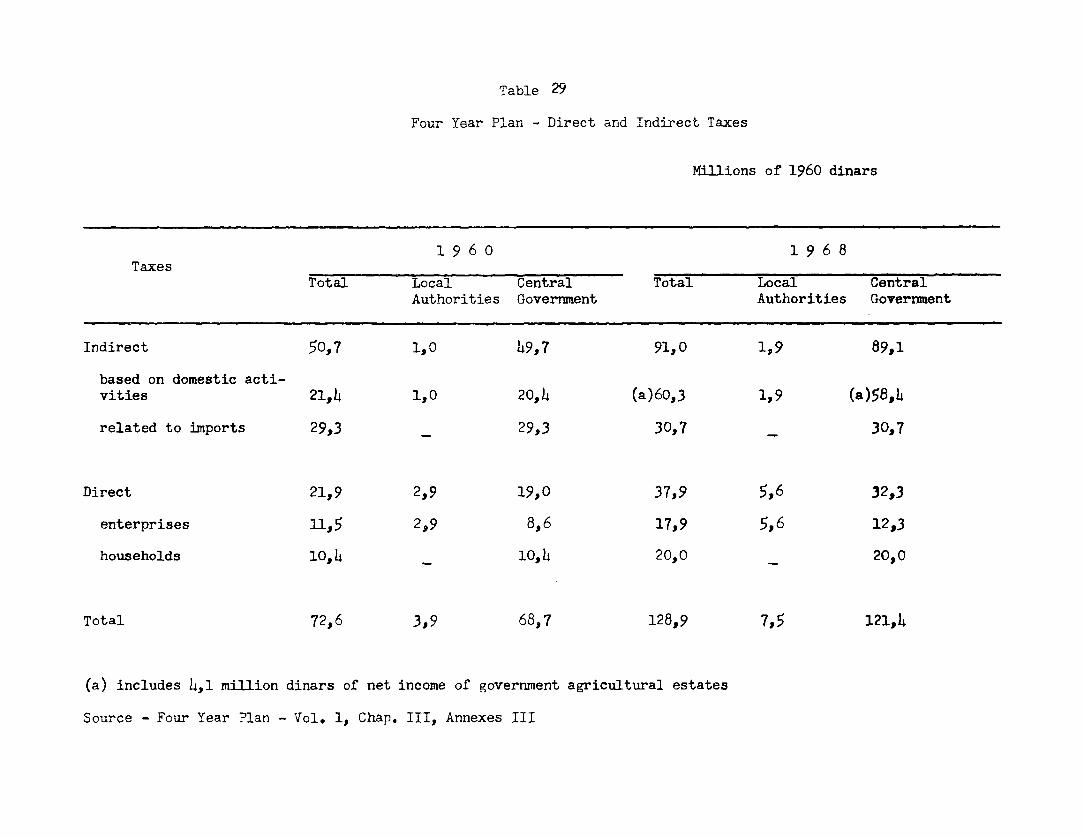
Table 29
Four Year Plan - Direct and Indirect Taxes
Millions of 1960 dinars
1 9 6 0 1 9 6 8
Total Local Central Total Local CentralAuthorities Government Authorities Government
Indirect 50,7 1,0 49,7 91,0 1,9 89,1based on domestic acti-vities 21,4 1,0 20,4 (a)60,3 1,9 (a)58,4related to imports 29,3 _ 29,3 30,7 30,7
Direct 21,9 2,9 19,0 37,9 5,6 32,3enterprises 11,5 299 8,6 17,9 5,6 12,3households 10h 10o,4 20,00 20,0
Total 72,6 3,9 68,7 128,9 795 121s,4
(a) includes 4,1 million dinars of net income of government agricultural estates
Source - Four Year Plan - Vol. 1, Chap. III, Annexes III

Table 30
Central Government
Service of Public Debt
Millions dinars
1968*
1960 1961 1962 1963 196 Plan
Medium and long-term debt 5.1 6.6 5.3 4.0 5.8 9.2
External debt 1.6 3.0 a) 5.5
Interest 0.7 0.9 a) 1.6Amortization 0.9 2.1 a) 3.9
Internal debt 2.4 2.8 3.7
Interest 1.6 1.4 2.0Amortization o.8 1.4 1.7
Short-term foreign debt
Interest and amortization - - - 4.2 2.1
External ebt valued at new dinar parity; does not include service of debt to be contracted for the financingof Five-Year PlanSource: 1960 - i964: Secretaire d'Etat au Plan et a l'Economie Nationale
a) Four-Year Plan : Volume 1, Chapter III, Annex V.

Table 31
PUBLIC ENTERPRISES '
FIXED INVESTMENT AND ITS FINANCIIfG
(millions of dinars)
1960 1961 1962 1963 1964
Investment 5.2 15.3 19.6 30.4 Wh7
Financed by:Savings 3.7 5.5 6.0 11.5
Receipts minusexpenditures J 2.0 3.5 1.8 6.2
Amortization 1.7 2.0 h.2 5.3
Central Government Support 2.3 6.3 5.8 10.7
Investment subsidies 1.9 4 .L h.3 9.8
Direct participation o.L 1.9 1.5 0.9
Foreign investment - 1.7 1.b 5.8
Banking system I/ 1.0 2.0 5.1 1.8
Other financing mreans - 1.8 - 0.2 + 1.3 0.6
Total 5.2 15.3 19.6 30.4
For list of public enterprises included in 1963, see Table 65
2/ See Table 65 for discrimination according to enterprises.
Note: Estimate of savings for 1964:I. on the basis of proportion in relation to investment
prevailing in 1963: 12.0 million dinars;II. on the basis of same proportion prevailing in 1964:
15.0 million dinars.
Source: Secr6taire d'Etat au Plan et a l'Economie Nationale,Investissements en Tunisie, 1960-1963.

Table 32
Four Year Plan - Savings
millions of 1960 dinars
1960 * 1968
"Gross National Savings" 351 * 9511
Administrations 15,4 * 31,1
Enterprises (corporate) 9,6 36,4
non-financial 7,1 29,5
financial institutions 25* 6,9
Households : 10,1 27,6
Gross Domestic Savings 26,6 88,3
Source - Four Year Plan - Vol. I, Chapt. III, p.38
GDS - Table 20

Table 33
Four Year Flan - Gross Domestic Product and Factor shares millions of 1960 dinars
196 o i 9 6 8
Sector Sector
DiscriminationSnterprisee pnterprises
non-financial financial non-finalEial financialtotal enterprises enterprises total Adcinistrations Households totgl enterpriEl enterprises total A,inistrations Househelds
Wages and salaries 69,4 68,1 1,3 69,4 - - 130,3 120,3 2,0 122,3 8,0
Other benefits 4,6 4,5 o,l 4,6 17,6* - 9,3 9,1 0,2 9,3 16,7
Salaries paid by Governmentthrough budgetary and similaraccounts 45,i - - - 45,1 - 67,2 - - - 67,2
Gross orofit 170,0 155,3 2,6 157,9 - 12,1 248,5 222,0 5,5 227,5 3,0 18,0
individual entercrises 133,3 133,3 - 133,3 - - 164,9 164,9 - 16
b,9 -
cornorate enter-orises 24,6 22,0 2,6 24,6 - - 65,6 57,1 5,5 62,6 3,0
households as productionunits 12,1 .. - - 12,1 18,0 - - - - 18,c0
Gross domestic r,roduct -factor prices 289,1 455,3
indirect taxes 50,7 91,0
Subsidies 4,o 6,9
Cross domestic product -:-Arket prices 335,8 539.4
- transfer item, riot included in total
Note - the nev estimates of GDP for 1960 differ omsewhat from those used in the Four Year Plan
Source - Four Year Plan, Vol. I, Chaut. III, Annexes I1,III, pp. 17 and 19

Table 34
Four Year Plan - Household Savings
Millions of 1960 dinars
1960 1968
Gross income (I) 285$,2 408,9
Production 12,1 18,0
Wages and salaries 11h,5 197,5
Other benefits 24,3 26,0
Gross profit of individualenterprises 133,3 164,,9
Interest and dividends o,6 2,5
Other items o,4 -
Deductions (II) 17,8 31,9
Direct taxes 10,4 20,0
Social Security 7,4 11,9
Total disposable income (III=I-II) 267,4 377,0
Private consumption (IV) 257;3 349,4
Household savings (V-III-IV) 10,1 27,6
Source - Four Year Plan, Vol. I, Chapt. III, p.8, with
adjustments for items of gross income.

Table 35
Four Year Plan - Savings of corporate enterprises
millions of 1960 dinars
1960 1968
Non- Non-financial Financial financial Financialenterprises enterprises Total enterprises enterprises Total
Gross Profit 22,0 2,5 24,5 57,1 5,5 62,6
Income from non-financialenterprises 2.0 2.0
Total 22,0 2,5 24,5 57,1 7.5 64,6
Allocation:
Dividends and participations 1,5 1,5 8,6 8,6
To households 0,9 0,9 2,5 2,5
To financial enterprises 2,0 2,0
Other 0,6 o,6 4,1 4,1
Transfers 2,,1 _ 2,1 1,7 1,7
Direct taxes 11J5 ... 11J5 17,3 0.6 17,9
Central Government ... 8,6 ,.. ... 12J,3
Local Authorities 2. 29 5,3
Savings 7,1 2,5 9,6 29,5 6,9 36,4
Tot2l 22,o 2,5 24,5 57,1 7,5 64,6
* All firms which are not individual enterprises.Source - Four Year Plan - Vol. I, Chap. III, Annex III.

Table 36
Four Year Plan - Savings of Administrations1968
millions of 1960 dinars
Current CurrentReceipts Expenditures Savings
Central Government 132.0 99.6 32.4
Budget - Title I (a) 118.0 87.6 30.4
Other Government 14.0 12.0 2.0Accounts (b)
Local Authorities 7.5 10.0 - 2.5
Social Security System 11.2 10.0 1.2
Non Profit [Enstitutions (c) 2.0 2.0 -
Foreign and InternationalAdministrations 10.0 10.0 -
Total 162.7 131.6 31.1
(a) Annex budgets (Postal and Telegraph System and Radio andTelevision of Tunisia) not included.
(b) Special Funds, Loan Funds ("Fonds de concours") andEarmarked Receipts ("Recettes Affectees").
(c) "Administrations privees".
Source - Four Year Plan, Vol. I, Chap. III, p.12-14.

Table 37
BANKING SYSTEM
CLAIMS, MONEY SUPPLY AND NET FOREIGN ASSETSPOSITION CHANGES IN PERIOD
(millions of dinars)
1961 1962 1963 1964
Expansion of claims (I) 32,7 46,o 30,1
on government 25,5 24,8 4,8
on non-government sector 7,2 21,2 25,3
Offsetting items (II) 5,9 9,0 15,8
quasi-money 2,0 4,3 5,14
government lending funds 1,9 2,0 2,8
capital 2,1 1,3 3,0
other _0,1 1,4 4,6
iNet expansionary effect (I-II) 26,8 47,0 14,3effect on:
money supply 11,9 27,3 O0L
net foreign assets position 14,9 9,7 13,9
Source: Table 38

Table 38
MIONETARY SUR-VEY
OUTSTANDING BALANCES AT END OF YE-AR
(millions of dinars)
Assets 1960 1961 1962 1963 1964
Net foreign exchange position 30,9 16,0 6,3 - 7,6
Total claims 105,8 138,5 18h,5 214,6
Claims on Government (net) (a b) 26,0 51,5 76,3 81,1
Assets (a) 21,3 27,6 54,2 78,0 85,7
Central Bank 5,5 5,8 19,2 21,0 18,7
Banks 9,5 10,7 12,8 24,3 25,4
Postal Checking accounts 3,4 7,8 18,3 28,4 36,8
Central Bank and Bank ),6 4,5 9,5 17,9 25,5depositsOther 2,8 3,3 8,8 10,5 11,3
Savings Funds accounts 2,9 3,3 3,9 4,3 X,8
liabilities to Government (b) - 1,6 - 2,7 1,7 - 4, 6
Claims on non-government sector 67,2 79,8 87,0 108,2 133,5
Central Bank 10,4 17,0 11,2 8,8 19,1
Banks 56,8 62,8 75,8 99,L 114,1
Other items 1,9 1,4 2,5 1,9
Total 138,6 155,9 193,3 208,9
Rediscounted paper of Banks
Source: Banque Centrale de Tunisie

Table 38 (contd.)
MONETARY SURVEY
OUTSTANDING BALANCES AT END OF YEAR
(millions of dinars)
Liabilities 1960 1961 1962 1963 1964
Money 90,5 93,7 105,6 132,9 133,3
Currency 37,8 )d,5 37,5 44,2 4h,9
Deposits 52,7 52,2 68,1 88,7 88,h
Central Bank 0 0 0,5 0 0
Banks 49,9 48,9 58,8 78,2 77,2
Postal Checking accounts 2,8 3,3 8,8 10,5 11,2
Quasi-Money 10,0 12,0 16,3 21,7
Banks 6,7 8,1 12,0 16,9
Time deposits 2,8 3,8 L,4 8,1 11,6
Import deposits and other funds 2,9 3,7 3,9 5,3
Savings Funds 2,9 3,3 3,9 O,3 4,8
Government Lending Funds 1/ 12,6 11,7 13,6 15,6 18,4
Obligations 0,8 1,0 0,9 1,1
Capital 4,7 6,8 8,1 11,1
Central Bank 1,1 1,8 2,2 2,2
Banks 3,6 5,0 5,9 8,9
Other items 17,7 16,9 19,5 23,3
Total 138,6 155,9 193,3 208,9
Includes counterpart funds of foreign loan operations and fundsresulting from budgetary appropriations.
Source: Banque Centrale de Tunisie

Table 39
B3AJN'ING SYSTEMi
CIAIMS ON NON-GOVERNMENTAL SECTOR!' (INCLUDING PUBLIC ENTERPRIISES)-TOTSTA.DEING BALANCES AT END OF YEAR
(millions of dinars)
Medium and Long-term credits
LongShort-term credits Medium TermCentral with counter- other Central totalYear Banks Bank total part funds resources total Bank total Banks total credits
1960 k6,3 9,2 55,5 2,2 L,6 6,8 1,2 8,0 6,9 lh,9 70.b1961 51,k 12,9 6h,3 3,0 L,o 7,0 2,7 9,7 6,6 16,3 80,61962 62,L 5,0 67,L 2,8 4,6 7,L 7,8 15,2 6,7 21,9 89,31963 75,7 3,7 79,L 3,3 10,9 l!,2 6,h 20,6 7,L 28,0 107,L196h 89,3 8,2 97,5 L,6 13,0 17,6 ll,b 29,0 6,6 35,6 133,1
1/ There are discrepancies between the values in this table and those of "claims on non-governmental sector" ofthe monetary survey due to differences in coverage of the items involved; they are not large enough, however, sothat this table can be regarded as a distribution of those claims according to term.
Source: Banque Centrale de la Tunisie, Annual Reports

Table 40
BANKING SYSTEM
SHORT-TERM CREDITS - SECTCRAL DISTRIBUTION
OUTSTANDING AT END OF PERIOD(millions of dinars)
Sectors 1960 1961 1962 1963 1964
Agriculture 3,3 3,6 3,5 1,9 3,5
Energy - Transport 3,0 4,0 4,3 4, 8 5,2
Mdines 1,2 0,7 1,7 1,5 2,7
Metals 2,6 2,7 3,3 3,5 5,1
Construction and public works 2,2 4,2 5,0 6,5 8,8
Chemicals 1,0 1,1 1,5 2,2 1,5
Food - industry and commerce 20,0 25,0 19,4 27,4 22,6
Textiles 2,0 1,7 2,1 2,7 6,9
Leather 0,4 0,4 0,3 0,3 0,4
Other industry and commerce 3,7 4,0 4,4 6,9 9,7
Total allocated 1/ 39,5 47,5 45,6 57,7 66,4
Total non-allocated 16,0 16,8 21,8 21,7 31,1
Total 55,5 614,3 67,4 79,4 97,5
g/ The allocation is carried only for the "more important economicbranches"; data are considered by the Central Bank as "approximations".
Source: Banque Centrale de Tunisie, Annual Reports

Table 41
BANKING SYSTEM
MEDIUM AND LONG-TERM CREDITS - SECTORAL DISTRIBUTIONOUTSTANDING AT END OE PERIOD
(millions of dinars)
Sectors 1960 1961 1962 1963 1964
Agriculture 2,3 2,3 2,2 3,6 3,3
Mining 0 0 0,2 0,2 0,2
Building materials - extraction - 0 0,2 0,2 o,6
Construction and public works o,5 0,5 0,6 0,7 0,9
Transport 0,9 0,8 1,2 1,2 1,1
Real state and home loans 1,1 1,7 3,2 5,8 7,0
Food and soap industries 0,9 1,5 2,6 3,4 3,4
Food - commerce 0,6 0,7 o,6 0,7 o,6
sub-total 6,3 7,5 10,8 15,8 17,1
Sparto grass industry 0,7 O,7
Fuel 1,0 1,0
Textiles and apparels - commerce 1,3 1,5
Hotels, restaurants, thermal stations 1,1 4,4
Other 0,8 1,8
sub-total 1,7 2,7 4,7 5,1 9,5
Total allocated i/ 8,0 10,2 15,5 20,9 26,6
Total non-allocated 6,9 6,1 6,b 8,9 9,0
Total 14,9 16,3 21,9 28,0 35,6
The allocation does not include credits below Dinars 3,000, whichare considered to be mainly belonging to the class "real state andhome loans".
Source: Banque Centrale de Tunisie, Annual Reports

Table 42
BANKING SYSTEM
NET FOREIGN EXCHANGE POSITION
OUTSTAO'DING BALAiNCES AT END OF YEAR(millions of dinars)
1964new old
1960 1961 1962 1963 parity parity
Foreign exchange holdings(disponibilite) (I) 32,7 29,4 28,1 18,0 14,AFreely 32,7 .. 20,5 15,6 12,5
Central Bank 31,8 ... 20,0 15,1 12,1Gold 1,3 1,4 1,4 1,5 1,9 1,5IMEF net position o,6 0,8 1,0 - -
Other foreignexchange assets 3h,4 29,8 ... 17,5 13,2 10,6
Banks 3,0 0,9 2,6 0,5 0,5 oILTied to foreign loans -
"croise" (Central Bank) - - ... 7,6 2,4 1,9Foreign exchange placements(II) 0,4 2,7 3,3 1,8 1,4
Central Bank - 0,8 1,6 0,7 0,6Banks 0,4 1,9 1,7 1,1 0,9
Foreign exchange liability -all terms (III) 2,1 16,1 25,1 27,4 21,9
Central Bank 1,2 1,5 2L,3 23,5 18,9payment agreements 1,6economic cooperation account 2,9Bank of France advances 5,1French Treasury 1,1Central Bank of Algeria 0,1Foreign Loans 9,0Foreign Loans - "crois6e" 7,6 2,4 1,9
IMF net position 1,3
Banks 0,9 1,6 0,8 3,9 3,1
Net foreign exchange position(I + II - III) 39,1* 30,9 16,1 6,3 - 7,6 - 6,1
* International Financial Statistics - Supplement 1965/66
Source: Banque Centrale de la Tunisie

Table 43
COST OF LIVING INDEX
Yeaadonhog Personal Transpor Entertain- GeneralYear and month Food Housigocar tzatinsp Clothing nnt and inecare tation miscell.
A. NEW INDEX (1962=100):Weight (per 1,000) 554 199 106 35 86 20 1,000
1962 Annual aver. 100.0 100.0 100.0 100.0 100.0 100.0 100.0
1963 Annual aver. 101.7 100.1 105.0 100.5 113.4 100.5 102.7
196%4 Annual aver. 106.9 103.6 107.6 109.7 114.6 103.9 107.0Sept. 106.8 103.1 107.2 108.4 109.3 103.8 106.3Oct. 109.4 105.9 108.7 113.4 107.6 103.8 108.5Nov. 1l1.5 106.3 108.9 113.7 111.2 103.8 110.1Dec. 1.13.4 107.4 109.7 113.7 1117 104.7 111.5
1965 Jan. 113.5 108.1 109.8 113.6 113.1 105.7 111.8Feb. 113.2 108.7 110.3 113.7 I18.0 105.7 112.3Mar. 113.3 109.3 I11.2 113.8 118.1 106.7 112.6Apr. 114.2 109.5 111.2 113.8 118.7 106.7 113.2May 116.8 109.3 111.4 114.6 120.3 106.7 214.7June 111.6 109.6 I11.8 118.7 120.9 106.7 I13.8
B. OLD INDEX (1940-100):
1960 2626
1961 27361962 2627
Source: Bulletin mensuel de statistique, various issues and preliminary figures f romSecretariat d'Etat au Plan et aux Finances.

INFLICIT PRICE INDEXES FOR EXPENDITURE OUT OF GROSS DOMESTIC PRODUCTAT MARKETL PRICES, 1960 - 1964 (new series)
(1960 = 100)
1960 1961 1962 1963 196bPrelinr.
1. Private consumption 100.0 101.2 103.2 105.6)) 106.7
2. Public consumption 100.0 104.3 100.0 102.9)
3, Gross domestic fixed capital formation 100.0 102.6 100.0 102.7 107.8
4~. Changes in stocks 100.0 98.2 102.1 110.5 xx
5. Net exports of goods and services 100.0 99.0 102.5 102.9 113.1
a. Exports f.o.b. 100.0 99.4 100.6 104.1 109.0
b. less Imports c.i.f. 100.0 99.2 101.3 103.7 110.5
6. Gross domestic product at market prices 100.0 102.1 102.1 104.7 106.2
Source: Tables 3 and 4 h

Table 45
IMPLICIT PRICE INDEXES FOR GROSS DOMESTIC PRODUCT AT FACTOR COST BY SECTOR1960 - 1964 (new series)
(1960 100)
Code Branch 1960 1961 1962 1963 1964Prelim.
00 Agriculture 100.0 103.5 102.0 106.4 105.2
10 Agricultural industries, food pro-cessing 100.0 100.9 101.4 108.5 107.9
19 Rural households 100.0 99.2 99.2 100.6 101.7
21 Petroleum products xx xx xx xx 100.0
22 Electricity 100.0 105.1 111.9 105.4 103.523 Water, other energy products 100.0 95.5 94.4 95.3 93.2
31 Construction materials, ceramics,glass 100.0 107.6 103.1 104.9 108.6
32 Extractive industries 100.0 98.3 99.1 91.8 99.3
33 Mechanical and electrical industries 100.0 99.6 106.0 103.3 103.5
34 Chemicals 100.0 106.1 98.3 99.7 108.935 Textiles, clothing, leather 100.0 101.0 113.1 111.3 122.2
36 Wloodworking, furniture 100.0 113.0 111.3 110.1 1114.837 Paper, miscellaneous industries 100.0 114.8 110.8 111.8 111.9
50 Buildings, public works 100.0 102.8 103.4 107.4 105.9
60 Transportation, communications 100.0 102.8 104.2 105.1 109.2
71 Rents 100.0 99.8 99.9 99.9 100.172 Services (other than gov't and
domestics) 10(.0 103.1 102.3 104.0 103.379 Wholesale and retail trade 100.0 101.8 102.1 105.3 110.0
81 Salaries of government employees 100.0 103.7 100.0 102.3 105.882 Salaries of domestic servants 100.0 101.7 lC)0.0 100.0 100.0
Gross domestic product at factor cost 100.0 102.6 102.0 104.8 106.3
Indirect taxes net of subsidies 100.0 98.3 101.9 104.2 105.4
Gross domestic product at market prices 100.0 102.1 102.0 104.7 106.2
Source: Tables 6 and 7

Table 46
BALANCE OF PAYMENTS
(millions of dinars)
Projection 1968 Projection 19681960 (old parity) 1961 (old parity) 1962 (old parity) 1963 (old parity) 1964 (old parity) (old parity) (new parity)
Receipts Payments Receipts Payments Receipts Payments Receipts Payments Receipts Payments Receipts Payments Receipts Payments
Goods / 1/ 54.2 83.0 46.8 86.9 49.1 84.9 51.3 92.0 57.4 100.5 72.5 105.0 90.6 131.3Non-factor services- 28.6 27.2 28.8 21.2 22.3 25.6 30.3 28.6 26.0 28.1 36.5 34.0 45.6 42.5
Goods and non-factorservices 2/ 82.8 110.2 75.6 108.1 71.4 110.5 81.6 120.6 83.4 128.6 109.0 139.0 136.2 173.8
Factor services- 5.5 3.9 5.0 5.6 3.9 7.1 3.5 9.5 3.6 10.7 5.0 17.4 6.3 21.8Investment income (1.9) (0-9) (1.8) (0.8) (1.6) (0.9) (1.1) (1.7) (0.8) (2.6) (1.0) (6.o)-/ (1.3) (7.5 )'Other (3.6) (3-0) (3.2) (4.8) (2.3) (6.2) (2.4) (7.8) (2.8) (8.1) (4-0) (11.14) (5.0) (14.3)
Private transfers 0.9 o.5 1.2 0.5 0.7 0.7 0.8 1.7 o.6 o.5 1.0 1.0 1.3 1.389.2 1114.6 81.8 114.2 76.0 118.3 85.9 131.8 87.6 139.8 115.0 157.4 143.8 196.9
Grants 18.7 19.1 14.2 13.7 8.4Loans and investments 7.3 1.1 5.9 0.8 20.1 1.1 24.5 2.2 41.5 5.8 ) ) 4/
Private (7.3) (°.NT (3.7) (0-5) (5.4) (0.8) (13.9) (1.1) (12.2) (14.0)) 49.5 7.1v ) 61.9 8.8-Public (0.0) (0.3) (2.2) (0.3) (1144) (0.3) (10.6) (1.1) (29.3) (1.8))
Change in foreign exchangeassets and short-termliabilities 5/ 3.9 3.1 8.7 0.5 9.6 0.3 10.4 0.5 10.1 2.1
Errors and orissions 0.3 0.2 0.1 _ _
119.1 119.1 115.5 115.5 119.9 119.9 134.5 1314.5 147.7 147.7 164.5 164.5 205.7 205.7- --_ == =_
1/ Goods in 1960 include partially payments for sea freight; from 1961 onward these payments are all included under non-factorservices: see Table 48. Because of differences in timing and average, imports and exports of goods in the B.O.P. are notidentical with those recorded in the trade statistics.
2/ See Table 48/ Does not include interest payments for debt to be contracted during 1965-1968.T/ Does not include amortization of debt to be contracted during 1965-1968.5/ Does not check with the changes as reported by the banking system.
Sources: Banque Centrale de la Tunisie, "Balance de Paisments" and data supplied to the Mission;Secretariat d'Etat du Plan et de l'Economie Nationale "Le Compte Exterieur, 1960-1963".

Table 47
BALANCE OF PAYMENTS (NET)
(millions of dinars, old parity)
Projection1960 1961 1962 1963 1964 1968
Goods 1/ - 28.8 - 40.1 - :35.8 40.7 - 43.1 - 325Non-factor services- 1.4 7.6 - 3.3 1.7 - 2.1
Goods and non-factorservices - 27.4 - 32.5 - 39.1 - 39.0 - 45.2 - 30.0
Factor services.1/ 1.6 - o.6 - 3.2 _ 6.o - 7.1 - 12 4investment income (1.0) (1.0) (0.7) (- 0.6) (_ 1.8) (5.o2other (0.6) (- 1.6) (- 3.9) (- 5.4) (- 5.3) (- 7-4)
Privat.e transfers 0.4 0.7 0.0 - 0.9 0.1 0.0
Deficit on current account - 25.4 - 32.4 - 42.3 - 45.9 - 52.2 - 42.4
Grants 18.7 19.1 14.2 13.7 8.4 )Loans and investments 6.2 5.1 19.0 22.3 35.7 ) 3/
private (6.5) (3.2) (4.6) (12.8) (8.2) ) 42c4public (0 0.3) (1.9) (14.4) (9.5) (27.5) )
Change in foreign assetsand short-termliabilities 0.8 8.2 9.3 9.9 8.0
Errors and omissions - 0.3 - 0.2 0.1
j See Table 48. See also footnote 1 of Table 466.2/ Does not include interest payments for debt to be contracted during 1964-68.;/ Does not include amortization of debt to be contracted during 1964-68.
Does not check with the changes as reported by the banking system.
Source: See Table 46 .

Table 48FACTOR AND NON-FACTOR SERVICES
(millions of dinars)
Projection 1968 Projection 19681960 (old parity) 1961 (old parity) 1962 (old parity) 1963 (old parity) 1964 (old parity) (old parity) (new parity)Receipts Payments Receipts Payments Receipts Payments Receipts Payments Receipts Payments Receipts Payments Receipts PaymentsSea freight 1.8 2.1 3.81' 6.6!/ 4.1 8.6 5.2 9.7 4.4 10.0 5.0 10.0 6.3 12.5Air freight 0.1 o.6 0.1 0.5 1.6 1.8 1.4 2.1 1.7 2.9 3.0 4.o 3.8 5.0Other transportationcharges 0.2 o.5 0.2 0.2 0.1 0.3 0.1 0.3 0.0 o.4 0.0 0.5 0.0 o.6Total transportationcharges 2.1 3.2 4.1 7.3 5.8 10.7 6.7 12.1 6.1 13.3 8.0 14.5 10.0 18.1Tourism 2.3 7.8 1.5 3.4 2.0 1.8 3.7 2.1 5.0 2.7 10.0 4.o 12.5 5.0Other travel 0.1 o.6 0.1 0.9 0.1 1.6 0.2 1.6 o.4 2.4 o.5 3.5 o.6 4.4Total travel 2.4 8.4 1.6 4.3 2.1 3.5 3.9 3.7 5.5 5.1 10.5 7.5 13.1 9.4Government receipts andexpenditures 20.8 7.6 19.8 7.3 12.3 7.5 17.0 6.8 11.9 4.7 15.0 6.o 18.8 7.5
Other non-factor services 3.3 8.0 3.3 2.3 2.1 3.9 2.7 6.o 2.5 5.0 3.0 6.o 3.8 7.5Total non-factor services 28.6 27.2 28.8 21.2 22.3 25.6 30.3 28.6 26.0 28.1 36.5 34.0 45.6 42.5Wages, salaries, etc. 0.6 1.4 o.6 2.1 o.5 2.9 2.4_/ 2.8 2.8 3.3 4.0 5.0 5.o 6.3Investment income 1.9 0.9 1.8 o.8 1.6 0.9 1.1 1.7 0.8 2.6 1.0 6.03- 1.3 7.5-3Planning studies )) 4.2 4. 5.4 6.81.6 ) 2.7 ) 3.3 I/2/.1Other factor services 3.0 ) 2.6 ) 1.8 ) 0.8 o.6 1.0 1.3Total factor services 5.5 3.9 5.0 5.6 3.9 7.1 3.5 9.5 3.6 10.7 5.0 17.4 6.3 21.8Total services 34.1 31.1 33.8 26.8 26.2 32.7 33.8 38.1 29.6 38.8 41.5 51.4 51.9 64.3
1/ Change in the method of measurement. Figures from that year onward are not comparable with the corresponding entriesfor previous years.2/ Estimate)V This amount does not include interest payments on debts to be contracted during Four-Year Plan period.It includes 2.4 million dinars interest payments for debt (disbursed and undisbursed) contracted up to December, 1964.Source: See Table 46

Table 49
EXPORTS
(millions of dinars) /
Mission1960 1961 1962 1963 1964 1968 Adjust-
Plan ments1968
Non-processed agricultural products 12.6 6.4 7.0 9.8 10.2 12.9 11.1
of which: hard wheat 5.2 1.6 1.4 3.7 2.7 5.3 3.6other wheat 1.8 0.0 0.0 0.4 0.6 0.0 0.0citrus 1.6 1.9 1.8 1.8 2.2 2.7 2.7other fruits 1.1 o.8 1.3 0.7 1.8 1.6 1.6alfa 1.3 1.0 1.0 0.8 0.7 0.3 0.3other non-proc.agr.prod. 1.6 1.1 1.6 2.5 2.2 2.9 2.9
Processed agricultural products 20.0 22.4 25.9 25.8 26.7 25.7 23.1
of which: olive oil 5.8 9.6 12.8 9.9 11.9 9.4 11.0wine 7.5 8.0 7.7 10.2 8.9 8.4 4 2preserved fish 0.8 o.6 0.7 0.6 0.6 1.4 1.preserved fruits and
vegetables 0.9 1.0 1.5 1.6 2.2 3.6 3.6other processed agr. prod. 5.1 3.2 3.3 3.4 3.1 2.9 2.9
Principal mined and manufacturedproducts 13.2 13.9 12.3 13.h 15.8 3h.8 30.2
of which: petroleum products - - - - 0.1 2.9 6.0phosphates (lime) 5.9 5.9 6.6 7.0 8.5 10.7 10.7iron ore 3.3 3.0 2.4 2.4 2.4 3.6 3.6lead metal 1.4 1.5 1.0 0.9 1.3 1.2 1.5fertilizer 2.6 3.5 2.3 3.1 2.8 14.2 6.7cellulose - - - - 0.7 2.14 2.4
Other products n.e.q. 4.4 3.7 3.4 3.9 Ii.6 7.4 7.4
Total exports of goods 50.3 46.3 48.7 52.9 57.3 80.9 72.5
All amounts were converted at the old parity ($ 1 = Dinars o.42) with theexception of 1964 figures, which are affected by the devaluation onSeptember 28, 1964.
Source: Annuaire Statistique ; Bulletin. Comparatif. Trimestriel

Table 50
IMPORTS
(millions of dinars)
Mission1960 1961 1962 1963 1964 1968 Adjust-
Plan ments 1968
Prin al Foodstuffs and beverages *12 1 2o3 1843 15.5 16.4 12.2 17.4
wheat 5.1 13.4 11.0 5.0 2.7 0.8 8;.oedible oil 0.3 0.3 0.4 3.3 2.0 3.3 1.3sugar 3.1 2.7 2.8 3.0 7.4 2.8 2.8tea, coffee and spices 2.4 2.6 2.6 2.9 3.0 3.9 3.9dairy products 1.2 1.3 1.5 13 1.3 1.4 1.k
Fuels 6.3 6,3 6.2 7.4 5.8 1.1 1.1
petroleum products 5.9 5.9 5.9 7.1 5.3 - -
coal 0.4 0.4 0.3 0.3 0.5 1.1 1.1
Principal r-_w materials afndintermediary products 12.0 129 13e6 17-3 16.1 14 9
iron and steel 4.1 4.8 5.6 6.4 7.6 4.8 4.8wood and lumber 1.9 2.1 2.0 1.9 3.3 3.1 3.1tissues 7.1 5.0 5.2 5.2 6.2 6.7 6.7sulphur 0.1 0.1 0.1 0.1 0.2 1.5 0.3
_quiprent 22.5 23.7 25.4 28.5 38.5 40.0 40.0
industrial and agricul-tural equipment 15.5 16.7 18.3 22.0 30.1 ) )
consumers equipment 7.0 7.0 7.1 6.5 8:4 ) 40.0 ) I0.0
Other Finished products 3.7 3.9 4.0 4,9 4.2 4.8 4L8
pharmaceutical products 2.0 2.1 2.2 3.0 2.0 3,0 3.0paper 1.7 1.8 1.8 1.9 2.2 1.8 1.8
All other products n.e.q. 22.3 22.2 24.1 23.8 28.6 24.3 L1.o
Total imports of goods 80.1 88.4 9C.9 93.7 110.8 98.5 10.2
All amounts were converted at the old parity ($1 = Dinars 0.42) with theexception of 1964 figures which are affected by the devaluation onSeptember 28, 1964.
Source: Annuaire Statistique; Bulletin ComDaratif Trimestriel

Table 51
EXPORT PRICES
(dinars 1/ per metric ton)
1960 1961 1962 1963 1964
Alon-Drocessed agricultural products
hard wheat 44.8 47.6 49.5 31.4 30.0other wheat 25.4 55.8 21.0 22.0 23.6citrus 42.7 L4.6 47.1 58.7 51.3other fruits 147.9 142.2 157.5 116.8 191.1alfa 12.2 12.7 13.8 13.8 14.8other non-processed agricul.products 57.6 73.3 73.0 59.4 68.2
Processed agricultural products
olive oil 235.6 216.8 238.t 342.1 232.2wine 55.2 59.9 61.3 61.2 59.9preserved fish 233.3 230.0 233.2 240.0 248.7preserved fruits &: vegetables 92.0 95.0 92.1 137.8 134.1other processed agricul. products 59.6 52.0 46.9 45.0 45.4
Principal Mined and Manufactured Products
oil and oil products 23.9 20.6 37.3 119.0 14.1phosphates (lime) 3.6 3.6 3.6 3.6 3.9iron ore 3.2 3.4 3.3 3.1 2.9lead rTmetal 82.2 75.0 66.7 70.9 116.9fertilizer 23.4 22.5 20.4 20.8 2207cellulose - 24.14 - 72.8 75.5
1/ 1964 prices are affected by the devaluation on September 28, 1964.
'Source: Annuaires Statistiques; Bulletins Comparatifs Trimestriels.

Table 52
DIRECTION OF TRADE
(in millions of current; dinars)
1960 1961 1962 1963 1964
ImportsFranc area 49.1 48.8 48.6 45.7 51.0United States 6.3 13.2 14.5 10.3 11.14EEC (France excluded) 10.1 10.2 12.2 16.2 15.6United Kingdom 3.0 2.14 2.8 3.6 4.6Socialist countries I/ 7.1 5.2 3.3 8.0 7.6Others 4.5 8.6 9.5 9.9 20.6
Total 80.1 88.4 90.9 93.7 110.8
ExportsFranc area 29.6 26.7 27.0 25.7 32.1United States 0.1 0.3 0.7 0.4 0.4EEC (France excluded) 7,3 5.8 10.0 10.6 8.0United Kingdom 3.7 2.9 2.3 2.1 2.2Socialist countries j 3.4 L.5 3.4 4.0 3.2Others 6.2 6.3 5.3 10.1 11.4
Total 50.3 46.5 48.7 52.9 57.3
BalanceFranc area - 19.5 - 22.1 - 21.6 - 20.0 - 18.9United States - 6.2 - 12.9 - 13.8 - 9.9 - 11.0EEC (France excluded) 2.8 - b.h - 2.2 -5.6 - 7.6United Kingdom 0.7 - 0.5 - 0.5 - 1.5 - 2.4Socialist countries j - 3.7 - 0.8 - 0.1 - 4.0 - 4.4Others + 1.7 - 2.3 + 4.2 + 0.2 - 9.2
Total - 29.8 - 41.9 - L2.2 - 40.8 - 53.5
L/ Eastern Germany, Mainland China, Bulgaria, Hungary, Poland, Romania,Czechoslovakia, USSR, and Yugoslavia.
Source: Annuaires Statistiques; Bulletins Comparatifs Trimestriels.

EXTERNAL ASSISTANCE
Table 53: Disbursements During the Pre-Plan Period
and CommitmentsVfor the Four-Year-Plan(millions of U.S. dollars)
Pre-Plan Four-Year-PlanDisbursements Commitments Disbursements
1962 1963 1964 Total For 6 mos.Available Specific 1965
Purposes_________ only
Public loansUnited States:
pre 1962 loans 5.0 3.7 7.1 24.7 24.7 3.2
1962-1964 loans - 2.7 15.0 38.2 24.o 9.2
1965 loans - - - 16.8 6.8 -
PL 480, tital I 2.2 3.2 3.3 16.9 13.0 1.4
7.2 -9.7 27.7 96.6 68.5 13.7
France - 16.3 6.1 12.6 12.6 5.6
Germany - - 1.3 26.6 21.6 1.9
Netherlands - - - 1.4 1.4 -
Italy 10.0 - - - - -
Denmark - - - 1.b 1.4 0.1
Sweden - - 0.1 1.1 1.1 0.0
Kuwait - - 18.5 9.6 9.6 3.4
U.S.S.R. - 0.7 1.2 31.2/ 5.8 1.1
Poland _ 0.5 1.0 8.5/ 0.9 0.0
Czechoslovakia - o.s5 9 .5 Yugoslavia - - 0.7 314.3 / 3.2 1.3
I.B.R.D. - - - 7.0 7.0 -
I.D.A. - 0.5 1.1 3.4 3.4 1.4
I.M.F. - 5.3 9.0 - 9.0
Total loans 17.2 27.6 61.2 232.1 136.5 37.6
GrantsU.N./Red Cross2/ 0.5 1.0 1.5 0.8
United States 25.0 22.8 11.6 9.3
France 7.9 10.8 6.6 3.3
Germany 0.7 0.7 0.b 0.2
Sweden - - 0.8 0.4
Total grants 34.1 35.3 20.9 1b.0
/ The amounts listed as agreed or promised consist of the "pipeline" per
December 31, 1964 plus the new commitments made during the first semester
of 1965. They thus represent the funds available for financing the
1965-1968 Plan as per June 30, 1965.
/ Framework commitments (Engagements globals).
/ The U.N. Special Fund has committed itself (a.o.) for U.S.$7.9 million
as contribution to the cost of 8 projects to be realized in the period
1960-1968.
.....Continued.

Pre-Plan Four-Year-PlanDisbursements Commitments Disbursements
1962 1963 1964 Total For 6 mos.Available Specific 1965
Purposes_______ _ only
MajorExporter credits and foreigninvestments
Fertilizer plant(I.F.C. part.) - 1.3 2.2
Fertilizer plant(other part.) 3.0 4.3 -
First Nat.City Bank/Hambros Dank loans 10.0 - -
Oil refinery(E.N.I. part.) 1.6 1.6 - -
Oil exploration 5.0 5.0 5.0 2.5Exim Bank (U.S.) 1.3 1.0 - 3.1 3.1 o.6
Exporter Credits:Medical equipment
(Germany) - - 2.5 5.0 5.0
Steel Mill (U.K., France,Sweden) - 6.5 17.3 4.0
Hilton Hotel (U.K.) - 1.7 3.4 1.7Miscellaneous
(Netlherlands) - - - 2.8 - -
Hotel (Germany) - 0.8 - _ -
Total investments andexporter credits 20.9 22.2 30.4 lo.9 8.1 8.8
Grand Total 72.2 85.1 112.5 243.0 144.6 60.4
Source - Data supplied to the Mission by Tunisian and other authorities.
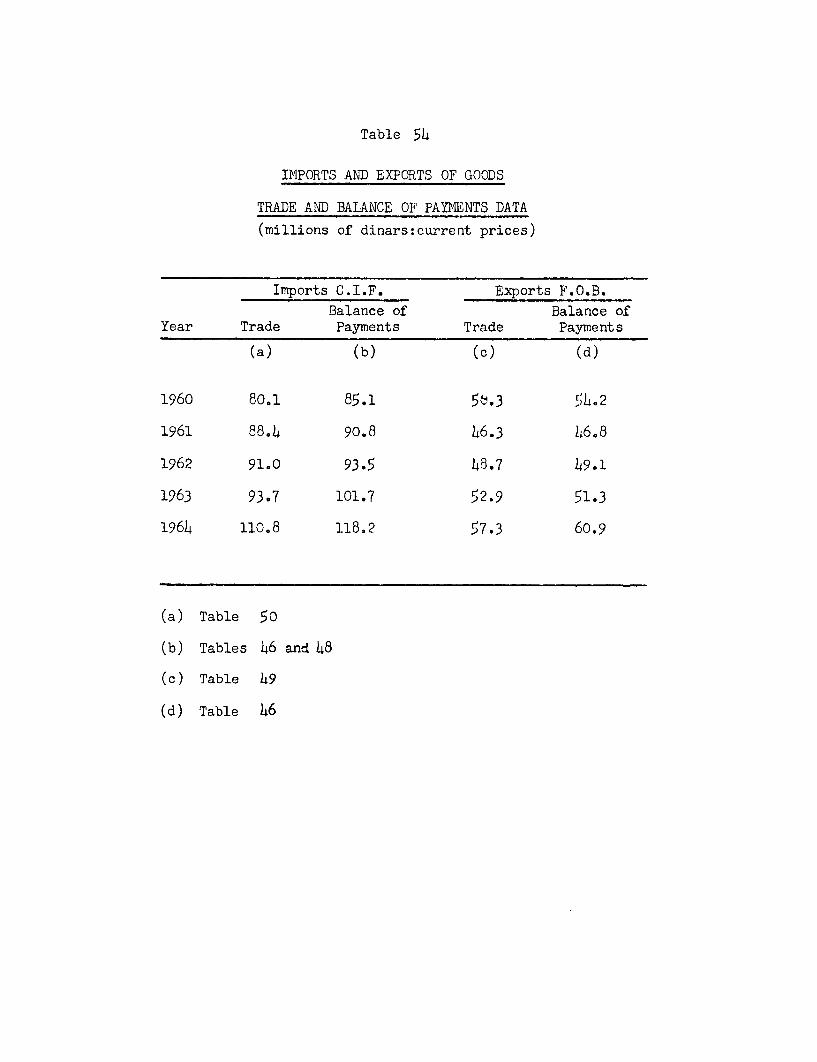
Table 54
IMPORTS AND EXPORTS OF GOODS
TRADE AND BALANCE OF PAYMENTS DATA
(millions of dinars:current prices)
Imports C.I.F. Exports F.O.B.
Balance of Balance ofYear Trade Payments Trade Payments
(a) (b) (c) (d)
1960 80,1 85.1 5>.3 5;h.2
1961 88.4 90.8 46.3 16.8
1962 91.0 93.5 8.7 119.1
1963 9307 101.7 52.9 51.3
1964 110.8 118.2 57.3 60.9
(a) Table 50
(b) Tables 46 and 48
(c) Table 49
(d) Table 46

Table 55
GOODS AND NON-FACTOR SERVICESIMPORTS
Goods and non-factor services
Balance of National Accounts GDP Market ProportionPayments Basis prices %Basis 1960 prices 1960 prices (1)/(3)(2)/(3)
(1) (2) (3)
1960 110.2 99.8 330.4 33.2 30.0
1961 108.1 109.0 356.3 30.4 30.5
1962 110.5 110.0 364.8 30.5 30.4
1963 120.6 111.1 382.6 31.5 29.0
1964 128.6 122.3 414.7 31.0 29.5
1968 139.0 5*028 26.3
(1) Table ho
(2) Table 3
(3) Table 3b; for 1968, see Text par. 113

Table 56
Four Year Plan
Total Foreign Financing Requirement - Public Capital.(millions of dinars)
1960-1964average 1964 Old Parity New Parity
(old parity) (old parity) 1968 1965-68 1968 1965-68
Resource Gap (1) 36.6 45.2 30 160 38 200
Factor Services (net) (2) 3.1 7.1 12.4 40 15 50Investment Income 0.0 1.8 5.0 14 6 18Other 3.1 5.4 7.4 26 9 32
Balance in current account 39.7 52.2 42.4 200 53 250(3=1+2)
Amortization of existingcontracted debt (4) 2.2 5.8 7.1 30.4 9 38
Change in net foreignexchange position (5) -7.2 -8.o 7.0 22.8 9 35
Foreign financing prior tonew debt (6=3+4+5) 34.7 49.9 56.5 258.4 71 323
Private equity foreigncapital (7) ^.7.0 12.0 48.:0 15 60
Public capital inflowrequirement prior to newdebt (8=6-7) - 42.9 44.5 210.4 56 263
Service of new debt to becontracted (9)Hypothesis I - - 7.3 9.8 9 12Hypothesis II - - 3.0 4.5 4 6
Total Foreign FinancingRequirement - Public Capital(10=8+9)Hypothesis I - - 51.8 220.2 65 275Hypothesis II - - 47.5 214.9 60 269
x including publicity guaranteed private loans(1) Table 46 and text 108(2) Table 46(4) 1960-64 includes service on private capital; for projection see Table 1.(5) See text para 130(7) See text para 131(9) Table 58Note: Data for 1960-6b4 from Table 46, except private equity foreign-capital,
which is on estimate.
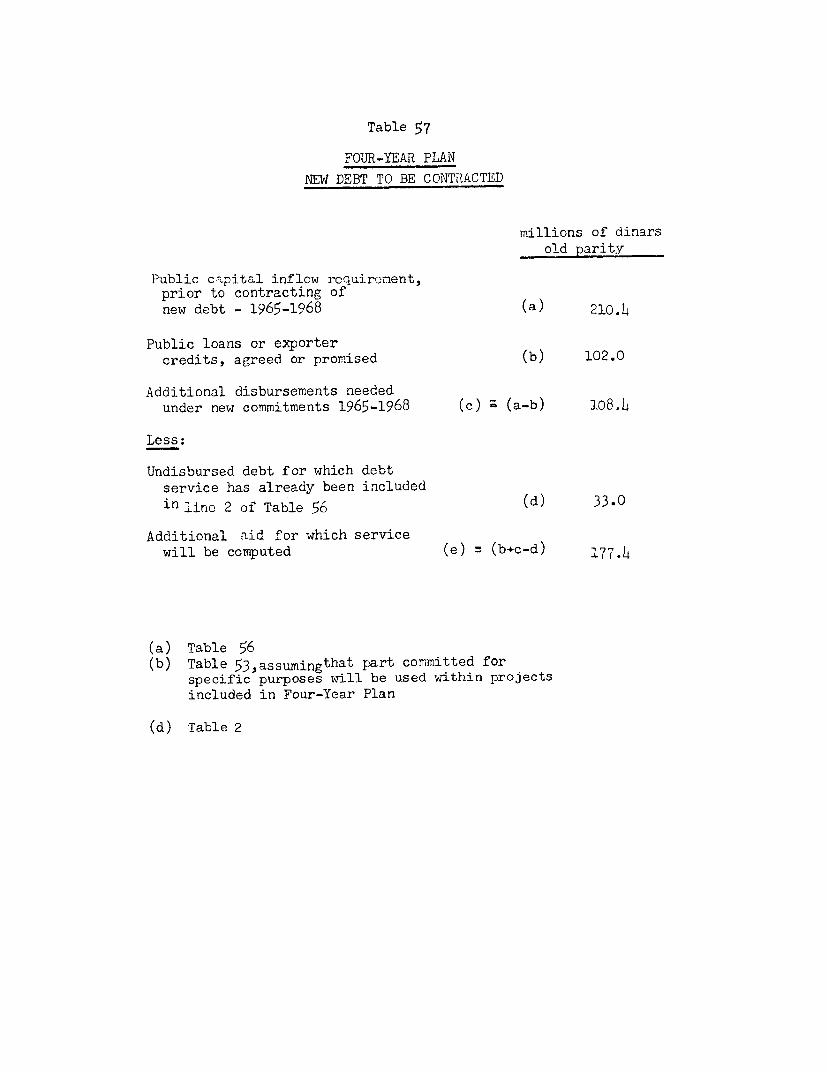
Table 57
FOUR-YEAR PLAN
NEW DEBT TO BE CONTRACTED
millions of dinarsold parity
Public capital inflow roquirnrment,prior to contracting ofnew debt - 1965-1968 (a) 210.1L
Public loans or exportercredits, agreed or promised (b) 102.0
Additional disbursements neededunder new commitments 1965-1968 (c) - (a-b) 108.1
Less:
Undisbursed debt for which debtservice has already been includedin linc 2 of Table 56 (d) 33.0
Additional aid for which servicewill be computed (e) = (b+c-d) 1771.4
(a) Table 56(b) Table 53,assumingthat part committed for
specific purposes will be used within projectsincluded in Four-Year Plan
(d) Table 2

Table 58
Estimated Debt Service 1965 - 1975(millions of dinars; old parity)
Service on debt Service on debt contracted during Estimated
Year existing Dec. 2 Total
1964 1/ 1965-1968 1969-1972 2 1973-1975 - Debt Service
Hypothesis I -
1965 10.7 - - 10X71966 l0o.4 - - 10.41967 9.7 2.5 - - 1202
1968 9.5 7.3 - - 16081969 6.9 12.1 - - 19.0
1970 7.1 14.4 1.6 - 23.1
1971 6.5 14.4 4.7 - 25.61972 6.3 14.4 7,8 - 28_5
1973 6,o 14.h 10.9 - 3103
1974 6aO 14.4 12.4 1.6 34.41975 6e. 14.4 12.4 4.7 37.6
Hypothesis II 6/
1965 10.7 - - 10.71966 l0.4 - - - 10.41967 9.7 1.5 - -1 .2
1968 9.5 3.0 - 12.5
1969 6.9 4,5 - - n.41970 7,1 4.5 0.8 - 12.4
1971 6.5 4e5 1.6 - 12.61972 6.3 5e9 2.4 14.61973 6.o 7.3 3.2 16.5
1974 6.o 8.7 3.2 0.5 18.4
1975 6.1 8.7 3.9 110 19.7
Notes - See following page

Table 58 (Contd.)
See table 1
The capital requirements were calculated on the basis of aresource gap of D 160 million and a deficit on factorservices (excl. income payments) of D 26 million for the fouryears. Private capital inflows (net of profit remittances)was taken at D 4o million. Additional aid for which service
was computed amounted to D 177 million (see Table 57).
The capital requirements were calculated on the basis of aresource gap of D 70 million and a deficit on factor services(excl. income payments) of D 40 million for the four years.Private capital inflow (net of profit remittances) was takenat D 30 million.
The capital requirements were calculated on the basis of aresource gap of D 10 million and a deficit on factor services(excluding income payments) of D 30 million for the threeyears. Private capital inflow (net of profit remittances)was taken at D 30 million.
Hypothesis I assumes 15% grant aid and 85% loans, repayableon 15 years with 1 year of grace and carrying an interest of5% p.a.
Hypothesis II assumes 15% grant aid and 85% loans, repayablein 25 years with 5 years of grace and carrying an interest
of 3% p.a.

Table 59
CAPITAL SERVICE RATIO AT THE END OF THE FOUR-YEAR PLAN
Service onCapital Capital
Years Exports (Payments) Service Ratiomillions of dinars %
(--1) (25 (2)/(l)
1960 82.8 2.0 2.4
1961 75.6 1.6 2.1
1962 71.4 2.0 2.8
1963 81.6 3.9 4.8
1964 83.4 8.4 10.0
1968 109.0 16.8 (a) 15.4
109.0 12.5 (b) 11.5
109.0 20.4 (c) 18.7
109.0 16.1 (d) 114.8
1975 161 37.6 (a) 23.4
161 19.7 (b) 12.2
2/ Exports of goods and non factor services. Exports for 1975 wierecomputed by assuming average annual growth of 6% in the period1968 - 1975.
Sources: (1) Table 46(2) 1960-1964: table 46
(a) Service on existing debt plus service on new debtto be contracted according to hypothesis I (Table 58)
(b) Service on existing debt plus service on newx debtto be contracted according to hypothesis II (Table 58)
(c) (a) plus D 3.6 million for the service of directforeign investment
(d) (b) plus D 3.6 million for the service of directforeign investment.
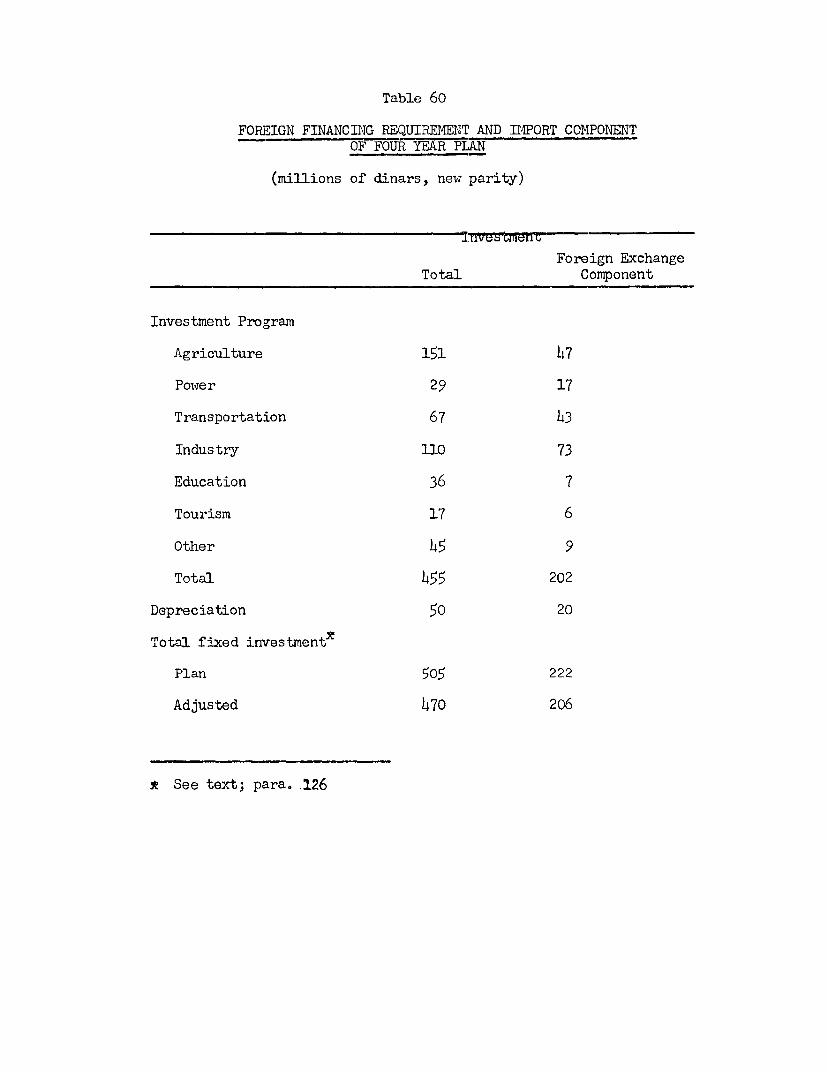
Table 60
FOREIGN FINANCING REQUIREMENT AND IMPORT COMPONENTOF FOUR YEAR PLAN
(millions of dinars, new parity)
Foreign ExchangeTotal Component
Investment Program
Agriculture 151 47
Power 29 17
Transportation 67 43
Industry 110 73
Education 36 7
Tourism 17 6
Other 45 9
Total 55 202
Depreciation 50 20
Total fixed investmentt
Plan 505 222
Adjusted 470 206
s See text; para. 126

Table 61
TUNISIA - ESTIMATED CONTRACTUAL SERVICE PAYMENTS ON EXTERNAL MEDIUM- ANDLONG-TERM PUBLIC DEBT OUTSTANDING INCLUDRIG UNDISBURSED AS OF DECEMBER 31, 1964
WITH MAJOR REPORTED ADDITIONS JANUARY 1 - JANUARY 31, 1965 /
Debt Repayable in Foreign Currency
(In thousands of U.S. dollar equivalents)PAGE 1
GRAND TOTAL
DEBT OUTST(BEGIN OF PERIOD) PAYMENTS DURING PERIOD
INCLUDING AMORTI-YEAR UNDISBURSED ZATION INTEREST TOTAL
1965 195,684 9,072 3,065 12,1371966 187,413 9,532 3,727 13,2591967 177,881 8,75L 3,813 12,5671968 169,127 8,896 4,o84 12,9801969 160,231 6,767 3,824 10,5921970 153,46 4 7,577 4,o59 11,6361971 145,886 7,58h 3,812 11,3961972 138,302 7,676 3,564 11,2401973 130,626 7,831 3,313 ,11, 441974 122,795 8,782 3,056 11,8381975 114,01J4 9,590 2,779 12,3701976 104,423 8,407 2,491 10,8991977 96,016 8,280 2,256 10,5361978 87,736 7,680 2,033 9,7131979 80,056 8,360 1,812 10,172
PUBLICLY-ISSUED BONDS
DEBT OUTST(BEGIN OF PERIOD) PAYMENTS DURING PERIOD
INCLUDING AMORTI-YEAR UNDISBURSED ZATION INTEREST TOTAL
1965 2,55'; 267 148 4161966 2,286 203 132 3351967 2,083 211 120 3311968 1,872 220 107 3271969 1,652 163 94 2571970 1,A89 173 84 2571971 1,316 183 74 2561972 1,134 194 63 2571973 940 202 52 2531974 738 149 40 1891975 589 158 31 1891976 431 105 22 1271977 326 56 16 731978 270 59 13 731979 211 26 10 37

TUNISIA - ESTIMATED CONTRACTUAL SERVICE PAYMENTS ON EXTERNAL MEDIUM- ANDLONG-TERM PUBLIC DEBT OUTSTANDING INCLUDING UNDISBURSED AS OF DECEMBER 31, 1964
WITH MAJOR REPORTED ADDITIONS JANUARY 1 - JANUARY 31, 1965 A (CONT.)
Debt Repayable in Foreign Currency
(In thousands of U.S. dollar equivalents)
PAGE 2
PRIV. -PLACED DEBTS - TOTAL
DEBT OIJTST(BEIGIN OF PERIOD) PAYM1ENTS DURING PERIOD
INCLIJDING AMORTI-YEAR UNDISPIURSED ZATION INTEREST TOTAL
1965 24,191 5,758 1,101 6,8591966 18,432 5,523 813 6,3361967 12,909 14,008 556 4,5641968 8,90g1 2,984 384 3,3681969 5,917 878 255 1,1331970 5,039 841 216 1,0571971 L4,198 841 179 1,0201972 3,357 841 141 9821973 2,516 838 103 9411974 1,678 838 66 9041975 840 838 28 8661976 2 2 - 2
SUPPLIERS CREDITS
DEBT OUTST(BEGIN OF PERIOD) PAYMENTS DURING PERIOD
INCLUDING AMORTI-YEAR UNDISBURSED ZATION INTEREST TOTAL
1965 7,024 2,925 358 3,2821966 14,099 2,690 192 2,8821967 1,1409 1,175 57 1,2331968 234 150 8 1591969 81 45 2 471970 39 7 1 81971 32 8 _ 81972 24 8 - 81973 16 5 _ 51974 12 5 _ 51975 7 5 - 51976 2 2 - 2

TUNISIA - ESTIMATED CONTRACTUAL SERVICE PAYMENTS ON EXTERNAL MEDIUM- ANDLONG-TERM PUBLIC DEBT OUTSTANDING INCLUDING UNDISBURSED AS OF DECEMBER 31, 1964
WITH MAJOR REPORTED ADDITIONS JANUARY 1 - JANUARY 31, 1965 /a (CONT.)
Debt Repayable in Foreign Currency
(In thousands of U.S. dollar equivalents)
PAGE 3
PRIV-PLACED DEBT-OTHER
DEBT OUTST(BEGIN OF PERIOD) PAYMENTS DURING PERIOD
INCLUDING AMORTI-YEAR UNDISBUR.SED ZATION INTEREST TOTAL
1965 17,167 2,833 743 3,5761966 14,333 2,833 621 3,45)1967 11,500 2,833 498 3,3311968 8,667 2,833 376 3,2091969 5,833 833 253 1,0861970 5,000 833 216 1,0491971 4,167 833 178 1,0111972 3,333 833 141 9741973 2,500 833 103 936197h 1,667 833 66 8991975 833 833 28 861
IBRD LOANS
DEBT OUTST(BEGIN OF PERIOD) PAYMENTS DURING PERIOD
INCLUDING AMORTI-YEAR UNDISBURSED ZATION INTEREST TOTAL
1965 7,000 -49 491966 7,000 - 206 206196 7 7,000 84 349 4331968 6,916 174 378 5521969 6,742 184 368 5521970 6,558 194 358 5521971 6,363 205 347 5521972 6,158 217 336 5521973 5,941 229 324 5521974 5,713 242 311 5521975 5,471 255 297 5521976 5,216 269 283 5521977 4,947 284 268 5521978 4,66:3 300 252 5521979 h,362 317 236 552

TUIISIA - ESTIMATED CONTRACTUAL SERVICE PAYMENTS ON EXTERNAL MEDIUM- ANDLONG-TERM PUBLIC DEBT OUTSTANDING INCLUDDN} UNDISBURSED AS OF DECEMBER 31, 1964
WITH MAJOR REPORTED ADDITIONS JANUARY 1 - JANUARY 31, 1965 / (CONT.)
Debt Repayable in Foreign Currency
(In thousands of U.S. dollar equivalents)
PAGE 4IDA CREDIT
DEBT OUTST(BEGIN OF PERIOD) PAYMENTS DURING PERIOD
INCLUDING AMORTI-YEAR UNDISBURSED ZATION INTEREST TOTAL
1965 5,000 _ 16 161966 5,oo0 - 33 331967 5,000 - 38 381968 5,000 - 38 381969 5,000 - 38 381970 5,000 - 38 381971 5,000 - 38 381972 5,000 25 38 631973 L4,975 50 37 871974 14,925 50 37 871975 4,875 50 36 861976 X,825 50 36 861977 4,775 50 36 861978 X,725 50 35 8519790 1,675 50 35 85
US GOVT. LOANS - TOTAL
DEBT OIJTST(BEGIN OF PERIOD) PAYMENTS DURING PERIOD
INCLUDING AMOXTI-YEAR UNDISBURSED ZATION INTEREST TOTAL
1965 59,191 381 421 8051966 59,607 605 999 1,6041967 59,002 563 1,152 1,7151968 58,439 566 1,177 1,7431965 57,87,3 518 1,145 1,6621970 57,355 306 1,119 1,4241971 57,050 276 1,103 1,3781972 56,774 280 1,087 1,3671973 56,494 306 1,072 1,3781?714 56,188 1,209 1,054 2,2631975 514,979 1,740 1,016 2,7561976 53,239 1,719 973 2,6921977 51,519 1,572 932 2,5041978 O9,948 1,472 904 2,3761979 48,475 1,497 878 2,375

TUNISIA - ESTIMATED CONTRACTUAL SERVICE PAYMENTS ON EXTERNAL MEDIUM- ANDLONG-TERM PUBLIC DEBT OUTSTANDING INCLUDING UNDISBURSED AS OF DECEMBER 31, 1964
WITH MAJOR REPORTED ADDITIONS JANUARY 1 - JANUARY 31, 1965 a (CONT.)
Debt Repayable in Foreign Currency
(In thousands of U.S. dollar equivalents)
PAGE _
LOANS FROM OTHER GOVTS.-TO
DEBT OUTST(BEGIN OF PERIOD) PAYMENTS DURING PERIOD
INCLUDING AMORTI-YEAR UNDISBURSED ZATION INTEREST TOTAL
1965 94,275 2,437 1,272 3,7091966 91,839 2,768 1,452 4,2201967 89,071 3,456 1,519 14,9751968 85,615 14,542 1,931 6,4731969 81,073 4,679 1,867 6,5461970 76,394 5,860 2,196 8,0561971 70,534 5,876 2,029 7,9051972 64,658 5,916 1,863 7,7791973 58,742 6,002 1,695 7,6971974 52,739 6,090 1,525 7,6151975 46,649 6,346 1,352 7,6971976 40,303 6,058 1,165 7,2221977 34,246 6,115 997 7,1121978 28,131 5,798 828 6,6261979 22,333 6,470 653 7,123
US GOVT. LOAN - EXIM
DEBT OUTST(BEGIN OF PERIOD) PAYMEENTS DURING PERIOD
INCLUDING AMORTI-YEAR UNDISBURSED ZATION INTEREST TOTAL
1965 4,091 357 211 5711966 3,73L4 550 209 7591967 3,184 504 170 6741968 2,680 504 142 6461969 2,176 452 113 5651970 1,724 236 91 3271971 1,1488 202 79 2811972 1,286 202 68 2701973 1,08L 224 57 2811971 86c) 215 b4 2891975 615 2L6 30 2761976 369 216 17 2631]977 123 123 3 126

TUNISIA - ESTIMATED CONTRACTUAL SERVICE PAYMENTS ON EXTERNAL MEDIUM- ANDLONG-TERM PUELIC DEBT OUTSTANDING INCLUDIN UNDISBURSED AS OF DECEMBER 31, 1964
WITH MAJOR REPORTED ADDITIONS JANUARY 1 - JANUARY 31, 1965 / (CONT.)
Debt Repayable in Foreign Currency
(In thousands of U.S. dollar equivalents)
PAGE 6
US GOVT. LOAN - OTHER
DEBT OUTST(BEGIN OF PERIOD) PAB!ENTS DURING PERIOD
INCLUDING AMORTI-YEAR UNDISBURSED ZATION INTEREST TOTAL
1965 55,100 27 207 2341966 55,873 55 790 8451967 55,818 59 982 1,0411968 55,759 62 1,035 1,0971969 55,697 66 1,032 1,0971970 55,6:31 70 1,028 1,0971971 55,562 74 1,024 1,0971972 55,488 78 1,019 1,0971973 55,4:LO 82 1,015 1,097197) 55,328 964 1,010 1,9741975 54,364 1,494 986 2,4801976 52,870 1,1473 956 2,4291977 51,396 1,449 929 2,3781978 49,948 1,472 904 2,376:1979 48,475 1,497 878 2,375
SEIO-SOVIET LOANS
DEBT OUTST(BEGIN OF PERIOD) PAY14ENTS DURING PERIOD
INCLUDING AMORTI-YEAR UNDISBURSED ZATION INTEREST TOTAL
1965 3,1474 226 58 2831966 3,248 432 92 5251967 2,816 432 81 5131968 2,383 410 69 4791969 1,973 345 58 4031970 1,628 204 49 2521971 1,425 204 43 2461972 1,221 204 37 2401973 1,018 204 31 2341974 81L 204 24 2281975 611 204 18 2221976 407 20L 12 2161977 204 204 6 210

TUNISIA - ESTIhIATED CONTRACTUAL SERVICE PAYMENTS ON EXTERNAL MEDIUM- ANDLONG-TERM PUBLIC DEBT OUTSTANDING INCLUDING UNDISBURSED AS OF DECFMBER 31, 1964
WITH MAJOR REPORTED ADDITIONS JANUARY 1 - JANUARY 31, 1965 A (CONT.)
PAGE 7
a Includes service on all debt listed in Table la preparedSeptember 10, 1965 except privately-placed debt totaling$8,1441,OOO for which the amortization terms are not available.
Statistics DivisionIBRD-Economics Department
September 10, 1965

Table 62-
PROJECTED NET CAPITAL FORNATION IN PRE-PLAN, 1962-1964,J REARRANGED TO FIT NATIONAL ACCOUNTS CATEGORIES(in tOQO of 1957 dinars)
Total1962 - 1964 1962 1963 1964
00 Agriculture 114i,79 30,268 38,470 45,941Agriculture pe se 78,208 21,937 25,230 31,041Agricultural water works 34,971 7,831 12,740 14,400Fisheries 1,500 500 500 500
10,21,31-37 Industry, handicrafts 52,061 16X061 18,OOD 18,OCDHandicrafts 3.,000 1,000 1, 000 1,000Industry 49,061 15,061 17vOO0 17,000
22,23 Electricity, water 12,075 3,671 4,130 4,274Electrical energy 8,000 1 810 2,890 3,300Urban water works 4,075 1,861 1,240 974
50 Building, public works
60 Transport 23,472 8,091 8,855 6,52671 Housing, urbanism 19,699 7a516 6,964 5,219
72 Other services 9,844 4 939 2,730 2,175Public health 1,572 ~1E7 660 505Thermalism 1,575 485 570 520Tourism 6S397 3,827 1,500 1,C7 )
81 Adrinistration 38413 11,232 13,903 12 978Administrative buildings 5,200 2,707 1,40 1v0Youth and sports 14,660 1,336 1, 764 1,560Formation des cadres 28,253 7,189 10;96 10,368
TOTAL net investment 269,943 81,977 93,002 94,964Depreciation 60,057Total gross investment 330,000
Source: Plan Triennal 1962 - 196L42 pi, 22 (corrected),

Table 63
FSTIMATED BPEAKDOWN OF NET INVESTMENTS IN 4-YEAR PLAN, 1965 - 1968,IN CURRIENT AND CONSTANT 1960 PRICES WITH KEY TO NATIONAL ACCOUNTS CLASSIFICATION
4-Year Plan, 1965 - 1968 1 4-Year Plan, 1965 - 196IFour-Year Plan, Vol. 1, chapter III I (nNote relative au Plan quadr.')1 ~ Estimated in 1960In 1960 prices J In current prices prices (using impli-Plan quadriennal National accounts ('000 dinars) In current prices Implicit J ('000 dinars) cit price index)categories categories (p. 35 Annex 2) ('000 dinars, p. 43) price index I (note relative pp. 3-5) (million dinars)
Agriculture 00 Agriculture 119,000 142,500 119.7 150,500 125(151,001)Industry 128 625 150,500 117.0 151 000 129Mining 32 Mining 114.7 1 ,2Mfg. (excl. petrol. prod.) 10,31,33-37 64,835 132.7 76,024 66Power (incl. petrol. prod.) / 21,22 Elect., petrol. prod. 34,380 117.8 40,500 34Tourism and thermalism 72 Other services 11,560 111.5 12,890 12Handicrafts Unspecified 3,400 147.5 5,015 3
Formation des cadres 81 Admin. 36,375 43,600 119.8 43, 6 00 36Infrastructure V (96,000) (118,400) 123.3 (110,000) (90)Transport, telecommunications / 60 Transp. .- 5- 45
123.3Collective equipment / .. 63,400 5 45Public health 72 .. ,Housing, urbanism 71 .. 16,800 14Urban waterworks 23 .. 8,000 6Other:
Bldg. for admin. 81 7,200 7,200 6Rural housing xx 8,000 - -Mis. govt. 81 16,750 14
TOTAL 380,000 _Lq0O0 119 .7 455,000 380
(455,100)
Notes: 1/ Power: 40.5 34Petroleum products (petrol., gas) 19.5 1Electricity, nuclear energy 21.0 18
2/ Transport + collective equipment = infrastructure.
.. Not available.

Table 6h
ESTSIATED BREAKDOWN OF NET INVESTMENTS BY SECTOR IN 4-YEAR PLAN ACCORDING TO NATIONAL ACCOUNTS CLASSIFICATION(in millions of 1960 and current dinars)
1965 - 1968Acc. to Four-Year Plan i Acc. to "Ncte rela- JVol. 1, chapter III A tive au Plan Quadr." J
I using pricel A(P. 35) (po 43) a indexes I (pp.3-5) S Percent1960 curro 1 1960 J curr, e 1960 curr.
prices prices I -rices A prices i prices
00 Agriculture 119.0 142.5 125 1/ 150.5 1/ 32.9 33.110121,3137 Industry, handicraft ____ O 9705 21 U 2] s4
Mining .. -16.5Mfg.(excl. petrl. prod.) 2/ 64.8 66 76.0Handicrafts 3.4 *0 3 5.0
22,23 Electricity, water 0@ ee 40 48.5 10.5 10.7Elec. energy & petrl. prod. 2/ 34Th 37 4005Urban waterworks .. 6 8.0
50 Building, public works k- -s60 Transport, telecommunications .. 55T 43 55e0 11.9 12.171 Housing and urbanism c. .. __ T7o 3.7 3.772 Other services t. 17 19.1 17TC _7
Public health as 5 7..2Tourism, thermalism 11.6 .. 12 12.9
81 Administration .. .. 56 67.6 14.7 14.8Admin. bldgs. . ., 7.2Misc. govt. -. s.s 14 16.8Formation des cadres 36c4 43,6 36 43.6
TOTAL net investment 380.0 455.0 380 455,0 100.0 100.0
Notes: / Including rural housing.2/ Adjustment for petroleum products:
Petroleum products (16) (19.5)10,21,31,37 Industry, mining (incl. petrl. prod,) 99 117.0 26.0 25.7
Mfg. (incl. petrl, prod.) 95. 522,23 Electricity, water (excl. petrl. prod.) 24 29,0 6,3 6.4
Electricity (exclh petrl. prod.) : 21,0Scurce: Dorived from Table 63

Table 6
PUBLIC ENTERPRISESRECEIPTS AND EXPENDITURES - 1963
(thousands of dinars)
Receipts -Branch and Enterprise Receipts Expenditures Expenditures
Agriculture: 634Office des Terres Domaniales 2.734 2.028 706Domaine Agricole Sfax Gafsa 507 166 341Office de Motoculture 801 781 21Office de la Medjerda -- 379 - 379Office des Souassis 17 72 - 55
Agricultural Industries: 1.725Office des Pgches 1.709 1.811 - 102Soci6t6 Tunisienne de Sucre 5.174 4.655 519Office Nationale de l'Huile 10.227 8.918 1.308
Petroleum Products: 34Societe d'Etudes et de Recherche
de Petrole en Tunisie (SEREPT) 954 920 34SITEP 2.077 2.077 -
Electricity: 698STEG 7.082 6.384 698
Construction Materials: 577Ciment Portland de Bizerte ... 298Ciment Artificiel Tunisien 2.254 1.995 258Soci6t6 de Bgtiment 1.862 1.841 21
PIining: 436COTUSAL ... ... 73Sfax-Fafsa (phosphates) ... ... 641CIPHOS 1.702 1.651 51STEPHOS (phosphates) 698 702 - 3Office National des Mines . . -326
Mechanical and Electrical Industries: 26Soci6t6 Tunisienne d'Accumulateurs 201 181 19Soci6t6 Tunisienne de l'IndustrieAutomobilistique 1.110 1.186 7
.../page 2
Source: Secretaire d'Etat au Plan et A l'Economie Nationale,Investissements en Tunisie, 1960-1963.

Table 65 (continued)
Branch and Enterprise Receipts Expenditures Receipts -Expenditures
Chemicals: 522Societ6 Tunisienne d'Engrais
Pulveris6 l.b71 1.447 24SIAPE 4.090 3.625 465SOTEMU 239 213 16Raffinerie Tunisienne de Soufre 164 157 7
Textile, Clothing, Leather: 411SCGICOT (cotton) 2.279 2.270 9SOGIL (wool) 620 512 108Centre Tunisien de Tricotage 130 118 12Tannerie de Manouba 517 350 167Office Nationale de l'Artisanat 995 880 115
Woodworks: 57Soci6t6 Nationale de Liege 4.61 404 57
Paper:Societ6 Nationale de Cellulose 1.519 1.998 - 479
Transport: 376SNCFT (railways) 5.470 5.628 - 158Tunis-Air 2.297 1.974 323Compagnie Tunisienne de
Navigation 3.64h 3.695 - 51Societe Nationale des Trans-
ports ... ... 60Societe Regionale - Kef 171 l!12 29
Sfax 713 646 67Cap Bon 367 323 44
Soci6t6 TunisienneAcconage et de Manutention 30h 242 62
Housing: 15Societe Nationale Immobiliere
de Tunisie .. ... 15
Banking and Insurance: 1.147Banque Nationale Agricole ... ... 134Ste. Tunisienne de Banques ... 785St6. Nationale d'Investissements 39 31 7Banque Centrale de Tunisie ... 158STAR (insurance) 2.350 2.287 63
Total ... 6.179
Source: Secr6taire d'Etat au Plan et a l'Economie Nationale,Investissements en Tunisie, 1960-1963.