Workshop Matlab/Simulink in Drives and Power …€¦ · – 6 Induction Motor Inverter Control –...
24
Palestine Polytechnic University Workshop Matlab/Simulink in Drives and Power electronics – Lecture 5 18-21 May 2009 / 24 Workshop Matlab/Simulink in Drives and Power electronics Lecture 5 : Introduction to Stateflow/Statechart 1 Ghislain REMY Jean DEPREZ
Transcript of Workshop Matlab/Simulink in Drives and Power …€¦ · – 6 Induction Motor Inverter Control –...

Palestine Polytechnic University
Workshop Matlab/Simulink in Drives and Power electronics – Lecture 518-21 May 2009 / 24
WorkshopMatlab/Simulink in Drives
and Power electronics
Lecture 5 : Introduction to Stateflow/Statechart
1
Ghislain REMY Jean DEPREZ

Palestine Polytechnic University
Workshop Matlab/Simulink in Drives and Power electronics – Lecture 518-21 May 2009 / 24
Workshop Programe• 8 lectures will be presented based on Matlab/Simulink :
– 1 Introduction to Matlab
– 2 Introduction to Simulink
– 3 DC-Motor Control design
– 4 DC-Motor Chopper design SimPowerSystems
– 5 Introduction to Stateflow/Statechart
– 6 Induction Motor Inverter Control
– 7 Synchronous Motor Modeling
– 8 Synchronous Motor Control
• Two system applications (four quadrants electric drives of mechanical systems) will be used as “guidelines" during the workshop.
2

Palestine Polytechnic University
Workshop Matlab/Simulink in Drives and Power electronics – Lecture 518-21 May 2009 / 24
Stateflow/Statechart• States can be added using blocks
• To copy a State:– Hold the Right Click
and move to Copy
• To create Transitions:– Close to a state frame,
– Left Click and Hold
– Move over an other state
– Release the Left click
3

Palestine Polytechnic University
Workshop Matlab/Simulink in Drives and Power electronics – Lecture 518-21 May 2009 / 24
Stateflow/Statechart InterfaceIn the Stateflow Editor, you can: draw, zoom, modify, print, and
save a chart shown in the window.• Title bar: The full chart name appears here in model name/chart name* format.
The * appears for an unsaved chart only
• Menu bar: to access to editor commands
• Toolbar: Buttons of the editor commands as:cut, copy, paste… by placing your pointer over it, an identifying tool tip appears.
• Object palette: Displays tools for drawing states, transitions, and state chart objects.
• Drawing area: Zone to edit the chart.
• Zoom control
• Shortcut menus: Pop up display commands when you right-click an object.
• Status bar: Displays tool tips and status information
4

Palestine Polytechnic University
Workshop Matlab/Simulink in Drives and Power electronics – Lecture 518-21 May 2009 / 24
Differentiating Syntax Elements in the StateflowYou can the option of using color highlighting to differentiate the
syntax elements in the Stateflow action language:
Keyword, Comment, Event, Graphical function, String, Number
5

Palestine Polytechnic University
Workshop Matlab/Simulink in Drives and Power electronics – Lecture 518-21 May 2009 / 24
Selecting and Deselecting Graphical Objects• Select objects in the Stateflow Editor as follows:
– To select an object, click anywhere inside of the object.
– To select multiple adjacent objects, click and drag a selection box so that the box encompasses or touches the objects you want to select, and then release the mouse button.
– To select multiple separate objects, simultaneously press the Shift key and click an object or box a group of objects.
– To select all objects in the Stateflow chart, from the Edit menu select Select All.
– To deselect all selected objects, press the Esc key. Pressing the Esc key again displays the parent of the current chart.
6

Palestine Polytechnic University
Workshop Matlab/Simulink in Drives and Power electronics – Lecture 518-21 May 2009 / 24
Zooming with Shortcut Keys• This table is a summary of the shortcut keys you can use to
perform some of the zooming operations described above:
• Moving in Zoomed Charts with Shortcut Keys: You can also use number keys to move in zoomed charts according to their layout in the number keypad:
7

Palestine Polytechnic University
Workshop Matlab/Simulink in Drives and Power electronics – Lecture 518-21 May 2009 / 24
Keyboard Shortcuts for Stateflow Charts
8

Palestine Polytechnic University
Workshop Matlab/Simulink in Drives and Power electronics – Lecture 518-21 May 2009 / 24
Model Browser
9

Palestine Polytechnic University
Workshop Matlab/Simulink in Drives and Power electronics – Lecture 518-21 May 2009 / 24
Data Properties
10

Palestine Polytechnic University
Workshop Matlab/Simulink in Drives and Power electronics – Lecture 518-21 May 2009 / 24
• Goal: Define a Transition based on an Event Input– Click Add menu,
– Select Event, then
Input from Simulink
– Change name to SWITCH
– Select Either as Trigger
– So SWITCH change from blue to yellow Color
– An Event Port is now added
to the Chart (a vector Port)
Creating an Event input
11

Palestine Polytechnic University
Workshop Matlab/Simulink in Drives and Power electronics – Lecture 518-21 May 2009 / 24
Types of Events• An explicit event is an event defined as:
• Use events when you want to do:– Activate a Simulink triggered subsystem
– Activate a Simulink function-call subsystem
– Trigger actions in parallel states of a Stateflow chart 12

Palestine Polytechnic University
Workshop Matlab/Simulink in Drives and Power electronics – Lecture 518-21 May 2009 / 24
Defining Simultaneous Action• Goal: Define two Simultaneous Sub-States
– Select the PowerOn Action
– Right Click on a the frame
– Select Decomposition
– And finally Parallel (AND)
– Both Fan1 and Fan2 frameschange from continuous to dotted line style
– Now Both States can be
Turn On or Off
at the same time
13

Palestine Polytechnic University
Workshop Matlab/Simulink in Drives and Power electronics – Lecture 518-21 May 2009 / 24
Creating a Subchart• You create a subchart by converting an existing state, box, or
graphical function into the subchart. To convert a new or existing state, box, or graphical function to a subchart: – Select the object and right-click a state to display the menu
– Click Make Contents, and then Subcharted
14

Palestine Polytechnic University
Workshop Matlab/Simulink in Drives and Power electronics – Lecture 518-21 May 2009 / 24
Use Implicit Events• Implicit events are built-in events that occur when a chart
executes:– Chart waking up
– Entry into a state
– Exit from a state
– Value assigned to an internal data object
15
Examples:enter(switch_on)en(switch_on)change(engine.rpm)

Palestine Polytechnic University
Workshop Matlab/Simulink in Drives and Power electronics – Lecture 518-21 May 2009 / 24
Examples of Implicit Events• Fan and Heater are parallel (AND) superstates.
– The first time that an event awakens the Stateflow chart, the states Fan.Off and Heater.Off become active.
• Assuming that it is a discrete-time simulation,– Each time that the chart awakens, a tick event broadcast occurs.
– After four broadcasts, the transition from Fan.Off to Fan.On occurs.
– After three broadcasts,the transition from Heater.Off to Heater.On occurs.
16

Palestine Polytechnic University
Workshop Matlab/Simulink in Drives and Power electronics – Lecture 518-21 May 2009 / 24
Defining Action Types• Different action types are possible:
– entry, during, exit, bind, and on event_name actions.
• The actions for states are assigned using label notation:– name/
– entry:entry actions
– during:during actions
– exit:exit actionsbind:data_name, event_name
– on event_name:on event_name actions
17

Palestine Polytechnic University
Workshop Matlab/Simulink in Drives and Power electronics – Lecture 518-21 May 2009 / 24
Examples of Action Types
18

Palestine Polytechnic University
Workshop Matlab/Simulink in Drives and Power electronics – Lecture 518-21 May 2009 / 24
Transition Action Types• Transitions have different action types, which include
– event triggers, conditions, condition actions, and transition actions.
• The actions for transitions are assigned using label notation : event_trigger[condition]{condition_action}/transition_action
19
If the Stateflow chart wakes up:1. The default transition to state A occurs.2. The entry action id = x+y executes.3. The event time_out binds to state A.4. State A is active.
If state A is active and the Stateflow chart receives the event event2:1. The exit action broadcast of the event
time_out executes.2. State A becomes inactive.3. The transition action data1 = 5 executes.4. State B becomes active.

Palestine Polytechnic University
Workshop Matlab/Simulink in Drives and Power electronics – Lecture 518-21 May 2009 / 24
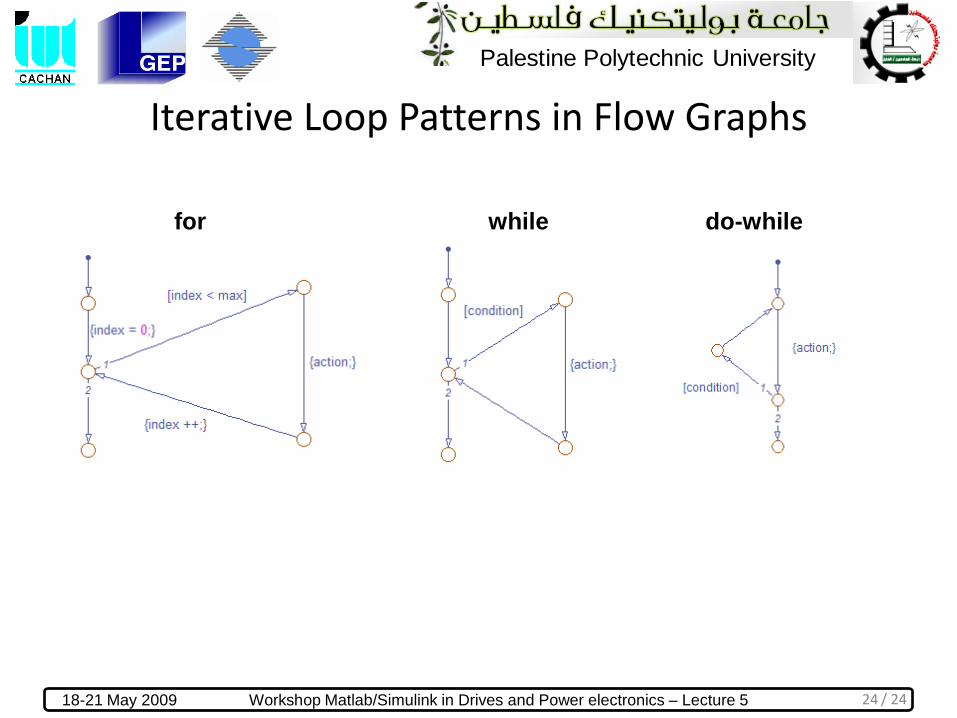
Modeling Logic Patterns and Iterative Loops
• What Is a Flow Graph?– A flow graph is a graphical construct that models logic patterns by
using connective junctions and transitions. The junctions provide decision branches between alternate transition paths. You can use flow graphs to represent decision and iterative loop logic.
– Examples of a if-else logic:
20
Using Flow Graphs

Palestine Polytechnic University
Workshop Matlab/Simulink in Drives and Power electronics – Lecture 518-21 May 2009 / 24
Best Practices for Creating Flow Graphs
21
• Follow these best practices to create efficient, accurate flow graphs:– Only one default transition: Flows graphs
should have a single entry point.
– Provide an unconditional transition from every junction except the terminating junction:
• This guideline ensures that unintended backtracking behavior does not occur in a flow graph. Otherwise, a warning message appears.
– Only one terminating junction for readability
– Converge all transition paths to the terminating junction
– Use condition actions to process updates, not transition actions• Flow graphs test transitions, but do not execute them
(and, therefore, never execute transition actions).

Palestine Polytechnic University
Workshop Matlab/Simulink in Drives and Power electronics – Lecture 518-21 May 2009 / 24
About Flow graphs• A flow graph cannot maintain its active state between
updates. As a result, a flow graph always begins executing from a default transition and ends at a terminating junction(a junction that has no valid outgoing transitions).
• Use flow graphs to represent flow logic in graphical functions or between states in a chart. A best practice is to encapsulate flow graphs in graphical functions to create modular, reusable decision and loop logic that you can call anywhere in a Stateflow chart
22

Palestine Polytechnic University
Workshop Matlab/Simulink in Drives and Power electronics – Lecture 518-21 May 2009 / 24
Decision Logic Patterns in Flow Graphs
23
if
if-else
if-elseif if-elseif-else
Palestine Polytechnic University
Workshop Matlab/Simulink in Drives and Power electronics – Lecture 518-21 May 2009 / 24
Iterative Loop Patterns in Flow Graphs
24
for while do-while