Worksheets for Analyzing and Planning • Your Dairy Farm...
34
Your Dairy In Transition • Ag. Eng. 123SR942 A.R.M.E. E.B. 94-19 Animal Science Mimeo #177 A Planning Process for . Considering Dairy Farm Expansion * Appendix * Worksheets for Analyzing and Planning Your Dairy Farm Expansion • Developed by Faculty and Staff Cornell Cooperative Extension •
Transcript of Worksheets for Analyzing and Planning • Your Dairy Farm...

Your Dairy In Transition
• Ag. Eng. 123SR942 A.R.M.E. E.B. 94-19 Animal Science Mimeo #177
A Planning Process for . Considering Dairy Farm Expansion
* Appendix * Worksheets for Analyzing and Planning
Your Dairy Farm Expansion
• Developed by Faculty and Staff
Cornell Cooperative Extension
•

Workbooks in this series include:
~ Your Fann and the Industry
~ A Planning Process for Considering Dairy Farm Expansion
~ Winding Down Your Fann Operation
For Additional copies of Your Dairy in Transition Workbooks contact:
Cornell University Media Services Resource Center Building 7 Business and Technology Park Ithaca, NY 14853
Phone: (607) 255-2080 Fax: (607) 255 9946 Electronic Mail: [email protected] •
Cornell Cooperative Extension provides equal program and employment opportunities. No person shall be denied admission to any educational program or activity or be denied employment on the basis of any legally prohibited discrimination involving, but not linlited to such factors as race, I color, creed, religion, national or ethnic origin, sex, age or handicap. NYSl1 College of Agriculture and Life Sciences, NYS College of Human Ecology, and NYS College of Veterinary Medicine at Cornell University, Cooperative Extension associations, county governing bodies, and U.S. Department of Agriculture, cooperating.
The infonnation given herein is for education purposes only. References to commercial products or trade names is made with the understanding that no discrimination is intended and no endorsement by Cornell Cooperative Extension is implied.

• Your Dairy in Transition...
A Planning Process for Considering Dairy Farm Expansion
* Appendix*
Worksheet for Analyzing and Planning Your Dairy Farm Expansion
Developed by Cornell Cooperative Extension
Faculty and Staff
• August 1994

Your Dairy in Transition Table of Contents
A Planning Process for Considering Dairy Farm Expansion Appendix •
Worksheet 1-2. Farm Business Perfonnance Calculations . . . . . . . . . . . . . . . . . . . . . . . . . . . . . . . . . .. 1 Worksheet 1-3. Farm Business Perfonnance Trends Worksheet 2 Worksheet 1-4. Farm Business Perfonnance Analysis Worksheet. . . . . . . . . . . . . . . . . . . . . . . . . . . . . . . . . . . . . .. 3 Worksheet 3-2. Your Dairy in Transition 4 Worksheet 2-6. Organizational chart after expansion 5 Worksheet 3-1. Factors to consider in farmstead planning 6 Worksheet 3-2. Estimating costs for housing the milking herd 7 Worksheet 3-3. Estimating cost of dry cow facilities . . . . . . . . . . . . . . . . . . . . . . . . . . . . . . . . . . . . . . . . . . . . . .. 8 Worksheet 3-4. Estimating cost of heifer facilities . . . . . . . . . . . . . . . . . . . . . . . . . . . . . . . . . . . . . . . . . . . . . . . .. 9 Worksheet 3-5. Estimating cost for milking center 10 Worksheet 3-6. Amount of forage to be stored . . . . . . . . . . . . . . . . . . . . . . . . . . . . . . . . . . . . . . . . . . . . . .. 11 Worksheet 3-7. Bunker silo dimensions 12 Worksheet 3-8. Bunker silo feedout rate 13 Worksheet 3-9. Cost of forage storage. . . . . . . . . . . . . . . . . . . . . . . . . . . . . . . . . . . . . . . . . . . . . . . . . . . . . . .. 14 Worksheet 3-10. Sizing mixer for total mixed ration . . . . . . . . . . . . . . . . . . . . . . . . . . . . . . . . . . . . . . . . . . . . . .. 15 Worksheet 3-11. Estimated size and cost of commodity storage 16 Worksheet 3-12. Estimated costs for manure handling components 17 Worksheet 3-13. Summary of facilities costs 18 Worksheet 4-1. Summary of proposed change . . . . . . . . . . . . . . . . . . . . . . . . . . . . . . . . . . . . . . . . . . . . . . . . . .. 19 Worksheet 4-2. Current balance sheet and net worth analysis 20 Worksheet 4-3. Projected balance sheet and net worth analysis after proposed change 21 Worksheet 4-4. Estimating expenses 22 Worksheet 4-6. Farm repayment ability. . . . . . . . . . . . . . . . . . . . . . . . . . . . . . . . . . . . . . . . . . . . . . . . . . . . . . .. 23. Worksheet 4-7. Summary of financial worksheets " 24 Worksheet 4-8. Planning the transition achieve to proposed change. . . . . . . . . . . . . . . . . . . . . . . . . . . . . . . . . . .. 25 Worksheet 4-8. Planning the transition to achieve the proposed change 26 Worksheet 5-1. Estimated yearly feed needs vs. feed produced. . . . . . . . . . . . . . . . . . . . . . . . . . . . . . . . . . . . . . .. 27 Worksheet 5-2. Calculate the Ratios of Com Silage and Haycrop Dry Matter 28
Consumed to Total Forage Dry Matter Consumed for all Cattle on a Dairy Farm. 29 Worksheet 5-4. Water Worksheet 30
• i

----
Your Dairy In Transition Page 1
•
Worksheet 1-2. Farm Business Performance Calculations
1) Average Number of cows from DHI records or Number of cows beginning of year + number of cows end of year
2 = _____ Avg. # of cows
2) Number of heifers beginning of year + number of heifers end of year 2
= _____ Avg. # of heifers
3) Total pounds of milk sold for the year Average number of cows in a year
= _____milk sold per cow, Ibs
4) Average number of cows for the year * Number of full time workers
= ----- ______ cows per worker
5) Total pounds milk sold for the year * Number of full time workers
= ______ milk sold per worker
• Number of full time workers - needs to be calculated for each worker
No. of hourslweek x 4.3 weeks/month 230 hours
X No. of months worked = Full time months
Total full time months 12 No. of full time workers per year
6) Total accrual operating expenses $ +Expansion livestock expense + =Accrual operating expenses including expo Livestock
_ _
= $----
7) Total accrual receipts $ - Accrual milk sales = Accrual receipts less milk sales = = Operating cost of producing milk
(Operating expo inc!. expo livestock - reciepts less milk sales)
_
= $----
+ Hundredweights of milk sold = Operating cost per hundredweight of producing milk = $
8) Grain and concentrate as a % of milk sales = Total grain and concentrate expense = %Milk sales
9) Total farm receipts $-----Total farm operating expenses =Net farm income without appreciation = $----
10) Debt to asset ratio = Total farm liabilities = = Total farm assets
11) Farm debt per cow - Total farm liabilities -Number of cows (end of year)

Page 2 Your Dairy In Transition
Worksheet 1-3. Farm Business Performance Trends Worksheet •
Business Factors Year Comments
19- 19- 19- 19- 19-Size of Business
Average No. of cows
Average No. of Heifers
Milk sold, Ibs
Rates of Production
Milk sold per cow, Ibs
Labor Efficiency
Cows per worker
Milk sold per workers, Ibs
Cost Control
Operating cost of producing milk/cwt.
Grain and concentrate as a % of milk
Profitability
Net farm income without appreciation
Financial Stability
Debt to asset ratio
Farm debt per cow
•
•

Your Dairy In Transition Page 3
~......--------------~ Worksheet 1-4. Farm Business Performance Analysis Worksheet
Areas in the business that need improving before considering farm expansion
Farm expansion has potential but can be improved with better management
Size of Business
Average No. of cows decreasing remaining the same
Average No. of heifers· decreasing remaining the same
Total Milk sold, Ibs. decreasing remaining the same
Rates of Production
Milk sold per cow, Ibs·· < 17,000 17,000 - 20,000
Labor Efficiency
Cows per worker < 30 36 - 40
Milk sold per worker, Ibs decreasing remaining the same
Cost Control
Operating cost of producing milk/cwt.
> $11.00/cwt $10.00 - 11.00/cwt
Grain and concentrate as a % of milk sales
> 32% 28 - 32%
Profitability
Net farm income without appreciation
decreasing remaining the same
Financial Summary
Deb- to-asset ratio > 40% 30 - 40%
Farm debt/cow > $2500 $1500 - 2500
Excellent position to consider farm expansion
increasing
increasing
increasing ,
> 20,000
> 40
increasing
:5 $10.00/cwt
< 28%
increasing
< 30%
< $1500
Average number of heifers rating applies to farms who raise own replacements and do not continually purchase additional young stock Large breed

Page 4 Your Dairy In Transition
Worksheet 3-2. Your Dairy in Transition
Vision & Mission
Using the analysis on the previous page, prepare a brief (maximum 4 sentences or 50 words) statement which describes the vision for and mission of your farm business.
•
•
•

Your Dairy In Transition Page 5
~~--~~~~~~~----~ • Worksheet 2-6. Organizational chart after expansion
L--~~--_~j
----! General Manager
~__JI
-_._----
I l I-Operations I
LManager i . ..-J
-I~-l i lt--\/-\ ;--)/- )\ / \e-_J ~.~ L~

Page 6 Your Dairy In Transition
Worksheet 3-1. Factors to consider in farmstead planning •Directions: Check when completed or evaluated.
Is an adequate supply of potable water available?
Does the proposed farm site contain adequate surface and subsurface drainage? Will substantial site work be required to provide adequate drainage?
Are off-farm factors present, such as rural housing or urban development, which may limit the site development?
Can the facilities be oriented to achieve maximum efficiency in animal traffic, manure management, and feed storage and delivery?
Is adequate room available for driveways, access roads, snow removal, and road right-ofways?
Is three-phase electrical power available from your power supplier?
Do the proposed buildings and sites allow for major growth in the future of the farm?
Has an agricultural waste management plan been developed for the farm site by the Soil Conservation Service (SCS)?
Can livestock and other farm buildings be located downwind of farm houses, neighbors or adjacent? • Are local planning or zoning laws in effect that will impact upon the farm plan?
Will building permits need to be obtained prior to starting the project?
Have building plans been submitted to your milk inspector for approval?
•

----- -----
Your Dairy In Transition Page 7
.~--------------~Worksheet 3-2. Estimating costs for housing the milking herd
How many additional milking cows are you planning for?
What are the expected weights of cows? minimum maximum
Will stalls be tie stalls, free stalls, or other?
Why?
With additional housing, how many groups will there be?
How many stalls will there be in each group?
Cost Estimate*
Housing type Cost per stall Number of Low High stalls
• Tie stall barn $1,500 to $2,500 x _ = =
X _Free stall barn $ 800 to $1,200 =----- =----
*Place the total cost here and on line 1 of Worksheet 3-12.
•

Page 8 Your Dairy In Transition
Worksheet 3-3. Estimating cost of dry cow facilities
How many dry cows will you have? (you may assume 20% of the herd)
Will you need additional dry cow facilities? If NO go to If YES next complete this worksheet worksheet
How many dry cows will be housed in new facilities?
How many dry cow groups will you have?
Cost estimate
Housing type
Cost per cow Number of cows
Low High
Free stall and feed area
Bedded pack and feed area
$600 to $1,100
$500 to $ 900
$---- $---
Total cost*
* Place here and on line 2 Worksheet 3-12
$---- $---
•
•

---
---
---
---
Your Dairy In Transition Page 9
Worksheet 3-4. Estimating cost of heifer facilities
What is the total number of heifers needed to provide replacements for this herd? (Actual number or estimate from Table 3-1 on the next page)
Will you need additional facilities for heifers? If NO go to If YES complete next this worksheet worksheet
How many heifers will be housed in the new facility?
Number of calves on milk
Number of weaned calves up to one year of age
Number of yearlings and bred heifers
Cost estimate
Animal type Cost per Number animal of
animals Low High
Calves on milk $100 to $300 X =$ =$
Calves to 1 year $300 to of age $600 X = = Yearlings & bred $400 to heifers $800 X = =
Total cost* =$ =$
*Place here and on line 3 of worksheet 3-12
•

Page 10 Your Dairy In Transition
Worksheet 3-5. Estimating cost for milking center
Do you need to consider If NO go to next If YES complete • a different milking system? worksheet this worksheet
What type of milking system are you planning?
Complete the appropriate section below depending upon whether you plan to renovate or build new. Cost estimate
Cost per Stall Number of stalls Low Hjgh
"
Renovating facilities
Building Low $__ High$__ x _ =$ =$
Equipment Low $__ High $__ x _ =$ =$
Total Cost* =$ =$
New facilities (from Table 3-3)
Building Low $__ High $ X _ =$ =$
Equipment Low $__ High $ X _ =$ =$
Total Cost* =$ =$
*Place here and on line 4 of Worksheet 3-12
Note: Table 3-2 provides cow throughput information for different sizes and types of parlors and Table 3-3 provides capital cost for new construction by parlor type.

Your Dairy In Transition Page 11
•
Worksheet 3-6. Amount of forage to be stored
Determine the forage dry matter requirement of animals to be fed (milking cows, dry cows and replacements) by using the tables found in the Pro-DAIRY Feeding or Forage management Manuals.
OR Figure 6 to 8 tons of total forage dry matter is required per milk cow.
tons OM
Estimate the ensiling dry matter losses: Good management--5 to 20% per year Average management--20 to 30% per year Poor management--30 to 50% per year (Forage required X Percent loss) + tons OM
Estimate forage dry matter losses during harvesting and feeding processes
Guide: 5 to 15% (Forage required X Percent loss) + tons OM
Total Forage Needed = tons OM

Page 12 Your Dairy In Transition
Worksheet 3-7. Bunker silo dimensions
Corn Silage Hay Crop Silage
Forage Dry Matter to be Stored
X
=
tons
2,OOOlbs.
18 Ibs./cu. ft.
cu. ft.
X
=
tons
2,OOOlbs.
15 Ibs./cu. ft.
cu. ft.
Pounds per ton
Density factor
Bunker Silo Space Required *
Guidelines for Wall Heights **
Cows Wall Height Avg. Crowned Height
100 to 200 8 feet 10 feet
200 to 300 10 feet 12 feet
300 to 400 12 feet 14 feet
> 400 16 feet 18 feet
Width of Bunker Silo ***
Cows Width
100 to 200 25 to 30 feet
200 to 300 30 to 40 feet
> 300 40 to 60 feet
Length of Bunker Silo Corn Silage Hay Crop Silage
Space required cU.ft. cu. ft.
Avg crowned height
=
ft.
ft.
ft. =
ft.
ft.
ft.
Width
Length
* Dimensions can be calculated for separate corn silage and hay crop silage storage or the total space required can be added together to calculate the size of a single storage for both forages
** Minimum silage depth to control spoilage is 8 ft. Maximum average crowned height may be 2 ft. greater than wall
*** Narrower than 25 feet causes problems with equipment maneuverability; wider than 60 feet makes it difficult maintain a fresh face
•
.'
•

Your Dairy In Transition Page 13
Worksheet 3-8. Bunker silo feedout rate*
Avg crowned height
Width
Density Factor
Inches per foot
Dry matter per linear inch of silo
Forage required annually (from Worksheet 3-6)
Pounds per ton
Days per year
Dry matter per linear inch of silo
Daily feedout rate
Corn Silage
ft.
X ft.
X 18 Ibs. DM/clJ.ft.
+ 12 in./ft.
= Ibs. DM in.
tons DM
X 2000 Ibs.
days
+ Ibs. DM
= in./day
Haylage
ft.
X ft.
X 15 Ibs. DM/cu.ft.
..,... 12 in./ft.
= Ibs. DM in.
tons DM
X 2000 Ibs.
days
..,... Ibs. DM
= in./day
* If less than 5 inches per day, decrease the height and or width If greater than 7 inches per day, increase the height or width

Page 14 Your Dairy In Transition
Worksheet 3-9. Cost of forage storage
Walls
Height ft.
Length X ft.
X 2
Cost per square foot of wall; estimate = $7.35 X$ Isq.fl I Cost of Walls =$
Floor
Width ft.
Length X ft.
Cost per square foot of floor; estimate = $1.35 X$ Isq.ft.
=$ICost of Floor
Cost of Walls +$I I Total Cost of Bunker Silo*
=$Height x width x length
* Place here and on line 5 of Worksheet 3-12.
1 J
•

I
Your Dairy In Transition Page 15
Worksheet 3-10. Sizing mixer for total mixed ration
•
Maximum number of cows in one group to be fed
Minimum number of feedings per day
Maximum dry matter intake per cow per day for this group (guideline - 40 to 55 Ibs.) X Ibs.
Minimum percent dry matter of total mixed ration (guideline - 55% to 40%) %
Pounds of total mixed ration per bushel (guideline -- 25 Ibs.) Ibs.
Mixer capacity needed = bu.
Use quotes from local equipment dealers for the mixer size calculated for your cost estimate. Put the cost on line 6 of Worksheet 3-12. TMR mixers with scales, chassis and tires generally cost from $15,000 to $25,000.

Page 16 Your Dairy In Transition
Worksheet 3-11. Estimated size and cost of commodity storage •Bay Size The size of front end loader planned for the
farm must be considered when establishing bay dimensions
Average size load of concentrate delivered
Pounds per ton
Height (6 to 10 feet)
Width (8 to 12 feet)
tons
X 2000 Ibs.
X 1.5
ft.
... ft .
Density factor (commodity densities range from 20 to 40 Ibs.lcu.ft.; 30 Ibs.lcu.ft. can be used as an Ibs.lcu. ft. average
I Annth nf = ft
Number of bays -- Consider number of commodities to be used in TMR rations plus bedding and fertilizer needs
Additional bays for rotation of feeds
Total number of bays
Cost per bay (range $1,000 to $5,000 per bay)
+ 2
= •X$

Your Dairy In Transition Page 17
Worksheet 3-12. Estimated costs for manure handling components
Unit Costs1 Your Estimate
Manure Storage $ X No. 2= Low High
Paved Bunker partial walls 25 to 40 X =
Concrete Tank - no top 33 to 67 X = with heavy top 40 to 160 X =
Earthen Basin 17 to 33 X =
Equipment X $1000 X% Use 3 Low High
Tractor and Spreader 30 to 80 X =
Tractor, Scraper and Bucket 12 to 30 X =
Skidsteer Loader 20 to 42 X =
• Gutter Cleaner onl/ 8 to 14
Alley Scraper4 20 to 42
Manure Flow system4 25 to 40
Gravity Flow system4 40 to 90
Stacker - 8 to 10
Large Piston Transfer 10 to 16
Chopper Pump Transfer 12 to 20
Pneumatic Transfer 15 to 24
Total Cost
(Place here and on line 9 of Worksheet 3-12)
1 Unit Costs are not verified. 2 Each 70 cubic feet of storage for one cow-month. 3 Choose a percentage for equipment charge for handling manure. 4 Each 200 stalls to spreader loading, or with pipes to storage.
Reference: Holmes and Klemme, '88 U Wise.; Holmes, '91, U Wise.; Barrington and Cap, '91, McGill U. (Canadian Agric. Eng'ng. 381-386).

Page 18 Your Dairy In Transition
•Worksheet 3-13. Summary of facilities costs
Cost Estimate
Low High
1). Housing for Additional Milking Cows Worksheet 3-2 $ $---
2). Housing for Additional Dry Cows Worksheet 3-3 $ $---
3). Housing for Additional Heifers Worksheet 3-4 $ $---
4). Cost of Milking Center or Additional Milking Worksheet 3-5 $ $--- Equipment
5). Cost of Additional Forage Storage Worksheet 3-9 $ $---
6). Cost of Feed Delivery Equipment Worksheet 3-10 $ $---
7). Cost of Commodity Storage Worksheet 3-11 $ $---
8). Cost of Manure Storage Structure and Worksheet 3-12 $ $--- Equipment
Total Cost of Facility $ $---
,

Your Dairy In Transition Page 19
Worksheet 4-1. Summary of proposed change
Name: _ Date: _
Proposed change: _
Average Future Year
Base Year Without Major With Major Change Change
Number of milk cows, miling and dry
Number of heifers and calves
Pounds of milk sold per cow
Number of crop acres
Milk price per cwt.
Total cwt of milk sold
Capital purchases to be made Year 1 Year 2 Year 3
Machinery and equipment
Milking equipment
Feeding equipment
Manuare storage and handling eqiup.
Other
Animals- cows
- Heifers
Structures
Barn
Feed storage
Other
Land
Total Capital Needed

Page 20 Your Dairy In Transition
Worksheet 4-2. Current balance sheet and net worth analysis •Name: _ Date: _
Assets Debt
Current Current
Cash, checking and saving Accounts payable
Account receivable Operating debt
Prepaid expenses Short term debt
Feed and supplies Advanced gov!. receipts
Total Total
Intermediate: Intermediate:
Dairy cows Secured debt:
In!. Loan #1 _
leased In!. Loan #2 _
Heifers In!. Loan #3 _
owned
Bulls/other livestock In!. Loan #4 _
Machinery/eq. owned Financial lease
Machinery/eq.leased Machinery
Farm stocks or certificates Cattle
Total Total
Long-Term: Long Term:
Land and buildings: Secured debt:
owned LT Loan #1 _
_Financial lease (structures) LT Loan #2
Total Financial lease (structures)
Total Assets = Total
Total Debts = Net Worth (A)a
Total Debt and Net Worth
Net Worth Total Debt
Total Assets Total Assets +------
Percent Net Worth Debt: Asset Ratio
• Net worth Total Assets - Total Debts
Your Dairy In Transition Page 21
•
•
•
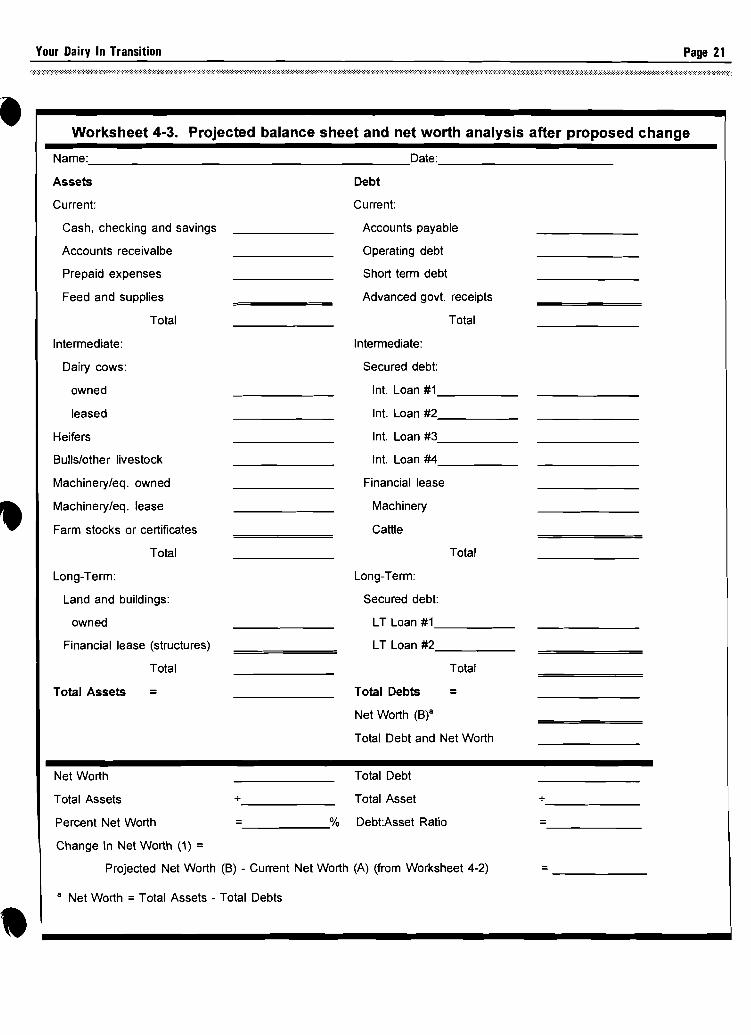
Worksheet 4-3. Projected balance sheet and net worth analysis after proposed change
Name:
Assets
Current:
Cash, checking and savings
Accounts receivalbe
Prepaid expenses
Feed and supplies
Total
Intermediate:
Dairy cows:
owned
leased
Heifers
Bulls/other livestock
Machinery/eq. owned
Machinery/eq. lease
Farm stocks or certificates
Total
Long-Term:
Land and buildings:
owned
Financial lease (structures)
Total
Total Assets =
Net Worth
Total Assets +-----
_ Date:
Debt
Current:
Accounts payable
Operating debt
Short term debt
Advanced govt. receipts
Total
Intermediate:
Secured debt:
Int. Loan #1
Int. Loan #2
Int. Loan #3
Int. Loan #4
Financial lease
Machinery
Cattle
Total
Long-Term:
Secured debt:
LT Loan #1
LT Loan #2
Total
Total Debts = Net Worth (B)8
Total Debt and Net Worth
Total Debt
Total Asset +
% Debt:Asset Ratio = -----Percent Net Worth
Change In Net Worth (1) = Projected Net Worth (B) - Current Net Worth (A) (from Worksheet 4-2)
=
= _
8 Net Worth = Total Assets - Total Debts

Page 22 Your Dairy In Transition
Worksheet 4-4. Estimating expenses
Name: _ Date: _
Average Future Year
Expenses Base Year" Without Major With Proposed Changes Changes
+ +Hired Labor +
+Purchased concentrates + +
+ + +Purchased forages
+ + +Non-dairy feed
+ + +Custom work
+ + +Machinery repairs
+ + +Auto expense (farm share)
+ + +Fuels, oil and grease
+ + +Purchased livestock
+ + +Breeding fees
+ + +Veterinary and medicine
+ + +Milk marketing
+ + +Other dairy expense
+ + +Lime and fertilizer
+ + +Seeds and plants
+ + +Spray, and other crop expense
++ +Land, building, and fence repair
+ + +Taxes
+ ++Insurance
+ ++Rent
+ + +Telephone (farm share)
+ ++Electricity (fa rm share)
+ ++Interest paidb
++ +Miscellaneous expenses
= ==Cash farm operating expenses
+ ++Depreciation of machinery
+ ++Depreciation of buildings
+ ++Expansion livestock
___ __l... _~Total farm expenses I= I = a Adjust all expenses to an accrual basis b Interest paid is interest on average debt outstanding over the life of the investment
•
•
•
I
l Your Dairy In Transition Page 23
,
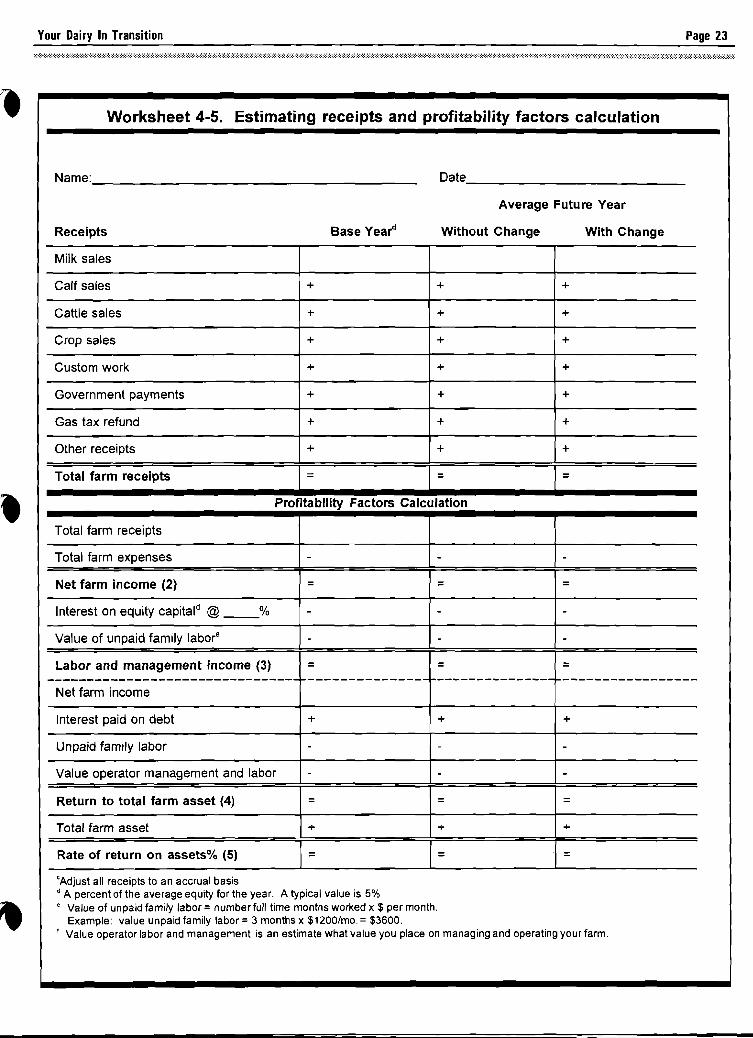
Worksheet 4-5. Estimating receipts and profitability factors calculation
Name: Date
Average Future Year
Receipts Base Year<! Without Change With Change
Milk sales
Calf sales + + +
Cattle sales + + +
Crop sales + + +
Custom work + + +
Government payments + + +
Gas tax refund + + +
Other receipts + + +
Total farm receipts 1= 1= 1= Profitability Factors Calculation
Total farm receipts
Total farm expenses - - -
Net farm income (2) = == Interest on equity capitald @ __% - - -
Value of unpaid family labor" - - -Labor and management income (3) = = = -------------------------------- --------------- ---------------~-----------------Net farm income
Interest paid on debt + +
Unpaid family labor
+
-- -
-Value operator management and labor - -
Return to total farm asset (4) = == ~ ~ +Total farm asset
Rate of return on assets% (5) 1= 1= 1= 'Adjust all receipts to an accrual basis d A percent of the average equity for the year. A typical value is 5% • Value of unpaid family labor =number full time months worked x $ per month.
Example: value unpaid family labor =3 months x $1200/mo. =$3600. r Value operator labor and management is an estimate what value you place on managing and operating your farm.

Page 24 Your Dairy In Transition
Worksheet 4-6. Farm repayment ability. • Name: _ Date:, _
Average Future Year
Without With Major Base Year Major Changes
Changes
Total farm receipts
Capital sales + + +
Non-farm income + + +
Total cash inflow = = = Interest paid + + +
Cash farm expenses - - -
Cash available for family living, debt repayment, and investment = = = Family living expense9 - - -
Cash for asset replacement - - -Cash available for debt payments (C) = = = Subtract: planned debt payments (0) - - -
...C.as.h....ex.c.e.s.s'.d.ef.ic.i.t.(6.) .1.= 1.= 1.= _ 9 Along with regular living expenses, includes income and self employment taxes, health insurance,
medical expenses, savings, etc.

Your Dairy In Transition Page 25
Worksheet 4-7. Summary of financial worksheets.
Name: _ Date:---------Average Future Year
Without With Base Year Proposed Proposed
Change Changes
Annual change in net worth a
Net farm income (2) Worksheet 4-5
Labor and management income (3) Worksheet 4-5
Return to total farm assets (4) Worksheet 4-5
Rate of return on assets (5) Worksheet 4-5
Able to service debt? YIN (6) Worksheet 4-5
a Annual change in net worth = Net worth year end - Net worth beginning of year

Page 26 Your Dairy In Transition
Worksheet 4-8. Planning the transition achieve to proposed change
Name: _ Date:
Scenario for year 1:
Scenario for year 2:
Scenario for year 3:
Scenario for year 4:
Scenario for year 5:
Farm Expenses Year 1 Year 2 Year 3 Year 4 Year 5
Hired labor + + + + +
Purchased concentrates + + + + +
Purchased forages + + + + +
Custom work + + + + +
Machinery repairs and Auto + + + + +
Fuels, oil, and grease + + + + +
Purchased livestock + + + + +
Breeding fees + + + + +
Veterinary and medicine + + + + +
Milk marketing expense + + + + +
Other dairy expense + + + + +
Lime and fertilizer + + + + +
Seeds and plants + + + + +
Spray and other crop expo + + + + +
Real estate repair + + + + +
Taxes + + + + +
Insurance + + + + +
Rent + + + + +
Telephone (farm share) + + + + +
Electricity (farm share) + + + + +
Miscellaneous expenses + + + + +
Total Farm Expenses (less interest) :::: = = = =

Your Dairy In Transition Page 27
Worksheet 4-8. Planning the transition to achieve the proposed change
Name: _ Date: _
Farm Receipts Year 1 Year 2 Year 3 Year 4 Year 5
Number cows
Production/cow (cwt) x x x x x
Price milklcwt x x x x x
Milk income = = = = = Cull cow sales + + + + +
Calf sales + + + + +
Other business income + + + + +
_T.o.ta.l.r.e.c.e.iP.ts I.= 1= 1.= .1.= = _ Repayment Analysis
Total farm receipts
Farm expense without interest - - - - -Net cash inflow = = = = = Non-farm income + + + + +
Cash avail. for family living, debt payment, and investment = = = = = Family living expense - - - - -Cash for asset replacement - - - - -Cash available for debt payment (A) = = = = = Planned debt payments (8) - - - - -Cash excess/deficit = = =1= 1=
Page 28 Your Dairy In Transition
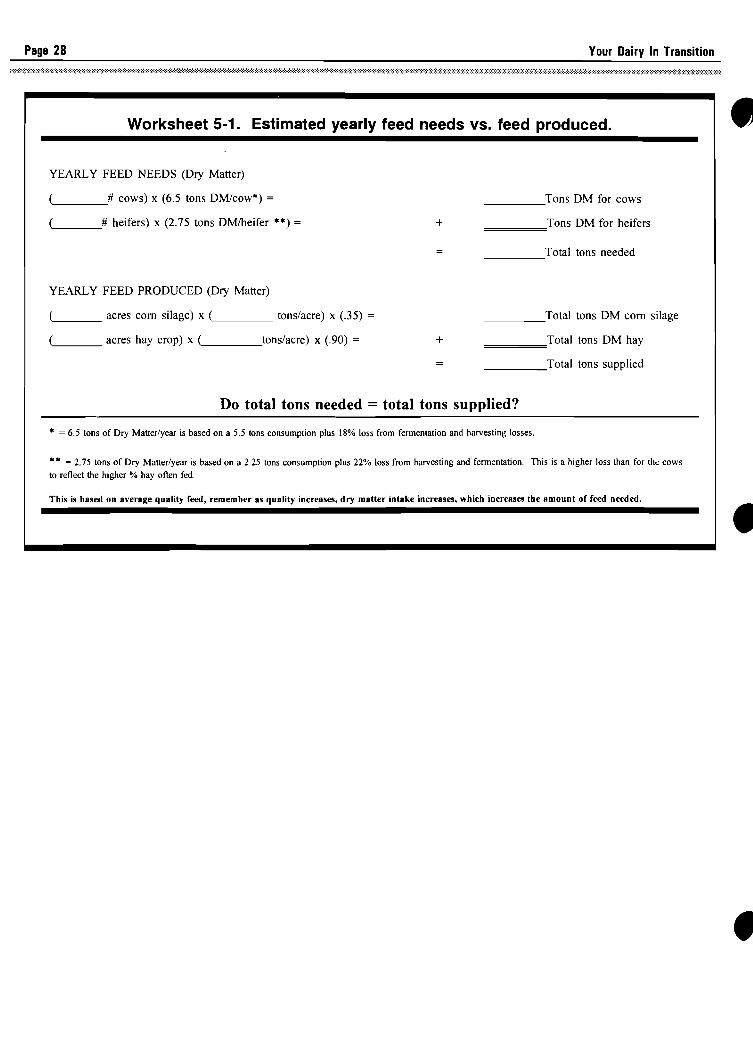
Worksheet 5-1. Estimated yearly feed needs vs. feed produced. • YEARLY FEED NEEDS (Dry Matter)
'- # cows) x (6.5 tons DMlcow*) = _____Tons DM for cows
'- #. heifers) x (2.75 tons DMiheifer **) = + =====Tons DM for heifers
_____Total tons needed
YEARLY FEED PRODUCED (Dry Matter)
'- acres com silage) x (~ tons/acre) x (.35) = _____Total tons DM com silage
'--- acres hay crop) x ('- tons/acre) x (.90) = + =====Total tons DM hay
_____Total tons supplied
Do total tons needed = total tons supplied?
* ~ 6.5 tons of Dry Matter/year is based on a 5.5 tons consumption plus 18% loss from fermentation and harvesting losses.
** ~ 2.75 tons of Dry Matter/year is based on a 2.25 tons consumption plus 22% loss from harvesting and fermentation. This is a higher loss than for the cows
to reflect the higher % hay often fed.
This is based on average quality feed, remember as quality increases, dry matter intake increases, which increases the amount of feed needed.

---
----
Your Dairy In Transition Page 29
• Worksheet 5-2. Calculate the Ratios of Corn Silage and Haycrop Dry Matter Consumed to Total Forage Dry Matter Consumed for all Cattle on a Dairy Farm.
Milk Cows Dry Cows Heifers Herd DM Fed
(lbs com s.) + (lbs com s.) + (Ibs com s.) corns s. Ibs x % OM ~OM lbs com silage
Ibs) + Ibs) + lbs) lbs x __%OM OM Ibs com silage
(lbs haylage) + (lbs haylage) + (lbs haylage) haylage Ibs x OM % ~ OM Ibs haylage
Ibs) + Ibs) + lbs) lbsx %OM OM Ibs haylage
(lbs hay fed) + (Ibs hay fed) + (lbs hay fed) hay Ibs x % OM ~ OM Ibs hay fed
Ibs) + Ibs) + Ibs) Ibs x .90 OM Ibs hay fed
Total OM Ibs forage needed
(OM lbs com silage) + (OM lbs haylage ) + OM lb. hay = OM Ibs forage needed
lbs) + (___ Ibs) + Ibs = OM Ibs forage needed
(OM lbs haycrop) lolal OM lb. forage x 100~ % total OM from hay crop needed)
lbs) lbs) x 100 ~ %
(OM lbs com s.) lolal OM lb. forage x 100= % total OM from com silage ~
needed)
lbs) lbs) x 100= %
Page 30 Your Dairy In Transition
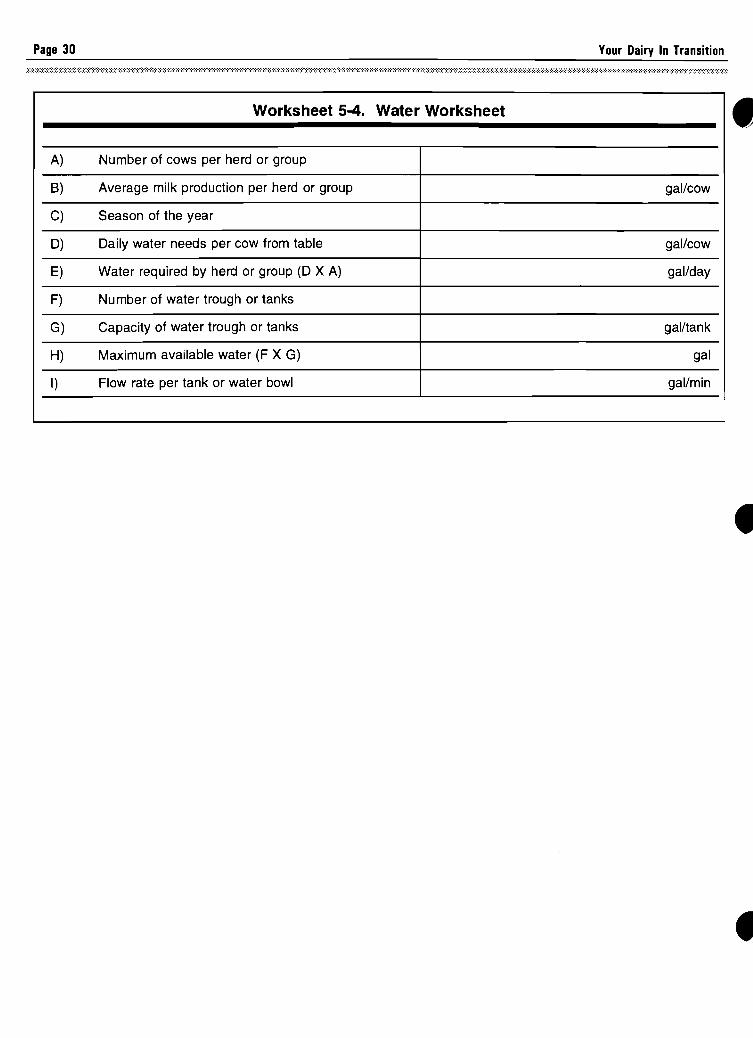
Worksheet 5-4. Water Worksheet •
A) Number of cows per herd or group
B) Average milk production per herd or group gal/cow
C) Season of the year
D) Daily water needs per cow from table gal/cow
E) Water required by herd or group (D X A) gal/day
F) Number of water trough or tanks
G) Capacity of water trough or tanks gal/tank
H) Maximum available water (F X G) gal
I) Flow rate per tank or water bowl gal/min
•
•