NEEO Workpackage 5 NEEO Workpackage Leader Meeting - 3 Warwick, UK 3 September, 2009 Benoit PAUWELS.
Upload
nguyentrucCategory
view
218download
1
Workpackage 2
Indicators for the
Knowledge-Based Economy: Summary Report
Deliverable 2.5
2008

KEI-WP2-D2.5 ii
List of contributors:1 Anthony Arundel, Wendy Hansen, Minna Kanerva, MERIT Main responsibility: Anthony Arundel, Wendy Hansen, Minna Kanerva, MERIT C1S8-CT-2004-502529 KEI The project is supported by European Commission by funding from the Sixth Framework Programme for Research. http://europa.eu.int/comm/research/index_en.cfm http://europa.eu.int/comm/resarch/fp6/ssp/kei_en.htm http://www.corids.lu/citizens/kick_off3.htm http://kei.puplicstatistics.net/
1 We would like to acknowledge comments and input received from Asterios Chatziparadeisis for the revision of this document.

© http://kei.publicstatistics.net - 2008 iii
Table of Contents
1. INTRODUCTION ..................................................................................... 1 1.1 Overview of indicators ......................................................................... 1
2. INDICATORS ........................................................................................... 6 2.1 Group A: Characteristics and drivers .................................................... 6
2.1.1 A1 - Production and diffusion of ICT ............................................ 7 2.1.2 A2 - Human resources, skills and creativity ................................... 9 2.1.3 A3 - Knowledge production and diffusion ................................... 15 2.1.4 A4 - Innovation, entrepreneurship and creative destruction ......... 17
2.2 Group B: Outputs - Economic performance, society and the KBE ..... 20 2.2.1 B1 - Economic outputs ................................................................. 20 2.2.2 B2 - Social performance ............................................................... 21
2.3 Group C: Globalisation ....................................................................... 23 2.3.1 C1a - Trade ................................................................................... 24 2.3.2 C1b - Knowledge production and diffusion ................................. 24 2.3.3 C1c - Economic structure ............................................................. 24 2.3.4 C1d – Human resources ............................................................... 24
3. CONCLUSIONS AND FURTHER THOUGHTS ................................... 26 3.1 Overall conclusions ............................................................................ 26 3.2 Observations on indicator availability for the KBE ............................ 26
ANNEX I ..................................................................................................... 29


© http://kei.publicstatistics.net - 2008 1
1. INTRODUCTION The Knowledge Economy Indicators (KEI) project evaluated hundreds of indicators for their usefulness in evaluating and tracking the development of a Knowledge Based Economy (KBE) in Europe and among other major countries outside Europe. Virtually hundreds of indicators are of potential use, but many indicators suffer from problems of availability and consistency across Europe and for countries of interest outside of Europe.
This report summarizes research to evaluate current and potential indicators for measuring the drivers, characteristics and key outputs of a KBE. The project assembled a dataset of relevant indicators using currently available data.2 The report summarizes the state-of-the-art for indicators, identifies the types of indicators that are available for defining the characteristics of a KBE, and identifies the drivers of growth, performance and output of a KBE.
The rest of this introduction provides an overview of the KEI classification system for KBE indicators and discusses the policy and user needs for KBE indicators, drawing from a round of interviews with policy analysts. Section 2 provides the core of this report and gives details on the KBE indicators. Conclusions are provided in Section 3. Annex I presents a table of the 64 selected, currently available key KBE indicators.
1.1 Overview of indicators The purpose of the KEI project is to identify key indicators for knowledge economies and methodologies for constructing composite indicators to measure and compare national KBE performance. The latter include performance for innovation (e.g. capabilities and output) and globalisation (e.g. impact of globalisation on work and life). Of note, the inputs for a KBE are not limited to R&D, but include many other types of activities. Similarly, the outputs should not be measured only in economic terms, but should include quality of life issues.
Both innovation and the drivers of a knowledge economy require a broad set of skills and capabilities. One set of indicators of particular policy relevance for gauging the ‘knowledge’ capabilities of a nation (and one used for composite indicators on human development) has been the supply of scientists and engineers (S&E) and student performance in mathematics and science. In some cases this focus has led to the neglect of other valuable skills for innovation, including reading literacy and communication skills. This is a mistake – the transition of work and life brought about by the KBE requires networking, problem solving and communication skills, from writing to marketing. Consequently, the indicators for a KBE need to consider reading and writing as important as mathematics and science.
2 Key missing indicators are discussed in WP4, which also assesses future data needs for a KBE.

KEI-WP2-D2.5 2
What are some of the relevant indicators needed for constructing indicators for the KBE? Table 1 in Annex I provides a detailed overview of 64 relevant indicators that were chosen from the pool of currently available indicators. Due to data limitations, they represent a conservative viewpoint on how best to measure the KBE.
The KBE indicators are classified into four main drivers (Group A), two main outputs (Group B), and a number of horizontal indicators of globalisation (Group C).
The Group A indicators on the drivers and characteristics of a KBE are further divided into four main sub-groups:
• Production and diffusion of ICTs. ICT is the main technology underlying the KBE and increases in productivity.3
• Human resources, skills and creativity. These indicators represent the primary set of indicators needed to develop composite indicators on the human potential of a nation. These indicators reveal the creative and absorptive capacity of a work force.
• Knowledge production and diffusion. This group includes many of the traditional indicators of R&D and knowledge production. They provide us with sound trend data and with indicators to develop composite measures of globalisation and competitiveness.
• Innovation, entrepreneurship and creative destruction. These indicators tell us about the churn and change brought about by ICTs and globalising knowledge economies. They cover firm behaviour and aspects of innovation including demand for innovative products, financing and market innovation. The share of the population in specific age cohorts can provide insights into the demand for innovative products.4
Group B includes output indicators, from economic outputs to measures of social performance:
• Economic output. This group of indicators includes a number of horizontal basic indicators, such as GDP, value added and employment that can be used to develop indicators of economic outputs including income measures, productivity measures and employment trends.
• Social performance. These indicators cover a broader landscape of policy issues in the KBE. They can be used to develop composite indicators on the environment and sustainable growth, economic welfare and quality of life.
Lastly, Group C includes horizontal indicators related to globalisation. These indicators include measures of economic and work life in the KBE. There are indicators of trade, knowledge production and diffusion, economic structure (change) and human resources (especially international flows of HR) emerging in and/or driving the KBE. 3 Another example, the use of ICTs in government can also be considered as measures of public sector innovation. The provision of government services on-line represents an innovation in terms of delivery of services and increased transparency of processes. 4 Empirical research shows that such demand is highest among the ‘youth’ cohort (persons aged 15 to 29).

© http://kei.publicstatistics.net - 2008 3
Some indicators are non-controversial and cover core information, both on their own and as critical inputs for composite indicator development. Other indicators expand the concept of a KBE, due to a need to move beyond the traditional core indicators. This is particularly the case when considering human potential measures, for example.
Care must be taken in the construction of composite indicators. If they are poorly constructed or misunderstood, they can be inappropriately used and result in mixed misleading messages to policy. The OECD cautions:
“In the context of policy analysis, indicators are useful in identifying trends and drawing attention to particular issues. They can also be helpful in setting priorities and in benchmarking or monitoring performance. The composite indicator should ideally measure multi-dimensional concepts that cannot be captured by a single indicator alone, e.g. competitiveness, industrialization, sustainability, single market integration, knowledge-based society, etc.” (OECD, 2005b).
While indicators may not provide a complete picture (e.g. GDP per capita can be a poor measure of societal well being), composite indicators in turn can cover up problems with the underlying indicators. Data timeliness and trends are a particularly important factor for the indicators.
Detailed insights into sectoral innovation performance are essential for the development of effective innovation policy at regional, national and European levels. Many countries have good data series over time for the two main sectors of services and manufacturing trends, but what is needed is sector level data at the level where firms compete. This would require, at the minimum, disaggregated data at the two-digit NACE level. For some sectors such as pharmaceuticals and aerospace, data are required at the three-digit NACE level.
For many indicators such as R&D and patents, data at a disaggregated sector level lags behind national data by several years. Sources of sector data include Eurostat, the OECD, some national statistical agencies, universities and research institutes. At Georgia Tech’s Technology Policy and Assessment Center in the US, researchers have monitored high technology-based industrial competitiveness at the national level since 1986 and recently carried out analyses of high technology indicators (HTI) for 28 countries for the years 1993 to 2003. Sources of HTI indicators include the European Innovation Scoreboard, the Entrepreneurship Scoreboard, the World Bank, the World Economic Forum and the UN Commission on Science and Technology for Development (Newman et al, 2004).5
5 There are HTI for Europe (UK, France, Germany, Netherlands, Italy, Switzerland, Sweden, Spain and Ireland), US, Canada, Japan, Australia and China. Sources for developing HTI for developed and emerging economies in a KBE are identified and include the OECD, Eurostat, the Innovation Scoreboard, the World Bank and the UN Commission on Science and Technology for Development.

KEI-WP2-D2.5 4
The dataset produced for KEI does not include disaggregated sector level data, mostly because these data are not yet consistently available for all types of indicators and all target countries.
The Systematics Sectoral Innovation Watch project of the European Commission is developing sector level indicators from existing databases. It is also looking at the use of one-off datasets to compensate for information gaps.6
Another policy priority for the European Commission is to develop indicators at the gender level. This includes indicators on the proportion of students in higher science programmes that are women, and the share of women working in ICT occupations. There is also a need for indicators on the changing roles for women due to transitions brought about by the KBE, such as improved job flexibility through ICTs.
Good quality information on gender is available for educational achievements and for the number of researchers in FTEs. There is also good representation of gender breakdowns in labour force indicators (e.g. age, occupation) and mobility indicators (sector, occupation and international).
Several interviews were conducted in 2007 to assess the policy and user needs for KBE indicators and to help identify new and improved indicators for emerging policy challenges7. The interviews targeted policy makers inside and outside the EU - those involved with policy coordination, implementation or evaluation - as well as policy advisers in statistical agencies and academia.
The results indicated that current indicators on innovation are not adequate from the user perspective, partly because of issues to do with timeliness, detail or international comparability, but partly also because of the changing needs for indicators in a KBE. Aspects of innovation most in need of indicator development included:
• Innovation flows (indicators on innovation capabilities, adoption and diffusion of innovations),
• Economic impact of innovation (indicators on the impact of subsidies or tax exemptions),
• Innovation collaboration (indicators on linkages, networks and clustering),
• Human resources (better indicators on mobility, gender, life-long learning, financing of researchers, graduate job markets),
• Social impact of innovation,
• Security issues (how do tighter immigration policies affect international HR mobility?),
6 These sectors are: Biotechnology, Food/Drink, Machinery/Equipment, Textiles, Chemicals, ICT/Electrical/Optical, Space and Aeronautics, Automotive. The horizontal topics are: eco-innovation and gazelles (fast growing SMEs). 7 This section draws from Arundel, A., van Cruysen, A. and Hansen, W., 2007. Policies for a Knowledge-Based Economy, KEI Deliverable 1.3. Maastricht: UNU-MERIT.

© http://kei.publicstatistics.net - 2008 5
• Role of consumers in the innovation process,
• Venture capital,
• Organisational innovation,
• Changing nature of research: convergence of different scientific fields (e.g. how is this affecting the outputs from research?).
Economic sectors in need of better indicators (and better classification systems) were identified as:
• Services, including indicators on e-government and e-health, among others,
• Biotechnology and nanotechnology,
• Energy and environmental technology,
• ICT (more indicators on use and impact in firms and households).
Finally, the interviewees hoped for better indicators to measure the effectiveness and impact of innovation policies.

KEI-WP2-D2.5 6
2. INDICATORS8 This section describes the main classes of indicators for a KBE. Each section concludes with a brief description of key indicators. Annex 1 gives additional information on each indicator, including the source, description, unit, time range for data availability, and the number of countries for which the indicator is available. The indicators in the Annex can be identified from their alphanumeric code.
Many of the key indicators are traditional indicators for which data are relatively easy to find. There are also a few more recently developed indicators. However, the list of key indicators is conservative, with a strong bias towards familiar and well-understood indicators. Several sections below identify indicators that are currently not included in the key indicators, but which should be considered in the future to ‘round out’ coverage of a KBE.
2.1 Group A: Characteristics and drivers Recent development work is ongoing at the national (e.g. National Science Foundation U.S.), EU (e.g. Eurostat), and international levels (OECD and UN). Both national and international agencies are addressing the need for new aggregations of relevance to the KBE. For example, under ISIC rev.3.1 there is now an information and communication technology (ICT) sector (Gault, 2005). The 4-digit aggregation of the ICT sector makes it possible to examine ICT sector growth and also makes it possible to compare ICT sector growth with other high tech sectors in the KBE.
There are several initiatives for indicator development in Europe. NEWKIND aims to develop new indicators for the KBE looking at changes in economic, industrial and firm performance. The NIND project in Scandinavia is developing new indicators from exiting data sources, such as the European Community Innovation Survey (CIS).
There are also other international cooperative efforts that can be tapped for indicators. One example is the KBE task force for Asian-Pacific Cooperation (APEC) that provides links to a range of comparable indicators for Australia, Canada, China and Japan (as well as countries not targeted in the KEI study such as Malaysia, Chile, Mexico, New Zealand, Philippines, Thailand and Singapore). The indicators are grouped according to business environment and include KBE indicators of government transparency; ICT infrastructure that includes indicators of new technology take-up, domestic telecommunication capacity (e.g. number of computers), internet users and e-commerce; innovation indicators of number of researchers, GERD/GDP, BERD/GDP and knowledge networks; and, human resources including science graduates and the human development index (APEC, 2002).
8 The indicator references - A1a, A1b and so on - refer to the indicator categories in the Excel dataset associated with this WP, as well as Table 1 in Annex I, which contains more detail on these indicators.

© http://kei.publicstatistics.net - 2008 7
2.1.1 A1 - Production and diffusion of ICT
There has been extensive development of new indicators for high tech sectors, in particular indicators on the growth and economic and social impacts of ICT use. Most countries have ICT indicators, although the scope and coverage varies. Finland, the United States and Canada continue to lead the way in measuring ICTs and developing indicators for ICT growth and social and economic impact assessments. In the US, the Department of Commerce collects a large number of indicators on ICTs. In Canada, a programme was established at Statistics Canada to develop indicators for an information society/information economy, and as a result, there is a wealth of information available.
The project e-Europe collects and provides benchmark indicators for ICTs. For enterprises, there are indicators of access and use of the internet, cost of access to e-commerce, e-readiness and e-government. For citizens acting in e-Europe, there are indicators for citizen access and use of the internet, internet access costs, e-government, e-learning, e-health and ICT-security.
This is the set of indicators that have and continue to receive a great deal of policy and measurement attention. These are also the indicators that, although grouped together here under production and diffusion of ICT, may also be useful for other indicator areas.
2.1.1.1 A1a — Economic impact of ICT sector
Indicators for the economic impact of ICTs remain a top priority for policy and decision makers. The two key indicators for direct economic impacts are ICT value-added as a share of total business sector value-added and ICT employment as a share of total business sector employment. Unfortunately, the latter is not consistently available across most EU countries. An indicator for ICT sales as a share of total business sector sales is of less importance. Investment in ICT is a key indicator because it covers expenditures on ICT across all sectors and provides national indicators for the diffusion of ICTs, which is important to productivity (e.g. diffusion, adoption). Finally, patent data provide an indicator of national capabilities to develop ICT innovations. The key indicators included in the dataset are:
• A1a1 – Share of ICT sector value-added,
• A1a3 – Investment in ICT as a percentage of GDP,
• A1a4 – Number of patent applications to the EPO in ICT patent classes per million population,
• A1a5 - Number of patent applications to the USTPO in ICT patent classes per million population.
KEI-WP2-D2.5 8
2.1.1.2 A1b to A1d — Internet use
In addition to economic indicators of ICT use, indicators for the diffusion of the internet to businesses and private citizens capture the potential for a range of new business models and services. Indicators on internet use by individuals also support human resources, skills and social policy information needs. This means that some of these indicators can also be used to develop composite indicators of citizens in the KBE. We might consider developing an index of skills, trust in the government and internet usage by individuals. We need to consider internet use (in general) by firms, government and individuals.
A1b – Internet use by firms
Not all enterprises have access to broadband — enterprises operating outside of urban centers and in the new member states may not have broadband access, but internet penetration rates are increasing rapidly. This means that this indicator has a short lifetime and is consequently not included in the list of key indicators. A better option is to produce indicators on how businesses use the internet. Developing indicators on firm internet usage for orders and sales is difficult. ICT indicators may not represent all sectors (e.g. accounting firms, consulting firms, legal firms) and will biased towards internet-based sales companies such as software or book retailers. How representative the measure of receiving orders over the internet is for small firms such as butchers and bakeries is another matter, which explains the division of the indicator into all businesses and SMEs. A better indicator for the future could be the share of businesses that maintain a website or homepage as a share of businesses that have access to the internet. Businesses receiving orders over the internet by NACE could be a third indicator.
The key indicators included in the dataset are:
• A1b1 – Businesses receiving orders over the internet – All businesses,
• A1b2 – Businesses receiving orders over the internet – SMEs.
A1c – Internet use by individuals
Indicators on internet usage by individuals present even more challenges. We can consider segments of the population either by age or activities (e.g. students). We also need to consider access before usage. This remains an underlying weakness of data on usage — broadband access may not be available, or the cost may be prohibitive for households, and citizens could instead access the internet at work, school, libraries or other public sources. A key indicator for individual usage is therefore broadband access as measured by penetration rates. This is a key indicator because only broadband access enables the internet to be used for a range of productivity enhancing innovations for both the public and private sectors, such as completing tax forms over the internet or e-banking. Here, it would be useful to have urban and rural results separately, but this breakdown is not commonly available. Once we have an indicator of penetration based
© http://kei.publicstatistics.net - 2008 9
on the share of households with broadband access, we can develop indicators on usage through the type of activities the individuals engage in, such as e-banking, e-trading or e-education. Eurostat has data on individuals using the internet for specific purposes including sending/receiving emails, finding information about goods and services, reading/downloading online newspapers, playing/downloading games and music and internet-banking.
The key indicators included here are:
• A1c1 – Percent of individuals making any use of the internet, by age,
• A1c4 - Broadband penetration rate.
A1d – Government ICT
Public sector innovation is a particular policy interest. How is the public sector doing in terms of workplace innovation itself? The available data are very limited. This is in part due to the definition of public service innovation, i.e. what should be included. There is also a lack of data at the EU level. For these reasons, we can ‘borrow’ from ICT indicators to provide information on government services online and the types of online services accessed by firms and private citizens. These are important indicators of public sector innovative practices.9
Eurostat collects data under Information and Society activities that can shed light on public sector innovation in delivering services to business and private citizens. Although the data are based on individual and company surveys, they can be used to develop indicators on the types and volume of public government services based on usage. One important indicator is the percentage of individuals using the internet for interacting with public authorities (the data are available by purpose and include obtaining information, obtaining forms, returning filled in forms, and full electronic case handling). A second important indicator is the percentage of enterprises using the internet for interacting with public authorities, again broken down by purpose. There is a time series covering 2002 to 2005.
The only key indicator included in the dataset under this category is:
• A1d2 – Percent of individuals who use the internet to interact with public authorities.
2.1.2 A2 - Human resources, skills and creativity
Indicators for human resources include traditional indicators for scientists and engineers and cultural and policy support for technology based development and entrepreneurship. For the more traditional indicators of GERD, FTE researchers, doctorate degrees
9 For instance, innovation in delivery of services appears under ICT enabling technologies that make government services more transparent and more accessible. The filing of personal income tax and business taxes on-line tend to be captured under ICT measures rather than the fact that the development and adoption of the technologies within the public sector is innovative.

KEI-WP2-D2.5 10
awarded, and student interest in science and technology, there are comparable indicators for India and China. There is also a choice of sources, including national statistical agencies. The National Science Foundation of the US provides reasonable coverage for Japan, South Korea, Taiwan, China and India. The OECD is expanding its coverage of emerging economies, particularly China and India.
The knowledge intensity of an industry can be examined by using the education and skills of workers employed in the industry. These can be compared with other industries in the country and also with the same industries in other countries. Other indicators include the rate of skill level increases, shifts in skills by field of education, the presence of knowledge workers, and relative earnings across knowledge intensive sectors and across countries (Baldwin and Beckstead, 2003). Indicators for skill levels are available for most countries, although the field of education has more limited availability and limited international comparability.
The knowledge intensity of an industry can also be measured using education and output indicators. For example, one can link the scientific base of an industry to the education field of science by developing a concordance between knowledge output (e.g. patents, bibliometrics) and field of education. Work to develop indicators for the education base of selected industries in Europe (a set of pilot countries) is currently underway for the European Commission.
The use of ISCED 1997 makes the international comparison of university-qualified scientists and engineers possible although there are still problems. The OECD is working with Eurostat to address this. Nevertheless, the international classification can be used to compare the educational level of skilled workers across all countries. It is possible to collect indicators to show the ‘pool’ of skilled workers being produced by national systems, and for some countries it is possible to develop indicators of the foreign contribution of scientific and engineering students. National agencies keep track of foreign student enrolment, and so indicators can be produced on the potential supplies of knowledge workers from other countries. For example, there are indicators for the US on the plans of foreign graduates earning doctorate degrees and we can compare the plans of graduates from countries across Europe, as well as those in India and China. Are students from some countries more likely to stay and work in the US after graduation? Do students from some countries tend to return home after acquiring useful work experience in the US? This type of information is not available for many countries, although this will be addressed in the coming years as surveys of PhD graduates provide more extensive coverage for European and Asian countries.10
The flow of knowledge workers in the KBE means the flow of ideas. For Europe, there is no one source of information about the process of mobility and flows between occupations, sectors or countries. One of the key sources is the European Labour Force
10 A number of countries carry out some form of graduate or destination survey. These surveys of graduates provide important indicators of mobility from education to the labour force, as well as indicators of flexibility of skills sets (e.g. occupation choice, sector choice) or demand for skill sets.

© http://kei.publicstatistics.net - 2008 11
Survey (LFS), which can provide some basis for comparison with the US and Canada. It is probably the only database that provides international comparisons over time.
One of the weakest areas of indicators both in Europe and North America is that of life-long learning. This increasingly ‘catch all’ phrase has problems of data availability and comparability. The EU has carried out several surveys of employer training without much success. The best source is the LFS, which asks individuals about participation in training or courses. However, the definition of ‘life-long’ learning remains unclear.
The most common indicators for human resources typically focus on highly-skilled workers while paying less attention to lower levels of education. For instance, there are substantial efforts for indicators on PhD-qualified skilled workers and researchers but less attention on technically skilled personnel and undergraduates (e.g. bachelor degree). This narrow and dated focus on high skill level indicators make it difficult to develop indicators for a KBE in which creativity and job growth can be evaluated across occupations and skill levels, and most certainly below the PhD and higher skill levels. We need only look as far as ICT occupations, where a variety of skill levels and fields of specializations are present. This means that we need to develop indicators on a broader range of skill levels as well as information on specialisations.
All in all, there are many questions surrounding human resources and skills including the supply (e.g. education pipeline), factors that may influence the pool (e.g. mobility) and creativity (e.g. life-long learning and the ability to move in a job market that no longer provides good job security). This means that we need indicators for the trends for postsecondary education, but we also need to know what happens to the graduates. While we need to know the representation of researchers in the work force, we also need to know of the exit of researchers brought about by career path changes and international mobility. Indicators need to be developed to consider:
• General education and trends such as literacy and numeracy,
• Specific skill trends such as the number and types of researchers,
• Factors that might influence supply, including various forms of mobility from occupation-to-occupation, sector-to-sector and country-to-country,
• The potential for work place innovation and change as measured by training and life-long learning,
• The creativity of people as measured by tolerance and acceptance fostered through social trust and the share of ‘creative’ occupations.
2.1.2.1 A2a - General education indicators
With regards to the overall standing of a population and its ability to benefit socially and economically in the KBE, we need to know about the basic skills for learning and development potential. For national and international comparability, literacy scores are

KEI-WP2-D2.5 12
key indicators of a population’s ‘educational’ health. While there has been a tendency to focus on mathematics and/or science literacy, it would be a mistake to leave out reading literacy. The changing nature of jobs (e.g. the growing need for communication and networking skills, writing skills, and marketing skills) tells us that indicators for reading comprehension, as gathered for 15 year olds in PISA 2000, should be considered as important as mathematical literacy (PISA 2003). Reading literacy is excluded from the key indicators because the data are increasingly dated, but this indicators should be included when next available. It would be useful to have high quality, comparable indicators for reading and mathematical literacy among adults, but none are available. PISA 2006 will provide measures of science literacy that should be included in future indices.
Indicators on graduation rates by level of education and field of qualification and gender are important. We need to be able to develop composite indicators of education pipeline output to the population in general, the labour force and for considering issues such as representation of men and women in fields of S&E and S&E occupations. Eurostat has this data available on a timely basis for the EU countries and the data are also available for the US, Japan, and Canada. The minimum requirements are indicators for level of education ISCED 5A and 5B (all tertiary education from a one-year diploma to completion of a bachelor’s level degree) and ISCED 6 (PhDs). This represents a change to the indicator under A2a4 (see below), as we need to have breakdowns for undergraduates as well as PhDs. We can then consider the share of the population (whether employed or unemployed) with a university qualification.11
General education by field of study can be included under HRST (human resources in science and technology) indicators under A2b5. The most useful indicator by field of study is to express specific fields as a share of the total. Too often there is a focus on output in terms of the number of graduates, even though the specialization is ‘slipping’ in terms of the share of total degree output.
The key indicators included here are:
• A2a1 – Pisa mathematical literacy of 15 year olds,
• A2a4 – New PhDs per thousand population aged 25-34,
• A2a5 – Percent of working age population (15-64) with a tertiary education (ISCED 5 and above),
• A2a7 – Percent of adult population (25-64) with an earned doctorate degree (ISCED 6).
11 With graduates by level as the numerator, and the overall population as the denominator, we have a measure of the education of the adult population; with the number as graduates as the numerator and the labour force as the denominator we have a measure of the skill levels of the labour force. Both are important education indicators, one presenting a broader picture for public policy and one more refined for labour force and immigration policy. If resources are short then we should go with labour force as the denominator because the PISA results provide indicators of general education for the general population.

© http://kei.publicstatistics.net - 2008 13
2.1.2.2 A2b - HRST education indicators
It is important to have indicators on HRST in the work force and this will include a variety of skill levels. The number of researchers per 1,000 labour force is a traditional indicator and remains in demand by policy. It is linked to other R&D investment measures.
The only indicator included in the dataset under this category is:
• A2b1 – Total HRST as a percentage of the working age population.
2.1.2.3 A2c - Skills
Developing indicators on skills has always been a difficult task especially when one moves beyond ISCED. Formal postsecondary qualifications and indicators of the ‘upper’ skill levels are still the best choice, due to data availability. Measures and indicators on other skills of relevance to a KBE are also available for some countries, such as non-traditional certification of specialists and graduates of e-training programmes.
Part of the change brought about in the KBE and enabled by ICT is the onus on employees to be responsible for their own training programmes, as companies retreat from their responsibility to train and/or provide training for their employees. For some enterprises a new piece of software is the extent of training. Under the theme of ‘life-long learning’, Eurostat maintains a database on enterprise training activities. We should consider an indicator on training enterprises as a percent of all enterprises and we could develop composite indicators by considering the type of training. If resources allow, we should include an indicator on training by NACE. Life-long learning and hours spent on training are important indicators.
At this time, the key indicators included in the dataset are, however, limited to the following:
• A2c2 – Average hours employed persons spend in training,
• A2c3 – Participation in life-long learning per working age population (25-64).
2.1.2.4 A2d - Creativity
Highly trained and educated individuals are not the only focus of human resources in the KBE. The ability to create and combine knowledge involves much more than formal education and qualifications. We therefore need indicators on the creative capacity or potential of people. In order for persons to think and work in a creative manner, particularly to take risks and pursue new thinking that may lead to innovation, a person must have a certain level of comfort or trust in his/her environment. For this indicator the European Values Study Survey, a large-scale longitudinal survey that includes measures
KEI-WP2-D2.5 14
of social and political values, is useful. The data can be used to develop indicators of social and political trust.
As mentioned earlier, it is important to develop indicators that go beyond the traditional indicators. This includes considering the various human resources in the innovation chain that contribute to creativity and not just researchers. It also means considering occupations beyond the core S&T occupations and the need to consider creative occupations including ISCO 1 (senior managers and officials), ISCO 2 (professionals such as scientists and researchers) and ISCO 3 (technicians and associated professionals), all part of the chain of processes of innovation.
The WP2 dataset of indicators does not include any creativity indicators.
2.1.2.5 A2e - Mobility
The mobility of scientists and engineers is commonly believed to diffuse knowledge and consequently support innovative capabilities, but indicator development remains weak. There are two dimensions to the policy interest in mobility. There are policies to promote ‘internal’ mobility where the situation is seen as win-win, benefiting all parties. Examples include programmes to encourage mobility within Europe and hence knowledge exchange, or programmes to facilitate public sector and private sector exchanges to encourage knowledge diffusion. Government-university interchanges encourage networking and knowledge exchange. European policy has identified the need to improve the commercialization of R&D and so policies that encourage and enable commercialization are important. Then there is mobility that benefits one party but may cost the other party. Flows from public research to private research due to lack of R&D support may undermine public research needs. A key policy interest concerns skilled researchers moving outside of the EU to carry out their research and the apparent lack of attraction the EU has for highly skilled foreign researchers. Although the data may be less reliable than desired, it is still important to develop some indicators on international flows. The issue of international mobility and immigration patters is taken up in more detail under C1 (globalisation).
Many of the available mobility indicators are based on anecdotal evidence and ad hoc surveys, although these indicators are critical for R&D policy needs from education to immigration to R&D investment.
The only indicator included in the dataset under this category is:
• A2e1 – Job to job mobility by NACE.

© http://kei.publicstatistics.net - 2008 15
2.1.3 A3 - Knowledge production and diffusion
Surpassed only by the ‘madness’ for indicators and measures for ICTs over the last decade, indicators for R&D continue to flourish and expand in country coverage and international comparability.
The key sources for R&D indicators are national statistical agencies, Eurostat and the OECD. There are R&D indicators of some shape or form for every country, although the time series vary. Coverage of emerging economies is improving.
2.1.3.1 A3a - R&D family of indicators
Indicators grouped under A3a represent the ‘traditional’ R&D family of indicators. There are time series from 1981 to 2005 and good country coverage. The key indicators are as follows:
• A3a1 - GERD expenditure/GDP,
• A3a3 - GERD per capita population,
• A3a4 - Estimated civil GERD as a percentage of GDP,
• A3a5 - GOVERD as a percentage of GDP,
• A3a6 - HERD as a percentage of GDP,
• A3a7 - GBAORD as a percentage of GDP,
• A3a8 - BERD as a percentage of GDP,
• A3a10 - BERD as a percentage of value-added in industry,
• A3a11 - BERD/GERD.12
2.1.3.2 A3b - Patents
Patents measure invention. Some of the data on a patent application or grant can be used to measure the diffusion of knowledge. The KBE brings new challenges to the value and application of this traditional group of indicators. There is increasing collaborative patenting across national boundaries.
Patent indicators are used by policy analysts as a measure of technology, knowledge and R&D outputs. But patent indicators are of limited value to innovation because not all innovations or inventions are patented and patent propensity rates vary substantially across sectors. Sometimes patents are not sought because the inventor wishes to maintain
12 The indicator on business expenditures on R&D as a share of total R&D expenditures (A3a11) is an indicator identified as important for the Lisbon agenda. This indicator is, however, limited because it does not report on efforts of European R&D firms in terms of performing R&D but only on European firms’ expenditures on R&D.

KEI-WP2-D2.5 16
secrecy. Patenting activity is even more concentrated than R&D. In 2002, only five countries (France, Germany, Japan, the United Kingdom, and the United States) accounted for 84% of triadic patent families compared with 78% of R&D expenditures (OECD, 2005a).
For the KBE, it is important to consider the innovative process at the international level and to use triadic patents, in which the same patent is granted by the USPTO, the EPO and the JPO. The advantage of triadic patents is that they capture the most economically valuable inventions and overcome the home country advantage (for instance European firms are more likely to patent in Europe than American firms, and American firms are more likely to patent in the United States). The disadvantage of triadic patents is that they lag other patent data by two years.
The key indicators included in here are:
• A3b1 – EPO patent applications by priority year per million population,
• A3b2 – EPO high tech patent applications by priority year per million population,
• A3b3 – USTPO patent grants per million population,
• A3b4 – USTPO high tech patent grants per million population,
• A3b5 – Triadic patent families by priority year per million population.
2.1.3.3 A3c - Bibliometrics
The third group of indicators for knowledge production and diffusion are bibliometrics, or indicators for scientific publishing and citations. They can be used to develop indicators of scientific effort and knowledge of a nation. The National Science Foundation (NSF) produces a time series by country for several key indicators including: S&E articles by country, per capita output of S&E articles by country, and country portfolios of S&E articles by field of specialization. We may wish to examine an indicator with S&E article output by specialization as the numerator and the number of S&E degrees by specialization as the denominator. The data are available online at www.nsf.gov. The key indicators do not include any bibliometric indicators.
2.1.3.4 A3d - Knowledge flows
The fourth family of indicators looks at knowledge flows in terms of firms and public research institutes and universities. The value firms place on knowledge flows with public research institutes is an important measure of the value of public research to innovation and the ease at which firms can access and commercialize this knowledge. Knowledge flows among firms is also an important indicator which can be developed by examining the share of firms collaborating on innovation. Here firm size would be useful.
The key indicators included in the dataset are:

© http://kei.publicstatistics.net - 2008 17
• A3d1 – Share of all firms reporting public research with universities as a high value information source,
• A3d2 – Share of all firms reporting public research with institutes as a high value information source,
• A3d3 – Share of all firms reporting public universities as a research cooperation partner,
• A3d4 – Share of all firms reporting public institutes as a research cooperation partner,
• A3d5 – Share of SMEs collaborating on innovation.
2.1.3.5 A3e - Total investment in intangibles
The last group of indicators under the drivers of a KBE considers investment in knowledge as a share of GDP. For this indicator, data on R&D, higher education and investment in software are combined. Another indicator is the value added of knowledge intensive exports expressed as a share of total exports. The NSF, in its 2006 Indicators Report, provides a table of data for 1980 to 2003 showing world industry value-added by industry. There is also a table on exports/imports by industry that would augment the Eurostat data.
The only indicator included in the dataset under this category is:
• A3e1 – High tech exports/total exports.
2.1.4 A4 - Innovation, entrepreneurship and creative destruction
Innovation is widely believed to be central to European economic competitiveness and is consequently featured in a range of policy documents. Many pro-innovation policies are based on subsidizing knowledge production, either directly or through fiscal benefits for R&D, but innovation is also supported through manufacturing extension services to promote the adoption of productivity enhancing technologies such as Advanced Manufacturing Technology (AMT) or ICT, other information services, and subsidies to SMEs for hiring scientists and engineers or acquiring new technology. A few countries also provide government support for innovative start-ups, such as venture capital. Entrepreneurship is difficult to support, but there is widespread discussion about including courses on entrepreneurship and patenting in the syllabus for science and engineering students. Entrepreneurship is also supported directly through government provision of grants, loans and early-stage financing to small innovative firms and indirectly through tax relief to investors in venture capital firms.

KEI-WP2-D2.5 18
2.1.4.1 A4a - Entrepreneurship
Our interest in entrepreneurship is due to its role in the creative destruction brought about by innovation in the KBE and the ability of countries to respond efficiently, both by moving into new areas of economic opportunity and to replace inefficient producers. The ‘churn’ for enterprises from the upheaval in activities driven by ICTs and globalization can be measured by the entries and exits of firms. The entries and exits reflect births and deaths of firms, as well as relocation. Rather then consider firm entries and firm exits apart, it makes most sense to develop an indicator of ‘churn’ by using both data sets. The references in the dataset for these two indicators are:
• A4a2 – Firm entries,
• A4a3 – Firm exits.
2.1.4.2 A4b - Demand for innovative products
The share of the population aged 15-29 is a good indicator of potential demand for innovative products. This is the age group that quickly adopts new products and consumer demand drives innovation in products. At the other end of the scale is the need to have indicators on the potential demand for new products and technologies by the ‘older’ cohort, that of persons aged 65 and over. One indicator of comfort with new technology and potential for increased demand is the use of the internet and ICTs. As part of its survey of the internet for specific purposes, Eurostat provides data by age cohort. For projecting demand for innovative products, we could also construct an indicator with below 65 age cohorts together with population projections and usage to estimate demand for internet and related technologies.
We also need to consider indicators for other activities that could drive the need for innovative products. For example, the ageing of the population could accelerate the use of the internet by the older age cohorts for e-health, just as life-long learning can generate increased demand for innovative products through e-learning and e-communities. Concerns about the environment and energy could also drive e-commerce and e-working (e.g. teleworking; conference calls in lieu of face-to-face meetings).
Another indicator for the demand for innovative products is to develop an index on the sophistication of local buyers. This is the best indicator for demand for innovative products and is available from WEF, 2005. The purchasing power as measured by per capita GDP is another important indicator.
The government is an important driver of innovative products given its appetite and budget for work reorganization and change. Government procurement of advanced technology products is therefore an important indicator of demand. Firm level absorption is another key indicator for potential demand for innovative products and processes.

© http://kei.publicstatistics.net - 2008 19
We suggest the current key indicators include:
• A4b3 – GFCF (cross fixed capital formation) as a percentage of GDP,
• A4b7 – Firm level technology absorption.
2.1.4.3 A4c - Financing of innovation
Indicators on venture capital remain one of the weakest groups of indicators for measuring innovation. The NSF publishes a time series (1980 to 2004) on US venture capital disbursements by industry, by financing stage from early stage to seed stage to later stage and by venture capital seed disbursements. Unfortunately, no such data exist at the world level. However, there are some data available via Eurostat, and while these data are not the most reliable, they can provide us with a rudimentary indicator on venture capital financing in the early stage. We have not included indicators in our dataset for this category.
2.1.4.4 A4d - Innovation sales share
We have a set of indicators to look at share of total sales from innovative products. Here we consider the share of firms introducing new products to the market and sales from the new to market products. The data for these indicators come mostly from the CIS:
• A4d1 – Share of firms introducing new-to-market products,
• A4d2 – Share of total sales from new-to-market products,
• A4d3 – Share of firms introducing new-to-firm products,
• A4d4 – Share of total sales from new-to-market products,
• A4d5 – Community design registrations per million population.
2.1.4.5 A4e – Organisational innovation13
Organisational innovation can be a key factor in both productivity growth (Brynjolfsson and Hitt, 2000; Murphy, 2002) and the ability of firms to profit from product and process innovation. The fourth CIS provides new options for constructing indicators on organisational innovation on 1) knowledge management, 2) organisation of work, and 3) relationships with other firms or public institutions. CIS-4 also asks about four types of outputs of organisational innovation, so it is possible to determine which of the three types of organisational innovation have the greatest impacts on quality or production costs. A main limitation for CIS indicators on organisational innovation is the lack of time series.
13 Organisational innovation is covered by WP4 on missing indicators and future indicator needs.
KEI-WP2-D2.5 20
Research on the KBE shows that work reorganisation is one of the main organisational changes in today’s workplaces. So far, it has been difficult to find timely and comparable indicators on new work practices. Surveys tend to be carried out on an ad hoc basis and at national levels. A 1996 survey of European managers in ten EU countries found that workplaces with direct participation in management outperformed those without direct employee participation in management. Due to its potential impact on firm performance and employment, we need indicators on the level of responsibility given to employees. Low levels of responsibility are correlated, at the national level, with poor innovation performance. An intriguing possibility is that low responsibility could also be responsible for possible European weaknesses in commercialization and mobility.
Organisational innovation is the current focus of several large projects, for example, MEADOW, a European Commission framework programme project, and it is also covered by the third revision of the Oslo Manual, as well as the current revision of the next CIS (CIS 2008).
The indicator we have included in the dataset for organisational innovation is based on data from the CIS and considers the share of SMEs reporting non-technological change, including organizational innovation:
• A4e1 – Percent SMEs reporting non-technological change.
2.2 Group B: Outputs - Economic performance, society and the KBE These indicators include economic output indicators related to income, productivity and employment, as well as indicators measuring social impacts, or social performance related to the environment and people living and working in the KBE.
2.2.1 B1 - Economic outputs14
The indicators to measure economic output cover trends of at least ten years and also ensure reliable and valid comparability at the international level. The participation, representation and other economic variables for gender differences remain a policy priority and, where feasible, we should provide indicators for both sexes combined, for men, and for women, especially in the case of employment indicators.
14 A number of basic economic indicators provide the basis with which these and other indicators are calculated, and such basic indicators are therefore fundamental and necessary for other indicator development. They represent indicators that are in the ‘statistical toolbox’ for comparisons and other indicator development. For instance, R&D expenditures are expressed as a percentage of GDP. Total employment is used to calculate employment rates and employment growth. These indicators are available through Eurostat, and most are readily accessible on-line with extended time series. The OECD is also a source useful for these core statistics. The data are current and time series are available.

© http://kei.publicstatistics.net - 2008 21
2.2.1.1 B1a - Income
The key income indicators included in the dataset are:
• B1a1 – GDP per capita in PPS,
• B1a2 – Real GDP growth rate.
2.2.1.2 B1b – Productivity
The key productivity indicators we have included are:
• B1b1 – Labour productivity per hour worked,
• B1b3 – GFCF (gross fixed capital formation) in millions of Euro and as a percentage of GDP.
2.2.1.3 B1c - Employment
The core employment indicators included are:
• B1c1 – Total employment growth,
• B1c2 – Total employment rate.
2.2.2 B2 - Social performance
Moving beyond indicators of R&D and innovation, we have a group of indicators under social performance that include environment measures, employment and economic welfare and quality of life indicators.
Indicators for the social impacts of the KBE can be developed from a range of data sources including the more traditional and readily available statistics on housing, education and health. At the same time, indicators are being developed to shed light on how ‘happy’ people are, living and working in the KBE. There seem to be a number of social surveys carried out at national and international levels that can provide indicators on society in the KBE, from how much people use their computer to how happy people are at work and at home.
The Eurobarometer survey is conducted at least twice a year across the EU, providing data and indicators on a timely basis. The Eurobarometer provides links to similar surveys such as the International Social Survey which has been conducted annually since 1985 for some 35+ countries and is available through ISSP. In the US, the Conference Board surveys households about job satisfaction, and in Canada and other countries there are social surveys and opinion surveys. There appears to be more than sufficient sources of indicators on societal aspects of living and working in the KBE, and although the data

KEI-WP2-D2.5 22
may not be fully comparable across countries, the type and scope of data collected lends itself to indicator development for international comparability.
The work of the SIBIS project provides indicators that make use of existing statistics and are supplemented by fresh and/or new data as surveys are carried out. The scope of the indicators include the basic access and usage of ICTs, information on security and e-shopping, e-commerce, e-work, e-government, e-health, digital literacy, learning and training (e.g. participation in life-long learning, use of e-learning) and digital divides (e.g. the Digital Divide Index including country comparisons) (SIBIS, 2005). From STILE (see www.stile.be), there are indicators to do with the monitoring of the European labour market in the KBE.
2.2.2.1 B2a - Environmental indicators
There are several indicators that address some of the top policy concerns regarding the environment. First there is the effect of green house gas emissions. For this, we can construct an indicator on greenhouse gas emissions per capita, where the lower the figure, the better the performance. Another similar indicator measures the energy intensity of the economy.
Transportation is another policy priority and here we have indicators of passenger transport within Europe showing the share of passenger cars, buses and trains. An environmental tax is a tax whose tax base is a physical unit (or a proxy of it) of something that has a proven, specific negative impact on the environment. Total revenues for environmental taxes include taxes on transport, energy, pollution and resources. One indicator to consider could be the environmental investment of the public sector as a share of tax revenues from an environmental tax.
The only indicator under this category included in our dataset for current key indicators is:
• B2a2 – Energy intensity of the economy.
2.2.2.2 B2b - Employment and economic welfare
Indicators on employment conditions and economic welfare are not new for a KBE, but the increasing fears of economic polarization brought about by new technologies and the rapid pace of change mean that these indicators will continue to be very important for policy. With the ageing of the population, the employment rate of older workers will move to the forefront of unemployment matters. The long-term unemployment of workers and the underemployment of certain groups such as women are other key issues for policy debate. The growing inequality of income distribution and the continuance of the earnings gap between men and women add to the economic welfare policy priority list. The earnings gap is a particular policy concern in science and engineering occupations where the desire to increase participation of women may be hampered by

© http://kei.publicstatistics.net - 2008 23
salary disparity between the sexes. Most of the data for this group of indicators come from the Labour force survey. All of the data are available through Eurostat, and have good country coverage and time series.
The key indicators included in the dataset are:
• B2b1 – Employment rate of older workers,
• B2b2 – Long term unemployment rate,
• B2b3 – Inequality of income distribution.
2.2.2.3 B2c - Quality of life indicators
This set of indicators is important for social performance measures. These indicators are of key policy interest as the KBE affects all aspects of working and home life. Quality of life is a reoccurring theme of concern when the impact of ICTs and the KBE are addressed.
Life expectancy rates are measures of quality of life, physical and psychological. Europeans are enjoying increased life expectancy. The ability of people to lead their lives and work in good health is important. What share of the population deals with chronic conditions on a daily basis?
Indicators of ‘happiness’ are important measures of peoples’ ability to adapt to the changing world and enjoy the benefits of new technologies and economic growth. Eurobarometer surveys the opinions of Europeans on a variety of issues and includes ‘happiness’ measures.
There are other quality of life indicators that are related to work. For example, we would expect to see a diminishing share of people forced to work at night or on shifts as this reduces the quality of home and family life. Workplace innovations and ICTs are supposed to improve working conditions — are the opportunities being enjoyed by all?
The dataset linked to this report does not include any of the above indicators.
2.3 Group C: Globalisation This last set of indicators measures globalisation. The included areas have already been examined in part in other indicator classes, including trade, knowledge production and diffusion, economic structure and human resources. Here the focus is on the international dimension of these indicators. Some of the data sources are the same and some focus on international indicators.
KEI-WP2-D2.5 24
2.3.1 C1a - Trade Imports and exports are important measures of economic health. Information is available through Eurostat as well as the OECD. The NSF, in its 2006 Indicators Report, provides a table of data for 1980 to 2003 showing world exports/imports by industry that would augment the Eurostat data. Although data on FDI intensity are more typically used to measure development, for example, with FDI indicators used to quantify the effects of foreign researchers on host countries, this indicator can be of use here as well.
The key indicators included in the dataset for this category are:
• C1a2 – FDI intensity,
• C1a3 – Direct inward investment flows as percent of GDP.
2.3.2 C1b - Knowledge production and diffusion Here we have a range of indicators that consider the effects of globalisation in the KBE on knowledge production and diffusion. We look at R&D spending of affiliates as a share of total business expenditures on R&D. The OECD patent data shows that during the 1990s, there was an increase in international collaboration (patents with foreign co-inventors) (OECD, 2004, p.7). The 2006 NSF report has indicators on the international co-authorship of S&E articles. Another important indicator is the share of R&D funded from abroad.
The key indicators included in the dataset for this category are:
• C1b1 – R&D spending of affiliates as a percent of total BERD,
• C1b6 – Share of R&D funded from abroad.
2.3.3 C1c - Economic structure International indicators for economic structure are a challenge. Perhaps the most feasible indicators to consider would be total manufacturing value-added of affiliates, and foreign control. Our dataset does not contain indicators in this category.
2.3.4 C1d – Human resources The internationalisation of human resources is a primary concern for policy makers. There is a balance to maintain between encouraging flows of knowledge and the flow of skilled workers, and ensuring that national business and citizenry concerns are served. This group of indicators addresses some of the key issues including movement of workers and the role of non-national workers. The key issues include the presence of foreign students in EU higher education and European degree holders leaving for work or further study in foreign countries. While the share of foreign students enrolled in
© http://kei.publicstatistics.net - 2008 25
postsecondary education is a useful indicator, we would argue that it is as important if not more so to have indicators of the share of S&E degrees awarded to foreign students.
Of particular concern to policy makers is the potential damage on the national supply and reputation of research when researchers and highly skilled S&E workers pack up and leave for foreign destinations. The problem is that there are virtually no exit surveys and very little is known about the volume of the brain drain, or if indeed there is a brain exchange. At one of the KEI workshops, a representative of Nokia made the situation clear — one of the most important factors in R&D location is the availability of local highly skilled personnel and/or locating where highly skilled personnel are willing to live and work.
We need to develop better indicators of international mobility. For now we can make use of the US immigration files that report on the number of highly skilled workers in the US. Other countries can provide this information (e.g. Canada), but by far the biggest drain is to the US. The US immigration data are available for all EU countries online and at no charge. There is another data set available from the NSF that provides indicators on the intentions of Europeans graduating at US universities — in particular, whether the European-born graduates plan to stay in the US and under what terms (e.g. type of employment, sector of employment). These data may be available by a special request for tabulations.
The key indicators included in the dataset for this category are:
• C1d3 – Number of non-EU foreign students in tertiary education (ISCED 5) as a percentage of all tertiary education (ISCED 5),
• C1d4 – Number of EU foreign students in tertiary education (ISCED 5) as a percentage of all tertiary education (ISCED 5),
• C1d5 – Foreign PhD students (ISCED 6) as a percentage of total PhD enrolment.

KEI-WP2-D2.5 26
3. CONCLUSIONS AND FURTHER THOUGHTS
3.1 Overall conclusions In this work package, indicators have been grouped and discussed according to economic and social input and output indicators. Table 1 in Annex I lists the 64 indicators which have been selected in WP2 to represent the best currently available indicators to measure the KBE. These indicators have been chosen by the KEI research team from the pool of currently available indicators. As noted above, they represent a conservative viewpoint on measuring the KBE.
For the most part, reasonable coverage across years and countries is available for these indicators. Although an increasingly popular topic in policy making as well as research, sectoral performance is still not easily incorporated into KBE indicators. Hopefully current projects will improve our knowledge of the present-day economy at the sectoral level.
We have classified our KBE indicators into four main drivers (production and diffusion of ICT; human resources, skills and creativity; knowledge production and diffusion; and innovation, entrepreneurship and creative destruction), two main outputs (economic output and social performance), and a number of horizontal indicators measuring globalisation (trade; knowledge production and diffusion; economic structure; and human resources).
This report also touches on other issues related to measuring the KBE. These include indicators that need to be developed to gauge some of the societal and economic changes taking place. As an example, more detailed information by gender is needed to measure how the role of women is changing in the KBE. Finally, we have also given a brief summary of the results of interviews with policy analysts on the types of indicators that they would like to have. These interviews show that the current indicators for innovation are not adequate, partly because of issues to do with timeliness, detail or international comparability, but partly also because of the changing needs for indicators in a KBE.
3.2 Observations on indicator availability for the KBE Over the last decade, there have been tremendous efforts to develop measures and indicators for ICTs at both the national and international levels of comparability. It began with the efforts of the US and Canada to develop guidelines for the measurement of the information society and the launching of the OECD Economics of the Information Society workshops beginning in 1996. The workshops focused on issues of new and improved indicators, the barriers to realising the benefits of ICTs, indicators to be developed to supplement existing indicators and the international harmonisations of indicators. As a result, statisticians and policy makers worked together to lay the groundwork for data and indicator needs. For example, a working document by Gault et

© http://kei.publicstatistics.net - 2008 27
al. (1996), released by Industry Canada, described the state of knowledge of the economic, social and cultural impacts of the global information infrastructure and discussed the implications for policies for an emerging global information economy and society. This brought about a strong focus (if not almost single minded in some cases) on ICT indicators. This continues in many statistical agencies today. As a result, this set of data represents some of the most comprehensive in terms of scope and country comparability of the indicators we covered.
R&D and innovation indicators, thanks to a lot of work at the international level by Eurostat and the National Experts on Science and Technology Indicators (NESTI) committee of the OECD, continue to advance in terms of scope, coverage and international comparability. Of particular relevance to this project are the recent developments at the international level to help define and collect the main indicators for emerging economies such as China and India. There are also efforts underway at the European level to enhance the scope and coverage of R&D indicators for the new member states of the EU. The globalisation accelerated by ICTs and the global nature of work and trade means the striving for international comparability of indicators will continue. As such, it is important to monitor indicator progress at the international level as well as at the national level. Particular follow-up needs to continue on the indicator developments in China and India, for example.
Human capital indicator development has seen some progress, but it lags behind in terms of coverage and the potential for international comparability. In terms of skilled workers, there has been some progress on developing indicators for knowledge that goes beyond the simple assumption that the high tech sector equals the high skill sector. There is work underway to explore the knowledge base of sectors. Indicators of knowledge intensity as defined by skill level and/or occupation are available for many countries. Indicator development of formally educated skilled workers is making slow progress, while indicators for life-long learning and non-formal learning remain underdeveloped. For the most part, these indicators rely upon independent national efforts and ad hoc surveys for information.
A number of countries have set up programmes to develop indicators for the KBE. For example, Australian Bureau of Statistics has a programme to measure Australia’s progress in the KBE. Through this programme, there is timely data on a range of key indicator categories (or ‘headline’ categories) including individuals, the economy, the environment, and living together in our society. Indicator development and collection will also benefit from these national efforts to measure and understand the KBE.

KEI-WP2-D2.5 28
REFERENCES
APEC, 2002. EC Economic Committee Meeting — KBE Indicators, Australian proposal, Meeting, Mexico.
Baldwin, J. R., and Beckstead, D., 2003. Knowledge Workers in Canada’s Economy, 1971 to 2001, Ottawa, Canada: Ministry of Industry.
Brynjolfsson, E., and Hitt, L. M., 2000. Beyond computation: information technology, organizational transformation and business performance. Journal of Economic Perspectives 14:23-48.
Gault, F., 2005. Measuring Knowledge and Its Economic Effects: The Role of Official Statistics, paper presented at National Academies of Science, Washington D.C., January 10-11.
Gault, F. et al, 1996. Measuring the Global Information Infrastructure for a Global Information Society, Concepts and Indicators, Industry Canada.
Murphy, M., 2002. Organisational change and firm performance. STI Working Paper 2002/14, Paris: OECD.
OECD, 2004. Growth in Services, Fostering Employment, Productivity and Innovation, Report for the Meeting of the OECD Council at the Ministerial Level.
OECD, 2005a. Compendium of Patent Statistics, Paris: OECD.
OECD, 2005b. Handbook on Constructing Composite Indicators: Methodology and User Guide, STD/DOC(2005)3, Paris: OECD.
Newman, N. C., Porter, A. L., Roessner, J. D., Kongthon, A., and Xiao-Yin Jin, 2004. Differences Over a Decade: High Tech Capabilities and Competitive Performance of 28 Nations, Georgia Tech.
SIBIS, 2005. Statistical Indicators Benchmarking the Information Society.
© http://kei.publicstatistics.net - 2008 29
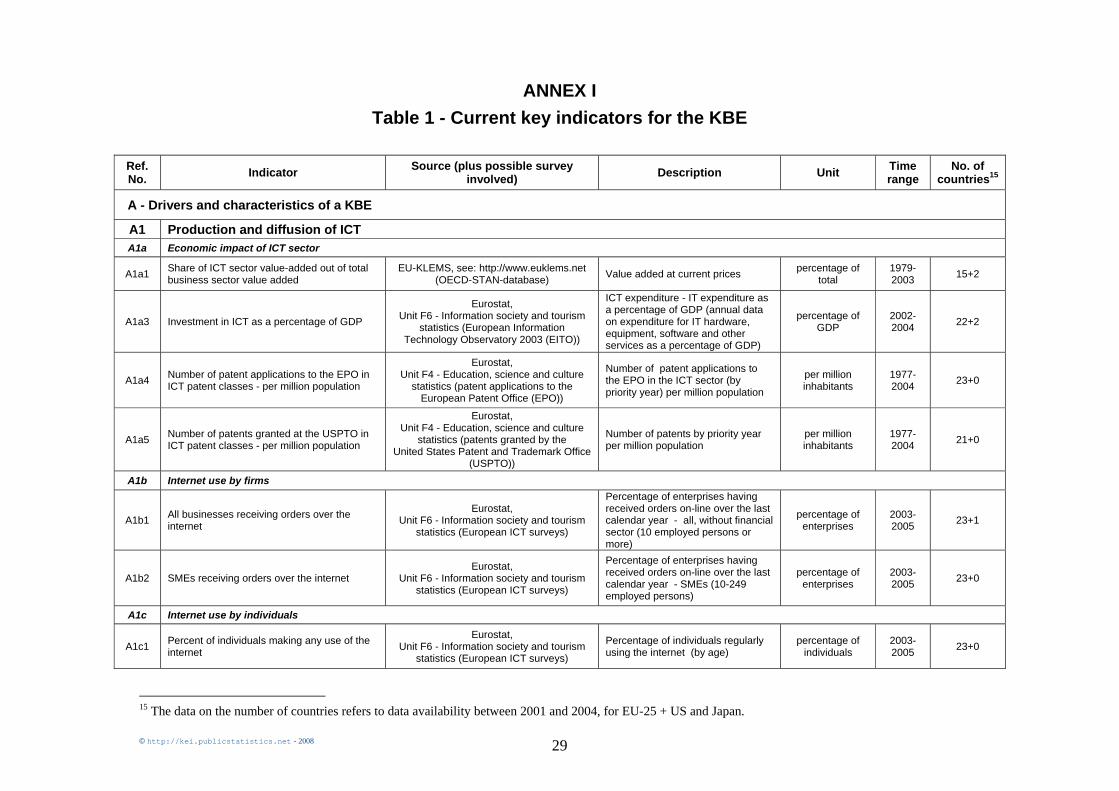
ANNEX I Table 1 - Current key indicators for the KBE
Ref. No. Indicator Source (plus possible survey
involved) Description Unit Time range
No. of countries15
A - Drivers and characteristics of a KBE
A1 Production and diffusion of ICT A1a Economic impact of ICT sector
A1a1 Share of ICT sector value-added out of total business sector value added
EU-KLEMS, see: http://www.euklems.net (OECD-STAN-database) Value added at current prices percentage of
total 1979-2003 15+2
A1a3 Investment in ICT as a percentage of GDP
Eurostat, Unit F6 - Information society and tourism
statistics (European Information Technology Observatory 2003 (EITO))
ICT expenditure - IT expenditure as a percentage of GDP (annual data on expenditure for IT hardware, equipment, software and other services as a percentage of GDP)
percentage of GDP
2002-2004 22+2
A1a4 Number of patent applications to the EPO in ICT patent classes - per million population
Eurostat, Unit F4 - Education, science and culture
statistics (patent applications to the European Patent Office (EPO))
Number of patent applications to the EPO in the ICT sector (by priority year) per million population
per million inhabitants
1977-2004 23+0
A1a5 Number of patents granted at the USPTO in ICT patent classes - per million population
Eurostat, Unit F4 - Education, science and culture
statistics (patents granted by the United States Patent and Trademark Office
(USPTO))
Number of patents by priority year per million population
per million inhabitants
1977-2004 21+0
A1b Internet use by firms
A1b1 All businesses receiving orders over the internet
Eurostat, Unit F6 - Information society and tourism
statistics (European ICT surveys)
Percentage of enterprises having received orders on-line over the last calendar year - all, without financial sector (10 employed persons or more)
percentage of enterprises
2003-2005 23+1
A1b2 SMEs receiving orders over the internet Eurostat,
Unit F6 - Information society and tourism statistics (European ICT surveys)
Percentage of enterprises having received orders on-line over the last calendar year - SMEs (10-249 employed persons)
percentage of enterprises
2003-2005 23+0
A1c Internet use by individuals
A1c1 Percent of individuals making any use of the internet
Eurostat, Unit F6 - Information society and tourism
statistics (European ICT surveys)
Percentage of individuals regularly using the internet (by age)
percentage of individuals
2003-2005 23+0
15 The data on the number of countries refers to data availability between 2001 and 2004, for EU-25 + US and Japan.

KEI-WP2-D2.5 30
Ref. No. Indicator Source (plus possible survey
involved) Description Unit Time range
No. of countries15
A1c4 Broadband penetration rate
Eurostat, Unit F6 - Information society and tourism
statistics (DG INFSO survey on “Broadband access in the EU”)
Broadband penetration rate (number of broadband lines per 100 pop.)
percentage of population
2002-2005 15+0
A1d Government ICT
A1d2 Percent individuals who use the internet to interact with public authorities (e-government)
Eurostat, Unit F6 - Information society and tourism
statistics (Community Survey on ICT Usage in Households and by Individuals)
Percentage of individuals who have used the internet, in the last 3 months, for interaction with public authorities
percentage of individuals
2002-2005 19+2
A2 Human resources, skills and creativity
A2a General education
A2a1 Pisa mathematical literacy of 15 year olds OECD (Pisa Survey) Mean performance per country in each PISA domain mathematical literacy
score points 2003 19+2
A2a4 New PhDs per thousand population aged 25-34
Eurostat, Unit F4 - Education, science and culture
statistics (joint UOE (UNESCO Institute of Statistics/ OECD/Eurostat) questionnaires
on education statistics)
Tertiary education graduates (Graduates (ISCED 6) per 1000 of the population aged 25-34)
graduates per 1000 of
population aged 25-34
1998-2004 24+2
A2a5 Percent of working age population (15-64) with a tertiary education (ISCED 5 and above)
Eurostat, Unit F1 - Demographic and migration
statistics (Census / Micro-Census)
Population by sex, age, country of birth and selected social indicator
absolute numbers of
persons aged 15-64 with ISCED 5-
6
2001 21+0
A2a7 Percent of adult population (25-64) with an earned doctorate degree (ISCED 6)
Eurostat, Unit F1 - Demographic and migration
statistics (Census / Micro-Census)
Population by sex, indicator of citizenship, age and highest level of educational attainment (Second stage of tertiary education leading to an advanced research qualification - level 6 (ISCED 1997))
absolute number of graduates 25
and 64 2001 16+0
A2b HRST education
A2b1 Total HRST as a percentage of the working age population (15-64)
OECD - MSTI, Eurostat, Unit F1 - Demographic and migration
statistics
Total R&D personnel per thousand total employment, Total Employment (thousands)
per thousand total employment
1981-2005 23+0
A2c Skills
A2c2 Average hours employed persons spend in training
Eurostat, Unit F4 - Education, science and culture
statistics
Hours in CVT (continuing vocational training) courses per 1000 hours worked (all enterprises), by NACE
Number of hours 2004 22+0
A2c3 Participation in life long learning per working age population (25-64)
Eurostat, Unit D1 - Labour market (European Union
Labour Force Survey)
Percentage of the adult population aged 25 to 64 participating in education and training (any kind)
percentage of population aged
25 to 64
1994-2005 25+0
A2e Mobility
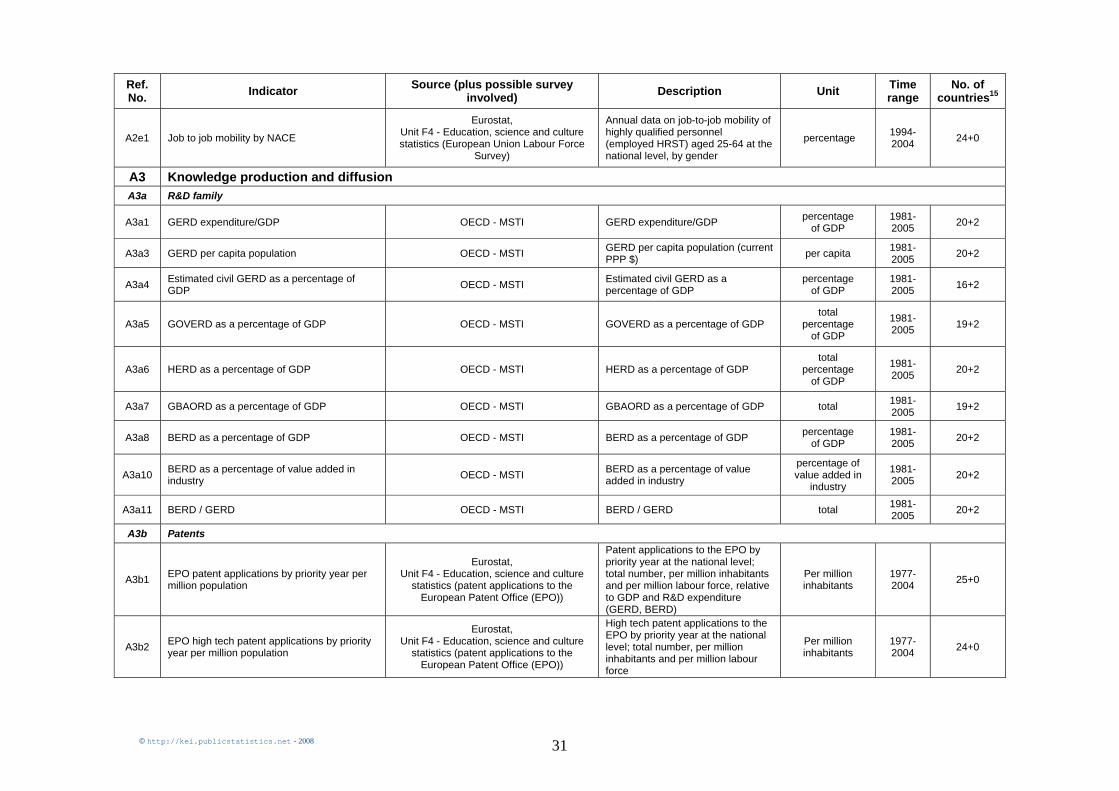
© http://kei.publicstatistics.net - 2008 31
Ref. No. Indicator Source (plus possible survey
involved) Description Unit Time range
No. of countries15
A2e1 Job to job mobility by NACE
Eurostat, Unit F4 - Education, science and culture statistics (European Union Labour Force
Survey)
Annual data on job-to-job mobility of highly qualified personnel (employed HRST) aged 25-64 at the national level, by gender
percentage 1994-2004 24+0
A3 Knowledge production and diffusion
A3a R&D family
A3a1 GERD expenditure/GDP OECD - MSTI GERD expenditure/GDP percentage of GDP
1981-2005 20+2
A3a3 GERD per capita population OECD - MSTI GERD per capita population (current PPP $) per capita 1981-
2005 20+2
A3a4 Estimated civil GERD as a percentage of GDP OECD - MSTI Estimated civil GERD as a
percentage of GDP percentage
of GDP 1981-2005 16+2
A3a5 GOVERD as a percentage of GDP OECD - MSTI GOVERD as a percentage of GDP total
percentage of GDP
1981-2005 19+2
A3a6 HERD as a percentage of GDP OECD - MSTI HERD as a percentage of GDP total
percentage of GDP
1981-2005 20+2
A3a7 GBAORD as a percentage of GDP OECD - MSTI GBAORD as a percentage of GDP total 1981-2005 19+2
A3a8 BERD as a percentage of GDP OECD - MSTI BERD as a percentage of GDP percentage of GDP
1981-2005 20+2
A3a10 BERD as a percentage of value added in industry OECD - MSTI BERD as a percentage of value
added in industry
percentage of value added in
industry
1981-2005 20+2
A3a11 BERD / GERD OECD - MSTI BERD / GERD total 1981-2005 20+2
A3b Patents
A3b1 EPO patent applications by priority year per million population
Eurostat, Unit F4 - Education, science and culture
statistics (patent applications to the European Patent Office (EPO))
Patent applications to the EPO by priority year at the national level; total number, per million inhabitants and per million labour force, relative to GDP and R&D expenditure (GERD, BERD)
Per million inhabitants
1977-2004 25+0
A3b2 EPO high tech patent applications by priority year per million population
Eurostat, Unit F4 - Education, science and culture
statistics (patent applications to the European Patent Office (EPO))
High tech patent applications to the EPO by priority year at the national level; total number, per million inhabitants and per million labour force
Per million inhabitants
1977-2004 24+0
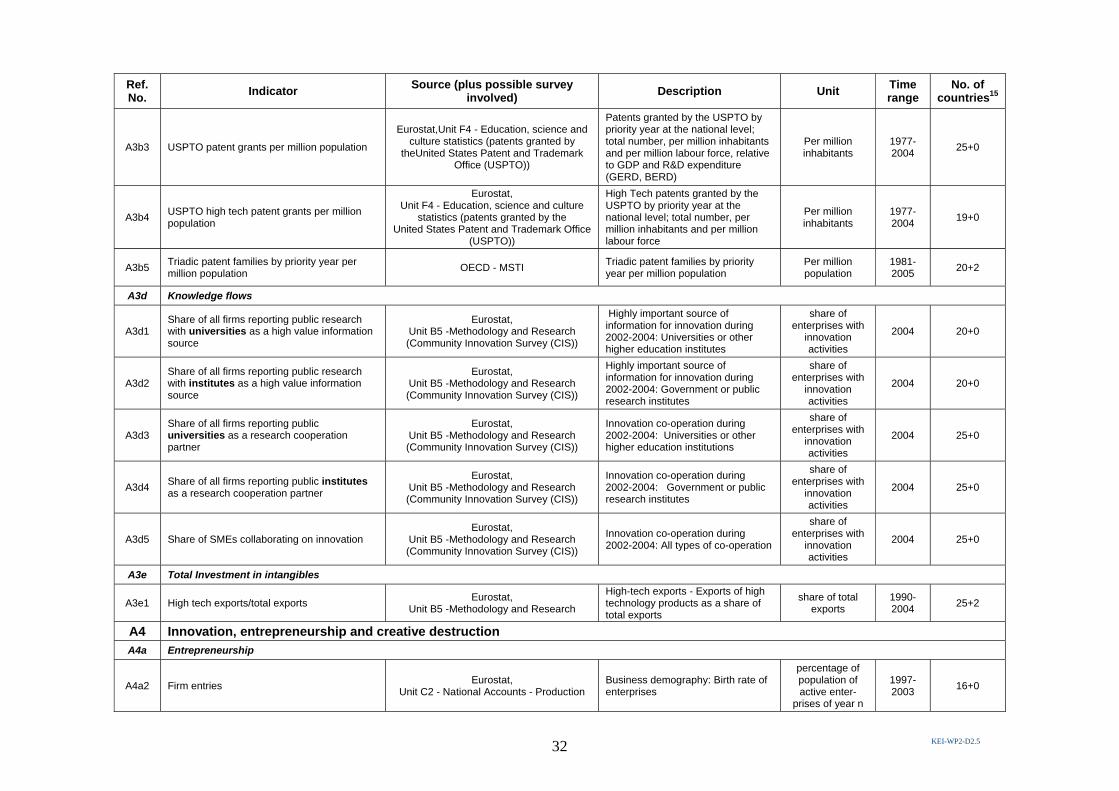
KEI-WP2-D2.5 32
Ref. No. Indicator Source (plus possible survey
involved) Description Unit Time range
No. of countries15
A3b3 USPTO patent grants per million population
Eurostat,Unit F4 - Education, science and culture statistics (patents granted by
theUnited States Patent and Trademark Office (USPTO))
Patents granted by the USPTO by priority year at the national level; total number, per million inhabitants and per million labour force, relative to GDP and R&D expenditure (GERD, BERD)
Per million inhabitants
1977-2004 25+0
A3b4 USPTO high tech patent grants per million population
Eurostat, Unit F4 - Education, science and culture
statistics (patents granted by the United States Patent and Trademark Office
(USPTO))
High Tech patents granted by the USPTO by priority year at the national level; total number, per million inhabitants and per million labour force
Per million inhabitants
1977-2004 19+0
A3b5 Triadic patent families by priority year per million population OECD - MSTI Triadic patent families by priority
year per million population Per million population
1981-2005 20+2
A3d Knowledge flows
A3d1 Share of all firms reporting public research with universities as a high value information source
Eurostat, Unit B5 -Methodology and Research (Community Innovation Survey (CIS))
Highly important source of information for innovation during 2002-2004: Universities or other higher education institutes
share of enterprises with
innovation activities
2004 20+0
A3d2 Share of all firms reporting public research with institutes as a high value information source
Eurostat, Unit B5 -Methodology and Research (Community Innovation Survey (CIS))
Highly important source of information for innovation during 2002-2004: Government or public research institutes
share of enterprises with
innovation activities
2004 20+0
A3d3 Share of all firms reporting public universities as a research cooperation partner
Eurostat, Unit B5 -Methodology and Research (Community Innovation Survey (CIS))
Innovation co-operation during 2002-2004: Universities or other higher education institutions
share of enterprises with
innovation activities
2004 25+0
A3d4 Share of all firms reporting public institutes as a research cooperation partner
Eurostat, Unit B5 -Methodology and Research (Community Innovation Survey (CIS))
Innovation co-operation during 2002-2004: Government or public research institutes
share of enterprises with
innovation activities
2004 25+0
A3d5 Share of SMEs collaborating on innovation Eurostat,
Unit B5 -Methodology and Research (Community Innovation Survey (CIS))
Innovation co-operation during 2002-2004: All types of co-operation
share of enterprises with
innovation activities
2004 25+0
A3e Total Investment in intangibles
A3e1 High tech exports/total exports Eurostat, Unit B5 -Methodology and Research
High-tech exports - Exports of high technology products as a share of total exports
share of total exports
1990-2004 25+2
A4 Innovation, entrepreneurship and creative destruction
A4a Entrepreneurship
A4a2 Firm entries Eurostat, Unit C2 - National Accounts - Production
Business demography: Birth rate of enterprises
percentage of population of active enter-
prises of year n
1997-2003 16+0

© http://kei.publicstatistics.net - 2008 33
Ref. No. Indicator Source (plus possible survey
involved) Description Unit Time range
No. of countries15
A4a3 Firm exits Eurostat, Unit C2 - National Accounts - Production
Business demography: Death rate of enterprises
percentage of population of active enter-
prises of year n
1997-2003 15+0
A4b Demand for innovative products
A4b3 GFCF (Cross fixed capital formation) as a percentage of GDP
Eurostat, Unit C2 - National Accounts - Production
GDP and main components - Current prices: Gross fixed capital formation as percentage of GDP
percentage of GDP
1971-2003 25+1
A4b7 Firm level technology absorption World Economic Forum (The Global Competitiveness Report 2004-2005) Firm level tech absorption
score of 1 to 7, with 7 denoting
best performance
2004-2005 25+2
A4d Market innovation outputs
A4d1 Share of firms introducing new-to-market products
Eurostat, Unit B5 -Methodology and Research (Community Innovation Survey (CIS))
Product and process innovation: Enterprises that have new or significantly improved products new to the market, as a share of total number of enterprises in the population
share of enterprises with
innovation activities
2004 25+0
A4d2 Share of total sales from new-to-market products
Eurostat, Unit B5 -Methodology and Research (Community Innovation Survey (CIS))
Product and process innovation: Turnover of new or significantly improved products, and new to the market as a share of total turnover
share of enterprises with
innovation activities
2004 25+0
A4d3 Share of firms introducing new-to-firm products
Eurostat, Unit B5 -Methodology and Research (Community Innovation Survey (CIS))
Product and process innovation: Enterprises that have new or significantly improved products only new to the firm, as a share of enterprises in the population
share of enterprises with
innovation activities
2004 24+0
A4d4 Share of total sales from new-to-firm products Eurostat,
Unit B5 -Methodology and Research (Community Innovation Survey (CIS))
Product and process innovation: Turnover of new or significantly improved products only new to the firm, as a share of total turnover
share of enterprises with
innovation activities
2004 25+0
A4d5 Community design registrations per million population OHIM Statistics of Community Designs
2006 - Breakdown per country total 2004-2005 24+0
A4e Organisational indicators
A4e1 Percent SMEs reporting non technological change
Eurostat, Unit B5 -Methodology and Research (Community Innovation Survey (CIS))
Organisational and marketing innovations: Enterprise introduced organisational innovation
percentage of total SME 2004 19+0
B - Output indicators
B1 Economic outputs
B1a Income

KEI-WP2-D2.5 34
Ref. No. Indicator Source (plus possible survey
involved) Description Unit Time range
No. of countries15
B1a1 GDP per capita in PPS Eurostat, Unit C2 - National Accounts - Production GDP per capita in PPS per capita in PPS
(EU-25=100) 1995-2007 25+2
B1a2 Real GDP growth rate Eurostat, Unit C2 - National Accounts - Production Real GDP growth rate
percentage change on
previous year
1990-2007 25+2
B1b Productivity
B1b1 Labour productivity per hour worked Eurostat,
Unit C2 - National accounts: production Unit C5 - Validation of public accounts
Labour productivity per hour worked GDP in PPS per
hour worked (EU-15 = 100)
1993-2004 23+2
B1b3 GFCF (Gross fixed capital formation) in millions of euro and as a percentage of GDP
Eurostat, Unit C2 - National Accounts - Production
GDP and main components - Current prices: Gross fixed capital formation
Millions of euro (from
1.1.1999)/Millions of ECU (up to 31.12.1998)
1971-2007 25+1
B1c Employment
B1c1 Total employment growth Eurostat,
Unit F2 - Labour market statistics (National accounts and Labour Force Survey series)
Total employment growth annual
percentage change
1990-2005 25+2
B1c2 Total employment rate Eurostat,
Unit D1 - Labour market (European Union Labour Force Survey)
Total employment rate - Employed persons aged 15-64 as a share of the total population of the same age group
percentage total population of the same age group
1990-2005 25+2
B2 Social performance
B2a Environmental
B2a2 Energy intensity of the economy
Eurostat,Unit G4 - Energy statisticsUnit C2 - National accounts: production (five annual
Joint Questionnaires of Eurostat and Energy Agency)
Energy intensity of the economy - Gross inland consumption of energy
by GDP (constant prices, 1995=100) kgoe per 1000 Euro
1991-2004 25+2
B2b Employment and economic welfare
B2b1 Employment rate of older workers Eurostat,
Unit D1 - Labour market (European Union Labour Force Survey)
Total employment rate of older workers
percent population (55-
64)
1990-2005 25+2
B2b2 Long term unemployment rate Eurostat,
Unit D1 - Labour market (European Union Labour Force Survey)
Total long-term unemployment rate percentage of the
total active population
1990-2005 25+2
B2b3 Inequality of income distribution
Eurostat, Unit F3 - Living conditions and social
protection statistics (EU-SILC / European Community Household Panel)
Inequality of income distribution (income quintile share ratio)
quintile share ratio
1994-2004 24+0

© http://kei.publicstatistics.net - 2008 35
Ref. No. Indicator Source (plus possible survey
involved) Description Unit Time range
No. of countries15
C- Internationalisation
C1a Trade
C1a2 FDI intensity Eurostat, Unit C4 - Balance of Payments
Market integration - Foreign Direct Investment intensity
percentage of GDP, multiplied
by 100
1992-2004 25+2
C1a3 Direct inward investment flows as percent of GDP
Eurostat, Unit C4 - Balance of Payments and Unit C2
- National Accounts - Production
EU direct investments - Main indicators / GDP and main components - Current prices: GDP
percentage of GDP
1992-2005 24+1
C1b Knowledge production and diffusion
C1b1 R&D spending of affiliates as a percent of total BERD OECD - MSTI
R&D expenditure of foreign affiliates as a percentage of R&D expenditure of enterprises
percentage of BERD
1983-2003 13+2
C1b6 Share of R&D funded from abroad Eurostat,
Unit B5 - Methodology and research (Annual Eurostat R&D questionnaires)
Gross domestic expenditure on R&D (GERD) by source of funds - abroad
percentage of GERD
1981-2005 24+1
C1d Human resources
C1d3 Number of foreign students (non-EU) in tertiary education ISCED 5 as a percentage of all tertiary education ISCED 5
Eurostat, Unit F4 - Education, science and culture
statistics
Calculated with: Foreign students in tertiary education (ISCED 5-6) by country of citizenship, as share of all tertiary students
total 2004 22+0
C1d4 Number of foreign students (EU) in tertiary education ISCED 5 as a percentage of all tertiary education ISCED 5
Eurostat, Unit F4 - Education, science and culture
statistics
Calculated with: Foreign students in tertiary education (ISCED 5-6) by country of citizenship, as share of all tertiary students
total 2004 23+0
C1d5 Foreign PhD students (ISCED 6) as a percentage of total PhD enrolment
Eurostat, Unit F4 - Education, science and culture
statistics
Calculated with: Foreign students in tertiary education (ISCED 5-6) by country of citizenship, as share of all tertiary students
total 2004 20+0