Working Papers in Trade and Development · Working Papers in Trade and Development...
41
Working Papers in Trade and Development ‘De-industrialisation’ and colonial rule: The cotton textile industry in Indonesia, 1820-1941 Pierre van der Eng May 2007 Working Paper No. 2007/04 Division of Economics Research School of Pacific and Asian Studies ANU College of Asia and the Pacific
-
Upload
nguyenkhanh -
Category
Documents
-
view
220 -
download
2
Transcript of Working Papers in Trade and Development · Working Papers in Trade and Development...

Working Papers in
Trade and Development
‘De-industrialisation’ and colonial rule: The cotton textile industry in Indonesia,
1820-1941
Pierre van der Eng
May 2007
Working Paper No. 2007/04
Division of Economics Research School of Pacific and Asian Studies
ANU College of Asia and the Pacific

‘De-industrialisation’ and colonial rule: The cotton textile industry in Indonesia, 1820-1941
Pierre van der Eng School of Management Marketing and International Business
ANU College of Business and Economics The Australian National University
E-Mail: [email protected]
Phone: +61 2 6125 8796
This Working Paper series provides a vehicle for preliminary circulation of research results in the fields of economic development and international trade. The series is intended to stimulate discussion and critical comment. Staff and visitors in any part of the Australian National University are encouraged to contribute. To facilitate prompt distribution, papers are screened, but not formally refereed.
Manuscripts should be sent to:
Division of Economics Research School of Pacific and Asian Studies ANU College of Asia and the Pacific The Australian National University Coombs Building 9 Canberra ACT 0200 Australia
Copies of Working Papers are obtainable by contacting the author(s) directly. Copies may also be obtained from WWW Site http://rspas.anu.edu.au/economics/publications.php
‘De-industrialisation’ and colonial rule: The cotton textile industry in Indonesia, 1820-19411
Pierre van der Eng
School of Management, Marketing and International Business ANU College of Business and Economics
The Australian National University Canberra ACT 0200
Australia Fax: +61 2 6125 8796
E-mail: [email protected] http://ecocomm.anu.edu.au/people/pierre.vandereng
Abstract Did colonial rule in Indonesia have a de-industrialising impact? Using the case of the cotton textile industry, this paper finds little evidence. Value added in the industry increased in Java during 1820-71, increased more than three-fold during 1874-1914 and doubled during 1934-41. Most activity involved finishing of imported cotton cloth. Spinning and weaving increased marginally, as high labour intensity of small-scale production, marginal local raw cotton production, and competitive international markets for yarn and cloth precluded domestic production. Unfavourable real exchange rates discouraged investment in modern spinning and weaving ventures. From 1934, production increased rapidly due to trade protection and technological change in small-scale weaving. Key words: Cotton textiles, manufacturing, Indonesia, trade policy, technological change JEL-codes: F13, L67, N65, O14, O33 This version: 27 May 2007
1 Previous versions of this paper were presented on several occasions during 2004-2006. I would like to thank particularly Kaoru Sugihara and Anne Booth for their comments.
1
‘De-industrialisation’ and colonial rule: The cotton textile industry in Indonesia, 1820-1941 1. Introduction Debate about the de-industrialising impact of colonial rule has largely focused on the experience of India. The perception that India suffered ‘de-industrialisation’ as a consequence of growing imports of manufactures from England, and that this experience can be extrapolated to other Asian countries, including Indonesia2 during the Dutch colonial era, is tenacious (see e.g. Bairoch and Kozul-Wright 1998: 52; Nayyar 2006: 152), despite recent studies that offer a different understanding of industrialisation and underdevelopment in India (Roy 2004: 233-34), Several studies of Indonesia’s economic history have noted the low rate of industrialisation in colonial Indonesia (e.g. Booth 1998: 36-8). However, most offer only casual explanations for the relatively low rate of industrialisation, often suggesting that the manufacturing sector suffered the de-industrialising impact of Dutch colonial rule in Indonesia and the interests of Dutch industrial firms (e.g. Furnivall 1939: 332-34, 459). Dick (1993) offered a fundamental explanation, arguing that, apart from the sugar industry, there was no leading sector to spur industrialisation, the domestic market was small and fragmented, and manufacturing industry suffered from a lack of trade protection until the 1930s. No study has hitherto explained in any detail whether colonial rule in Indonesia indeed had a de-industrialising impact, and whether this explains the limited development of the country’s textile industry. This question is relevant, as Indonesia by 1930 had a sizeable domestic market for cotton textiles of 61 million people, but its cotton textile industry was of marginal significance compared to India, China and Japan. While in Japan textile producers took advantage of the country’s low wages and created a major export-oriented industry since the late-19th century, the industry appears to have ailed in Indonesia until the 1930s, despite the country’s labour surplus in the densely populated core island of Java. Most of the domestic supply of textiles was imported. The postwar development of Indonesia’s cotton textile industry is well-studied (e.g. Palmer 1972; Hill 1992), but little is known with certainty about its prewar development. This paper seeks to establish whether the cotton textile industry indeed languished in colonial Indonesia, and whether this case supports the ‘de-industrialisation’ thesis. Section 2 establishes the degree to which the production of cotton goods decreased, and the degree to which their consumption increased. Section 3 explains the development of the industry in the light of the trade policies of colonial Indonesia. Section 4 discusses the organisation of production and trade of textiles in order to trace the impact of changes in trade policy on producers. The upsurge of domestic 2 Throughout, the paper refers to Indonesia, rather than the Dutch East Indies or colonial Indonesia, comprising the geographical area that became the state of Indonesia in 1949.
2
cotton textile production during the 1930s is the subject of section 5, while the last section contains an attempt to estimate value added in the cotton textile industry. 2. Quantification: Decline and rise of the cotton textile industry There are several problems in any quantification of the production and consumption of cotton textiles during 1820-1941. Firstly, no statistical data are available until the 1930s on domestic production in Indonesia, whether of raw cotton, ginned cotton, yarn, cloth, bleached cloth, dyed cloth or garments, and even in the 1930s these data were incomplete. Most of this activity took place in the household and in small scale industry and was not subject to systematic statistical reporting. Secondly, most of the relevant statistical data relate to the core island of Java. For example, foreign trade data until 1871 refer to Java only. But even for Java, most of what we know about the domestic cotton industry is of a qualitative nature only. Statistical data on workshops and their employees are at best incomplete. Hence, this paper relies extensively on the foreign trade data.
The general impression is that cotton spinning and weaving declined throughout the 19th century. It is difficult to establish a starting point of this process, as cotton textiles had long been imported into Indonesia, until the 1830s largely from India. At the same time, Java was the centre of spinning and weaving in the Indonesian archipelago and even exported some quantities to the rest of the region (Van der Kraan 1996: 37-39). An overview of available information on spinning, weaving and dying in Java suggests bustling activity in the 1820s, but some signs of decline in weaving during the 1830s (Fernando 1996: 85-86). Since the 1830s, imported cotton cloth and yarn became increasingly important in the domestic supply of cotton cloth. Local production did not disappear, given that Indonesia continued to produce raw cotton throughout the colonial era, but domestic production of cotton for spinning remained around 4,000 tons only. As local cloth production increased significantly during the 1930s (see section 5), the late-1920s may be taken as the end-point of the stagnation of local spinning and weaving. By then, the annual average supply of imported cotton goods (yarn and cloth) during 1925-29 was 49,000 tons, or 1.0 kg per capita, of which 94% cloth and 6% yarn.3
The Appendix contains the details of the estimation of total supply of cotton textiles in Indonesia. Figure 1 shows the resulting estimates of per capita supply of cotton textiles in Indonesia during 1822-1941. It is obvious that the trends are determined by imports of cotton cloth, rather than yarn or domestic raw cotton production. Four periods can be distinguished:
3 Compared to 0.9 kg per capita (annual average) of imported cotton yarn, cotton cloth and raw cotton during 1950-62 (Statistik Konjunktur, various years), when imports were restricted due to foreign exchange shortages.

3
• 1822-1873: an almost constant level between 0.3 and 0.4 kg per capita per year, which implies the consumption of around 1 sarong per person per year.4
• 1874-1877: a rapid doubling of per capita consumption, related to three factors: 1. a change in trade policy during 1865-74 (see below) reduced import duties on
textiles and abolished the differential rate that favoured imports from the Netherlands. Everything else remaining equal, lower import duties reduced the price of imported textiles from The Netherlands by 6.5%, from the UK by 19%, and from India by 29%. E.g. the price of imported unbleached madapollams halved from an average of ƒ6.62 per 24 yards during 1867-70 to ƒ4.65 during 1875-78 (CEI15 1994: 29).
2. Indonesia followed The Netherlands in adopting the gold exchange standard during 1873-77, which created exchange rate stability (van der Eng 1999).
3. the opening of the Suez Canal in 1869 helped to lower shipping costs between Europe and Asia.
• 1878-99: an increase to 1.0 kg per capita per year. This is a period during which private enterprise started to trickle into colonial Indonesia to produce primary commodities for export, generating new employment and income opportunities. Improvements in transport facilities facilitated an integration and expansion of domestic markets.
• 1900-27: considerable fluctuations, but on average 0.9 to 1.0 kg per capita. This was a period of significant fluctuations in the economy, starting with the rubber boom immediately before World War 1. The war caused major disruptions in world shipping and a decrease in textile imports. The fall in supply was compounded by a more than doubling of textile prices until 1920. The 1920s saw significant fluctuations caused by the bust-boom cycles in particularly the production of rubber and sugar for export, which affected incomes and demand.
• 1928-41: a decrease to 0.6 kg in 1931, followed by recovery. On average, per capita supply was 0.8 kg in the late-1930s. Export commodity prices started to fall in 1928, before the 1929 crisis hit. The crisis obviously had a profound impact on per capita supply, as export commodity prices plummeted, and the country lost opportunities to export due to increasing trade protection in its traditional export markets, despite the fact that textile prices more than halved during 1930-36.
3. Trade policies impacting on the cotton textile industry Indonesia already depended on imported cloth during the 17th and 18th centuries. Colonisation by Hindu empires in part served the purpose of facilitating the trade of cloth from India to the Indonesian archipelago. The Dutch and British East India 4 Assuming a sarong to measure 1 x 2.5 m2 and that it takes a kilogram of cotton fibre to weave three sarong (CEI8 1987: 156). This per capita level appears to be low. Twomey (1983: 45 and 47) estimated levels of 1.4 and 1.2 kg per capita in China and Japan respectively in 1870, and 1.0 and 1.2 kg in India in 1850 and 1880. On the other hand, straddling the equator meant no cotton was required in Indonesia for the padding of clothing, unlike China and Japan.

4
companies were in part attracted to the region in order to benefit from the active inter and intra-regional trade in textiles, particularly between India and Java. The degree of Indonesia’s dependence on imported textiles is difficult to substantiate. Given that there are various accounts of textile production in Java and textile exports from Java, imported cloth failed to exterminate local production. After the bankruptcy of the VOC and the conclusion of the Napoleonic wars in Europe, the government5 of The Netherlands developed a plan to further the textile industry in newly acquired Belgium (Van der Kraan 1996: 35-36). The result was that Java (by implication Indonesia, as far as it was under Dutch colonial rule) was ordered in 1817 to impose a tariff of 6% on imported goods, plus 60% if goods were carried by foreign vessels and 30% if carried by Dutch vessels (Van der Kraan 1996: 51). As almost all imports were textiles, the differential tax rate aimed to favour textiles carried by Dutch vessels from The Netherlands (i.e. Belgium). Following an Anglo-Dutch agreement in 1824, Indonesia’s tariff changed. Amongst others, the tariff would be 25% on all woollen and cotton goods directly shipped from West of Cape of Good Hope (i.e. England and USA), 35% on such goods shipped from East of Cape of Good Hope (as most British textiles were shipped via Calcutta or Singapore), and 6% if shipped from The Netherlands (raised to 12.5% in 1836 following new British protestations). In 1865 the tariff was changed to 10% on goods of Dutch origin, otherwise 20% (reduced to 16% in 1869). An Anglo-Dutch agreement of 1871 specified that for imports into some parts of Sumatra, the tariff on goods from Great Britain would be the same as for goods from the Netherlands, i.e. 10%, which effectively meant that the tariff on all British goods was lowered as such goods could be re-exported from those parts of Sumatra to the rest of Indonesia. This accelerated the decision to change in 1874 to a uniform 6% (in 1924 to 10%) regardless of the origin of the goods or the nationality of the vessels (Vandenbosch 1944: 226-7). During 1817-74, the tariff of colonial Indonesia favoured textiles produced in The Netherlands and shipped by Dutch vessels. In addition, the Dutch government granted a monopoly on all government-instigated trade between The Netherlands and Indonesia to the Nederlandsche Handel Maatschappij (NHM), a private firm established in 1824. This was relevant, because the colonial government levied a tax in kind in the form of cash crops on farm households, and required these goods to be shipped to overseas markets and sold. The NHM orchestrated the purchase of goods, particularly textiles, in Belgium for shipment to and sale in Indonesia. Belgium seceded from The Netherlands in 1830-31. The Dutch government then decided to foster the nascent textile industry in Twente in the Eastern part of the Netherlands through the trade of textiles by the NHM in the same way as it had benefited Belgium. At the same time, the colonial government introduced the so-called Cultivation System, which forced farm households in Java to produce cash
5 In effect, Dutch King William I, because the Dutch parliament had no say in colonial affairs until 1854.

5
crops that had to be sold to the colonial government in Java at a predetermined price. Farm household used part of the revenues to pay land tax. The system left the colonial government with produce that the NHM was commissioned to ship and auction in The Netherlands. In return, the NHM was obliged to purchase textiles and other import products in The Netherlands for sale into Indonesia. The British government objected to the 1824 tariff, when Indonesia’s imports of textiles from The Netherlands started to increase. An Anglo-Dutch agreement in 1836 raised the tariff on goods from The Netherlands to 12.5%. However, the Governor General of the Dutch East Indies concluded an arrangement with the NHM in 1835 that was kept secret from the British. The arrangement entitled NHM to a refund of the duty on NHM-orchestrated exports from The Netherlands to Indonesia of up to ƒ3 million per year (Van der Kraan 1998: 45-46, 52; Furnivall 1939: 144-5). Effectively, this allowed Dutch textile exporters to avoid the tariff in Indonesia. Hence, the arrangement continued to favour the textile industry in The Netherlands, despite increasing Anglo-Dutch rivalry in the trade of textiles to Indonesia. In the 1870s, the Dutch parliament forced the Dutch government to revise the economic relations between The Netherlands and Indonesia. The Cultivation System was phased out, private enterprise was allowed to invest in Indonesia, and the tariff in Indonesia was reduced to a uniform 6%. The new trade regime favoured the activities of privately-owned trading firms in The Netherlands and Indonesia. When the NHM ceased trading activities in 1881 to concentrate on finance, these private trading firms became more active in importing textiles into Indonesia, no longer just from The Netherlands, but also from other major textile exporting countries, particularly Great Britain (for high-quality textiles) and India (for low-quality textiles). Tariffs were later revised, but remained non-discriminatory. For example, import duties were raised to 10% on both yarn and cloth in 1924. The duty on weaving yarn (except silk) was reduced to 5% in 1927 and abolished in 1932, following petitions that argued that the tariff discouraged the local weaving industry (CEI8 1987: 153-4). As in The Netherlands, the tariff was imposed in Indonesia for fiscal purposes and was not intended to protect domestic producers. Dutch textile producers lost market share in Indonesia after 1874. The share of the Netherlands in Indonesia’s textile imports decreased over time from on average 52% in 1874-1904, to 32% in 1905-30 and 20% in 1931-39 (Lindblad 1988: 294 note 47, 297-8 notes 84 and 90). Until World War I, market share was lost to textiles from England and India, during and since World War I to textiles from Japan. At the same time, Dutch textile exports were increasingly directed towards England, Scandinavia and British colonies in Africa (Korsten and Van Londen 1994: 82). As far as Dutch textile producers maintained exports to Indonesia, they did so through specialisation (Fisher 1981: 19; Wolters 1990). They specialised in printed sarong and bleached textiles for the Indonesian batik industry, while textiles imported from England consisted of luxury products. Textile imports from Japan until the late-1920s consisted largely of unbleached textiles (Sugiyama 1994: 61-62). Japan’s share
6
in Indonesia’s textile imports increased significantly during World War I, when shipments from Europe were disrupted and trading companies in Indonesia turned to Japanese textile producers and shipping lines to temporarily fill the void. During the 1930s, the colonial government abandoned the principle that Indonesia’s tariff served only fiscal purposes. There were two main reasons for the change towards protective trade and industry policies in 1933. Firstly, the enormous decline in export revenues from plantation agriculture and mining, long the successful mainstay of the country’s exports. Hope of recovery decreased during the 1930s due to mounting international protectionism. Indonesia’s mounting trade deficit was difficult to sustain. Devaluation was not an option, as The Netherlands chose to keep the guilder pegged to gold until 1936 and Indonesia had to follow. In the short term, the trade deficit was financed through borrowing. As export opportunities failed to recover, import restrictions were the only option. Secondly, Japan’s devaluation of the Yen in 1931 caused an enormous upsurge in imports of cheap textiles and garments from Japan, including bleached textiles at the expense of imports from the Netherlands. During 1928-33, the Dutch and British share in Indonesian imports of cotton textiles decreased from 26 and 27 percent respectively to 7 percent, while that of Japan increased from 26 to 75 percent (Broek 1942: 125). The expansion of Japanese exports to Indonesia not only displaced traditional suppliers in the Netherlands and Great Britain but also budding local weaving firms (see below). The latter was a concern of the colonial government in Indonesia, but concerns about the disruption of the distribution system, and the interests of The Netherlands were additional factors (Van Oorschot 1956: 44). Regulation of Indonesian imports through quota served the purpose of both protecting the local weaving industry and restoring market share for Dutch textiles in Indonesia.6 To restrict manufactured imports, particularly from Japan, the government introduced the Crisisinvoerordonnantie (Crisis Import Ordinance) in September 1933. It established the foundations for a system of import quota and licences that varied according to product, supplying country and importing firm. Not all imported products were affected by the system. Textile products affected by the quota system were: dyed cloth (i.e. printed and woven sarong, 1934), bleached cloth (1934), unbleached cloth (1935), cotton blankets (1935), bath towels (1935), and cotton sewing yarn (1935) (Wirodihardjo 1951: 38-41, 91-126, 138-195). Import restrictions were augmented in 1934 by the Bedrijfsreglementeeringsordonnantie (Industry Regulation Ordinance), which used a licensing system to impose limits on the productive capacity of firms in markets where competition was deemed to be or become ‘excessive’ (Van Oorschot 1956: 45-6). The licensing system was applied to the rapidly expanding weaving industry in 1935 (see below).
6 See Wisselink (1933) for arguments in support of the choice of quota rather than tariffs or direct government support. The main argument was that Japanese firms would be able to absorb the additional cost of higher tariffs, while direct support would exceed available public finance.
7
Both items of legislation gave the colonial government unprecedented powers to steer industrial development in Indonesia. Although initially intended to last until 1938, the system was continued in the absence of significant export recovery and from 1939 to further domestic production in anticipation of austerity caused by the start of World War II. There were numerous problems, including disagreements about the classification of imported products, the relevant product unit (regarding textiles: length of cloth or weight), and the allocation of import permits to importing firms and countries of origin. Other problems involved estimating the size of the domestic market, licensed domestic production, and the carry-over of imported product stocks from previous years in order to establish the appropriate quota, anticipating the consequences of import restrictions on price stability in domestic markets, and anticipating the carry-over of stocks, etc. (Wirodihardjo 1951: 55-85). The system was further complicated by the devaluation of the guilder relative to gold in September 1936, and the modest economic recovery that started in 1937. The regulatory system has been regarded as a tool to safeguard markets in Indonesia for producers in the Netherlands. While trade barriers indeed encouraged some Dutch textile companies to establish subsidiaries in Indonesia, the much more significant consequence of this industrial policy was a drastic increase in manufacturing production in Indonesia for local markets and the further development of the domestic distribution network (Wirodihardjo 1951: 131-37). 4. Organisation of production and distribution of cotton goods Figure 2 gives a broad impression of the economic activities in the processing of raw cotton, imported cotton yarn, and undyed cloth. The domestic production of raw cotton for ginning and spinning remained relatively constant. Locally produced cotton yarn and imported yarn generated a modest increase in weaving activity in the 1870s, and a significant increase since the mid-1930s. From the 1850s until the 1910s there was a steady increase in activity in the dyeing and batik industry, although with considerable variations since 1913. 4.1 Raw cotton production Despite producing sufficient cotton to sustain a local textile industry in the 18th century, and being located around the equator, Indonesia was (and still is) a marginal producer of cotton. The colonial government tried to encourage cotton production since the 1830s. Various cotton varieties were produced throughout Indonesia, particularly in Java (Demak, Pati, Jepara-Rembang, Madiun and Madura), Sumatra (Palembang), and in Nusatengara (Lombok and Flores). Local and imported varieties were used in a long series of government-orchestrated tests aimed at

8
introducing cotton production and/or improving the quality of the produced cotton, particularly in Palembang. The results of al these efforts were discouraging.7 Private interests also tried to further cotton growing. For example, in 1843 J.L. van Toll used his experience with cotton growing in Surinam to establish a cotton plantation in Cirebon. Although the cotton was of good quality, the venture was not commercially viable and ceased in 1847. In the late-1840s, the NHM supported tests in Palembang to explore opportunities of large scale cotton production, but did not persist. In 1861 an enthusiastic proponent of cotton production in Indonesia, J.J. van Limburg Brouwer, established the NV Nederlandsch-Indische Katoenmaatschappij, which operated a cotton ginning and packing plant in Surabaya and sought to purchase locally grown cotton in Demak and Grobogan. Despite high cotton prices due to the American civil war, this venture failed to secure the required regular supplies of cotton and the company ceased in 1864. In 1916, the NV Moluksche Handelsvennootschap established a plant in Palembang for the ginning of locally purchased cotton. However, it experienced irregular supplies of raw cotton and abandoned the venture in 1930. The NV Amsterdam-Soenda Compagnie was established in 1917 to produce and process cotton of a promising local variety in Flores. It ceased operations in 1924, when pests reduced yields and international cotton prices fell. In the 1930s, Dutch settlers and a Japanese company tried to grow cotton commercially in New Guinea, but found that pest problems increased within several years, soil and climate were not always suitable, and yields were too low to make the ventures viable. Unsuitable local rainfall patterns and soil conditions and also pest problems were important reasons why cotton production remained limited. However, the main reasons why Indonesian farm households shunned cotton as a cash crop were (1) the high risk of crop failures, because the plant initially required high rainfall and then a very dry maturing season, (2) low financial returns compared to other crops (ƒ20 to ƒ30 with a yield of only 100 kg ginned fibre per hectare, Van Hall 1939: 72). Only when world prices were high did farmers increase cotton production. In Java, they only did so as a second crop on irrigated fields following the main rice crop, and only in areas where other crops would yield even lower returns than cotton (Vink 1932-33: 261; Paerels 1950: 39-40). Given the risk of crop failure (and the low financial yields), farmers did not put a lot of time and effort into weeding and pest control. Cotton was generally produced for local production of yarn to be used in the production of cloth for local consumption. The varieties that suited the climate best yielded short and coarse cotton fibres, and therefore coarse cloth. Some areas exported much of the production of raw cotton to China and Japan, small quantities 7 There is an extensive literature on all these failed efforts to further raw cotton production and purchasing and ginning operations. See e.g. Van Limburg Brouwer (1863); Veth (1865: 41-44, 54-58); Tromp de Haas (1903: 541-62); Treub (1904); Dijkstra (1907); Van Setten (1911); Van Breda de Haan (1914); Spoon (1932); Vink (1932-33); Van Hall (1939: 72-73); Broersma (1931); Paerels (1950: 40-46); Sulistiyo and Mawarni (1991: 23-32).
9
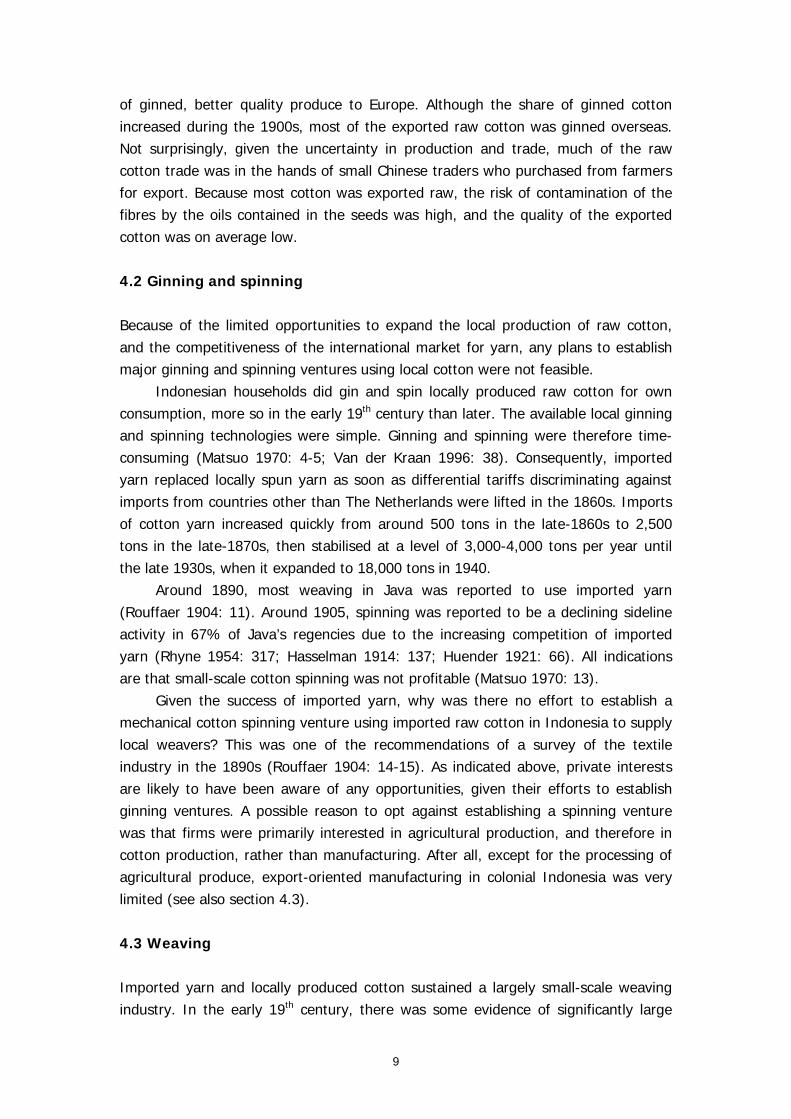
of ginned, better quality produce to Europe. Although the share of ginned cotton increased during the 1900s, most of the exported raw cotton was ginned overseas. Not surprisingly, given the uncertainty in production and trade, much of the raw cotton trade was in the hands of small Chinese traders who purchased from farmers for export. Because most cotton was exported raw, the risk of contamination of the fibres by the oils contained in the seeds was high, and the quality of the exported cotton was on average low. 4.2 Ginning and spinning Because of the limited opportunities to expand the local production of raw cotton, and the competitiveness of the international market for yarn, any plans to establish major ginning and spinning ventures using local cotton were not feasible. Indonesian households did gin and spin locally produced raw cotton for own consumption, more so in the early 19th century than later. The available local ginning and spinning technologies were simple. Ginning and spinning were therefore time-consuming (Matsuo 1970: 4-5; Van der Kraan 1996: 38). Consequently, imported yarn replaced locally spun yarn as soon as differential tariffs discriminating against imports from countries other than The Netherlands were lifted in the 1860s. Imports of cotton yarn increased quickly from around 500 tons in the late-1860s to 2,500 tons in the late-1870s, then stabilised at a level of 3,000-4,000 tons per year until the late 1930s, when it expanded to 18,000 tons in 1940. Around 1890, most weaving in Java was reported to use imported yarn (Rouffaer 1904: 11). Around 1905, spinning was reported to be a declining sideline activity in 67% of Java’s regencies due to the increasing competition of imported yarn (Rhyne 1954: 317; Hasselman 1914: 137; Huender 1921: 66). All indications are that small-scale cotton spinning was not profitable (Matsuo 1970: 13). Given the success of imported yarn, why was there no effort to establish a mechanical cotton spinning venture using imported raw cotton in Indonesia to supply local weavers? This was one of the recommendations of a survey of the textile industry in the 1890s (Rouffaer 1904: 14-15). As indicated above, private interests are likely to have been aware of any opportunities, given their efforts to establish ginning ventures. A possible reason to opt against establishing a spinning venture was that firms were primarily interested in agricultural production, and therefore in cotton production, rather than manufacturing. After all, except for the processing of agricultural produce, export-oriented manufacturing in colonial Indonesia was very limited (see also section 4.3). 4.3 Weaving Imported yarn and locally produced cotton sustained a largely small-scale weaving industry. In the early 19th century, there was some evidence of significantly large

10
ventures spinning yarn and weaving cloth. Particularly, indigenous princely rulers maintained large workshops where high-quality textiles for use in the court would be produced. Beyond that, there were various smaller weaving workshops in urban areas that also finished their produce, and sometimes produced batik (hand dyed cloth). Almost all weaving was done by female weavers using the alat gedogan, a very basic handloom. Most was done as a sideline activity in the household. Some produce may have been sold in markets, possibly using a ‘putting out’ system under which a middleman (bakul) provided either an advance or a combination of yarn and advance to the weavers who produced the cloth for an agreed price. Most produce seems to have been of a coarse but strong quality cloth and was used for home consumption (Rouffaer 1904: 11; CEI8 1987: 153). Some weaving factories were established during World War I, but they failed after the war. Figure 1 showed that both yarn imports and locally produced cotton were marginal in the total supply of cotton goods. This matches impressions that the available weaving technology was very labour intensive (Van der Kraan 1996: 38). Hence, weaving gave way to imports of cloth and became a declining and relatively marginal economic activity, albeit that the decline was regionally differentiated (Van der Kraan 1996: 58-60). Qualitative impressions suggest that in some areas weaving remained more prominent than others, and even that produce from some regions was exported (Rouffaer 1904: 11-12; Huender 1921: 66). Observations of the state of weaving around 1890 suggest that in half of Java’s 22 residencies weaving was struggling due to the competition from imported cotton cloth (Rouffaer 1904: 11). Observations around 1905 suggest that the reported decline in weaving activity in 86% of Java’s regencies was largely due to increasing imported cloth that was not necessarily of superior quality but certainly available at a lower price than local produce (Rhyne 1954: 317; Hasselman 1914: 135, 137). Until the 1930s, weaving took place in small-scale operations, which may have been competitive due to their ability to produce the quality and patterns that were locally preferred. They may have increasingly used imported yarn, which enhanced their competitiveness (Hasselman 1914: 137). Still, various factors conspired against the local weaving industry. Sketching the situation in the early 1920s, Fievez and Meijer Ranneft (1924: 166-67) offered four explanations for the decline of weaving: 1. Inferior weaving technology and consequently low labour productivity and low
financial returns per unit of labour, estimated at only ƒ2.50 to ƒ3.00 per month.8 2. Increasing use of low-quality yarn from Japan and India, which reduced the
quality of cloth and therefore the popularity of local produce.
8 Not clear whether this is for part-time or full-time work. Matsuo (1970: 16-17) offered a hypothetical example to illustrate that the returns to weavers must have been very low, even if they used imported cotton yarn. Other sources confirm this impression, e.g. Van Warmelo (1938: 2).
11
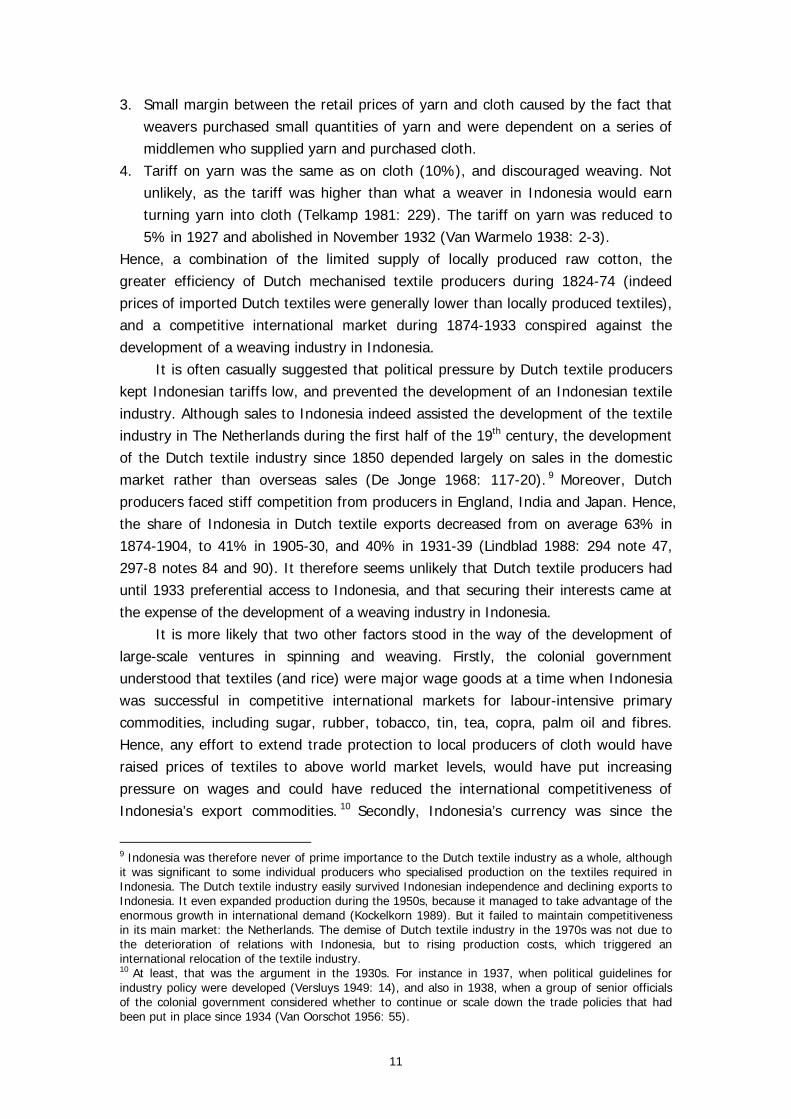
3. Small margin between the retail prices of yarn and cloth caused by the fact that weavers purchased small quantities of yarn and were dependent on a series of middlemen who supplied yarn and purchased cloth.
4. Tariff on yarn was the same as on cloth (10%), and discouraged weaving. Not unlikely, as the tariff was higher than what a weaver in Indonesia would earn turning yarn into cloth (Telkamp 1981: 229). The tariff on yarn was reduced to 5% in 1927 and abolished in November 1932 (Van Warmelo 1938: 2-3).
Hence, a combination of the limited supply of locally produced raw cotton, the greater efficiency of Dutch mechanised textile producers during 1824-74 (indeed prices of imported Dutch textiles were generally lower than locally produced textiles), and a competitive international market during 1874-1933 conspired against the development of a weaving industry in Indonesia. It is often casually suggested that political pressure by Dutch textile producers kept Indonesian tariffs low, and prevented the development of an Indonesian textile industry. Although sales to Indonesia indeed assisted the development of the textile industry in The Netherlands during the first half of the 19th century, the development of the Dutch textile industry since 1850 depended largely on sales in the domestic market rather than overseas sales (De Jonge 1968: 117-20). 9 Moreover, Dutch producers faced stiff competition from producers in England, India and Japan. Hence, the share of Indonesia in Dutch textile exports decreased from on average 63% in 1874-1904, to 41% in 1905-30, and 40% in 1931-39 (Lindblad 1988: 294 note 47, 297-8 notes 84 and 90). It therefore seems unlikely that Dutch textile producers had until 1933 preferential access to Indonesia, and that securing their interests came at the expense of the development of a weaving industry in Indonesia. It is more likely that two other factors stood in the way of the development of large-scale ventures in spinning and weaving. Firstly, the colonial government understood that textiles (and rice) were major wage goods at a time when Indonesia was successful in competitive international markets for labour-intensive primary commodities, including sugar, rubber, tobacco, tin, tea, copra, palm oil and fibres. Hence, any effort to extend trade protection to local producers of cloth would have raised prices of textiles to above world market levels, would have put increasing pressure on wages and could have reduced the international competitiveness of Indonesia’s export commodities. 10 Secondly, Indonesia’s currency was since the
9 Indonesia was therefore never of prime importance to the Dutch textile industry as a whole, although it was significant to some individual producers who specialised production on the textiles required in Indonesia. The Dutch textile industry easily survived Indonesian independence and declining exports to Indonesia. It even expanded production during the 1950s, because it managed to take advantage of the enormous growth in international demand (Kockelkorn 1989). But it failed to maintain competitiveness in its main market: the Netherlands. The demise of Dutch textile industry in the 1970s was not due to the deterioration of relations with Indonesia, but to rising production costs, which triggered an international relocation of the textile industry. 10 At least, that was the argument in the 1930s. For instance in 1937, when political guidelines for industry policy were developed (Versluys 1949: 14), and also in 1938, when a group of senior officials of the colonial government considered whether to continue or scale down the trade policies that had been put in place since 1934 (Van Oorschot 1956: 55).
12
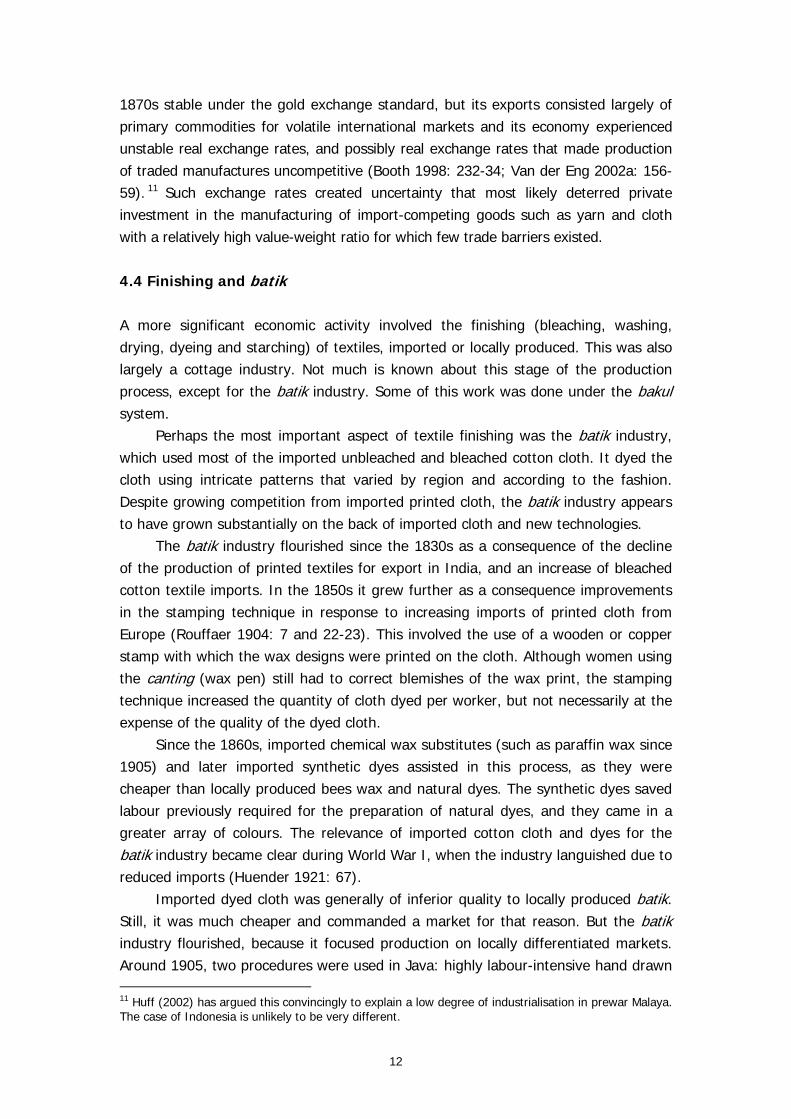
1870s stable under the gold exchange standard, but its exports consisted largely of primary commodities for volatile international markets and its economy experienced unstable real exchange rates, and possibly real exchange rates that made production of traded manufactures uncompetitive (Booth 1998: 232-34; Van der Eng 2002a: 156-59). 11 Such exchange rates created uncertainty that most likely deterred private investment in the manufacturing of import-competing goods such as yarn and cloth with a relatively high value-weight ratio for which few trade barriers existed. 4.4 Finishing and batik A more significant economic activity involved the finishing (bleaching, washing, drying, dyeing and starching) of textiles, imported or locally produced. This was also largely a cottage industry. Not much is known about this stage of the production process, except for the batik industry. Some of this work was done under the bakul system. Perhaps the most important aspect of textile finishing was the batik industry, which used most of the imported unbleached and bleached cotton cloth. It dyed the cloth using intricate patterns that varied by region and according to the fashion. Despite growing competition from imported printed cloth, the batik industry appears to have grown substantially on the back of imported cloth and new technologies. The batik industry flourished since the 1830s as a consequence of the decline of the production of printed textiles for export in India, and an increase of bleached cotton textile imports. In the 1850s it grew further as a consequence improvements in the stamping technique in response to increasing imports of printed cloth from Europe (Rouffaer 1904: 7 and 22-23). This involved the use of a wooden or copper stamp with which the wax designs were printed on the cloth. Although women using the canting (wax pen) still had to correct blemishes of the wax print, the stamping technique increased the quantity of cloth dyed per worker, but not necessarily at the expense of the quality of the dyed cloth. Since the 1860s, imported chemical wax substitutes (such as paraffin wax since 1905) and later imported synthetic dyes assisted in this process, as they were cheaper than locally produced bees wax and natural dyes. The synthetic dyes saved labour previously required for the preparation of natural dyes, and they came in a greater array of colours. The relevance of imported cotton cloth and dyes for the batik industry became clear during World War I, when the industry languished due to reduced imports (Huender 1921: 67). Imported dyed cloth was generally of inferior quality to locally produced batik. Still, it was much cheaper and commanded a market for that reason. But the batik industry flourished, because it focused production on locally differentiated markets. Around 1905, two procedures were used in Java: highly labour-intensive hand drawn 11 Huff (2002) has argued this convincingly to explain a low degree of industrialisation in prewar Malaya. The case of Indonesia is unlikely to be very different.

13
batik or stamped batik (Hasselman 1914: 137). The first was a highly specialised industry, which produced high-quality cloth that could not be copied by foreign producers of printed cloth. The second was the batik print industry, which produced for local and wider markets in Indonesia. Around 1890, all batik workshops were reported to use imported white cotton cloth, and only 4 of the 22 residencies reported negative consequences of the import of printed textiles on the batik industry (Rouffaer 1904: 26). In 1905 52% of Java’s regencies noted a decline in batik production (Rhyne 1954: 317). However, it seems likely that the activity became more regionally concentrated and also concentrated in larger workshops as it developed new technologies. The continued relevance of the activity is also indicated by the fact that there were many batik workshops. Surveys indicated 579 in 1915 and 830 in 1919, employing on average 13 people (1915 7,606 and 1919 10,139) (CEI8 1987: 69-74). But these numbers are most likely underestimated, because in 1920-24 only the districts of Yogyakarta, Surakarta, Kediri and Pekalongan in Java reported no less than 1,100 to 1,300 batik workshops (Fievez and Meijer Ranneft 1924: 163). In addition, there is evidence of increasing Chinese and Arab participation in the stamped batik industry and the further development of the bakul system (Matsuo 1970: 80-84). In 1930, the number of workshops in Java was 4,384, employing 17,000 workers (Economisch Weekblad voor Nederlandsch-Indië, Industrienummer 1941: 169). Hence, batik production remained considerable, despite the growing imports of dyed and printed cloth. 4.5 Imports, distribution and domestic trade The main importers of textiles since the 1870s were Dutch-owned general trading companies. They orchestrated imports and supplied imported cloth through their regional offices mostly to Chinese-owned domestic trading firms, who sold the cloth on to other wholesalers and retailers. Some of the larger Chinese firms may also have imported cloth themselves, particularly from India and Japan. During World War I, interest among Dutch and Chinese trading firms in importing from Japan increased quickly. They did so, until Japanese general trading companies established their own subsidiaries in Indonesia. These subsidiaries organised imports of textiles from Japan. Starting during World War I, they built up a distribution network parallel to that of Dutch trading companies and Chinese wholesalers and retailers, involving Japanese and upstart Chinese retailers (Sugiyama 1994: 63-65; Post 1996). The network expanded during the 1920s. Apart from Japan’s competitive exchange rate, this was a major explanation for the fact that Japanese export products captured high market shares during the early 1930s. The market for textiles in Indonesia not only expanded due to falling prices of produce, population growth and increasing average incomes, but also due to the gradual development of transport infrastructure both in Java (in the form of railways

14
and later roads) and between Indonesia’s main islands (in the form of regular and increasingly frequent shipping connections). Both are likely to have reduced the transport margin in the retail price of produce. 5. Industry policies impacting on the cotton textile industry Despite various opinions stressing the need to further local industry, the colonial government did little until the supply of imported manufactures decreased during World War I due to disrupted shipping connections between Europe and Indonesia (Fievez and Meijer Ranneft 1924: 157-59; Van Oorschot 1956: 18-26). Shipments of textiles to Indonesia were severely affected, after Germany’s declaration of unrestricted submarine warfare in 1917, an American embargo on the ships of neutral Netherlands in 1917, and the British seizure of neutral Dutch ships. In 1918 no Dutch textile shipments reached Indonesia. Increasing imports from Japan were insufficient to compensate the decrease in textile supplies from the UK and Netherlands. To address the situation, the Governor-General of colonial Indonesia commissioned in 1915 a study into what could be done to further domestic industries. The issue had also attracted attention in The Netherlands, where in 1914 the Minister for Colonies had commissioned a study into how Japan had been able to generate a large industrial sector in a relatively short time (Fievez and Meijer Ranneft 1924: 159-60; Rhyne 1954: 39-45; Van Oorschot 1956: 26-30). The study was expected to yield clues as to what could be done in Indonesia. As a consequence of both initiatives, various modest industrialisation initiatives were subsequently pursued. One initiative involved the establishment of the Textielinrichting Bandung (TIB, later Institut Teknologi Tekstil) in 1921. TIB was conceived in 1919 as an institution to study and improve weaving and dying techniques and also cloth designs and patterns. It aimed to assist small-scale weaving and further rural prosperity by offering courses and lectures to disseminate improved technologies.12 In 1926, TIB developed an improved, so-called TIB handloom (later called ATBM, Alat Tenun Bukan Mesin). This wooden loom was semi-automatic with a flying shuttle and did not require electricity to operate. It was able to increase labour productivity, because its capacity exceeded that of the traditional gedogan handlooms by a factor of 8 to 12 (Rothe 1938: 3-4; Van Warmelo 1939: 8). Its price decreased quickly from ƒ125 to ƒ35, and ƒ20 in 1930 (Telkamp 1981: 228 and 230). By 1930, the institute had also developed a basic power loom (TIM, later called ATM, Alat Tenun Mesin) that
12 The origin of the institute was the experimental use of penal labour in the Glodok prison in Batavia in 1911 with self-produced handlooms based on old designs of Dutch and British-Indian looms. The looms were transferred in 1916 to the prison in Ceribon, where Director G. Dalenoord had established a weaving shop in 1919 using penal labour. Dalenoord experimented with improving weaving technology and continued his experiments from 1920 as TIB’s first Director until he joined the NV Preanger Bontweverij in Garut in 1934 (Kroeze 1979: 14, 20).
15
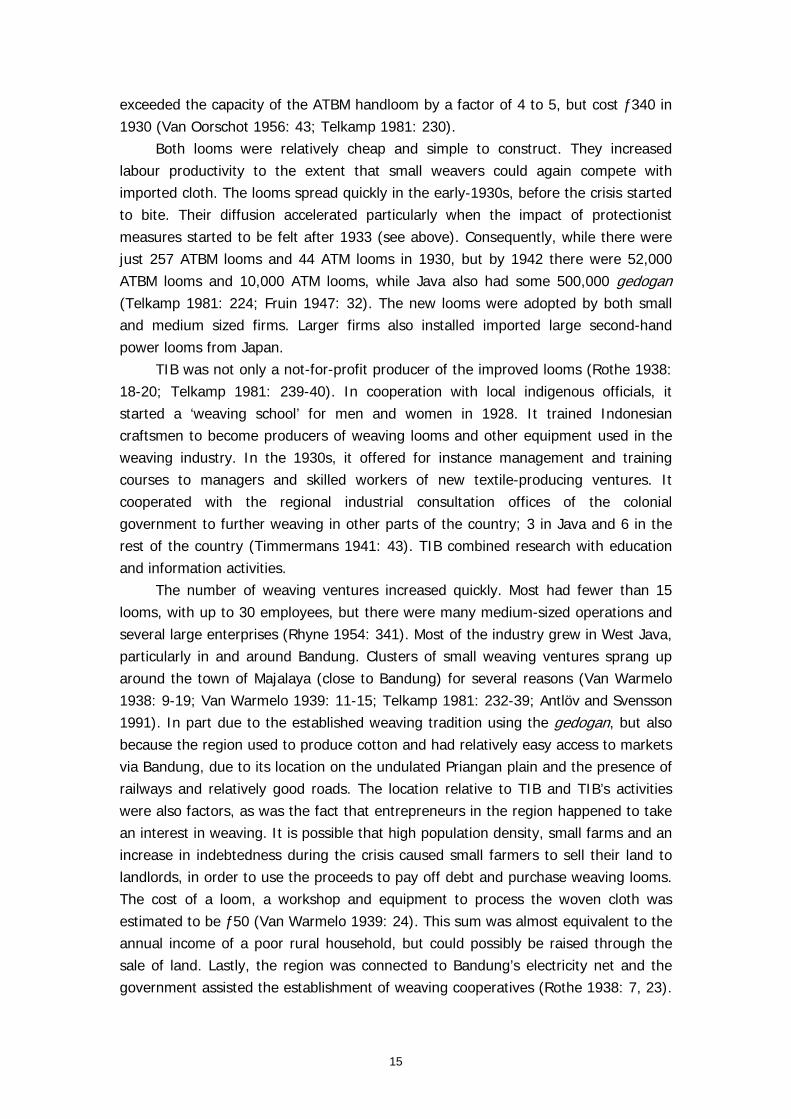
exceeded the capacity of the ATBM handloom by a factor of 4 to 5, but cost ƒ340 in 1930 (Van Oorschot 1956: 43; Telkamp 1981: 230). Both looms were relatively cheap and simple to construct. They increased labour productivity to the extent that small weavers could again compete with imported cloth. The looms spread quickly in the early-1930s, before the crisis started to bite. Their diffusion accelerated particularly when the impact of protectionist measures started to be felt after 1933 (see above). Consequently, while there were just 257 ATBM looms and 44 ATM looms in 1930, but by 1942 there were 52,000 ATBM looms and 10,000 ATM looms, while Java also had some 500,000 gedogan (Telkamp 1981: 224; Fruin 1947: 32). The new looms were adopted by both small and medium sized firms. Larger firms also installed imported large second-hand power looms from Japan. TIB was not only a not-for-profit producer of the improved looms (Rothe 1938: 18-20; Telkamp 1981: 239-40). In cooperation with local indigenous officials, it started a ‘weaving school’ for men and women in 1928. It trained Indonesian craftsmen to become producers of weaving looms and other equipment used in the weaving industry. In the 1930s, it offered for instance management and training courses to managers and skilled workers of new textile-producing ventures. It cooperated with the regional industrial consultation offices of the colonial government to further weaving in other parts of the country; 3 in Java and 6 in the rest of the country (Timmermans 1941: 43). TIB combined research with education and information activities. The number of weaving ventures increased quickly. Most had fewer than 15 looms, with up to 30 employees, but there were many medium-sized operations and several large enterprises (Rhyne 1954: 341). Most of the industry grew in West Java, particularly in and around Bandung. Clusters of small weaving ventures sprang up around the town of Majalaya (close to Bandung) for several reasons (Van Warmelo 1938: 9-19; Van Warmelo 1939: 11-15; Telkamp 1981: 232-39; Antlöv and Svensson 1991). In part due to the established weaving tradition using the gedogan, but also because the region used to produce cotton and had relatively easy access to markets via Bandung, due to its location on the undulated Priangan plain and the presence of railways and relatively good roads. The location relative to TIB and TIB’s activities were also factors, as was the fact that entrepreneurs in the region happened to take an interest in weaving. It is possible that high population density, small farms and an increase in indebtedness during the crisis caused small farmers to sell their land to landlords, in order to use the proceeds to pay off debt and purchase weaving looms. The cost of a loom, a workshop and equipment to process the woven cloth was estimated to be ƒ50 (Van Warmelo 1939: 24). This sum was almost equivalent to the annual income of a poor rural household, but could possibly be raised through the sale of land. Lastly, the region was connected to Bandung’s electricity net and the government assisted the establishment of weaving cooperatives (Rothe 1938: 7, 23).
16
By the late-1930s, about half of Indonesia’s produced textiles came from the Bandung region. News about current and expected future restrictions on textile imports fuelled growing interest in investment in weaving. The weaving industry expanded quickly from 1934 to 1935, producing in particular mixed cotton/rayon sarong. The government feared that an oversupply of sarong would depress the market, possibly causing bankruptcy and increasing unemployment. It ordered the regulation of production capacity of the weaving industry in December 1935 (Timmermans 1941: 43). Licenses to operate a specified number of looms were required for ventures with mechanical looms or with 15 or more ATBM looms. This limit on the expansion of larger ventures was a major reason for the increase in the number of small-scale ventures using less that 15 ATBM looms, particularly in the Majalaya area. The industry in the Majalaya region soon developed institutions that facilitated its further development. Most workshops operating the looms started off as household operations with one loom, expanding the number of looms quickly as opportunities increased, while encouraging friends and relatives to follow their example. The expansion was financed with reinvested earnings, but also with loans from well-off large indigenous landowners or from the bakul middlemen who also supplied the raw materials on credit and purchased the final produce. Weavers in the region were generally young adults (85% under 30), largely female and landless (less than 10% owned land) (Van Warmelo 1939: 21). A 1937 survey found that a large number of Chinese-owned ventures were only independent in name, and were in fact controlled by groups of Chinese entrepreneurs. For that reason, plus the fact that continued rapid increases in the number of looms in 1936 were perceived to cause an oversupply of sarong in 1936 (Wirodihardjo 1951: 153), the licensing system was extended in 1937 to ventures operating 5 ATBM looms or more. In 1940 it was extended to all weaving ventures operating ATBM and/or mechanical looms (thus excluding gedogan-based cottage activities), and to cover knitting, spinning and dyeing (excluding batik) as well (Timmermans 1941: 43; Rhyne 1954: 74; CEI8 1987: 154). In all, the licensing system did not stem the growth in production capacity, but allowed the authorities to balance the growth of large, medium and small-scale ventures. Some ventures grew in size, because there were efficiency gains in locating looms in one place, standardising cloth quality, and arranging a division of labour within one enterprise. From 1936, ethnic Chinese entrepreneurs established such larger ventures in the Majalaya region, and the development of the weaving industry was taken up a notch with the introduction of electricity in 1939 that allowed the operation of power looms. The average size of the operations increased and with it the prominence of ethnic Chinese business groups (kongsi) in both the production and trade of cloth. They owned a larger share of the large ventures, established more of the small ventures with less that 15 (generally 14) looms, purchased more and more of the smaller Indonesian-owned ventures, and controlled many of the

17
remaining small ventures through the bakul system (Telkamp 1981: 233-34). Still, while 43% of the ventures were small-scale in 1930, by 1938 they comprised 97% (Van Warmelo 1938: 4-5). Two statistical sources give an impression of the capacity of the textile industry in 1941: the industrial statistics (all firms employing mechanical power or 50 workers or more) and the statistics of the licensed capacity of weaving ventures. The first reveals that in July 1941, there were 272 textile factories in Indonesia, of which 170 with mechanical power of up to 5 hp, and 9 outside Java. These firms operated 8,339 power looms, 232 heavy handlooms, and 28,262 ATBM looms, and employed 61,422 people of which only a third (19,959) women (Kroese 1946a: 599-600). The licensing statistics are summarised in Table 1, which shows that 44,555 handlooms had been licensed in 1940. Hence, next to the factories there possibly were some 16,000 small weaving ventures. Table 1 also shows that most of the production capacity was in the Priangan (Bandung), Pekalongan and Surabaya residencies in Java, and hardly outside Java. The weaving industry was segmented by ethnicity of the owners of weaving firms, as Table 2 indicates. The European-owned weaving ventures were the largest and best-equipped, the Indonesian ventures were numerous, but small and with few mechanised looms. The Chinese and Arab-owned ventures occupied an intermediate position. It appears that during the last few years of Dutch colonial rule, Indonesian entrepreneurs in the weaving industry lost considerable ground to the Chinese (Telkamp 1981: 233-34). While descriptions of the weaving industry in Majalaya in the mid-1930s suggested a sector dominated by indigenous Indonesian weavers, by 1940/41 most of the productive capacity was controlled by non-indigenous Indonesians. For example, in 1939 335 of the 1,500 weaving firms in Majalaya were sold by Indonesians to Chinese (Sitsen 1944: 21). An investigation into 94 sales of Indonesia-owned weaving enterprises showed that 55% had been bought by ethnic Chinese, 16% by Arabs, and 29% by other Indonesians (Sutter 1959 Vol.1: 44). The largest weaving ventures in Java were the NV Preanger Bontweverij (Garut, 1932) and the NV Java Textiel Maatschappij (Tegal, 1936).13 Many other weaving firms were established by consortia involving Dutch companies, i.e. textile firms, banks, and trading companies. Other major producers included C.L. Phaff and Nanyang Weaving Works (Bandung), NV Kantjil Mas and Kasri (Pasuruan), Alsaid bin Awad Martak (Surabaya). Although the larger firms relied more on power looms, often Japanese-made, many firms operated both power looms and handlooms. For example, British Indian-owned firm E.K.J. Muallim (Gresik, 1926) had 2,000 handlooms in 1938, 350 second-hand machine looms from Japan, and employed
13 The NV Preanger Bontweverij was owned by Dutch trading company Internatio and Dutch textile firms Van Heek and Koninklijke Stoomweverij and produced coloured woven materials (Kroese 1979). By 1940, it operated 1,200 imported Japanese Suzuki power looms and had 3,243 employees. The NV Java Textiel Maatschappij was owned by a consortium of 46 Dutch companies and produced bleached and unbleached cloth. It operated 800 power looms, integrated spinning and weaving, and produced 2,200 tons of yarn per year.
18
4,000 workers at full capacity (Rothe 1938: 16-17). The firm expanded its capacity to 2,200 handlooms and 560 machine looms (Telkamp 1981: 235). The diversity of producers in Indonesia’s textile industry reflects a principle in industry policy in Indonesia in the 1930s that was made explicit in the 1941 Industry Plan: it explicitly aimed to protect smaller ventures by using the licensing system to balance the development of small and medium scale and large scale operations (De Neuman 1955: 18-19). Mechanical yarn production did not increase until after the establishment of the NV Java Textiel Maatschappij in Tegal in 1936. It produced yarn with a capacity of 5,000 spindles, increased in 1940 to 15,000 spindles (ca. 1,200 tons of yarn per year).14 It was joined by NV Nebritex (Pasuruan, 1936), a Dutch-British joint venture, annual yarn production 1,000 tons), and NV Djantra (Semarang, 1941), a Dutch joint venture with the colonial government, annual yarn production 1,000 tons, or 7,500 spindles. After the start of war in Europe and the disruption of shipments from the Netherlands and the UK in 1940, the colonial government issued the Industrieplan 1941. One of its aims was to establish three additional spinning mills in East Java in Demak, Pasuruan and Bojonegoro, which would spin the coarse cotton produced in the Demak and Banyuwangi regions. Still, ultimo 1941, the licensed mechanical spinning capacity was only 44,000 spindles.15 Despite the rapid development of production capacity, Indonesia was still far from self-sufficient in textiles.16 Different estimates exist. The self-sufficiency rate was estimated to be 5% in 1936 and 14% in 1939 (Hulshoff Pol 1948: 852). Table 3 shows that the rate in 1939 was 7%, 15% including small-scale and household production. However, the degree of self-sufficiency was higher in some categories, particularly for cotton sarong with woven patterns and for cloth with mixed yarns, particularly with rayon. Domestic textile production generated about 15-20% of domestic textile consumption in 1940-41 (Kroese 1946a: 599; Jonkers 1948: 119). Hence, 80-85% of the textile supply was still imported, either as cloth, yarn or raw cotton, not counting garments. 6. Value added and employment in the textile industry Section 4 explained that imports of cotton products generated domestic economic activity in industries processing the cotton raw materials and semi-manufactures. This was illustrated with the quantity of cotton goods requiring processing. A more appropriate way to aggregate such activity would be through an estimate of Gross Value Added (GVA) in the different stages of processing.
14 Or 25% of 1935-36 yarn imports. Matsuo (1970: 50) noted a production capacity of 2,200 tons. 15 Sitsen (1944: 47) and Kroese (1947: 23-24) mention plans for spinning plants in Semarang, Kudus and Pasuruan, which would have brought the total capacity to 160,000 spindles. 16 Assuming the term self-sufficient is appropriate, given that almost all cotton yarn had to be imported.
19
Figure 2 indicated that for almost a century up until the 1930s, domestic spinning and weaving were of marginal significance. Hence, most value was added in the processing of imported cloth and during the 1930s increasingly in weaving as well. Much of this activity took place in households and small-scale industries, which were hardly covered by the available industry statistics. While it is possible to use the estimates of production and prices presented in section 2 for a rough estimation of the value of gross output in raw cotton production, spinning, weaving, and dyeing (with assumptions about the average value of batik), appropriate input-output coefficients in manufacturing are not available. The industry statistics only improved significantly to include for instance, but then only for medium and large-scale enterprises.
The first input-output coefficients that have general validity for Indonesia’s textile industry are for 1971, and are summarised in Table 4. There are indications that both spinning and weaving increased and that the industry changed considerably after World War II to become more mechanised and more concentrated in large ventures. However, most of these changes did not occur until after the mid-1970s and 1980s, when the textile industry expanded exponentially due to Indonesia’s export-oriented industrialisation drive. In the 1970s, Indonesia’s weaving industry still comprised a large number of small ventures that employed simple technology (Hill 1992: 6-8). Hence, 1971 was just before major technological changes affected the sector.
We assume that the sub-total input-output coefficients shown in Table 4 applied to the industry in Indonesia during 1820-1941. This is not likely. For example, inputs such as chemical dyes and electricity were not used during much of the 19th century. However, there is no way to correct for this. Gross value added was calculated according to equation 1.17
( )(1 ) ( )F F F F R Rt t t t tGVA P Q i P Q= − − (Equation 1)
P = Price of the final product (see Appendix) Q = Quantity produced (see Appendix) F = Final product (respectively yarn, unbleached fabric, or dyed fabric) R = Raw material (respectively imported and domestically produced raw cotton, yarn, or unbleached fabric) iF = Subtotal input-output coefficient from Table 4 A major uncertainty in the calculations is the price of finished cloth. We used the price of imported printed cloth, but it should be noted that the premium for high-quality, domestically produced batik could be 10 times the regular price (Rouffaer 1904: 25, 28). It is not possible to capture this premium.
17 Output in the wearing apparel industry is not included.
20
Figure 3 shows GVA in current and 1929 prices. The constant price series reveal a similar pattern to Figure 2, but with some significant differences. Firstly, the contribution of weaving and spinning to GVA in 1929 prices is very marginal, which supports the impression that both activities long added little value, given the small price differentials between the same quantities of raw cotton, yarn and unbleached cloth in 1929. However, the current price series shows that GVA was still positive in these activities. Figure 4 shows the share of spinning and weaving in GVA decreased during 1820-72 to less than 10% of total GVA, which means that since the 1840s most value was added in finishing, particularly batik. Secondly, Figure 3 shows that the textile industry did not decrease, but expanded gradually during the early-19th century, and experienced significant growth from the 1850s until World War I, particularly in finishing activities. Thirdly, GVA in weaving increased slightly since the 1860s on the basis of imported yarn, but stagnated until the significant upsurge in the late-1930s.
In 1930, employment in the textile industry was 679,341 (Volkstelling 1936: 122-123), which yields GVA per worker in current prices of ƒ59. Timmermans (1941: 40) estimated employment at 70,000 in 1940, excluding village weaving. Small weavers using ATBM looms may be estimated at 16,000, while some 500,000 home weavers in Java used the gedogan loom, possibly another 250,000 in the rest of the country. This would bring total employment at 836,000 and GVA per worker at ƒ54 in 1940. In both 1930 and 1940, GVA per worker was comparable to that in agriculture at ƒ59 and ƒ53, respectively (Van der Eng 1996: 263-77). These labour productivity estimates take no account of the fact that most employment in the textile industry tended to be part-time and seasonal, particularly in small-scale and household spinning, weaving and finishing. There was a seasonal ‘pull-back’ of agricultural employment at harvest time. In addition, many workers worked at home under the bakul system, with irregular working hours, compared to medium and large scale ventures with regular working hours. 7. Conclusion Activity in the cotton textile industry in colonial Indonesia did not decrease, as the ‘de-industrialisation’ hypothesis suggests. GVA in constant prices increased in Java during 1820-71, and increased more than three-fold during 1874-1914. The industry’s fortunes fluctuated during 1915-33, but GVA doubled during 1934-41. Until the mid-1930s, most of the growth of the sector was in the finishing of imported unbleached and bleached cotton cloth, particularly in dyeing and batik production by small-scale ventures. Although there were no formal entry barriers to this industry, the locally differentiated preference for dyed and batik cloth made it difficult for foreign competitors to imitate the products of this industry. Moreover, this industry enhanced its competitiveness through increasingly low-cost imported fabrics, the development of the wax stamping technique, and increasing use of cheaper imported
21
chemical dyes and wax substitutes. It is therefore difficult to argue that colonial rule forced Indonesia to suffer from ‘de-industrialisation’ in the cotton textile sector.
On the other hand, for more than a century up until the late-1930s, domestic spinning and weaving remained of marginal significance for a combination of reasons, of which the following are the most important:
(1) Indigenous spinning and weaving technologies were too labour intensive to be competitive with imported cloth and yarn, despite the fact that import prices may have exceeded world market levels due to trade policies favouring imports from The Netherlands until 1874. This disadvantage was somewhat mitigated after the introduction and spread in the 1920s of new weaving technologies that suited small-scale producers and increased their labour productivity.
(2) Local raw cotton production was of marginal significance. While the production of other crops triggered the establishment of major agro-processing ventures, cotton production did not provide a sufficient base for the start of a cotton spinning industry with imported technology.
(3) Starting during World War I, the market for cotton textiles fluctuated considerably, largely in line with the boom-bust cycles of Indonesia’s export industries and their terms of trade. It is likely that such instability discouraged private investment in a modern cotton weaving industry.
(4) International competition in markets for yarn and cloth was fierce and delivered Indonesia textiles at the lowest possible cost. At the same time, unfavourable real exchange rates conspired against private investment in modern spinning and weaving ventures using imported technologies and inputs. Such ventures would only be feasible with trade protection, at least in the start-up phase. The principles of Indonesia’s trade policy long did not allow such protection. In addition, protective import policy could have hurt Indonesia’s export performance based on competitive primary commodities, as textiles were an important wage good.
Only when the recovery of these export industries appeared impossible by 1933 due to mounting international trade protection, did the colonial government reconsider its trade policies. Initially to overcome import restrictions, then as a development strategy and in anticipation of shortages during World War II, it opted for trade protection in the form of tariffs and quota that discriminated against imported textiles. This triggered a rapid development of weaving in enterprises of variable sizes and of mechanical spinning ventures. Appendix A: Supply of cotton textiles estimation, 1820-1941 Data on cotton production are available for Java, where on average only 14,300 ha. was harvested per year during 1880-95 and 9,100 ha. during 1913-40 (CEI10 1990: 102-04).18 By the 1930s, raw cotton was mainly produced in parts of Java, Sumatra
18 Hence, it is unlikely that there has been an enormous decline in cotton production since the late-19th
22
(ca. 30,000 ha.) and Nusatengara (ca. 6,500 ha), and to a lesser extent elsewhere in the archipelago. Production may have varied from year to year, depending on rainfall. Still, cotton was harvested from around 45,000 ha in Indonesia as a whole, which was a far cry from, for instance, the prewar 2.3 million hectare in China. Cotton yields were low, roughly 100 kg fibre per ha (compared to 200 kg in the USA, Paerels 1950: 26, 31-32). Production was perhaps 4,500 tons or about 0.07 kg per capita in 1930, or about 7% of total supply. Given that Indonesia did not import raw cotton during these years, this figure confirms that cotton spinning was marginal and that weaving was largely on the basis of imported yarn.
Boomgaard (1989: 220-28) estimated per capita production of cotton for Java in the 19th century. Assuming that his yield data refer to raw cotton with seeds, his estimates suggest a per capita consumption of locally produced cotton fibre of 0.31 kg in 1815, 0.18 kg in 1840 and 0.11 kg in 1880. The estimate for 1815 would have been sufficient for the production of just one woven sarong (of 1 x 2.5 m2) per person in Java (CEI8 1987: 156).
Data on both the imported value and quantity of cotton textiles are available from the annual trade statistics publications, Statistiek van den Handel en de In- en Uitvoerrechten in Nederlandsch-Indië, Jaaroverzicht van de In- en Uitvoer van Nederlandsch-Indië for 1915-40 and Sofjan (1959: 112-16) for 1941. Data on the value of raw cotton, yarn, and textiles imported from Indonesia’s Outer Islands and from other countries into Java are available during 1822-7319 and imports from other countries for Indonesia as a whole during 1871-73 from Statistiek van den Handel, De Scheepvaart en de In- en Uitvoerregten, and during 1874-1914 from CEI8 (1987), CEI12a (1991), CKS160 (1939) and CKS161 (1939).
Relevant prices are available from CEI15 (1994) and CKS166 (1939), augmented with raw cotton prices in The Netherlands from Van Riel (n.d.). Population data 1820-70 Java and 1871-1930 Indonesia are unpublished estimates, 1930-42 from Van der Eng (2002b).
The available statistical data on total imports of cotton cloth for 1822-1914 are not disaggregated by quality of cloth. Table A.1 shows the shares of key types of cloth, from different sources. The 1823-70 data do not refer to Java as a whole, but to the main ports through which imports arrived. The data on which Table A.1 is based were used to apportion estimate values of cloth imports in each of the 4 categories for 1822-1914.
Price data from CEI15 (1994: 23-38) were used to estimate the quantities imported. The annual prices of unbleached and bleached cloth are available in the forms of consistent time series for the entire period, and had to be estimated at times from different price series of calicoes and unbleached and bleached century, or even the early 19th century if we accept Boomgaard’s estimates. 19 When the British seized control over Java in 1811, they immediately started importing British cotton cloth (Van der Kraan 1996: 43-44). Cloth imports increased when Java was opened to private enterprise in 1813 and the trade was not disrupted by the return of Java to the Dutch in 1816. However, regular import statistics only start in 1822.
23
madapollams. The price of printed cloth was estimated as 115% of that of bleached cloth (average ratio for 1913-29). The price of woven sarong for 1855-68 was estimated as 125% of bleached cloth (average ratio for 1825-54), and 139% for 1874-1900 (average ratio 1869-73) and 200% for 1901-12 (average ratio for 1913-29). These annual prices were linked to the 1915-41 series of implicit cloth prices per kg. The resulting price time series were used to calculate quantities from the values of cloth exports in the 4 categories for Java during 1822-70 and Indonesia as a whole 1871-1914.
Boomgaard’s estimates (mentioned above) suggest that 47% of the supply of cotton yarn and cloth in 1840 in Java was from domestic sources and 13% in 1880 in Indonesia as a whole, assuming the same production per capita in the Outer Islands. Other estimates suggest that the Indonesian weaving industry still supplied 67% of demand for woven products in 1848, and 50% in 1860, but they may have included batik, i.e. dyed cotton cloth produced from imported cloth, so that the actual percentages may have been lower (CEI8 1987: 153). We assume here that imports of cotton textiles resumed in 1822, the first year for which import data are available, and that total per capita supply of cotton goods during 1820-21 was 0.31 kg, the 1815 level estimated by Boomgaard. That implies that in 1822 79% of total supply was from domestic sources. We interpolated the per capita quantities of domestic cotton production for 1822, 1840, 1880 and 1930, and added the results to the totals of imported cotton goods to approximate total supply. Domestic cotton production during 1931-41 was estimated with approximations of total harvested area. References Antlöv, H. and T. Svensson (1991), From Rural Home Weavers to Factory Labour: The
Industrialization of Textile Manufacturing in Majalaya. In P. Alexander et al. (eds.) In the Shadow of Agriculture: Non-Farm Activities in the Javanese Economy, Past and Present (Amsterdam: Royal Tropical Institute) 113-26.
Bairoch, P. and R. Kozul-Wright (1998), Globalization Myths: Some Historical Reflections on Integration, Industrialization and Growth in the World Economy. In R. Kozul-Wright and R. Rowthorn (eds.) Transnational Corporations and the Global Economy. (London: Macmillan) 37-68.
Boomgaard, P. (1989), Children of the Colonial State: Population Growth and Economic Development in Java, 1795-1880. Amsterdam: Free University Press.
Booth, A. (1998), The Indonesian Economy in the Nineteenth and Twentieth Centuries: A History of Missed Opportunities. London: Macmillan.
Broek, J.O.M. (1942), Economic Development of the Netherlands Indies. New York: Institute of Pacific Relations.
Broersma, R. (1931), Kan in Indië loonende katoennijverheid worden gevestigd?, De Bergcultures 28, 761-62.
CEI8 (1987), Changing Economy in Indonesia: Vol.8 Manufacturing Industry 1870-1942. Amsterdam: Royal Tropical Institute.
CEI10 (1990), Changing Economy in Indonesia: Vol.10 Food Crops and Arable Lands, Java 1815-1942. Amsterdam: Royal Tropical Institute.

24
CEI12a (1991), Changing Economy in Indonesia: Vol.12a General Trade Statistics 1822-1940. Amsterdam: Royal Tropical Institute.
CEI15 (1994), Changing Economy in Indonesia: Vol.15 Prices (Non-Rice) 1814-1940. Amsterdam: Royal Tropical Institute.
CKS160 (1939), Handelsstatistiek Java 1823-1873. Mededeelingen van het Centraal Kantoor voor de Statistiek No.160. Batavia: CKS.
CKS161 (1939), Handelsstatistiek Nederlandsch-Indië 1874-1937. Mededeelingen van het Centraal Kantoor voor de Statistiek No.161. Batavia: CKS.
CKS166 (1939), Historische prijzen in Ned.Indië sedert 1825. Mededeelingen van het Centraal Kantoor voor de Statistiek No.166. Batavia: CKS.
De Jonge, J.A. (1968), De Industrialisatie in Nederland tussen 1850 en 1914. Amsterdam: Scheltema en Holkema.
De Neuman, A.M. (1955), Industrial Development in Indonesia. Cambridge: Students’ Bookshops.
Dick, H.W. (1993), Nineteenth-Century Industrialization: A Missed Opportunity? In J.Th. Lindblad (ed.) New Challenges in the Modern Economic History of Indonesia. (Leiden: Programme of Indonesian Studies) 123-49.
Dijkstra, J.F. (1907) Katoen, Tijdschrift voor Nijverheid en Landbouw in Nederlandsch-Indië, 74: 607-19.
Fernando, M.R. (1996), Growth of non-agricultural economic activities in Java in the middle decades of the nineteenth century, Modern Asian Studies, 30: 77-119.
Fievez de Malines van Ginkel, F.M. and J.W. Meijer Ranneft (1926), Verslag van de Economischen Toestand der Inlandsche Bevolking 1924. Weltevreden: Kolff (2 vols.).
Fischer, E.J. (1981), De ontwikkeling van de Twentse katoennijverheid en de toename van de arbeidsproduktiviteit tussen 1800 en 1930, Textielhistorische Bijdragen, 22: 3-40.
Fruin, Th.A. (1947), Het Economische Aspect van het Indonesische Vraagstuk. Amsterdam: Vrij Nederland.
Hill, H. (1992), Indonesia’s Textiles and Garment Industries. Singapore: ISEAS. Huender, W. (1921), Overzicht van den Economischen Toestand der Inheemsche
Bevolking van Java en Madoera. The Hague: Nijhoff. Hulshoff Pol, D.J. (1948), De industrialisatiepolitiek in Indonesië. Economisch-
Statistische Berichten, 33, p.852-59. Huff, W.G. (2002), Boom-or-bust commodities and industrialization in pre-World War
II Malaya. Journal of Economic History, 64: 1074-15. IDE (1977), Input-Output Table Indonesia, 1971. IDE Statistical Data Series No.22.
Tokyo: Institute of Developing Economies (2 vols.). Jonkers, A. (1948), Welvaartszorg in Indonesië. The Hague: Van Hoeve. Kockelkorn, H. (1989), Conjuncturele ontwikkeling van de Twentse katoenindustrie,
1925-1965, Textielhistorische Bijdragen, 29: 95-121. Kraal, A. (1957), Enige Aspecten van de Ontwikkeling der Industrie in Indonesië. The
Hague: Van Hoeve. Kroese, W.T. (1946a), Statistische gegevens als basis der rehabilitatieplannen der
Nederlandsch-Indische textielindustrie. Economisch-Statistische Berichten, 31: 599-600.
Kroese, W.T. (1946b), Voorbereidende maatregelen voor de rehabilitatie der Nederlandsch-Indische textielindustrie. Economisch-Statistische Berichten, 31: 614-17.
Kroese, W.T. (1947), De ontwikkelingsmogelijkheden voor de Nederlandsch-Indische katoenindustrie. Mededelingen van het Departement van Economische Zaken, No.5. Jakarta: Archipel.
25
Kroese, W.T. (1979) Het Begin van de Industrialisatie van Indonesië: De Stichting van de Preanger Bontweverij (PWB) te Garut. Hengelo: Koninklijke Textielfabrieken Nijverdal-ten Cate NV.
Lindblad, J.Th. (1988), De Handel tussen Nederland en Nederlands-Indië, 1874-1939, Economisch en Sociaal-Historisch Jaarboek, 51: 240-98.
Lindblad, J.Th. (1994), De handel in katoentjes op Nederlands-Indië, 1824-1939. Textielhistorische Bijdragen, 34: 89-103.
Matsuo, H. (1970), The Development of Javanese Cotton Industry. Tokyo: Institute of Developing Economies.
Muller Szoon, H. (1857), De Nederlandsche Katoen-Nijverheid en het Stelsel van Bescherming in Nederlandsch-Indië. Rotterdam: Kramers.
Nayyar, D. (2005), Globalisation, history and development: A tale of two centuries. Cambridge Journal of Economics, 30: 137-59.
Paerels, B.H. (1950), Katoen. In C.J.J. van Hall and C. van de Koppel (eds.) De Landbouw in de Indische Archipel, Deel III. (The Hague: Van Hoeve) 7-52.
Palmer, I. (1972), Textiles in Indonesia: Problems of Import Substitution. New York: Praeger.
Post, P. (1996), Chinese Business Networks and Japanese Capital in South East Asia, 1880-1940: Some Preliminary Observations. In R. Ampalavanar Brown (ed.) Chinese Business Enterprise in Asia. (London: Routledge) 154-76.
Posthumus, N.W. (1921), Documenten Betreffende de Buitenlandsche Handelspolitiek van Nederland in the Negentiende Eeuw, Vol.2. The Hague: Nijhoff.
Rothe, C. (1938), Industrieën in Ned.Indië, II: Textielindustrie. Berichten van de Afdeeling Handelsmuseum van het Koloniaal Instituut No.125. Amsterdam: De Bussy.
Roy, T. (2004), Flourishing branches, wilting core: Research in modern Indian economic history. Australian Economic History Review, 44: 221-40.
Rhyne, R.F. (1954), Social and Political Changes Associated with the Dutch Program of Technological Development Carried out in Java. PhD thesis, University of California, Berkeley.
Rouffaer, G.P. (1904), De Voornaamste Industrieën der Inlandsche Bevolking van Java en Madoera. The Hague: Nijhoff.
Sitsen, P. (1943), Industrial Development of the Netherlands Indies. New York: Netherlands and Netherlands Indies Council of the Institute of Pacific Relations.
Sofjan, A. (1959), Masalah Kapas di Indonesia. Jakarta: Panitia Negara Urusan Tekstil.
Spoon, W. (1932), Beoordeling van Katoen uit Ned. Oost Indië. Berichten van de Afdeeling Handelsmuseum van het Koloniaal Instituut No.73. Amsterdam: De Bussy.
Sugiyama, S. (1994), The expansion of Japan’s cotton textile exports into Southeast Asia. In S. Sugiyama and M.C. Guerrero (eds.), International Commercial Rivalry in Southeast Asia in the Interwar Period. (New Haven: Yale Southeast Asia Studies) 42-73.
Sulistiyo and A. Mawarni (1991), Kapas: Kajian Sosial-Ekonomi. Yogyakarta: Aditya Media.
Telkamp, G.J. (1981), Aangepaste technologie in koloniale context: De textiel-industrie in Indonesië van 1930 tot 1942. In P. Boomgaard et al. (eds.) Exercities in Ons Verleden. (Assen: Van Gorcum) 224-45.
Timmermans, J.M.H. (1941), Ontwikkeling van de Nederlandsch-Indische textiel-industrie en de overheidsbemoeienis. Economisch Weekblad voor Nederlandsch-Indië (special issue, May 1941), 39-45.

26
Treub, M. (1904), Rapport van den Directeur van ‘s Lands Plantentuin betreffende de katoencultuur in Nederlandsch Indië. Javasche Courant (13 September 1904), appendix.
Tromp de Haas, W.R. (1903) Terugblik op Hetgeen in Nederlandsch-Indië Gedaan Is Nopens de Katoencultuur. Teysmannia, 14: 511-63.
Twomey, M.J. (1983), Employment in nineteenth century Indian textiles, Explorations in Economic History, 20: 37-57.
Van Assen, A.H. (1941), De nijverheidsstatistiek en hare resultaten ten aanzien van 1939. Economisch Weekblad voor Nederlandsch-Indië (special issue, May 1941) 68-89.
Van Breda de Haan, J. (1914), Overzicht van Hetgeen Werd Verricht ter Bevordering van de Katoencultuur in Nederlandsch Oost-Indië in 1913. Batavia: Kolff.
Van der Eng, P. (1996), Agricultural Growth in Indonesia: Productivity Change and Policy Impact since 1880. London: Macmillan.
Van der Eng, P. (1999), The Silver Standard and Asia’s Integration into the World Economy, 1850-1914, Review of Asian and Pacific Studies, 18: 59-85.
Van der Eng, P. (2002a), Indonesia’s Growth Performance in the 20th Century. In A. Maddison, D.S. Prasada Rao and W. Shepherd (eds.) The Asian Economies in the Twentieth Century. (Cheltenham: Edward Elgar) 143-179
Van der Eng, P. (2002b), Bridging a Gap: A Reconstruction of Population Patterns in Indonesia, 1930-1961, Asian Studies Review, 26: 487-509.
Van der Kraan, A. (1996), Anglo-Dutch rivalry in the Java cotton trade, 1811-30. Indonesia Circle, 68: 35-64.
Van Hall, C.J.J. (1939), Insulinde: De Inheemsche Landbouw. Deventer: Van Hoeve. Van Limburg Brouwer, J.L. (1863), Verslag van de Verrichtingen der Nederlandsch-
Indische Katoenmaatschappij, Tijdschrift voor Nederlandsch Indië, 1: 292-99. Van Oorschot, H.J. (1956), De Ontwikkeling van de Nijverheid in Indonesië. The
Hague: Van Hoeve. Van Riel, A. (n.d.), Constructing the nineteenth-century cost of living deflator (1800-
1913). Working document for project on the reconstruction of the national accounts of the Netherlands. http://www.iisg.nl/hpw/brannex.html
Van Setten, D.J.G. (1911), Eenige Gegevens voor de Katoencultuur in Nederlandsch-Osst-Indië. Mededeelingen Uitgaande van het Departement van Landbouw, No.14. Batavia: Kolff.
Van Warmelo, W. (1938), De Ontwikkeling van de Kleine Handweefnijverheid in het Madjalaja-rayon. Batavia: Departement van Economische Zaken.
Van Warmelo, W. (1939), Ontstaan en groei van de handweefnijverheid in Madjalaja, Koloniale Studiën, 23: 5-25.
Vandenbosch, A. (1944), The Dutch East Indies: Its Government, Problems, and Politics. Berkeley: University of California Press.
Versluys, J.D.N. (1949), Aspecten van Indonesië’s Industrialisatie en Haar Financiering. Groningen: Wolters.
Veth, P.J. (1865), Bijdragen tot de Kennis van de Voornaamste Voortbrengselen van Nederlandsch Indië: III Het Katoen. Amsterdam: Fred Muller.
Vink, G.J. (1932-33), Ruim Honderd Jaar Ervaring met de Bevordering van de Katoencultuur in Nederlandsch-Indië. Landbouw, 8: 245-63.
Volkstelling (1936) Volkstelling 1930: Deel VIII, Overzicht voor Nederlandsch-Indië. Batavia: Landsdrukkerij.
Wirodihardjo, S. (1951), De Contigenteeringspolitiek en Hare Invloed op de Indonesische Bevolking. Jakarta: Indira.
Wisselink, J. (1933), Het vraagstuk der katoenindustrie in Nederlandsch-Indië. Economisch Weekblad voor Nederlandsch-Indië, 2: 1930-35 and 1985-90.
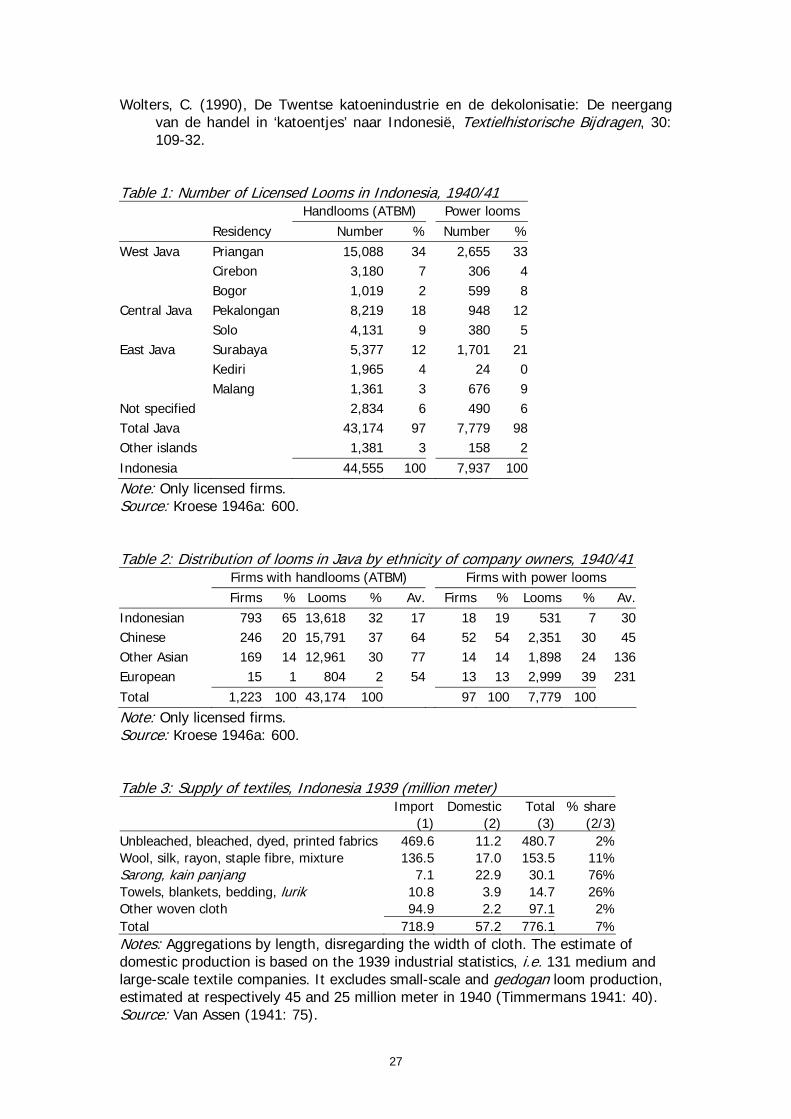
27
Wolters, C. (1990), De Twentse katoenindustrie en de dekolonisatie: De neergang van de handel in ‘katoentjes’ naar Indonesië, Textielhistorische Bijdragen, 30: 109-32.
Table 1: Number of Licensed Looms in Indonesia, 1940/41 Handlooms (ATBM) Power looms Residency Number % Number %West Java Priangan 15,088 34 2,655 33 Cirebon 3,180 7 306 4 Bogor 1,019 2 599 8Central Java Pekalongan 8,219 18 948 12 Solo 4,131 9 380 5East Java Surabaya 5,377 12 1,701 21 Kediri 1,965 4 24 0 Malang 1,361 3 676 9Not specified 2,834 6 490 6Total Java 43,174 97 7,779 98Other islands 1,381 3 158 2Indonesia 44,555 100 7,937 100
Note: Only licensed firms. Source: Kroese 1946a: 600. Table 2: Distribution of looms in Java by ethnicity of company owners, 1940/41 Firms with handlooms (ATBM) Firms with power looms Firms % Looms % Av. Firms % Looms % Av. Indonesian 793 65 13,618 32 17 18 19 531 7 30 Chinese 246 20 15,791 37 64 52 54 2,351 30 45 Other Asian 169 14 12,961 30 77 14 14 1,898 24 136 European 15 1 804 2 54 13 13 2,999 39 231 Total 1,223 100 43,174 100 97 100 7,779 100 Note: Only licensed firms. Source: Kroese 1946a: 600. Table 3: Supply of textiles, Indonesia 1939 (million meter) Import Domestic Total % share (1) (2) (3) (2/3) Unbleached, bleached, dyed, printed fabrics 469.6 11.2 480.7 2% Wool, silk, rayon, staple fibre, mixture 136.5 17.0 153.5 11% Sarong, kain panjang 7.1 22.9 30.1 76% Towels, blankets, bedding, lurik 10.8 3.9 14.7 26% Other woven cloth 94.9 2.2 97.1 2% Total 718.9 57.2 776.1 7% Notes: Aggregations by length, disregarding the width of cloth. The estimate of domestic production is based on the 1939 industrial statistics, i.e. 131 medium and large-scale textile companies. It excludes small-scale and gedogan loom production, estimated at respectively 45 and 25 million meter in 1940 (Timmermans 1941: 40). Source: Van Assen (1941: 75).
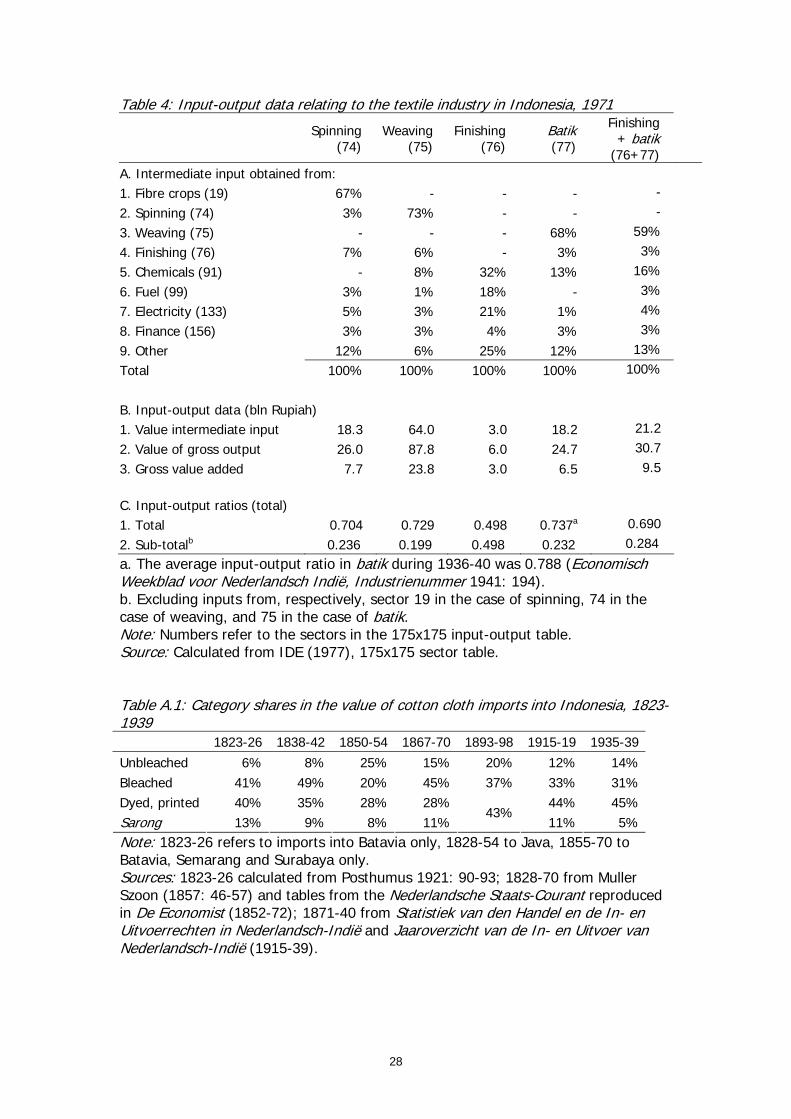
28
Table 4: Input-output data relating to the textile industry in Indonesia, 1971
Spinning (74)
Weaving (75)
Finishing (76)
Batik (77)
Finishing + batik
(76+77) A. Intermediate input obtained from:
1. Fibre crops (19) 67% - - - -
2. Spinning (74) 3% 73% - - -
3. Weaving (75) - - - 68% 59%
4. Finishing (76) 7% 6% - 3% 3%
5. Chemicals (91) - 8% 32% 13% 16%
6. Fuel (99) 3% 1% 18% - 3%
7. Electricity (133) 5% 3% 21% 1% 4%
8. Finance (156) 3% 3% 4% 3% 3%
9. Other 12% 6% 25% 12% 13%
Total 100% 100% 100% 100% 100%
B. Input-output data (bln Rupiah)
1. Value intermediate input 18.3 64.0 3.0 18.2 21.2
2. Value of gross output 26.0 87.8 6.0 24.7 30.7
3. Gross value added 7.7 23.8 3.0 6.5 9.5 C. Input-output ratios (total)
1. Total 0.704 0.729 0.498 0.737a 0.690
2. Sub-totalb 0.236 0.199 0.498 0.232 0.284
a. The average input-output ratio in batik during 1936-40 was 0.788 (Economisch Weekblad voor Nederlandsch Indië, Industrienummer 1941: 194). b. Excluding inputs from, respectively, sector 19 in the case of spinning, 74 in the case of weaving, and 75 in the case of batik. Note: Numbers refer to the sectors in the 175x175 input-output table. Source: Calculated from IDE (1977), 175x175 sector table. Table A.1: Category shares in the value of cotton cloth imports into Indonesia, 1823-1939 1823-26 1838-42 1850-54 1867-70 1893-98 1915-19 1935-39 Unbleached 6% 8% 25% 15% 20% 12% 14% Bleached 41% 49% 20% 45% 37% 33% 31% Dyed, printed 40% 35% 28% 28% 44% 45% Sarong 13% 9% 8% 11%
43%11% 5%
Note: 1823-26 refers to imports into Batavia only, 1828-54 to Java, 1855-70 to Batavia, Semarang and Surabaya only. Sources: 1823-26 calculated from Posthumus 1921: 90-93; 1828-70 from Muller Szoon (1857: 46-57) and tables from the Nederlandsche Staats-Courant reproduced in De Economist (1852-72); 1871-40 from Statistiek van den Handel en de In- en Uitvoerrechten in Nederlandsch-Indië and Jaaroverzicht van de In- en Uitvoer van Nederlandsch-Indië (1915-39).
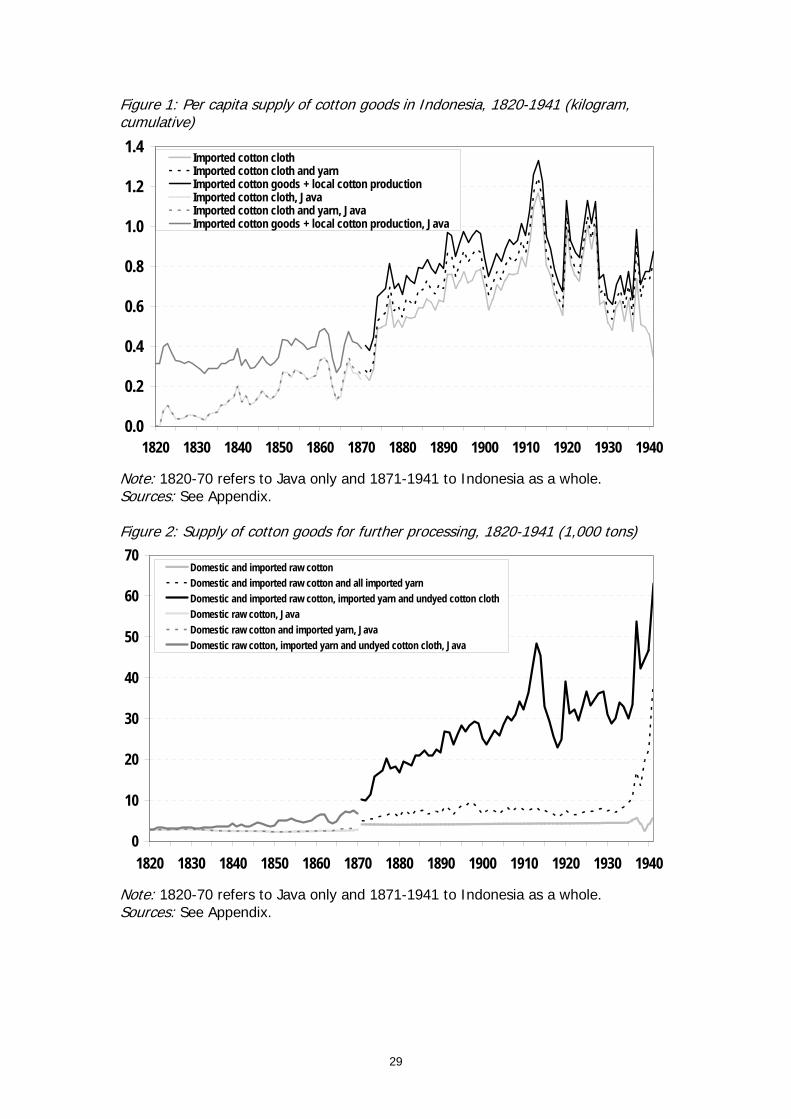
29
Figure 1: Per capita supply of cotton goods in Indonesia, 1820-1941 (kilogram, cumulative)
0.0
0.2
0.4
0.6
0.8
1.0
1.2
1.4
1820 1830 1840 1850 1860 1870 1880 1890 1900 1910 1920 1930 1940
Imported cotton clothImported cotton cloth and yarnImported cotton goods + local cotton productionImported cotton cloth, JavaImported cotton cloth and yarn, JavaImported cotton goods + local cotton production, Java
Note: 1820-70 refers to Java only and 1871-1941 to Indonesia as a whole. Sources: See Appendix. Figure 2: Supply of cotton goods for further processing, 1820-1941 (1,000 tons)
0
10
20
30
40
50
60
70
1820 1830 1840 1850 1860 1870 1880 1890 1900 1910 1920 1930 1940
Domestic and imported raw cottonDomestic and imported raw cotton and all imported yarnDomestic and imported raw cotton, imported yarn and undyed cotton clothDomestic raw cotton, JavaDomestic raw cotton and imported yarn, JavaDomestic raw cotton, imported yarn and undyed cotton cloth, Java
Note: 1820-70 refers to Java only and 1871-1941 to Indonesia as a whole. Sources: See Appendix.
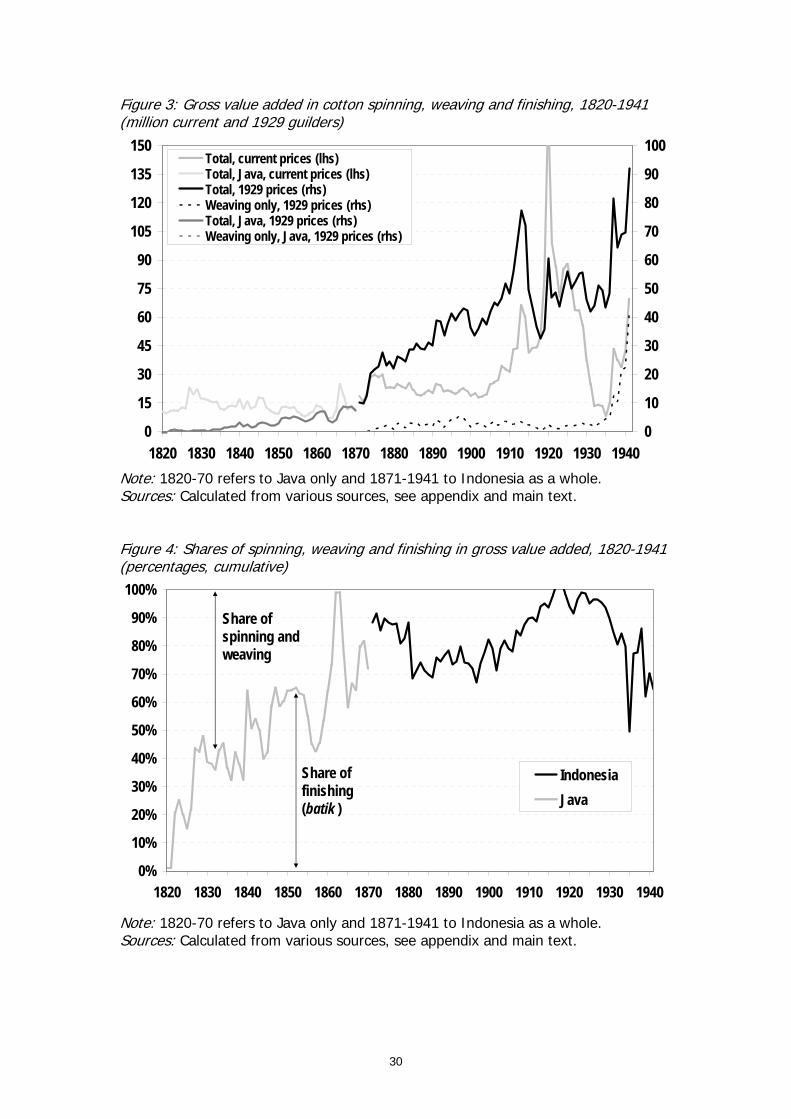
30
Figure 3: Gross value added in cotton spinning, weaving and finishing, 1820-1941 (million current and 1929 guilders)
0
15
30
45
60
75
90
105
120
135
150
1820 1830 1840 1850 1860 1870 1880 1890 1900 1910 1920 1930 19400
10
20
30
40
50
60
70
80
90
100Total, current prices (lhs)Total, Java, current prices (lhs)Total, 1929 prices (rhs)Weaving only, 1929 prices (rhs)Total, Java, 1929 prices (rhs)Weaving only, Java, 1929 prices (rhs)
Note: 1820-70 refers to Java only and 1871-1941 to Indonesia as a whole. Sources: Calculated from various sources, see appendix and main text. Figure 4: Shares of spinning, weaving and finishing in gross value added, 1820-1941 (percentages, cumulative)
0%
10%
20%
30%
40%
50%
60%
70%
80%
90%
100%
1820 1830 1840 1850 1860 1870 1880 1890 1900 1910 1920 1930 1940
IndonesiaJava
Share of spinning and weaving
Share of finishing (batik )
Note: 1820-70 refers to Java only and 1871-1941 to Indonesia as a whole. Sources: Calculated from various sources, see appendix and main text.
Working Papers in Trade and Development
List of Papers (including publication details as at 2007)
99/1 K K TANG, ‘Property Markets and Policies in an Intertemporal General Equilibrium Model’. 99/2 HARYO ASWICAHYONO and HAL HILL, ‘‘Perspiration’ v/s ‘Inspiration’ in Asian
Industrialization: Indonesia Before the Crisis’. 99/3 PETER G WARR, ‘What Happened to Thailand?’. 99/4 DOMINIC WILSON, ‘A Two-Sector Model of Trade and Growth’. 99/5 HAL HILL, ‘Indonesia: The Strange and Sudden Death of a Tiger Economy’. 99/6 PREMA-CHANDRA ATHUKORALA and PETER G WARR, ‘Vulnerability to a Currency
Crisis: Lessons from the Asian Experience’. 99/7 PREMA-CHANDRA ATHUKORALA and SARATH RAJAPATIRANA, ‘Liberalization and
Industrial Transformation: Lessons from the Sri Lankan Experience’. 99/8 TUBAGUS FERIDHANUSETYAWAN, ‘The Social Impact of the Indonesian Economic
Crisis: What Do We Know?’ 99/9 KELLY BIRD, ‘Leading Firm Turnover in an Industrializing Economy: The Case of
Indonesia’. 99/10 PREMA-CHANDRA ATHUKORALA, ‘Agricultural Trade Liberalization in South Asia:
From the Uruguay Round to the Millennium Round’. 99/11 ARMIDA S ALISJAHBANA, ‘Does Demand for Children’s Schooling Quantity and Quality
in Indonesia Differ across Expenditure Classes?’ 99/12 PREMA-CHANDRA ATHUKORALA, ‘Manufactured Exports and Terms of Trade of
Developing Countries: Evidence from Sri Lanka’. 00/01 HSIAO-CHUAN CHANG, ‘Wage Differential, Trade, Productivity Growth and Education.’ 00/02 PETER G WARR, ‘Targeting Poverty.’ 00/03 XIAOQIN FAN and PETER G WARR, ‘Foreign Investment, Spillover Effects and the
Technology Gap: Evidence from China.’ 00/04 PETER G WARR, ‘Macroeconomic Origins of the Korean Crisis.’ 00/05 CHINNA A KANNAPIRAN, ‘Inflation Targeting Policy in PNG: An Econometric Model
Analysis.’ 00/06 PREMA-CHANDRA ATHUKORALA, ‘Capital Account Regimes, Crisis and Adjustment in
Malaysia.’ 00/07 CHANGMO AHN, ‘The Monetary Policy in Australia: Inflation Targeting and Policy
Reaction.’

00/08 PREMA-CHANDRA ATHUKORALA and HAL HILL, ‘FDI and Host Country
Development: The East Asian Experience.’ 00/09 HAL HILL, ‘East Timor: Development Policy Challenges for the World’s Newest Nation.’ 00/10 ADAM SZIRMAI, M P TIMMER and R VAN DER KAMP, ‘Measuring Embodied
Technological Change in Indonesian Textiles: The Core Machinery Approach.’ 00/11 DAVID VINES and PETER WARR, ‘ Thailand’s Investment-driven Boom and Crisis.’ 01/01 RAGHBENDRA JHA and DEBA PRASAD RATH, ‘On the Endogeneity of the Money
Multiplier in India.’ 01/02 RAGHBENDRA JHA and K.V. BHANU MURTHY, ‘An Inverse Global Environmental
Kuznets Curve.’ 01/03 CHRIS MANNING, ‘The East Asian Economic Crisis and Labour Migration: A Set-Back for
International Economic Integration?’ 01/04 MARDI DUNGEY and RENEE FRY, ‘A Multi-Country Structural VAR Model.’ 01/05 RAGHBENDRA JHA, ‘Macroeconomics of Fiscal Policy in Developing Countries.’ 01/06 ROBERT BREUNIG, ‘Bias Correction for Inequality Measures: An application to China and
Kenya.’ 01/07 MEI WEN, ‘Relocation and Agglomeration of Chinese Industry.’ 01/08 ALEXANDRA SIDORENKO, ‘Stochastic Model of Demand for Medical Care with
Endogenous Labour Supply and Health Insurance.’ 01/09 A SZIRMAI, M P TIMMER and R VAN DER KAMP, ‘Measuring Embodied Technological
Change in Indonesian Textiles: The Core Machinery Approach.’ 01/10 GEORGE FANE and ROSS H MCLEOD, ‘Banking Collapse and Restructuring in Indonesia,
1997-2001.’ 01/11 HAL HILL, ‘Technology and Innovation in Developing East Asia: An Interpretive Survey.’ 01/12 PREMA-CHANDRA ATHUKORALA and KUNAL SEN, ‘The Determinants of Private
Saving in India.’ 02/01 SIRIMAL ABEYRATNE, ‘Economic Roots of Political Conflict: The Case of
Sri Lanka.’ 02/02 PRASANNA GAI, SIMON HAYES and HYUN SONG SHIN, ‘Crisis Costs and Debtor
Discipline: the efficacy of public policy in sovereign debt crises.’ 02/03 RAGHBENDRA JHA, MANOJ PANDA and AJIT RANADE, ‘An Asian Perspective on a
World Environmental Organization.’ 02/04 RAGHBENDRA JHA, ‘Reducing Poverty and Inequality in India: Has Liberalization
Helped?’
02/05 ARCHANUN KOHPAIBOON, ‘Foreign Trade Regime and FDI-Growth Nexus: A Case Study of Thailand.’
02/06 ROSS H MCLEOD, ‘Privatisation Failures in Indonesia.’ 02/07 PREMA-CHANDRA ATHUKORALA, ‘Malaysian Trade Policy and the 2001 WTO Trade
Policy Review.’ 02/08 M C BASRI and HAL HILL, ‘Ideas, Interests and Oil Prices: The Political Economy of Trade
Reform during Soeharto’s Indonesia.’ 02/09 RAGHBENDRA JHA, ‘Innovative Sources of Development Finance – Global Cooperation in
the 21st Century.’ 02/10 ROSS H MCLEOD, ‘Toward Improved Monetary Policy in Indonesia.’ 03/01 MITSUHIRO HAYASHI, ‘Development of SMEs in the Indonesian Economy.’ 03/02 PREMA-CHANDRA ATHUKORALA and SARATH RAJAPATIRANA, ‘Capital Inflows
and the Real Exchange Rate: A Comparative Study of Asia and Latin America.’ 03/03 PETER G WARR, ‘Industrialisation, Trade Policy and Poverty Reduction: Evidence from
Asia.’ 03/04 PREMA-CHANDRA ATHUKORALA, ‘FDI in Crisis and Recovery: Lessons from the 1997-
98 Asian Crisis.’ 03/05 ROSS H McLEOD, ‘Dealing with Bank System Failure: Indonesia, 1997-2002.’ 03/06 RAGHBENDRA JHA and RAGHAV GAIHA, ‘Determinants of Undernutrition in Rural
India.’ 03/07 RAGHBENDRA JHA and JOHN WHALLEY, ‘Migration and Pollution.’ 03/08 RAGHBENDRA JHA and K V BHANU MURTHY, ‘A Critique of the Environmental
Sustainability Index.’ 03/09 ROBERT J BAROO and JONG-WHA LEE, ‘IMF Programs: Who Is Chosen and What Are the
Effects? 03/10 ROSS H MCLEOD, ‘After Soeharto: Prospects for reform and recovery in Indonesia.’ 03/11 ROSS H MCLEOD, ‘Rethinking vulnerability to currency crises: Comments on Athukorala
and Warr.’ 03/12 ROSS H MCLEOD, ‘Equilibrium is good: Comments on Athukorala and Rajapatirana.’ 03/13 PREMA-CHANDRA ATHUKORALA and SISIRA JAYASURIYA, ‘Food Safety Issues, Trade
and WTO Rules: A Developing Country Perspective.’ 03/14 WARWICK J MCKIBBIN and PETER J WILCOXEN, ‘Estimates of the Costs of Kyoto-
Marrakesh Versus The McKibbin-Wilcoxen Blueprint.’
03/15 WARWICK J MCKIBBIN and DAVID VINES, ‘Changes in Equity Risk Perceptions: Global Consequences and Policy Responses.’
03/16 JONG-WHA LEE and WARWICK J MCKIBBIN, ‘Globalization and Disease: The Case of
SARS.’ 03/17 WARWICK J MCKIBBIN and WING THYE WOO, ‘The consequences of China’s WTO
Accession on its Neighbors.’ 03/18 MARDI DUNGEY, RENEE FRY and VANCE L MARTIN, ‘Identification of Common and
Idiosyncratic Shocks in Real Equity Prices: Australia, 1982 to 2002.’ 03/19 VIJAY JOSHI, ‘Financial Globalisation, Exchange Rates and Capital Controls in Developing
Countries.’ 03/20 ROBERT BREUNIG and ALISON STEGMAN, ‘Testing for Regime Switching in
Singaporean Business Cycles.’ 03/21 PREMA-CHANDRA ATHUKORALA, ‘Product Fragmentation and Trade Patterns in East
Asia.’ 04/01 ROSS H MCLEOD, ‘Towards Improved Monetary Policy in Indonesia: Response to De
Brouwer’ 04/02 CHRIS MANNING and PRADIP PHATNAGAR, ‘The Movement of Natural Persons in
Southeast Asia: How Natural? 04/03 RAGHBENDRA JHA and K V BHANU MURTHY, ‘A Consumption Based Human
Development Index and The Global Environment Kuznets Curve’ 04/04 PREMA-CHANDRA ATHUKORALA and SUPHAT SUPHACHALASAI, ‘Post-crisis Export
Performance in Thailand’ 04/05 GEORGE FANE and MARTIN RICHARDSON, ‘Capital gains, negative gearing and
effective tax rates on income from rented houses in Australia’ 04/06 PREMA-CHANDRA ATHUKORALA, ‘Agricultural trade reforms in the Doha Round: a
developing country perspective’ 04/07 BAMBANG-HERU SANTOSA and HEATH McMICHAEL, ‘ Industrial development in East
Java: A special case?’ 04/08 CHRIS MANNING, ‘Legislating for Labour Protection: Betting on the Weak or the Strong?’ 05/01 RAGHBENDRA JHA, ‘Alleviating Environmental Degradation in the Asia-Pacific Region:
International cooperation and the role of issue-linkage’ 05/02 RAGHBENDRA JHA, RAGHAV GAIHA and ANURAG SHARMA, ‘Poverty Nutrition Trap
in Rural India’ 05/03 PETER WARR, ‘Food Policy and Poverty in Indonesia: A General Equilibrium Analysis’ 05/04 PETER WARR, ‘Roads and Poverty in Rural Laos’
05/05 PREMA-CHANDRA ATHUKORALA and BUDY P RESOSUDARMO, ‘The Indian Ocean Tsunami: Economic Impact, Disaster Management and Lessons’
05/06 PREMA-CHANDRA ATHUKORALA, ‘Trade Policy Reforms and the Structure of
Protection in Vietnam’ 05/07 PREMA-CHANDRA ATHUKORALA and NOBUAKI YAMASHITA, ‘Production
Fragmentation and Trade Integration: East Asia in a Global Context’ 05/08 ROSS H MCLEOD, ‘Indonesia’s New Deposit Guarantee Law’ 05/09 KELLY BIRD and CHRIS MANNING, ‘Minimum Wages and Poverty in a Developing
Country: Simulations from Indonesia’s Household Survey’ 05/10 HAL HILL, ‘The Malaysian Economy: Past Successes, Future Challenges’ 05/11 ZAHARI ZEN, COLIN BARLOW and RIA GONDOWARSITO, ‘Oil Palm in Indonesian
Socio-Economic Improvement: A Review of Options’ 05/12 MEI WEN, ‘Foreign Direct Investment, Regional Geographical and Market Conditions, and
Regional Development: A Panel Study on China’ 06/01 JUTHATHIP JONGWANICH, ‘Exchange Rate Regimes, Capital Account Opening and Real
Exchange Rates: Evidence from Thailand’ 06/02 ROSS H MCLEOD, ‘Private Sector Lessons for Public Sector Reform in Indonesia’ 06/03 PETER WARR, ‘The Gregory Thesis Visits the Tropics’ 06/04 MATT BENGE and GEORGE FANE, ‘Adjustment Costs and the Neutrality of Income Taxes’ 06/05 RAGHBENDRA JHA, ‘Vulnerability and Natural Disasters in Fiji, Papua New Guinea,
Vanuatu and the Kyrgyz Republic’ 06/06 PREMA-CHANDRA ATHUKORALA and ARCHANUN KOHPAIBOON, ‘Multinational
Enterprises and Globalization of R&D: A Study of U.S-based Firms 06/07 SANTANU GUPTA and RAGHBENDRA JHA, ‘Local Public Goods in a Democracy: Theory
and Evidence from Rural India’ 06/08 CHRIS MANNING and ALEXANDRA SIDORENKO, ‘The Regulation of Professional
Migration in ASEAN – Insights from the Health and IT Sectors’ 06/09 PREMA-CHANDRA ATHUKORALA, ‘Multinational Production Networks and the New
Geo-economic Division of Labour in the Pacific Rim’ 06/10 RAGHBENDRA JHA, RAGHAV GAIHA and ANURAG SHARMA, ‘On Modelling Variety
in Consumption Expenditure on Food’ 06/11 PREMA-CHANDRA ATHUKORALA, ‘Singapore and ASEAN in the New Regional
Division of Labour’ 06/12 ROSS H MCLEOD, ‘Doing Business in Indonesia: Legal and Bureaucratic Constraints’
06/13 DIONISIUS NARJOKO and HAL HILL, ‘Winners and Losers during a Deep Economic Crisis; Firm-level Evidence from Indonesian Manufacturing’
06/14 ARSENIO M BALISACAN, HAL HILL and SHARON FAYE A PIZA, ‘Regional
Development Dynamics and Decentralization in the Philippines: Ten Lessons from a ‘Fast Starter’’
07/01 KELLY BIRD, SANDY CUTHBERTSON and HAL HILL, ‘Making Trade Policy in a New
Democracy after a Deep Crisis: Indonesia 07/02 RAGHBENDRA JHA and T PALANIVEL, ‘Resource Augmentation for Meeting the
Millennium Development Goals in the Asia Pacific Region’ 07/03 SATOSHI YAMAZAKI and BUDY P RESOSUDARMO, ‘Does sending farmers back to
school have an impact? A spatial econometric approach’ 07/04 PIERRE VAN DER ENG, ‘De-industrialisation’ and colonial rule: The cotton textile industry
in Indonesia, 1820-1941