WORKING PAPER - IPC · WORKING PAPER working paper número 162 october, ... Maria Hernandez, ......
50
WORKING PAPER working paper número 162 october, 2017 ISSN 1812-108x Social and Behaviour Change Communication (SBCC) project in Manica, Mozambique: baseline survey report Mario Gyori, Tatiana Martínez Zavala, Jessica Baier, Maria Hernandez, Sofie Olsson and Alexis Lefevre, International Policy Centre for Inclusive Growth (IPC-IG)
Transcript of WORKING PAPER - IPC · WORKING PAPER working paper número 162 october, ... Maria Hernandez, ......

W O R K I N GP A P E R
working paper número 162october, 2017
ISSN 1812-108x
Social and Behaviour Change Communication (SBCC) project in Manica, Mozambique: baseline survey report
Mario Gyori, Tatiana Martínez Zavala, Jessica Baier, Maria Hernandez, Sofie Olsson and Alexis Lefevre, International Policy Centre for Inclusive Growth (IPC-IG)

Copyright© 2017International Policy Centre for Inclusive Growth
International Policy Centre for Inclusive Growth (IPC-IG)
SBS, Quadra 1, Bloco J, Ed. BNDES, 13º andar70076-900 Brasília, DF - BrazilTelephone: +55 61 2105 5000
[email protected] ■ www.ipcig.org
The International Policy Centre for Inclusive Growth is jointly supported by theUnited Nations Development Programme and the Government of Brazil.
Rights and Permissions
All rights reserved.
The text and data in this publication may be reproduced as long as the source is cited.Reproductions for commercial purposes are forbidden.
The International Policy Centre for Inclusive Growth disseminates the findings of its workin progress to encourage the exchange of ideas about development issues. The papers aresigned by the authors and should be cited accordingly. The findings, interpretations, andconclusions that they express are those of the authors and not necessarily those of theUnited Nations Development Programme or the Government of Brazil.
Working Papers are available online at www.ipcig.org andsubscriptions can be requested by email to [email protected].
Print ISSN: 1812-108X

ACRONYMS
ANDA Associação Nacional para o Desenvolvimento Sustentável
DD Difference-in-difference
FCS Food consumption score
IDDS Individual dietary diversity score
IPC-IG International Policy Centre for Inclusive Growth
MDD Minimum dietary diversity
PSM Propensity score matching
SBCC Social and behaviour change communication
SDG Sustainable Development Goal
SDSMAS District Services for Women and Social Affairs (Serviços Distritais de Saúde Mulher e Acção Social)
WASH Water, sanitation and hygiene
WFP World Food Programme

SOCIAL AND BEHAVIOUR CHANGE COMMUNICATION (SBCC)PROJECT IN MANICA, MOZAMBIQUE: BASELINE SURVEY REPORT
Mario Gyori, Tatiana Martínez Zavala, Jessica Baier, Maria Hernandez, Sofie Olsson and Alexis Lefevre1
This baseline report has been developed for an impact evaluation of a social and behaviour change communication (SBCC) project implemented by the World Food Programme (WFP) in Mozambique’s Manica province and funded through the European Union’s MDG1c initiative. The intervention’s overall goal is to improve children’s health and nutrition by promoting good practices in the areas of maternal care and nutrition, infant and young child feeding, malaria prevention, and water, sanitation and hygiene. The intervention builds on two components: i) interpersonal communication, consisting of the training of community health committee members who in turn train community members; and ii) mass media communication, consisting of short-duration radio spots, broadcast by community radio stations that participated in corresponding capacity development activities. Overall, the project is expected to reach around 44,640 individuals through the interpersonal communication component and 379,000 individuals through the mass media component.
The population of Manica province is exposed to the intervention through three different treatment intensities:
y interpersonal training and mass media communication;
y mass media communication only; and
y a comparison group, with no intervention at all.
A baseline survey was conducted between December 2016 and March 2017 to describe the situation of the prospective SBCC beneficiaries and the comparison households at baseline. The survey included questions on the households’ demographic composition, socio-economic situation, health and nutrition outcomes, and knowledge, attitudes and practices with regards to the four priority areas of the SBCC intervention:
y maternal care and nutrition;
y infant and young child feeding;
1. The authors wish to express their gratitude to Fábio Veras Soares (IPC-IG) and Joanna Murray (Development Media International) for their valuable comments during the development of the baseline survey questionnaire and the research design. The baseline survey would not have been possible without the hard work and dedication of the 22 enumerators involved. Lastly, the authors would like to thank the MDG1c team at WFP Mozambique, in particular Andreia Fausto, Salesio Missomal, Jonathan Garcia and Antonio Rafael.

Working Paper6
y malaria prevention; and
y water, sanitation and hygiene.
A total of 1380 interviews were carried out: 478 in group A, 395 in group B, and 507 in group C. The target group of the survey were women aged 18 to 49 who were either pregnant or had a child under the age of 2. The results of the baseline survey are described in this report.
y The baseline data indicate a low level of socio-economic development among the targeted households at baseline. Most of the women interviewed and the respective households were highly dependent on agriculture, the rate of illiteracy was high, especially among women (60 per cent), and a quarter of households did not have any type of toilet facility. Furthermore, 60 per cent of the households interviewed did not have access to a radio.
y With regards to the maternal care and nutrition practices at baseline, it can be noted that most of the women interviewed attended a pre-natal examination during their most recent pregnancy (78 per cent) and gave birth at a health clinic or a rural hospital (74 per cent). Only 14 per cent of the respondents reported that their last child was born at home. Two thirds of all the women interviewed considered that eating an extra meal each day was important during pregnancy.
y Regarding infant and young child feeding, the baseline data show that approximately 60 per cent of the women interviewed believe that infants should be exclusively breastfed up to 6 months and that breastmilk contains enough nutrients for infants during that period, in line with UNICEF, WFP and WHO recommendations. Nearly two thirds (62 per cent) of the interviewees reported that their child was exclusively breastfed until 6 months of age, while 22 per cent reported that their children had received liquids earlier than this, and 8 per cent did not remember. On the other hand, the dietary diversity of children is very poor, with 89 per cent having ‘poor’ dietary diversity according to the WFP’s food consumption score (for 12 per cent dietary diversity was classified as ‘borderline’, and for only 1 per cent of the children was it ‘acceptable’). It can be concluded that there is space to improve both exclusive breastfeeding practices and dietary diversity.
y The baseline data reveal that approximately 75 per cent of respondents know that malaria is transmitted by mosquito bites, 80 per cent are able to identify the common symptoms of malaria, and 70 per cent own a mosquito net. On the other hand, only 57 per cent of the interviewees reported that their youngest child had slept under a mosquito net the night before the interview, indicating that adequate knowledge about malaria does not necessarily lead to compliance with recommended prevention practices.
y For the topic of water, sanitation and hygiene, the results point to large knowledge gaps and the potential to improve practices within the target population. While a majority of the respondents were able to identify two critical moments for hand-washing—after going to the toilet (80 per cent) and before eating (75 per cent)—only a minority of the respondents reported washing their hands before feeding their child, before breastfeeding or after going to the toilet with their child. Over one third (38 per cent) of all women were unable to correctly identify any cause of diarrhoea, and 51 per cent of the respondents never treat their drinking water.

International Policy Centre for Inclusive Growth 7
A comparison of the results in the three intervention groups (health committees and radio; radio only; and comparison) revealed that there are statistically significant differences2 between the groups for a number of variables. The impact evaluation will, therefore, need to draw on statistical methods to balance the differences between these groups and assess the impact of the intervention without over- or underestimating the impact due to group differences. One option is to use propensity score matching, a statistical technique to ‘match’ similar individuals to each other in a way to create an appropriate counterfactual for each treated individual. Another option is the use of a difference-in-difference methodology; this method yields consistent results even if treatment and comparison groups feature differences at baseline, as long as both groups follow ‘parallel trends’.
Data quality and authenticity checks were performed with the collected baseline data. These checks yielded encouraging results. The data quality and consistency is satisfactory for the majority of variables (325 out of 350). Data quality and/or consistency issues were only found in 7 per cent of all variables. Concerns emerged with regards to the anthropometric measures, where 29 per cent of the observations for weight and 53 per cent of the observations for height were outside the range of plausible values for the age group defined by the WHO. Most likely the impact evaluation will not draw on these variables and put a stronger focus on changes to knowledge, attitudes and practices, as well as on self-reported health measures, which were recorded to a high standard. Moreover, a number of checks were performed to assess the authenticity of the baseline data (statistical checks as well as back-checks in the field). Although the statistical tests indicated an exceptionally high number of interviews per day for some of the enumerators and a low level of variability in the data, which can both be an indication of data authenticity problems, the back-checks in the field (re-interviews of a subsample of households by senior enumerators with the aim of detecting cases of data falsification) confirmed the authenticity of the data collected. For the endline survey, it is recommended to work with an external data collection firm, to avoid any conflicts of interest during the data collection.
Lastly, it is important to bear in mind that this survey is not intended to be representative of the population of Manica province, nor of the specific districts that were sampled. The sample is representative of the target population of the SBCC project in treatment areas, as well as potential SBCC beneficiaries in the comparison areas.
1 INTRODUCTIONThe country office of the World Food Programme (WFP) in Mozambique is currently implementing a social and behaviour change communication (SBCC) project in Manica province. The SBCC intervention aims at reducing child malnutrition and mortality by promoting beneficial health and nutrition practices in four areas:
y maternal health and nutrition;
y infant and young child feeding;
y malaria prevention; and
y water, sanitation and hygiene (WASH).

Working Paper8
The SBCC project is part of an initiative funded by the European Union to contribute to the achievement of Millennium Development Goal 1c: “Halve the proportion of people who suffer from hunger”.
This baseline report has been elaborated within the impact evaluation of the SBCC project and describes key socio-economic, health and nutrition indicators at baseline. The report is structured as follows: Section 1 introduces the context of Mozambique and the general characteristics of the SBCC project in Manica. Section 2 states the specific objectives and methods of the baseline survey. In Section 3, some of the main results from the survey are presented, with the aim of describing the current situation of the respective treatment groups, and Section 4 summarises the baseline findings.
1.1 OBJECTIVES OF THE BASELINE REPORT
The objective of this baseline report is to describe the socio-economic situation of potential beneficiaries of the SBCC project and comparison households in Manica province before the start of the intervention. Specifically, the report will present some of the main findings from the baseline survey carried out in the area. The findings establish a benchmark against which the results from the endline survey will be measured to assess the impact of the intervention.
Since the SBCC intervention is not primarily a research project, but an intervention aimed at improving the situation of maternal and child health and nutrition in the selected districts, the survey results are also intended to inform the programme’s implementation and eventually contribute to the optimisation of implementation details—for example, by establishing priority areas for the project—i.e. identifying topics on which awareness is lower and that need enhanced focus.
1.2 MOZAMBICAN CONTEXT
Mozambique remains one of the poorest countries in the world, with a per capita income of USD529 in 2016 (World Bank 2017), ranking 181st out of 188 countries in the 2015 Human Development Index (HDI: 0.418).3 In Mozambique, 68.3 per cent of the population live in rural areas, and 80 per cent of the labour force work in the agricultural sector (FAO 2017). Despite accelerated economic growth and improvements in education, health and nutrition during recent years, 54 per cent of the population remain below the national poverty line, 63 per cent of rural children live in absolute poverty, 34 per cent of households are food insecure and experience perpetual hunger, and 43 per cent of children under 5 are stunted (Republic of Mozambique 2014). Lack of access to adequate food, coupled with a high incidence of infectious diseases (malaria, diarrhoea, upper-respiratory infections, sexually transmitted infections and parasitic infestation) and limited access to primary health care services for most of the population, continues to result in a high prevalence of undernutrition and micro-nutrient deficiencies.
Formative research in Manica conducted by WFP before implementation of the project illustrated a generally low level of knowledge about topics relevant to child health and nutrition. It also found that health and nutrition practices often fail to follow medical recommendations (WFP 2015).

International Policy Centre for Inclusive Growth 9
1.3 THE SBCC PROGRAMME IN MANICA
Programme characteristics
The overall goal of the SBCC intervention in Manica is to improve child health and nutrition by increasing awareness of good practices in four main areas: 1) maternal care and nutrition; 2) malaria prevention; 3) WASH; and 4) infant and young child feeding. These four areas have been specifically selected because of their potential influence on the two main causes of stunting: inadequate dietary intake and infection/disease during the first 1000 days of life (the main diseases being malaria and diarrhoea/parasitic infection/environmental enteropathy).
The project builds on two components: i) interpersonal communication, consisting of training community health committee members who in turn train community members, and ii) mass media communication, consisting of short-duration radio broadcasts. By the end of the project implementation, the interpersonal communication component is expected to reach 44,640 beneficiaries (i.e. 14,400 community members every 6 months plus 1440 health committee members), and the radio component is estimated to reach 162,000 women and 217,000 men.
The project is implemented with three treatment intensities, as illustrated in Figure 1:
A. interpersonal training and mass media communication (districts of Báruè,4 Guro, Machaze, Mossurize and Sussundenga);
B. mass media communication only (districts of Tambara and Manica); and
C. a comparison group, with no intervention at all (districts of Macossa and Gondola).
FIGURE 1Districts of Manica province by treatment status
Legend:
Treatment area A: radio spots and community health workers
Treatment area B: radio only
Comparison area (C)
Source: Authors’ elaboration.

Working Paper10
Stakeholders
The SBCC programme is part of the larger programme ‘Support to Accelerate Progress towards MDG1c in Mozambique—WFP Sub-Programme’, funded by the European Union and implemented by WFP Mozambique. The project also intends to contribute to the realisation of the following Sustainable Development Goals (SDGs): SDG2 (zero hunger), SDG3 (good health and well-being), SDG6 (clean water and sanitation) and SDG 17 (partnership for the Goals). Given the SBCC project’s multi-branched approach, its implementation requires a joint effort by several national and international stakeholders:
y WFP: the implementing agency of the SBCC programme, responsible for management-related endeavours, the development of training materials for the interpersonal component, and implementation activities, while also offering capacity-building support and guidance to the different partners;
y Development Media International (DMI): international technical non-governmental organisation that manages capacity-building of community radio stations for producing and editing the radio broadcasts with SBCC content;
y Ministry of Health of Mozambique: technical support and counselling on the development of training materials to be used by the community health committees;
y national/provincial institutions (UN Volunteers, SDSMAS, ANDA): provide support, coordination and monitoring of the activities developed in the field, and responsible for providing training on good nutrition and health practices to the health committees in the different communities; and
y International Policy Centre for Inclusive Growth (IPC-IG): provides technical guidance for project implementation and leads the monitoring and evaluation activities.
1.4 IMPACT EVALUATION DESIGN
The programme’s impact evaluation will assess to what extent the programme has improved health and nutrition outcomes among children in Manica province by changing behaviours and attitudes with regards to health and nutrition practices. The following research questions were developed to guide the evaluation:5
y Was the SBCC intervention effective in improving knowledge, attitudes and practices in the four priority areas of the intervention?
y Did the knowledge, attitudes and practices acquired by the beneficiaries of the SBCC intervention lead to better health, nutrition and sanitary outcomes among children?
y Is the joint provision of health and nutrition information through radio spots and health committees more effective in improving health and nutrition behaviours and outcomes than the provision of information through behaviourally inspired radio spots alone?
y In case the intervention only has a limited impact: Why did the SBCC beneficiaries not improve their knowledge, attitudes and practices in the four priority areas?

International Policy Centre for Inclusive Growth 11
The study of the SBCC project in Manica will draw on both quantitative and qualitative methods to evaluate the outcomes and impacts of the intervention. While the qualitative methods aim to quantify the effect of the intervention on its beneficiaries, the qualitative methods will help to investigate the pathways to impact, the beneficiaries’ perceptions of the programme’s effectiveness as well as possible unexpected effects which were not included in the survey questionnaires.
For the quantitative study, it is important to compare the treated individuals to a group of comparable individuals who were not treated, the comparison group. If one were to only measure the difference in outcomes of the treated individuals before and after the intervention, one would not be able to differentiate changes which are attributable to SBCC from changes which happened due to other factors. A comparison group is crucial to help identify and rule out such external factors and provide unbiased estimates.
Randomised control trials are a useful tool for choosing the comparison group, as they use randomisation over the targeted individuals to select treated and control groups, to avoid the possibility of individuals in the control group systematically differing from the treatment group. Indeed, if one chooses to compare groups of individuals that are systematically different, the impact estimates might over- or underestimate the magnitude, since differences that are not accounted for might have a role in determining the outcomes. Nevertheless, the SBCC design and characteristics could not allow for a randomised control trial, given that treatment and comparison areas had already been identified before the start of the evaluation activities.
Two alternative impact evaluation methods—propensity score matching (PSM) and difference-in-differences (DD) estimations—can yield unbiased impact estimates in this context. DD aims to compare treatment and control groups both before and after the intervention. By assuming that both groups followed similar time trends in the absence of the treatment, DD would yield unbiased estimates even in the presence of significant differences across groups before the intervention. Nevertheless, the underlying ‘parallel trend assumption’ of DD is difficult to test. It might, therefore, make sense to use alternative approaches to balance potential differences between the groups at baseline. PSM6 ‘matches’ each individual in the treatment group to an individual in the control group with similar characteristics. Thus, a subsample from the total surveyed population is created comprising the most comparable individuals. The interviewees who cannot be matched are dropped from the sample, for which the PSM estimates only represent the matched subsample. Although this method reduces the potential biases, it may reduce the sample size, which might in turn reduce the power of the impact estimates. Hence, one can alternatively use the propensity scores to control for the systematic differences in a DD context. Notwithstanding, PSM provides a good counterfactual in the case that treatment and control areas are systematically different, as is often the case for non-experimental programme designs.
The impact evaluation of the SBCC campaign will most likely be based on a combination of DD and PSM methods. A decision on the exact research method will be made jointly by the WFP and the IPC-IG once both baseline and endline data are available. For the case of the differences found at baseline, the IPC-IG performed different PSM algorithms with the objective of finding a potential method to balance the groups. Appendix 2 provides the best results found after several tests of different algorithms using nearest-neighbour, radius and kernel matching. Each matching algorithm has a trade-off: in our case the results suggest

Working Paper12
that for treatment group A, the sample is better balanced by the kernel algorithm, where all but one variable managed to be balanced, while radius matching achieves a larger common support, with 813 observations versus 556 of the kernel. For the case of treatment group B, nearest-neighbour matching provided the best balance, again with all but one variable passing the difference in means test, while radius matching yielded the largest common support of 792 observations, versus 720 in nearest neighbour.
Qualitative methods will be used to complement and explain the quantitative findings of the SBCC impact evaluation. Focus group discussions with purposively selected individuals from all three treatments groups will be conducted at the end of implementation of the programme, after the endline survey, to further investigate changes in knowledge, attitudes and practices among beneficiaries, perceived impacts on child health and nutrition, and pathways of impact.
2 THE BASELINE SURVEY
2.1 BASELINE DATA COLLECTION
The SBCC baseline survey was carried out between December 2016 and March 2017. The quantitative endline survey data collection is scheduled to take place from December 2017 to February 2018, so that the impact evaluation can be finalised by April 2018.
Although the data collection for both the baseline and the endline surveys is the responsibility of the WFP, the IPC-IG assisted in the design of the evaluation, including the sampling techniques and the survey used. A team of 22 enumerators conducted the data collection for the baseline survey. Seven of them are staff members or UN Volunteers working for the WFP, seven are staff members of the non-governmental organisation Associação Nacional para o Desenvolvimento Sustentável (ANDA) based in Manica, and eight are staff members of the Serviços Distritais de Sáude da Mulher e Acção Social (SDSMAS) of the districts of Guro, Báruè, Sussundenga, Mossurize and Machaze.
A total of 1380 surveys were carried out: 478 in group A (both interpersonal and mass media components), 395 in group B (only the mass media component), and 507 in group C (control group). Given the nature of the SBCC intervention, the population of interest for the impact evaluation comprises pregnant women, young mothers and their children. The sample inclusion criteria were defined as follows:
y being female;
y being aged 18–49;
y being pregnant and/or having a child under the age of 2; and
y providing informed consent to participate in the study.
The main questionnaire of the impact evaluation was administered to these women using a tablet-based application. The outcomes at the level of the child will be assessed indirectly, through the questionnaire that is administrated to the mothers. A small number of questions in the questionnaire required the enumerators to observe the behaviour of the

International Policy Centre for Inclusive Growth 13
children and take their anthropometric measures (height and weight). Moreover, a small sub-questionnaire was administrated to the husbands of the women interviewed, to investigate possible gender-specific impacts.
While the interviewees in area A were sampled from the lists of prospective beneficiaries of the interpersonal component of the SBCC intervention,7 the sampling in areas B and C was based on non-probabilistic sampling methods.8 Women who did not meet the sample inclusion criteria or any individual who chose not to consent to participation in the survey were excluded. In areas B and C, women with close family ties to an already selected interviewee were excluded, to diminish potential biases of correlated observations. The district of Báruè, which was affected by a political and military conflict at the time of the baseline survey, was excluded from the survey activities.
The survey questionnaire was structured as follows:
1. Introductory questions on general household characteristics (e.g. geographic location, number and age of children, marital status of the women interviewed)
2. Questions on the socio-economic characteristics of the household. These variables are needed to identify the level of homogeneity across participants and thus serve as a basis for the PSM
3. Questions on knowledge, attitudes and practices on the four priority areas of the intervention:
y maternal care and nutrition
y malaria prevention
y WASH
y infant and young child feeding
4. Cross-cutting outcomes on the development of the youngest child (including weight and height of the children, questions on the parents’ self-assessment of the child’s cognitive development, as well as a part where the enumerator provides an assessment of easily observable characteristics of child development—e.g. ability to sit unaided)
5. Questions on general habits and attitudes. These questions can help to find associations between certain personality traits (e.g. risk adversity, impatience) and the impact of the intervention
6. A small sub-questionnaire to be administered to the husbands of the women interviewed. The questions are similar to those asked in section 3 of the questionnaire. The data will be the baseline to investigate whether the intervention’s impacts differed between men and women.
2.2 DATA QUALITY
Before the content-related analysis of the baseline data, several data quality checks were performed.9 The checks are intended to detect implausible values and inconsistencies and irregularities in the data, to avoid the subsequent analysis of the data being biased by imprecisely recorded values.

Working Paper14
TABLE 1Overview of problematic variables and remarks
Code Question Remarks
i19_1 Sex of youngest child Missing
i20 Languages spoken Inconsistencies in languages frequently spoken vs. language of the interview
i28 Listenership to radio Only 88 individuals answered the question, even though 384 have a radio at home, and even more have access outside their homes
s04_0 Money available for food per week 80 per cent answered they do not know, and 20 per cent did not want to answer, in the following question, however, all interviewees gave an exact amount of money spent
s04 Amount of money spent on food 28 per cent spent 1 meticais, while 26 per cent spent 0
s16 Number of persons living in the household
2 households with 51 persons, 1 with 65
mo1 News about malaria Inconsistency with follow-up question: 19 were able to name a source of news about malaria, even though they stated they had not heard of malaria
mo7 Mosquito nets 10 respondents stated they slept under a mosquito net, even though in the previous question they said they did not have one
w01 Diarrhoea incidence 32 women could define the duration of the child’s diarrhoea, even though they stated it did not have diarrhoea
c04 With how many months did the child consume other liquids
This question was only directed towards women with a child older than 6 months, nevertheless 275 women answered this question even though the child is not older than 6 months
n01 Pre-natal examination 84 women said they went to one and 44 went to two pre-natal examinations, even though in the previous question they said they did not attend any pre-natal examination
o1 Height 24 per cent implausible values (as little as 1 cm, as big as 142 cm). Moreover, 130 women who said they did not have a child under 2 answered the question
o2 Weight 7 per cent implausible values (as little as 1 g, as big as 19.3 kg). The question was asked in grammes, and seemingly reported in kilos in 86 per cent of the cases. Everyone answered this question, including women who said they did not have child under 2
o4 Child makes sounds with mouth/tries to speak
Everyone answered, even though the question was only directed towards women with a child older than 1 year
o5 Child speaks single words Same as o4
g3 Hours walked per day 57 per cent said they did not know, while 7 per cent of the interviewees stated they walked more than 24 hours per day
h01, h02, h08 Questions for husbands High percentage of ‘don’t know’ answers (40–50 per cent)
Source: Authors’ elaboration.
International Policy Centre for Inclusive Growth 15
Before the start of the data collection process, it was ensured that all enumerators collecting data for the baseline survey had a background in health and/or social development and detailed knowledge of the local circumstances in Manica province, spoke the local languages and underwent training in impact evaluation methods, data collection and research ethics. Fifteen of the 22 enumerators participated in training led by the IPC-IG between 21 and 26 October 2016 in Chimoio, while the other 7 received similar training from WFP staff.10
Subsequent analysis indicated that the data collected generally meet high data quality standards. Only for a minority of variables (approximately 25 out of 350) have concerns about the quality and reliability of data emerged. Table 1 gives an overview of the problematic variables. In the case of five variables, a very high proportion (between 40 and 80 per cent) of interviewees refused to answer or selected the ‘don’t know’ answer, which makes the information hard to interpret in the subsequent analysis. In the case of the sex of the child, information is completely missing, even though this variable would be very important in the analysis of the data.
For the case of the anthropometric variables, the main concern was that the answers might have been recorded in different measurement units. Indeed, the enumerators were asked to enter the height and weight of the youngest child in centimetres and grammes, respectively. Nevertheless, the majority of the weight values seemed to be expressed in kilos, as 86 per cent were lower than 20. When converting such values into grammes, we find that 73 per cent of children were inside a range of values of weight for age in accordance with World Health Organization (WHO) data.11 Note however, that the converted values were all integers, for which a loss on precision of the child’s weight is likely, given that enumerators probably rounded these. For the case of the children’s height, 30 per cent of observations were missing. Among the data available, 47 per cent of children were inside a range of height for age in accordance with WHO data. Therefore, only 33 per cent of the children in the study had plausible height values for their age.
In the case of eight variables, the concerns are due to contradictory answers to related questions. For example, in the case of pre-natal examinations, 84 of the women who first stated they had not attended any pre-natal examinations claimed to have attended one or two when asked about the exact number of pre-natal examinations. These inconsistencies might have been produced by an erroneous display of follow-up questions in the questionnaire. The follow-up of the exact number of pre-natal visits was not supposed to be displayed if the interviewee stated that none had been attended.
One of the most recurrent discrepancies was identified in the case of the languages spoken versus the language of the interview, where in some cases people stated that they did not speak the language in which the interview was conducted. Although this could be explained by the fact that one can have a passive understanding of a language without actively speaking it, this could also raise concerns over the reliability of the corresponding answers.
Overall, an initial analysis of the baseline data confirmed high data quality for most of the survey questions. Only single indicators such as the weekly expenditure on food and, in particular, the anthropometric measures included a large number of inconsistent and/or implausible values. Since only around 7 per cent of the variables are questionable, data quality issues are not expected to have a major impact on the feasibility and validity of the SBCC impact evaluation.

Working Paper16
2.3 DATA AUTHENTICITY
In addition to assessing the data quality, the IPC-IG team also took measures to evaluate the authenticity of the data collected, to detect possible cases of data falsification/fabrication. The statistical methods applied and the respective results are summarised below. Additionally, the WFP performed back-checks in agreement with the IPC-IG, through which approximately 5 per cent of the sampled households were re-interviewed to confirm that the previously collected information was correct. The results of these back-checks are also described below.
a) Number of interviews conducted per enumerator
Given the length of the questionnaire, each enumerator was expected to complete around 10 interviews per day, depending on technical (or other) conditions in the field (e.g. battery life, climate, road conditions). Nonetheless, some enumerators managed to collect over 20 interviews in one day, in some cases even over 30, which might be an indication of data falsification. An additional observation is that for six enumerators (among them the two enumerators who collected the most interviews) GPS coordinates are missing for all interviews.
The back-checks performed to ensure the authenticity of the data (see paragraph d) below) showed that the answers are indeed authentic. One potential explanation for the high daily numbers could be that enumerators decided to perform the interviews on paper and enter them later into the tablets, resulting in a high number of interviews entered into the tablet in one day. It would be worth asking the enumerators whether this actually happened.
b) Comparison of data collected by different enumerators
To ensure that each enumerator had collected real, authentic data, the IPC-IG additionally compared selected data characteristics of numeric variables in the subsample collected by the single enumerators with the characteristics in the entire sample. If one subsample displays a systematically higher/lower mean value and a lower variation in the answers, this can suggest fabricated or invented data (Blasius and Thiessen 2012; Porras and English 2015; Menold et al. 2013), as when fabricating data, enumerators typically tend to give more homogenous answers to avoid detection. Regarding the mean values, there are some examples of the mean values of the answers collected by one enumerator being noticeably lower than the mean value of the entire sample. Furthermore, for the case of three enumerators the standard deviation (e.g. the dispersion or variation of the values) is lower than average for 60 per cent of the numeric variables. Even though suspicious, this low variation could be alternatively explained by the fact that these enumerators collected data with a very homogeneous population structure.
c) Duplicates analysis
Just as having very low variation in the data can suggest fabrication of the data, so can having a high number of identical answer combinations in a data set (Kuriakose and Robbins 2015), as another way of falsifying data is to copy most of another interviewee’s answers. To check for the presence of near duplicates—for example, individuals who share a high number of responses with others—the maximum percentage of answers that one individual shares with any other individual in the data set was calculated.12 In the literature (ibid.), a percentage match of more than 85 per cent is linked to data fabrication. For this analysis, 48 variables were

International Policy Centre for Inclusive Growth 17
used, and the percentage of shared answers ranged from 40 to 100 per cent, with most of the individuals sharing at least 50 per cent of the answers with another individual.
Again, there are two enumerators who display an extraordinarily high percentage of identical answers among different interviewees. In the case of one enumerator, 40 per cent of the individuals share more than 85 per cent of the answers with other individuals. Just as in the case of the low variance, this could be possibly explained by low inequality and a homogeneous population structure in the areas surveyed.
d) Back-checks of a selected subsample
To corroborate the baseline data, a sample of 52 individuals contained in the data set was randomly selected and re-interviewed, with special interest in enumerators who had displayed suspicious behaviour in the data authenticity checks. During these re-interviews, households were asked a reduced catalogue of questions, consisting of the names of the household members and the socio-economic characteristics. These back-checks were implemented by the WFP and further revised by the IPC-IG. The WFP ensured that the back-check interviews were conducted by particularly experienced and trustworthy staff members.
It was reassuring that most back-checks allowed the findings of the baseline survey to be corroborated: 47 of the 52 respondents confirmed the information they had given in the initial interviews, which reaffirms the credibility of the data. For the other five respondents, two gave different answers from before, and three refused to answer questions when re-contacted.
e) Final comments
The results of the statistical tests gave rise to concerns about the authenticity of the data. It is particularly worth mentioning that two enumerators are affected by all four suspicious characteristics—namely, they collected the highest number of interviews per day, the variables display a lower variation than in the case of other enumerators, their observations share a high percentage of identical answers, and the GPS coordinates are missing for all their interviews.
Nevertheless, the back-checks through which 5 per cent of the sample13 were re-interviewed were reassuring and provided evidence that the data collected are indeed authentic. One might, therefore, conclude that the statistical tests have erroneously pointed to falsified data. The low variation of answers for single enumerators and the high percentage of identical answer combinations could, for example, be explained by other factors, such as a particularly homogeneous population in the areas which were the responsibility of single enumerators. This in turn could be a consequence of the non-probabilistic sampling methods on which the study was based (see Appendix 2). Issues which remain questionable are the high number of interviews per day and the missing GPS coordinates.
All in all, given that the back-checks confirmed the authenticity of data in almost all cases, we conclude that there is no convincing evidence for data falsification; however, it will be important to carefully monitor data authenticity issues throughout the study. The endline data will allow the research team to perform additional statistical tests, comparing critical patterns in the baseline and the endline data, to gain more certainty about the authenticity of the baseline data.

Working Paper18
3 RESULTS
This chapter presents the main findings from the baseline survey, disaggregated by treatment groups: A (interpersonal and mass media), B (mass media only) and C (control group).
As described in Chapter 2.1, the inclusion criteria for the study were to be female, aged 18–49 and being pregnant and/or having a child under the age of 2. While the majority of the respondents fulfilled these criteria, it should be noted that there were some exceptions. According to the data, 8 per cent of the women were younger than 18 years old (of which 3.4 per cent were 17 and thus borderline cases, and the others potentially wrong dates), although enumerators had been instructed to strictly follow the sample inclusion criteria and not interview any person under the age of 18. However, only 49 per cent of the sample provided their age. Moreover, seven interviewees stated that they were neither pregnant nor had children under 2. Among the respondents, 22 per cent were pregnant, and 81 per cent had children under 2. Furthermore, 4 per cent of the women with children under 2 were also pregnant.
3.1 HOUSEHOLD AND SOCIO-ECONOMIC CHARACTERISTICS
Number of children
On average, the women interviewed have three children; however, the most common number of children is one or two, as seen in Figure 2. In the control group, a higher percentage of women were pregnant for the first time compared to the other groups, whereas women in group B on average have more children. On the same line, a lower percentage of women have children under the age of 2 in the comparison group (70 per cent) than in treatment group B (93 per cent) or treatment group C (82 per cent).
FIGURE 2Number of children
25%
20%
15%
10%
5%
0%0 1 2 3 4 5 6 7 8 9 10
TotalC B A
Source: Authors’ elaboration.

International Policy Centre for Inclusive Growth 19
Single mothers
In groups A and C, around 90 per cent of the women are married or living together with a man as if they were married, and 5 per cent are separated or divorced. In group B, only around half of the women are married or living together with a man as if they were married, whereas the other 50 per cent have never married. Moreover, in 17 per cent of the cases, the survey for the women’s husband/partner was not implemented because they were absent or there was no partner in the household.
Interview language
The three most common interview languages were Sena, Chiute and Ndau, which were all selected by just over 20 per cent. Portuguese was selected by 13 per cent of the respondents. In area A, more than half of the respondents chose to carry out the interview in Ndau. A quarter selected Chiute, 10 per cent chose Portuguese, and a further 10 per cent Chitonga. Sena was the preferred language for 80 per cent of group B respondents, whereas 15 per cent selected Chimanik. In the control group, 40 per cent chose Chiute, 25 per cent wanted to be interviewed in Portuguese, and 25 per cent in Chibarue.
FIGURE 3Interview language
100%
90%
80%
70%
60%
50%
40%
30%
20%
10%
0%
C B A
Portuguese Chitonga Chibarue Sena Nhungue Chimanhika Chiute Ndau Chona
Source: Authors’ elaboration.
Literacy
The general level of literacy among the women is 38 per cent. Group A has the highest level of literacy, at almost 60 per cent, while only 30 per cent of the interviewees in group C and 20 per cent in group B know how to read and write. Over two thirds (69 per cent) of the husbands of the women interviewed are literate.
Working Paper20
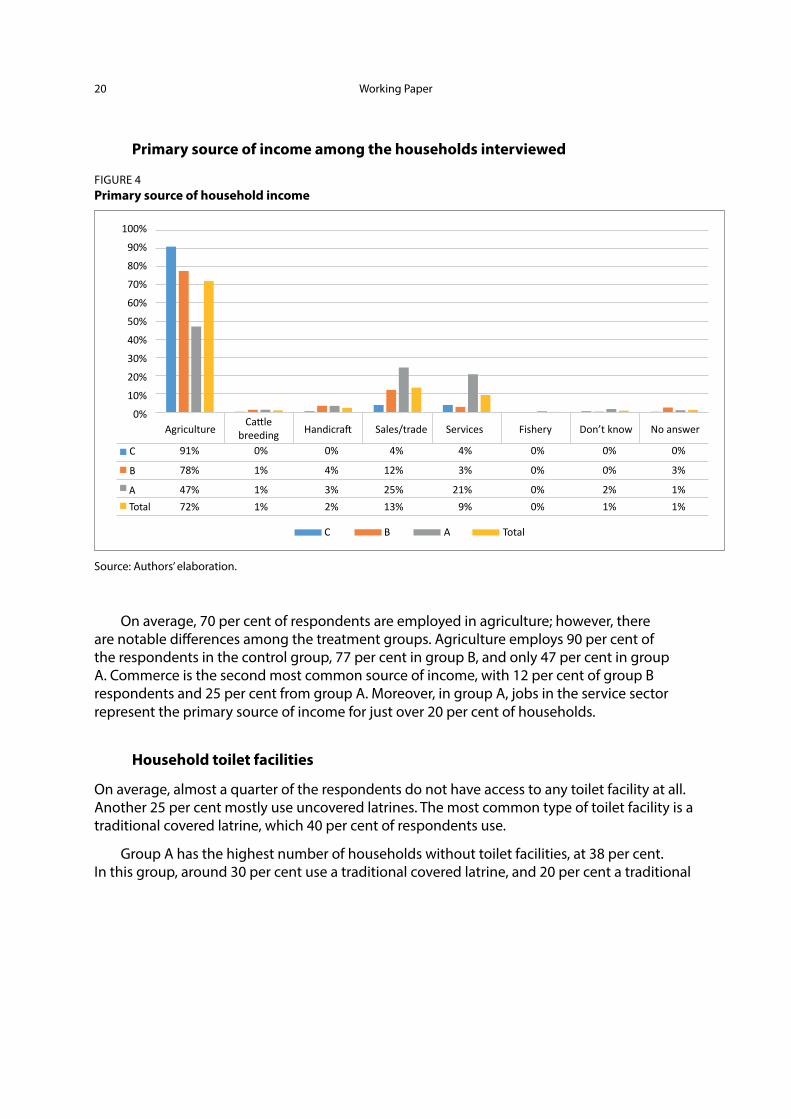
Primary source of income among the households interviewed
FIGURE 4Primary source of household income
100%
90%
80%
70%
60%
50%
40%
30%
20%
10%
0%
C
B
ATotal
91%
78%
47%72%
0%
1%
1%1%
0%
4%
3%2%
4%
12%
25%13%
4%
3%
21%9%
0%
0%
0%0%
0%
0%
2%1%
0%
3%
1%1%
Agriculture Handicraft Sales/trade Services Fishery Don’t know No answerCattle
breeding
C B A Total
Source: Authors’ elaboration.
On average, 70 per cent of respondents are employed in agriculture; however, there are notable differences among the treatment groups. Agriculture employs 90 per cent of the respondents in the control group, 77 per cent in group B, and only 47 per cent in group A. Commerce is the second most common source of income, with 12 per cent of group B respondents and 25 per cent from group A. Moreover, in group A, jobs in the service sector represent the primary source of income for just over 20 per cent of households.
Household toilet facilities
On average, almost a quarter of the respondents do not have access to any toilet facility at all. Another 25 per cent mostly use uncovered latrines. The most common type of toilet facility is a traditional covered latrine, which 40 per cent of respondents use.
Group A has the highest number of households without toilet facilities, at 38 per cent. In this group, around 30 per cent use a traditional covered latrine, and 20 per cent a traditional

International Policy Centre for Inclusive Growth 21
uncovered latrine. In group B, 21 per cent lack toilet facilities, while the traditional covered latrine (at 63 per cent) is the most common type. The lack of toilet facilities is lowest in the control group (12 per cent). In this group, a traditional uncovered latrine (47 per cent) is the most common type, followed by a traditional covered latrine (31 per cent).
FIGURE 5Household toilet facilities
Toilet/sewage
Latrine/ventilated
No toilet/latrine
Toilet/septic tank
Latrine/traditional covered
Toilet/trench
Latrine/traditional uncovered
No answer
(Average for all groups)
1%
5%
1%0%2%
24%
26%
41%
Source: Authors’ elaboration.
3.2 MEDIA-RELATED INDICATORS
Household radio access (home/work/outside)
The majority of the respondents (60 per cent of the entire sample) have no access to radio at all. Around 28 per cent of the entire sample have access to radio at home, and 29 per cent outside the home (note that these two possibilities are not mutually exclusive, and some respondents may have access to radio both at home and elsewhere). Almost none of the respondents have access to radio at work.

Working Paper22
FIGURE 6Access to radio
90%
80%
70%
60%
50%
40%
30%
20%
10%
0%
No access at all Home access Access outside of home
A (2) B (1) C (0)
42% 40%48%
55%
30% 33%
78%
16%10%
Source: Authors’ elaboration.
There are pronounced differences between the treatment groups and the control group. The control group displays the highest share of people without access to radio, while in group A only 40 per cent do not have access.
Access to mobile phoneIn the entire sample, only 28 per cent of the interviewees (383) have access to a mobile phone; 40 per cent of these (153) use it to listen to radio. Again, differences across groups are considerable. While in group C only 14 per cent have access to mobile phones, 23 per cent do in group B, and 46 per cent in group A.
Listening habitsOnly 88 respondents provided information about when they last listened to radio: 53 had listened to radio the day before the interview, 15 in the previous 7 days, and 18 more than 7 days before. The most commonly listened radio station is Radio Comunitario Chitobe, followed by Radio Comunitario Chipungumbira, Radio Sussundenga and Radio Comunitario Nhacolo.
Nearly a quarter (23 per cent) of the respondents who provided information about their listening habits stated that they listen to the radio on average around 1 hour per day, 26 per cent around 2 hours per day, while around 16 per cent listen to radio on average less than one hour daily.
Access to television
Only 13 per cent of the entire sample have a television at home (9 per cent in group C, 12 per cent in group B, and 17 per cent in group A).

International Policy Centre for Inclusive Growth 23
Source of information about malaria
When asked about where they last heard information about malaria, 5 per cent stated they heard about it on the radio, while less than 1 per cent of the respondents saw it on television. The most important source of information is a clinic/hospital or the health committee (Comite de Saude).
3.3 MATERNAL CARE AND NUTRITION
Attendance of pre-natal check-ups
On average, 78 per cent of the women had a pre-natal check-up during the first three months of their most recent pregnancy. Group A and the control group both had an attendance rate of around 90 per cent, whereas only 50 per cent of women in group B attended a pre-natal examination during the first three months.
It can be noted that 16–18 per cent of the women in both groups A and B mentioned pre-natal check-ups on their own initiative when asked about the most important components of pregnancy care, while fewer than 6 per cent of the control group mentioned this.
Choice of birth location (most recent birth)
Overall, most births took place at a health clinic (56 per cent) or, to a lesser extent, at a rural hospital (18 per cent). While groups A and C showed similar results, group B had a higher rate of home births (37 per cent).
FIGURE 7Birth location
70%
60%
50%
40%
30%
20%
10%
0%
C B A Total
At home Rural hospital Health centre/clinic Don’t know/don’tremember/no answer
3%
37%
14%
7%
20%16% 17%18%
39%
64% 63%
56%
11%6%
8% 8%
Source: Authors’ elaboration.

Working Paper24
Knowledge of specific care requirements during pregnancy
A large proportion of respondents did not know of any specific care measures which should be taken during pregnancy. Among those who did, getting enough rest, avoiding heavy work and enjoying regular and diverse meals were the three most frequently mentioned ways to take care when pregnant according to respondents in all three groups. Proper alimentation was specifically highlighted by respondents in the control group.
FIGURE 8Pregnancy care
Source: Authors’ elaboration.
FIGURE 9Importance of an extra daily meal
50%
45%
40%
35%
30%
25%
20%
15%
10%
5%
0%
C B A Total
Very important Important Not so important Not at all important Don’t know
Source: Authors’ elaboration.

International Policy Centre for Inclusive Growth 25
Overall, two thirds of the respondents viewed it as important or very important for a pregnant woman to eat an additional snack or meal every day.
3.4 MALARIA PREVENTION
Knowledge of sources of malaria transmission
FIGURE 10Knowledge of sources of malaria transmission
100%90%80%70%60%50%40%30%20%10%
0%
Mosquito bite Don’t know
91%
90%
54%
42%
75%
18%
75%
21%
C B A Total
Source: Authors’ elaboration.
When asked an open question about malaria transmission, an average of three quarters of women correctly stated on their own initiative that malaria can be transmitted via mosquito bites. This knowledge was higher in groups A (75 per cent) and C (91 per cent). In group B, only 54 per cent mentioned mosquito bites as a source of malaria transmission, and as many as 42 per cent stated that they did not know how malaria is transmitted. A number of interviewees also listed incorrect answers on their own initiative, such as weather changes (2 per cent), getting wet in the rain (6 per cent), eating cold, spoiled or dirty food (7 per cent), drinking dirty water (7 per cent) or witchcraft (0.4 per cent).
Prevalence and usage of mosquito nets in households
Overall, close to 70 per cent of the households have a mosquito net; however, the proportion is again higher in groups A (85 per cent) and C (65 per cent), while fewer respondents in group B (53 per cent) have a net. These results point to a correlation between this indicator and the previous one; indeed, more than 72 per cent of those who know that malaria is transmitted by mosquitoes also own a mosquito net.
Mosquito net usage, however, is more even among the groups. On average, 57 per cent of the interviewees answered that their youngest child had slept under a mosquito net the previous night, 33 per cent stated that they had not, and 10 per cent did not know or preferred not to answer. With regards to mosquito net usage during pregnancy, 50 per cent

Working Paper26
of respondents claimed that they always slept under a mosquito net during their previous pregnancy, 18 per cent that they sometimes did, and 28 per cent that they did not.
FIGURE 11Usage of mosquito nets
No Always Sometimes Don’t know/No answer
No Yes Don’t know/No answer
C B A Total
C B A Total
Respondent slep under mosquito net during last pregnancy
Youngest child slept under mosquito net the previous night
70%
60%
50%
40%
30%
20%
10%
0%
60%
50%
40%
30%
20%
10%
0%
34%38%
49%
35%
55%
10%
46% 48%
66%
22%
7%12%
34%
57%
10%
43%
57%
16% 14% 13%
24%
7%
28%
50%
18%
4%5%1%
Source: Authors’ elaboration.
International Policy Centre for Inclusive Growth 27
Knowledge of malaria symptoms
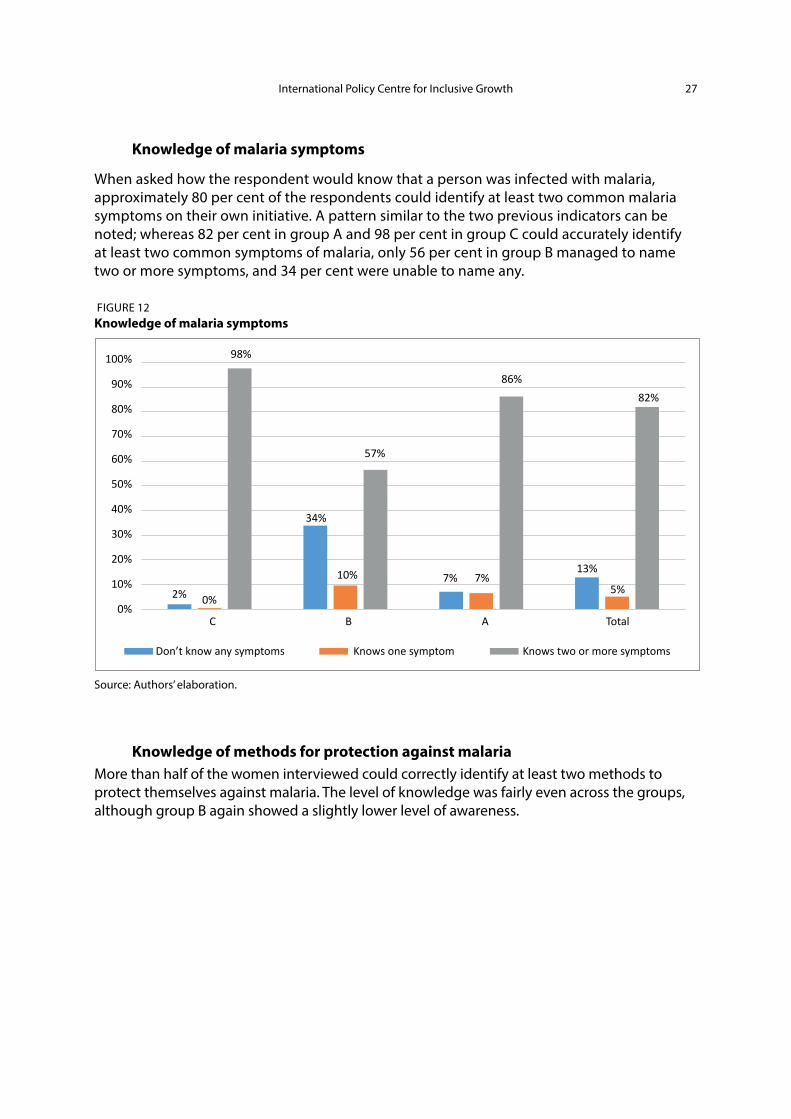
When asked how the respondent would know that a person was infected with malaria, approximately 80 per cent of the respondents could identify at least two common malaria symptoms on their own initiative. A pattern similar to the two previous indicators can be noted; whereas 82 per cent in group A and 98 per cent in group C could accurately identify at least two common symptoms of malaria, only 56 per cent in group B managed to name two or more symptoms, and 34 per cent were unable to name any.
FIGURE 12Knowledge of malaria symptoms
100%
90%
80%
70%
60%
50%
40%
30%
20%
10%
0%0%2%
98%
34%
57%
10% 7% 7%
86%
13%
5%
82%
Don’t know any symptoms Knows one symptom Knows two or more symptoms
C B A Total
Source: Authors’ elaboration.
Knowledge of methods for protection against malaria More than half of the women interviewed could correctly identify at least two methods to protect themselves against malaria. The level of knowledge was fairly even across the groups, although group B again showed a slightly lower level of awareness.

Working Paper28
FIGURE 13Knowledge of methods of protection against malaria
Don’t know any protection methods Knows one protection method Knows two or more protection methods
70%
60%
50%
40%
30%
20%
10%
0%C B A Total
15%
6%
27%
67%
37%
18%
46%
34%
51%
18%
27%
56%
Source: Authors’ elaboration.
Willingness of mothers to seek medical care in case of malaria symptoms
Approximately 90 per cent of the respondents in all three groups reported that they would take their youngest child to a hospital or public/private health centre in case of fever or other malaria-like symptoms.
3.5 WATER, SANITATION AND HYGIENE
Ability to identify crucial occasions for hand-washing
When asked an open question to list occasions when it is necessary to wash one’s hands, approximately 80 per cent of the women interviewed replied that it is important to wash their hands after going to the toilet (70 per cent in groups A and B and 96 per cent in the control group, group C).
The second most common answer was that hand-washing is important before eating. Consistently, more than 90 per cent in the control group (C) gave this answer, while lower percentages were found for group A (77 per cent) and group B (60 per cent). The third most common answer was hand-washing before preparing food or cooking, mentioned by 82 per cent of respondents from group C, 50 per cent from group A and 45 per cent from group B.

International Policy Centre for Inclusive Growth 29
Note that 12 per cent of women in group B did not know when to wash their hands, whereas this percentage is less than 3 per cent for groups A and C. Globally, the other answers that were less frequently mentioned were ‘when hands are dirty’ and ‘before breastfeeding’, mentioned by less than 20 per cent of respondents.
FIGURE 14Identified occasions to wash hands
100%90%80%70%60%50%40%30%20%10%
0%
0%C
B
A
4%
0%
10%
45%
21%
91%
60%
77%
11%
14%
22%
10%
15%
28%
0%
2%
3%
1%
12%
3%
82%
45%
50%
96%
69%
69%
Never
After going to the
bathroom
After cleaningthe child
Beforepreparing
food
Beforeeating
Beforebreast feeding
Whenhands are
dirtyOther
Doesn’tknow
Source: Authors’ elaboration.
Treating water before drinking or cooking
Only 16 per cent of the women interviewed reported that they always treat their water before drinking or cooking. Nineteen percent of them treat the water sometimes, while 51 per cent report never applying any treatment to water. The proportion of households never treating their drinking water is considerably higher in group C (74 per cent) than in groups B (50 per cent) and A (27 per cent).
It is also important to mention that nearly 85 per cent of individuals who answered that they never treat water before drinking or cooking mentioned at least one water treatment method. On the other hand, 80 per cent of those who chose not to answer said they did not know any water treatment methods.

Working Paper30
FIGURE 15Treatment of water before drinking or cooking
80%
70%
60%
50%
40%
30%
20%
10%
0%
74%
50% 51%
27%
13% 12%
23%16%
3% 5% 3% 4%9%
21%
29%
19%
1%
12%19%
10%
Never Always Most of the time Sometimes Doesn’t know
C B A Total
Source: Authors’ elaboration.
FIGURE 16Knowledge of methods to treat water
40%
35%
30%
25%
20%
15%
10%
0%2%
36%
31%
14%
30%
18%
Chlorine Boiling Bottle in the sun
Certeza(Sodium
hypochlorite solution)
Other Doesn’t knowany method
Source: Authors’ elaboration.
Percentage of women interviewed who dispose of their children’s stools correctly
More than 50 per cent of women dispose of their children’s stools correctly by either throwing them in the toilet or burying them, both methods that are considered safe. However, higher percentages are only found in groups A and C (57 per cent and 70 per cent, respectively),

International Policy Centre for Inclusive Growth 31
while this is only true for 28 per cent of women in group B. Throwing the stools in the toilet was the most frequent answer, accounting for the majority of individuals in groups A and C (45 per cent and 58 per cent, respectively). For group B this answer accounted for less than 20 per cent, matched by the unsafe practice of throwing stools in the trash, which was rarely mentioned by interviewees in the other groups.
FIGURE 17Stool disposal practices
45%40%35%30%25%20%15%10%
5%0%
Threw in
toile
t/rinse
dTh
rew in tr
ashTh
rew in hole/m
anure
Threw in
bushes/n
ature
Buried
Left it
Cleaned w
ith a
cloth
Others
Doesn’t w
ant t
o answ
er
42%
2%7% 8%
12%
1% 2%
22%
5%
Source: Authors’ elaboration.
Moreover, we observe that only 7 per cent of children defecate in the most hygienic place, in latrines or in a potty. There are also differences among the treatment groups in the most common places where children defecate: 47 per cent in the control group answered that children defecate on the ground near the respondent’s home, while 23 per cent in group B and 20 per cent in group A gave this answer. Nearly a quarter (23 per cent) of respondents in group B mentioned that children defecate on sheets or cloths, which was also the most common answer for group A (40 per cent). Note that almost a quarter of interviewees chose not to answer this question.
Percentage of women interviewed able to correctly identify at least one cause of diarrhoea
The majority of women were able to correctly identify at least one cause of diarrhoea among children, with only minor differences between the different treatment groups. The main reason mentioned by the interviewees was contaminated water, an answer given by 34 per cent of them, followed by dirty hands (27 per cent) and contaminated food (19 per cent).
Less than a quarter of the women interviewed answered that their youngest child had had diarrhoea in the previous 14 days, with 17 per cent for group A, 30 per cent for group B and 22 per cent for group C. At least 60 per cent of women in groups B and C knew at least one cause of diarrhoea, while this figure was only 40 per cent in treatment group A.

Working Paper32
FIGURE 18Women’s knowledge of causes of diarrhoea
45%
40%
35%
30%
25%
20%
15%
10%
5%
0%
Contaminate
d wate
r
Improper w
ater s
torage
Contaminate
d food
Defecate near
homeDirt
y han
dsBad
hygiene
Eating r
aw fo
odNot w
ashing f
ood
Contact w
ith other p
eopleBad
air/s
pirits
Others
Don’t know an
y cau
se
Source: Authors’ elaboration.
FIGURE 19Women’s knowledge of causes of diarrhoea (by treatment group)
70%
60%
50%
40%
30%
20%
10%
0%
Could not correctly identify a cause of diarrhoea Correctly identified a cause of diarrhoea
Group C Group B Group A Total
47 53
36
64
36
64
40
60
Source: Authors’ elaboration.

International Policy Centre for Inclusive Growth 33
3.6 INFANT AND YOUNG CHILD FEEDING
Exclusive breastfeeding during the infant’s first 6 months
FIGURE 20Women’s opinions on the nutritional value of breastmilk Does breastmilk provide enough nutrients to infants up to 6 months?
90%
80%
70%
60%
50%
40%
30%
20%
10%
0%2%
19%
8% 9%
88%
38%
61% 64%
7%1% 2%
10%
37%29%
24%
0%No Yes Other Don’t know
C B A Total
Source: Authors’ elaboration.
As illustrated in Figure 21, on average 60 per cent of the respondents think that infants should be exclusively breastfed during the first 6 months of life, and 64 per cent consider that breastmilk provides enough nutrients during this period (Figure 20).
FIGURE 21Women’s opinions on the duration of exclusive breastfeeding
90%80%70%60%50%40%30%20%10%
0%<4 months 4-5 months 6 months >6 months Don’t knowNo exclusive
breastfeeding
0%5%
2% 2% 1%7%
11%6% 2%
22%15%
12%
85%
38%
50%
60%
3% 2% 6%4%
9%
26%17% 17%
C B A Total
Source: Authors’ elaboration.

Working Paper34
FIGURE 22Age at which youngest child started receiving other liquids than breastmilk
90%80%70%60%50%40%30%20%10%
0%3-5 months 6-7 months 8-12 months Over a year Don’t knowLess than
3 months
5% 4% 3%1%6%
16%
32%
19%
87%
62%
4%9%
4% 5%1% 4% 4% 3% 1%
20%8%
5%
46%53%
C B A Total
Source: Authors’ elaboration.
In the control group (group C), the attitudes towards exclusive breastfeeding seem to be more positive than in treatment groups A and B, and exclusive breastfeeding up to 6 months of age is more widespread.
Breastfeeding practices are largely in line with these attitudes, and 62 per cent of the interviewees’ children started receiving breastmilk only after 6 months of age. Nearly a quarter (22 per cent) received breastmilk even before that age, while 8 per cent of the respondents did not remember, which points to the potential to further promote exclusive breastfeeding.
Dietary diversity of children 6 months old and above
To investigate the dietary diversity of children in Manica province, mothers were asked to report whether their child had consumed any food from 15 different food groups within a three-day recall period. For children under 6 months, breastmilk is the most frequently consumed food (70 per cent), followed by cereals (32 per cent) and vegetables (4 per cent). Children from 6 to 23 months mostly consumed cereals (70 per cent), dark green vegetables (17 per cent) and orange-coloured vegetables such as pumpkin, carrot or sweet potatoes (16 per cent).
To analyse the diversity of the diet, the individual dietary diversity score (IDDS) was calculated for children aged 6–23 months of age. Additionally, the minimum dietary diversity (MDD) (WHO 2008; 2010) and the food consumption scores (FCS)14 were computed, to compare the children of the women surveyed with international dietary thresholds. The food groups that comprise each of the scores calculated are shown in Table 2.

International Policy Centre for Inclusive Growth 35
TABLE 2Food groups used in dietary diversity indexes
Group IDDS and MDD Weight FCS Weight
1 Cereals, roots and tubers 1 Main staples 2
2 Legumes and nuts 1 Pulses 3
3 Milk and other dairy products, excluding breastmilk 1 Vegetables, includes leaves 1
4 Flesh foods (meat, fish, poultry and liver/organ meats) 1 Fruits 1
5 Eggs 1 Meat and fish 4
6 Vitamin-A rich fruits and vegetables 1 Milk and dairy products 4
7 Other fruits and vegetables 1 Sugar 0.5
8 Oil 0.5
9 Condiments 0
Source: Authors’ elaboration.
FIGURE 23Distribution of IDDS by treatment group
60
50
40
30
20
10
00 1 2 3 4 5 6
TotalC B A
Source: Authors’ elaboration.
It is important to note that to compute the IDDS and the MDD only six food groups were considered, as eggs were not included in the questionnaire. Figure 23 presents the distribution of the IDDS among children aged 6–23 months overall and by treatment area. Almost no children in any group achieved the highest score of 5–6 possible values.

Working Paper36
Moreover, children in group B appear to be highly concentrated in the lowest scores, achieving the lowest mean IDDS of 0.76, while children in group C are more uniformly distributed with a mean score of 2.09. Group A scored between these groups in terms of both distribution and mean, achieving a mean IDDS of 1.41.
To better assess the quality of diet, the MDD is used by classifying the IDDS according to a threshold. The WHO suggests that a qualified diet should comprise at least four food groups, for both breastfed and non-breastfed children. Consumption of foods from at least four food groups on the previous day would mean that in most populations the child had a high likelihood of consuming at least one animal-sourced food and at least one fruit or vegetable that day, in addition to a staple food (grain, root or tuber).
As summarised in Table 3, only 5 per cent of the children aged 6–23 months (i.e. 41 out of 788) achieved the MDD as defined by the WHO of at least four food groups. Although not directly comparable because breastmilk is not included in any of the food groups, a slightly higher proportion of children who do not consume breastmilk achieved the MDD, with the noticeable example of older children. Additionally, when comparing the different treatment groups, we find that group C has the highest proportion of children aged 6–23 months of age achieving an MDD (15 per cent), while in groups A and B almost no children reached this minimum score (3 per cent and 0 per cent, respectively).
TABLE 3Proportion of children under 24 months of age with an MDD
Children’s age MDD (with continuous breastfeeding) MDD (without breastfeeding)
MDD (6–23 months) 6% 6%
MDD (6–11 months) 7% 6%
MDD (12–17 months) 5% 5%
MDD (18–23 months) 5% 10%
MDD (24 months) 4% 24%
Source: Authors’ elaboration.
Alternatively, the FCS applies different weights to each of the food categories based on an interpretation of nutrient density—i.e. food quality in terms of caloric density, nutrient content, and actual quantities typically eaten. In that sense, the FCS attempts to give greater importance to foods considered to have greater nutrient density. The WFP (2008)15 suggests a classification of FCS values using standard thresholds for poor, borderline and acceptable diets.
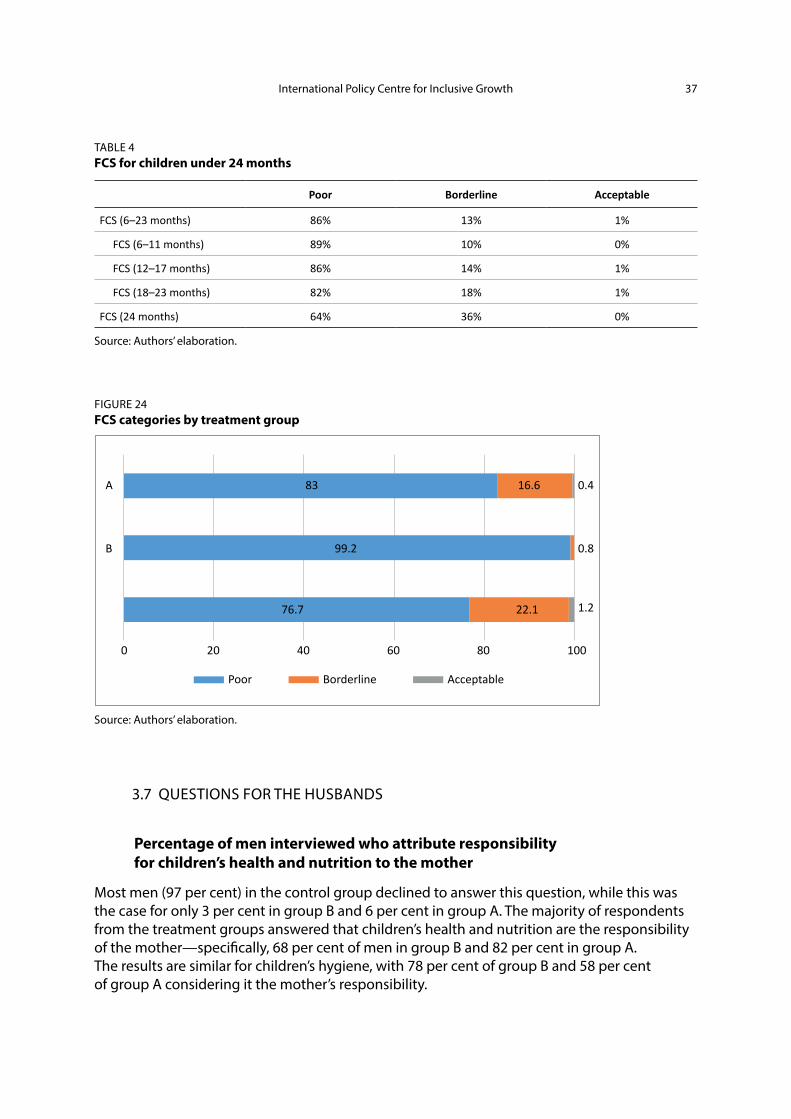
With these categories in mind, 86 per cent of children aged 6–23 months appear to have a poor diet, only 13 per cent have a borderline diet, and less than 1 per cent are considered acceptable. When comparing the different treatment groups, group B is the one with the lowest scores (99 per cent had a poor FCS), while group C appears to be relatively better off, followed by group A, with 22 per cent and 17 per cent of children, respectively, having a borderline diet. In all groups between 0 and 1 per cent of the children reached the acceptable dietary diversity levels.
International Policy Centre for Inclusive Growth 37
TABLE 4FCS for children under 24 months
Poor Borderline Acceptable
FCS (6–23 months) 86% 13% 1%
FCS (6–11 months) 89% 10% 0%
FCS (12–17 months) 86% 14% 1%
FCS (18–23 months) 82% 18% 1%
FCS (24 months) 64% 36% 0%
Source: Authors’ elaboration.
FIGURE 24FCS categories by treatment group
Poor Borderline Acceptable
0
76.7
99.2
83 16.6 0.4
0.8
1.222.1
6020 80 10040
B
A
Source: Authors’ elaboration.
3.7 QUESTIONS FOR THE HUSBANDS
Percentage of men interviewed who attribute responsibility for children’s health and nutrition to the mother
Most men (97 per cent) in the control group declined to answer this question, while this was the case for only 3 per cent in group B and 6 per cent in group A. The majority of respondents from the treatment groups answered that children’s health and nutrition are the responsibility of the mother—specifically, 68 per cent of men in group B and 82 per cent in group A. The results are similar for children’s hygiene, with 78 per cent of group B and 58 per cent of group A considering it the mother’s responsibility.

Working Paper38
Percentage of men interviewed able to correctly identify at least one cause of diarrhoea among children
For all groups, almost half of the men interviewed were able to identify at least one cause of diarrhoea. The most common answer in all groups was contaminated water, which was given by 20 per cent of men in the control group, 35 per cent in group B and 58 per cent in group A. Moreover, we can see from Figures 25 and 26 that the knowledge of causes of diarrhoea is quite similar between men and women and the different treatment groups.
FIGURE 25Knowledge of causes of diarrhoea (by treatment group)
80%
70%
60%
50%
40%
30%
20%
10%
0%
53% 54%
64% 64%
74%67%
62% 61%
Total
Men Women
C B A
Source: Authors’ elaboration.
FIGURE 26Knowledge of causes of diarrhoea
35% 34%
13% 12%16%
19%
8% 10%
28% 27%
6%9% 8% 9%
6% 7%
Contaminate
d wate
r
Improper w
ater s
torage
Contaminate
d food
Defecate near
home
Dirty h
ands
Bad hyg
iene
Eating r
aw fo
od
Don’t wash
food
Men Women
Source: Authors’ elaboration.

International Policy Centre for Inclusive Growth 39
Pregnancy care
A high percentage of men were unable to identify any extra care measures necessary for pregnant women. This is especially true for the control group (57 per cent), followed by 39 per cent in group B but only 10 per cent in group A. Nevertheless, almost no interviewees answered that they did not think any extra care should be taken when women are pregnant, suggesting that they acknowledge that pregnancy requires special attention.
For both treatment groups A and B, the most frequent answer was that pregnant women should get more rest, with 53 per cent and 27 per cent, respectively, mentioning this. For group A, avoiding heavy work was mentioned by 47 per cent of men. Group C’s most common answer (38 per cent), eating diversified and nutritious food, was also mentioned by more than 19 per cent in group B and 36 per cent in group A. Eating regularly was often mentioned by respondents in the treatment groups (27 per cent in A and 17 per cent in B), yet not in the control group (2 per cent).
FIGURE 27Extra care considered important for pregnant women by men
35%
30%
25%
20%
15%
10%
5%
0%
28%
14%
32%
9%
23%
10%
3%
Resting Extra meal
Prenatal visits
Nutritionalsupplements
Eatingregulary
Eatingdiversified
food
Avoidingheavy work
Source: Authors’ elaboration.
4 CONCLUSIONS AND RECOMMENDATIONS
4.1 BASELINE FINDINGS
The baseline data show a low level of socio-economic development among the SBCC target audience. Agriculture is the most common form of employment in all three groups, although to a lesser extent in treatment group A, where jobs within sales and services are also fairly common. Illiteracy is high; 62 per cent of the women and 31 per cent of the men do not read
Working Paper40
or write. Only about a third of the respondents have access to radio, and almost a quarter of the households do not have any type of toilet facilities. While this latter characteristic is most pronounced in group C (the control group), group B has the highest level of single mothers, children and illiteracy.
Regarding maternal care and nutrition, most women had attended a pre-natal check-up during the first three months of their most recent pregnancy, and gave birth at a hospital or health clinic. It should be noted that group B respondents had a higher frequency of home births, as well as a lower attendance at pre-natal check-ups. All three groups highlighted the importance of sufficient rest, avoiding heavy work, and regular and diverse meals during pregnancy. A majority of the women considered eating an extra meal every day important or very important. However, 30 per cent of the women responded that they did not know any care measures during pregnancy, reflecting a lack of knowledge on beneficial maternal health and nutrition practices.
The majority of the interviewees know that malaria is transmitted by mosquitos and can identify symptoms as well as methods of protection against transmission. Even so, the level of knowledge can still be considered low considering the high prevalence of malaria in the region. The study also found an 80 per cent correlation between knowing that malaria is transmitted by mosquitoes and owning a mosquito net.
The survey also points to important knowledge gaps in the area of WASH. First, the data show that a large proportion of the respondents never treat their water before drinking it or cooking with it. A large proportion were also unaware of standard hand-washing practices. These results are particularly surprising, as ‘contaminated water’ and ‘dirty hands’ were the causes of diarrhoea most frequently mentioned by the women interviewed, suggesting a misalignment between knowledge and practice. On the other hand, we should bear in mind that only 60 per cent of the women interviewed were able to cite at least one cause of diarrhoea correctly. While the husbands regard their wives as being responsible for their children’s health and nutrition, it should be noted that men’s knowledge of causes of diarrhoea is quite similar to women’s.
About 60 per cent of respondents believe that infants should be exclusively breastfed up to 6 months of age, and that breastmilk contains enough nutrients. Children’s nutritional diversity is generally very poor.
4.2 INTER-GROUP DIFFERENCES AND STATISTICAL METHODS TO BALANCE THE GROUPS
We analysed whether the difference in mean socio-economic variables between the comparison group and the treatment groups was statistically significant. The results of this exercise can be found in Appendix 1 and suggest relevant differences among the groups, which should be taken into account for the impact evaluation. The baseline data suggest that individuals in group A are less vulnerable than the control group, while the results are less conclusive when comparing groups B and C. As described in the SBCC evaluation plan, a DD analysis can correctly measure the impact of the intervention if the systematic differences between the groups follow a common trend—i.e. if individuals in both groups behave similarly over time. Another possibility is to determine a PSM algorithm that allows us to balance the groups in their observed differences. Appendix 2 provides the best results found after several tests of different algorithms using nearest-neighbour, radius and kernel matching.

International Policy Centre for Inclusive Growth 41
4.3 DATA QUALITY AND AUTHENTICITY
Data quality and authenticity checks were performed with the baseline data. These checks yielded encouraging results. The data quality and consistency are satisfactory for the majority of variables (325 out of 350). Approximately 7 per cent of the variables feature data quality and consistency issues and will not be used for the impact assessment. A review of the tablet-based questionnaire is strongly suggested, as the correct functioning of features such as capturing GPS coordinates or enabling (and disabling) options for inconsistent answers may help to improve data consistency.
Moreover, a number of checks have been performed to assess the authenticity of the baseline data (statistical checks as well as back-checks in the field). Although the statistical tests indicated a low variability and a high percentage of identical answer combinations which may indicate data authenticity problems, the back-checks in the field—conducted independently by senior enumerators—confirmed the authenticity of the data collected. For the endline survey, it is recommended to work with an external data collection firm, to avoid any conflicts of interest during the data collection.
REFERENCES
Blasius, J., and V. Thiessen. 2012. Assessing the quality of survey data. London: Sage.
Bredl, S., N. Storfinger, and N. Menold. 2011. “A literature review of methods to detect fabricated survey data.” Discussion Paper 56. Gießen: Zentrum für internationale Entwicklungs- und Umweltforschung.
Bredl, S., P. Winker, and K. Kötschau. 2008. “A statistical approach to detect cheating interviewers.” Discussion Paper 39. Gießen: Zentrum für internationale Entwicklungs- und Umweltforschung.
FAO. 2017. FAOSTAT—Food and agriculture data. Food and Agriculture Organization of the United Nations website. <http://faostat.fao.org/CountryProfiles/Country_Profile/Direct.aspx?lang=en&area=144>. Accessed 19 September 2017.
Gyori, M., and T. Martínez Zavala. 2017. “Social and Behaviour Change Communication (SBCC) Project in Manica, Mozambique—Evaluation Plan.” Internal Document. Brasìlia: International Policy Centre for Inclusive Growth.
Kuriakose, N., and M. Robbins. 2016. “Don’t get duped: Fraud through duplication in public opinion surveys.” Statistical Journal of the IAOS 32(3): 283–291.
Menold, N., P. Winker, N. Storfinger, and C.J. Kemper. 2013. “A method for ex-post identification of falsifications in survey data.” Survey Standardization and Interviewers’ Deviations—Impact, Reasons, Detection and Prevention: 25–48.
Porras, J., and N. English. 2004. “Data-driven approaches to identifying interviewer data falsification: The case of health surveys.” Proceedings of the American Statistical Association (Survey Research Methods Section): 4223–4228.
Republic of Mozambique. 2014. National Agricultural Investment Plan (PNISA) 2014–2018. Mozambique. Maputo: Republic of Mozambique. <http://www.resakss.org/sites/default/files/pdfs/Final%20PNISA%20Revised%20Version_0.pdf>. Accessed 19 September 2017.

Working Paper42
Schäfer, C., J.P. Schräpler, K.R. Müller, and G.G. Wagner. 2004. “Automatic identification of faked and fraudulent interviews in surveys by two different methods.” DIW Discussion Paper 441. Berlin: Deutsches Institut für Wirtschaftsforschung.
UNDP. 2016. 2016 Human Development Report. New York: United Nations Development Programme. <http://hdr.undp.org/en/2016-report>. Accessed 19 September 2017.
WFP. 2015. “Relatório Pesquisa Formativa. Factores para a mudança de comportamento nos tópicos Alimentação Infantil, Nutrição Materna, Saneamento do Meio e Higiene, Prevenção da Malária.” Internal Working Document. Rome: World Food Programme.
WFP VAM. 2008. Food consumption analysis Calculation and use of the food consumption score in food security analysis. Rome: World Food Programme, Vulnerability Analysis and Mapping Branch<http://documents.wfp.org/stellent/groups/public/documents/manual_guide_proced/wfp197216.pdf>. Accessed 19 September 2017.
WHO. 2008. Indicators for assessing infant and young child feeding practices. Part 1: Definitions. Geneva: World Health Organization. <http://who.int/nutrition/publications/infantfeeding/9789241596664/en/>. Accessed 19 September 2017.
WHO. 2010a. Indicators for assessing infant and young child feeding practices. Part 2: Measurement. Geneva: World Health Organization. <http://www.who.int/nutrition/publications/infantfeeding/9789241599290/en/>. Accessed 19 September 2017.
WHO. 2010b. Indicators for assessing infant and young child feeding practices. Part 3: Country Profiles. Geneva: World Health Organization. <http://who.int/nutrition/publications/infantfeeding/9789241599757/en/>. Accessed 19 September 2017.
World Bank. 2017. GDP per capita (current US$)—Mozambique. World Bank website. <http://data.worldbank.org/indicator/NY.GDP.PCAP.CD?locations=MZ>. Accessed 19 September 2017.
APPENDIX 1
DIFFERENCES BETWEEN TREATMENT AND COMPARISON GROUPS
To statistically evaluate the similarity of the groups surveyed, we performed a differences in means test—that is, we analysed whether the difference in mean socio-economic variables between the comparison group and the treatment groups was statistically significant. The presence of a significant difference would mean that the groups statistically differ in such characteristics, making them less comparable at baseline. Table 5 presents the results of this exercise. We first present the means and standard deviations of the socio-economic variables for the whole sample, followed by the means of each treatment group. The last two columns show the difference in means and its t-statistic.

International Policy Centre for Inclusive Growth 43
TABLE 5Difference in means test
Variable (1)All
(2)Control
(3)Group B
(4)Group A
(5)C-B
(6)C-A
Schooling
Literate women 0.377(0.485)
0.311(0.463)
0.219(0.414)
0.578(0.494)
0.0916**(3.08)
-0.267***(-8.74)
Attended school 0.521(0.500)
0.508(0.500)
0.327(0.470)
0.696(0.460)
0.180***(5.52)
-0.188***(-6.13)
Finished primary school
0.331(0.471)
0.289(0.454)
0.182(0.387)
0.499(0.501)
0.107***(3.75)
-0.210***(-6.89)
Literate men 0.680(0.467)
0.752(0.432)
0.448(0.498)
0.792(0.406)
0.304***(9.66)
-0.0400(-1.46)
Household characteristics
Married 0.775(0.418)
0.917(0.276)
0.473(0.500)
0.872(0.334)
0.444***(16.97)
0.0452*(2.32)
Number of children
3.106(2.126)
2.750(2.013)
3.623(2.189)
3.057(2.110)
-0.873***(-6.22)
-0.307*[-2.33]
Household size 6.397(4.095)
5.817(3.969)
6.300(3.011)
7.095(4.821)
-0.483*(-1.98)
-1.278***(-4.55)
Number of bedrooms
1.955(1.273)
1.750(0.850)
1.685(1.408)
2.421(1.415)
0.0657(0.86)
-0.670***(-8.97)
People per bedroom
3.553(2.034)
3.532(1.820)
4.050(2.456)
3.207(1.837)
-0.518***(-3.48)
0.325**(2.72)
Mainly agricultural income
0.729(0.445)
0.911(0.284)
0.787(0.410)
0.486(0.500)
0.124***(5.36)
0.425***(16.52)
Available money for food
177.0(455.2)
88.69(311.0)
153.5(370.7)
290.6(601.5)
-64.77**(-2.85)
-201.9***(-6.68)
Available money per member
32.33(75.70)
15.05(55.17)
30.83(77.65)
52.01(87.64)
-15.78***(-3.54)
-3696***(-7.96)
Radio access 0.404(0.491)
0.215(0.411)
0.441(0.497)
0.577(0.495)
-0.226***(-7.47)
-0.362***(-12.52)
Household owns television
0.129(0.335)
0.0929(0.291)
0.125(0.332)
0.170(0.376)
-0.0324(-1.56)
-0.0773***(-3.62)
Household owns cattle
0.278(0.448)
0.242(0.428)
0.254(0.436)
0.336(0.473)
-0.0123(-0.42)
-0.0946**(-3.28)
Religion
Zionist 0.125(0.330)
0.205(0.404)
0.0203(0.141)
0.126(0.332)
0.184***(8.67)
0.0789***(3.34)
Evangelist 0.251(0.434)
0.400(0.490)
0.225(0.418)
0.113(0.317)
0.174***(5.65)
0.286***(10.81)
Protestant 0.398(0.490)
0.301(0.459)
0.354(0.479)
0.537(0.499)
-0.0532(-1.70)
-0.236***(-7.71)
House materials/facilities
Household has latrine
0.719(0.450)
0.837(0.370)
0.714(0.452)
0.597(0.491)
0.123***(4.48)
0.239***(8.67)
No toilet/open defecation
0.238(0.426)
0.120(0.325)
0.213(0.410)
0.384(0.487)
-0.0926***(-3.78)
-0.264***(-10.05)
Mud floor 0.769(0.422)
0.805(0.397)
0.759(0.428)
0.738(0.440)
0.0456(1.66)
0.0672*(2.52)
Thatched roof 0.488(0.500)
0.244(0.430)
0.729(0.445)
0.549(0.498)
-0.485***(-16.56)
-0.305***(-10.31)
Mud walls 0.596(0.491)
0.474(0.500)
0.570(0.496)
0.748(0.434)
-0.0952**(-2.85)
-0.274***(-9.16)
Observations 1380 508 395 477 903 985
Source: Authors’ elaboration.

Working Paper44
As can be seen in Table 5, most differences were found to be statistically significant, meaning that the groups surveyed differ in terms of their socio-economic characteristics. Given the way in which the SBCC intervention was designed, targeting the most vulnerable households, differences among the target groups were expected. However, it is interesting to have found better schooling and literacy levels for treatment group A than for the other two groups; more than half of the women in group A are literate, attended school and finished primary school, and also the men show slightly higher literacy levels. On the other hand, we find that treatment group B fares worse than the control group regarding these variables, as would be expected from the intervention design. Whereas a majority of the women in groups A and C are married, less than half of the women in group B have a husband. Even so, group B respondents have more children on average than the other groups. While group A has the largest household size, it also has more bedrooms and fewer people per bedroom.
There is religious diversity among the groups, with a significantly higher proportion of Protestants in group A than in the other groups. Regarding income-generating activities, group A has significantly fewer farmers than the other groups. Yet cattle ownership is slightly higher in this group. Both treatment groups appear to be richer than the comparison group, measured by the available money for food and the available money per household member. Nevertheless, as noted in the Quality Assessment Report of the SBCC baseline data, these variables are not completely reliable due to a presence of more than 50 per cent of values close to zero. Access to radio is also higher in groups A and B than in group C. The same pattern is seen for television ownership, although this is very low in all groups. Regarding the characteristics of the house, significantly more households in group A lack toilet facilities. In all groups, mud is the most common material used for floors, and in groups A and B it is also widely used for walls. These groups also have a higher incidence of thatched roofs.
These results suggest relevant differences among the groups, which should be taken into account for the impact evaluation. The baseline data suggest that individuals in group A might be less vulnerable than the control group, while the results are less conclusive when comparing groups B and C. As is described in the SBCC evaluation plan, a DD approach would correctly measure the impact of the intervention if the systematic differences between the groups are time-invariant, or follow a common trend. Hence, the socio-economic characteristics of the future endline survey will help determine the validity of a DD methodology. If we are unable to find such time-invariability of the differences, a PSM method would be preferred, as matching according to these socio-economic characteristics would create more comparable individuals from which to determine the sole impact of the SBCC intervention.
APPENDIX 2
SAMPLE BALANCING RESULTS—PROPENSITY SCORE MATCHING
Given the differences between groups documented in Appendix 1, the impact evaluation of the SBCC intervention will need to draw on econometric methods which are in a position to consistently estimate the SBCC programme’s treatment effect, even if treatment and comparison groups display systematic differences at baseline. One possibility is the use of PSM methods, where each treated observation is matched based on statistical methods to the most similar control observation—in terms of a number of observable characteristics—in the comparison

International Policy Centre for Inclusive Growth 45
group (nearest-neighbour matching), a weighted average of observations in the comparison group which have sufficiently similar observable characteristics—i.e. are in a close ‘radius’ to the treated observation based on the propensity score (radius matching), or a weighted average of all control observations, giving a stronger weight to observations whose propensity score is closer to the respective treated observation, based on an underlying kernel function (kernel matching).
Different matching specifications have been tested, and the models which are in the best position to balance out the differences between the groups are presented in Tables 6 and 7. Kernel matching allows us to balance out differences in all but one variable for both groups (mud floor for group A, and number of children for group B). However, only 206 observations out of 478 were on support for group A, and 192 out of 395 for group B. The radius matching specification is in a position to balance out the statistically significant differences for all but three variables (television ownership, latrine ownership and mud floor) for group A and for all but six variables in group B (women’s literacy, husband’s literacy, ever went to school, completed primary schooling, mud floor, available money for food), with 335 out of 478 on support for group A, and 300 out of 395 on support for group B. The kernel matching specification is in the best position to balance out the differences between groups.
TABLE 6Balancing results for treatment group A by type of matching algorithm
Variable
Nearest neighbour Radius Kernel
Mean Mean Mean
Treated Control t-test p>|t| Treated Control t-test p>|t| Treated Control t-test p>|t|
Number of children 3.06 3.12 -0.35 0.724 3.09 3.07 0.10 0.924 2.92 3.08 -0.76 0.449
Married 0.91 0.93 -0.63 0.529 0.92 0.91 0.72 0.470 0.93 0.91 0.51 0.608
Literate husband 0.80 0.85 -1.33 0.183 0.81 0.83 -0.40 0.690 0.81 0.81 0.00 0.997
Own television 0.19 0.26 -2.24 0.025 0.20 0.27 -2.21 0.027 0.17 0.24 -1.58 0.114
Main income from agriculture
0.61 0.62 -0.28 0.778 0.59 0.59 -0.21 0.833 0.69 0.67 0.34 0.735
Literate 0.52 0.58 -1.43 0.153 0.59 0.59 -0.08 0.939 0.49 0.55 -1.23 0.221
Went to school 0.67 0.73 -1.57 0.117 0.72 0.71 0.31 0.756 0.66 0.68 -0.41 0.684
Completed primary school 0.47 0.56 -2.19 0.029 0.55 0.55 -0.15 0.884 0.46 0.52 -1.27 0.206
Own cattle 0.31 0.27 0.84 0.401 0.33 0.31 0.66 0.507 0.33 0.27 1.26 0.208
Have latrine 0.68 0.71 -0.81 0.417 0.70 0.60 2.73 0.007 0.72 0.72 -0.14 0.887
No toilet facilities/open defecation
0.30 0.24 1.45 0.149 0.27 0.34 -1.83 0.067 0.27 0.24 0.65 0.516
House’s floor of mud 0.72 0.60 3.16 0.002 0.72 0.64 2.32 0.021 0.74 0.63 2.43 0.016
Number of people per room in household
3.38 3.35 0.19 0.851 3.30 3.43 -0.99 0.321 3.23 3.44 -1.13 0.258
Available money for food
208.93 297.18 -2.64 0.008 288.85 320.83 -0.69 0.487 218.87 267.52 -1.21 0.226
Number of observations 301 468 335 478 206 350
Source: Authors’ elaboration.
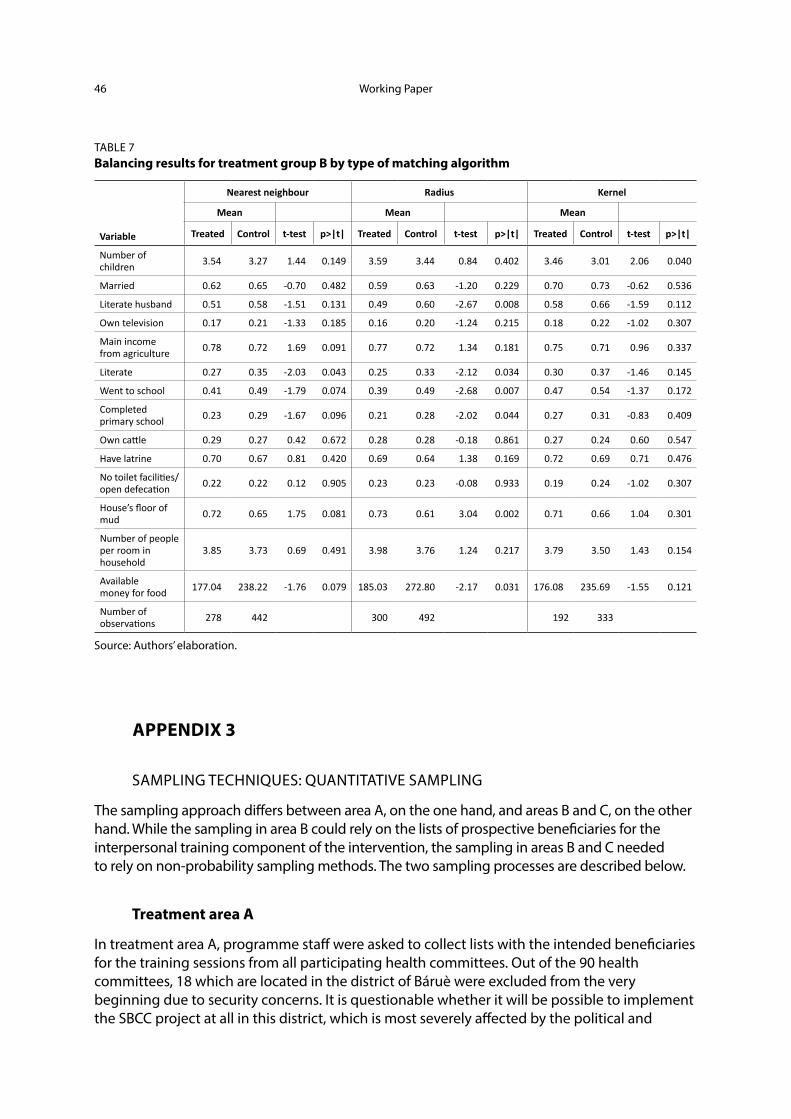
Working Paper46
TABLE 7Balancing results for treatment group B by type of matching algorithm
Variable
Nearest neighbour Radius Kernel
Mean Mean Mean
Treated Control t-test p>|t| Treated Control t-test p>|t| Treated Control t-test p>|t|
Number of children 3.54 3.27 1.44 0.149 3.59 3.44 0.84 0.402 3.46 3.01 2.06 0.040
Married 0.62 0.65 -0.70 0.482 0.59 0.63 -1.20 0.229 0.70 0.73 -0.62 0.536
Literate husband 0.51 0.58 -1.51 0.131 0.49 0.60 -2.67 0.008 0.58 0.66 -1.59 0.112
Own television 0.17 0.21 -1.33 0.185 0.16 0.20 -1.24 0.215 0.18 0.22 -1.02 0.307
Main income from agriculture 0.78 0.72 1.69 0.091 0.77 0.72 1.34 0.181 0.75 0.71 0.96 0.337
Literate 0.27 0.35 -2.03 0.043 0.25 0.33 -2.12 0.034 0.30 0.37 -1.46 0.145
Went to school 0.41 0.49 -1.79 0.074 0.39 0.49 -2.68 0.007 0.47 0.54 -1.37 0.172
Completed primary school 0.23 0.29 -1.67 0.096 0.21 0.28 -2.02 0.044 0.27 0.31 -0.83 0.409
Own cattle 0.29 0.27 0.42 0.672 0.28 0.28 -0.18 0.861 0.27 0.24 0.60 0.547
Have latrine 0.70 0.67 0.81 0.420 0.69 0.64 1.38 0.169 0.72 0.69 0.71 0.476
No toilet facilities/open defecation 0.22 0.22 0.12 0.905 0.23 0.23 -0.08 0.933 0.19 0.24 -1.02 0.307
House’s floor of mud 0.72 0.65 1.75 0.081 0.73 0.61 3.04 0.002 0.71 0.66 1.04 0.301
Number of people per room in household
3.85 3.73 0.69 0.491 3.98 3.76 1.24 0.217 3.79 3.50 1.43 0.154
Available money for food 177.04 238.22 -1.76 0.079 185.03 272.80 -2.17 0.031 176.08 235.69 -1.55 0.121
Number of observations 278 442 300 492 192 333
Source: Authors’ elaboration.
APPENDIX 3
SAMPLING TECHNIQUES: QUANTITATIVE SAMPLING
The sampling approach differs between area A, on the one hand, and areas B and C, on the other hand. While the sampling in area B could rely on the lists of prospective beneficiaries for the interpersonal training component of the intervention, the sampling in areas B and C needed to rely on non-probability sampling methods. The two sampling processes are described below.
Treatment area A
In treatment area A, programme staff were asked to collect lists with the intended beneficiaries for the training sessions from all participating health committees. Out of the 90 health committees, 18 which are located in the district of Báruè were excluded from the very beginning due to security concerns. It is questionable whether it will be possible to implement the SBCC project at all in this district, which is most severely affected by the political and
International Policy Centre for Inclusive Growth 47
military conflict. From the remaining 72 health committees in Guro, Mossurize, Machaze and Sussundenga, it was possible to collect beneficiary lists from 56 health committees, corresponding to 77.8 per cent of all possible health committees.
The impossibility of collecting lists from the remaining 16 health committees poses a risk to the evaluation design. During the endline survey, an additional effort will be made to collect beneficiary lists from these 16 health committees as well, to examine whether the impacts in these committees were systematically different from the other 56 committees.
Based on the beneficiary lists which could be collected by 5 December 2016, the IPC-IG randomly selected 500 women who fulfil the sample inclusion criteria and will be interviewed during the baseline survey, along with their husbands, to whom a small sub-questionnaire is applied.
Treatment areas B and C
In treatment areas B and C the sampling will use non-probability sampling methods to determine a representative sample of households in the absence of census data. In practice:
1. In a first step, all communities located within area B (broadcast coverage area of a community radio station participating in the SBCC project, but without a health committee) and area C (pure control) will be identified and listed.
2. In a second step, the communities where interviews will take place will be randomly selected from these lists. The lists with selected communities will be provided to the enumerators.
3. The third step is for enumerators to find community members (e.g. community leaders, health workers, municipal workers etc.) in the selected villages who can help identify households that meet the sample inclusion criteria of being female between 18 and 49 years old and either:
a. pregnant or
b. mother of a child aged 0–2.
4. Enumerators will list these two different groups and select the 7th, 14th, 21st and 28th person on each of the lists to conduct an interview (if the list is long enough; if the community leader only lists 15 community members, only the 7th and 14th person will be selected).
5. To continue the data collection for the remaining women in the community, ‘snowball sampling methods’ will be applied: each of the female respondents will be asked to give references of three women who are either pregnant and/or have children under the age of 2 and similar socio-economic characteristics. In turn, they will act as ‘seeds’ of new informants. These new potential participants should not be family members or people they keep a close relationship with, to avoid a possible bias in the sampling. Enumerators will follow the same random selection from the list as before with the newly referred participants, who at the same time will become new ‘seeds’ of new potential interviewees. The process will continue until a village-specific quota of respondents is reached (quota to be determined in coordination with the WFP).

Working Paper48
NOTES2. Differences that are not due to random chance in the sample selection.
3. For more information, see: <http://hdr.undp.org/en/2016-report>.
4. Although SBCC activities are taking place in Báruè, the district was excluded from the evaluation due to the presence of military and political conflict, a situation that has also impaired the collection of the baseline data.
5. For more details on the impact evaluation, please refer to the SBCC evaluation plan.
6. PSM works by calculating a score of the probability of being treated, based on observable characteristics and not on the actual treatment selection criteria (geographical location, in the case of the SBCC). In that sense, the score measures how likely a control individual would have been to receive the treatment whether she had been in the treatment area. A matching algorithm then selects individuals from both groups who share similar scores. There is little guidance when selecting a matching algorithm, as there is always a trade-off between reducing the matched sample and comparing groups that are less similar. Hence, multiple algorithms may be used to compare results and choose the better option for the SBCC data.
7. In a first step, 500 women were sampled at random from the previously collected lists of prospective beneficiaries for the interpersonal communication component. The enumerators were unable to find 80 of these women in the district of Machaze. The IPC-IG team, therefore, drew a random replacement sample from all women who had not been previously sampled in Machaze. In the final baseline database, 389 observations came from the original random sample or the random replacement sample for Machaze. On the other hand, 71 interviewees from area A were not part of the original sample. One explanation for this is that the enumerators have replaced interviewees who could not be traced on the spot. These 71 interviewees might need to be excluded from the final impact analysis, as they are not part of a random sample. For the descriptive analysis in this baseline report, they are nevertheless included in the analysis.
8. For more details, please refer to the SBCC sampling strategy in Appendix 1.
9. For a more detailed description, please refer to the Quality Assessment report.
10. These enumerators were recruited at a later stage and were, therefore, unable to participate in the initial training. WFP field staff who had participated in the original training trained them, to ensure similar qualification levels.
11. To calculate such ranges, tables on height and weight for age of girls and boys were used. In particular, lower values of girls were used as a lower bound, while the higher values for boys were used as an upper bound, given that girls are usually shorter and lighter than boys. The WHO tables used for calculating the range of plausible heights and weights were not available for Mozambique, for which general values were used.
12. If the questionnaire consists of 100 questions and individual A shares 95 common responses with individual B, this is considered a 95 per cent match.
13. The back-checks were specially focused on the interviewees of those enumerators whose results were more suspicious, although other observations were also randomly selected for back-checking.
14. The FCS provides weights to each of the food categories consumed to account for the quality of the diet. It also considers the frequency with which a meal is eaten; nonetheless, for this exercise, the cross-tabulation with the number of times consumed was not performed because that information was not available. For more details, see: <http://documents.wfp.org/stellent/groups/public/documents/manual_guide_proced/wfp197216.pdf>.
15. The suggested breakdown also considers the frequency with which a meal was eaten in the last seven days. For the case of the SBCC, the frequency of the consumption of food was not available; therefore, the threshold was adapted to meet the available data. Thus, the analysis considered a breakdown based on the MDD, incorporating the likelihood of consuming meals from at least four food groups. The thresholds used in the analysis are then: <6 diet is considered poor; 6.5–11.5 borderline; and 12 or above, acceptable.


International Policy Centre for Inclusive Growth (IPC-IG)
SBS, Quadra 1, Bloco J, Ed. BNDES, 13º andar70076-900 Brasília, DF - BrazilTelephone: +55 61 2105 5000
[email protected] ■ www.ipcig.org