Working Paper - Student Learning Study
8
1 © Educational Initiatives Pvt. Ltd. ASSET is a registered trademark and Mindspark is a trademark of EI
-
Upload
aditya-shah -
Category
Documents
-
view
218 -
download
0
description
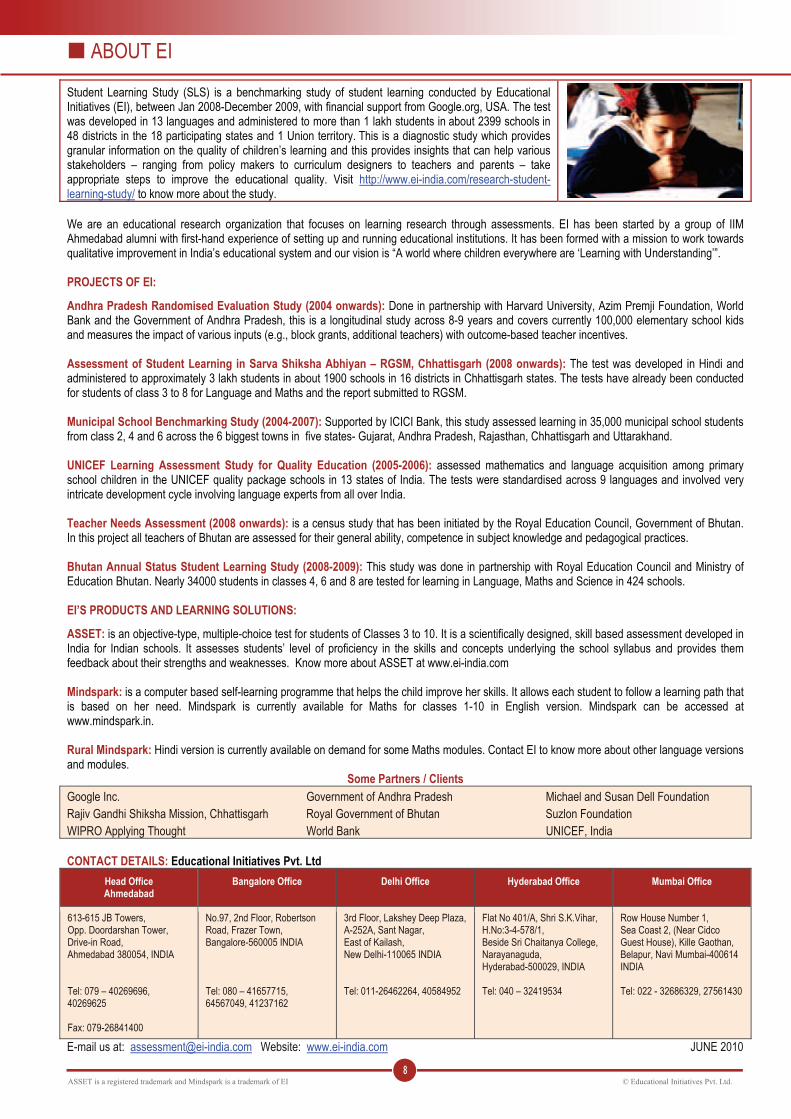
Student Learning Study (SLS) is a benchmarking study of student learning conducted by Educational Initiatives (EI), with financial support from Google.org, USA. The study has been carried out in 48 districts in 18 states and 1 Union territory of India. About 1.6 lakh students studying in classes 4, 6 and 8 in 2399 selected government schools were tested (101643 students actually took the tests – the others were absent on the day of testing) and tested in Language and Maths through common test papers in 13 language versions. The study also collected background information from the students, teachers, head teachers and schools to detect relationships between these factors and student learning.
Transcript of Working Paper - Student Learning Study

1 © Educational Initiatives Pvt. Ltd.ASSET is a registered trademark and Mindspark is a trademark of EI

2 © Educational Initiatives Pvt. Ltd.ASSET is a registered trademark and Mindspark is a trademark of EI
WHY THIS IDEA HAS LARGER RELEVANCE
How do we measure the quality of school education? World over, governments and citizens alike seem to agree that good quality education (rather than mere school attendance) is powerfully related to individual outcomes in the labour market, enhancing economic growth of a nation and reducing inequality in society (Hanushek and Woesmann 2007; Vegas and Petrow, 2008; World Bank, 2007). Student Learning Study (SLS) is a benchmarking study of student learning conducted by Educational Initiatives (EI), with financial support from Google.org, USA. The study has been carried out in 48 districts in 18 states and 1 Union territory of India. About 1.6 lakh students studying in classes 4, 6 and 8 in 2399 selected government schools were tested (101643 students actually took the tests – the others were absent on the day of testing) and tested in Language and Maths through common test papers in 13 language versions. The study also collected background information from the students, teachers, head teachers and schools to detect relationships between these factors and student learning. Other studies, like Pratham’s ASER (ASER 2005-09) and NCERT’s achievement surveys (NAS, 2008), have revealed low student learning levels. The current study is different in 3 important ways – the test design is more sophisticated and checks for student understanding (not just procedural learning). It is independently conducted by a single external agency (EI) and the analysis includes advanced methods like Scale Anchoring. We believe that detailed data helps to devise remedies and solutions in addition to highlighting the problem.
Features EI SLS ASER NCERT Study Class-wise tests Class wise tests Common test Class wise tests Single Agency Facilitated and carried out by
Educational Initiatives Facilitated by Pratham and carried out by local organizations or institutions in different districts
Facilitated by NCERT and carried out by the different states
Tests in School In classrooms In homes In classrooms Classes tested Classes 4,6,8 Ages 6 -14 Classes 3,5,7 Coverage Urban and Rural Rural Urban and Rural Testing Tools Full length tests including all
competencies; multiple choice and free response questions involving written answers; additionally oral reading tested
Short test with items in oral reading, subtraction, telling time and currency tasks
Full length tests, entirely multiple choice questions, written responses limited to few in Language paper
Analysis Achievement data of states with detailed diagnostic feedback capturing learning gaps and misconceptions
Achievement data of states Achievement data of states
Scale Anchoring Scale Anchoring using modern Item Response Theory (IRT) to release benchmarks on what students know and do at different ability levels
No Scale Anchoring No Scale Anchoring
GOALS OF THE STUDY The goals of the ‘Student Learning Study’ (SLS) are as follows: • To provide independent 3rd party benchmarking of student learning for use by policy makers and researchers both at the Central and
the State levels. • To provide insights into comparative performances of different states and to create cross-learning and remedial opportunities. • To establish student learning in terms of knowledge and skills and feedback on the learning gaps, common errors and
misconceptions. • To provide pointers for further research. • To diagnose the learning issues at the systemic level.
In short, Student Learning Study is a sophisticated and comprehensive study that aims to provide detailed question-wise and state-wise data for monitoring learning across classes, and provide detailed diagnostic feedback. We plan to bring to you insights and information from this study in the next few issues of the working papers series.

3 © Educational Initiatives Pvt. Ltd.ASSET is a registered trademark and Mindspark is a trademark of EI
SALIENT FEATURES OF THE STUDY
Test Administration:
• Carried out by EI’s team of trained evaluators
• Standardization through master trainings and evaluator trainings
• Quality control with detailed manuals, checklists and field audits
• Performance data captured through OMR sheets, coded by evaluators
TOOLS: • Students of classes 4, 6 and 8 tested in
Language and Maths • Scientifically designed, full length tests
covering all the competencies • Multiple choice and free response items• Questions check for deeper
understanding of concepts apart from procedural learning
• Comparison on common questions from international tests, such as, TIMSS and PIRLS
• Additional oral reading test administered one-on-one to students
• Scoring rubrics with detailed granular codes to capture different answers
• Separate questionnaires for collecting background information about the student, school, teacher and head of the school
Multivariate analysis to identify factors associated with students learning
Availability of granular data that can be drilled to question level

4 © Educational Initiatives Pvt. Ltd.ASSET is a registered trademark and Mindspark is a trademark of EI
MAIN FINDINGS 1. Learning levels are extremely low. In the lower classes, a fair amount of 'rote-based' or 'procedural' learning is evident in very basic
numeracy skills such as number sequencing, operations of whole numbers involving 1 or 2 digits; naming of numbers; reading clock time, understanding currency, etc. Even among procedural questions, students are able to comparatively handle only 'straightforward' questions that are closer to what one would practise from a typical textbook and not when they are slightly atypical. In higher classes, students are falling behind in all learning, even procedural. Responses to some questions suggest that students are probably coping through learning happening outside the class. For example, in class 6, while more students could add the fractions 2½ and 1½ in a word problem using a real life context, fewer of them could add the same when asked as a straightforward addition question as '2½ +1 ½= __'.
2. Learning taking place is not 'Learning with understanding' and a number of misconceptions exist among students on the concepts
learnt. The learning that is happening seems to be procedural or rote-based and not one of 'Learning with Understanding' as students find it difficult to answer questions that require a deeper understanding of the concept.
3. Learning gains seen across classes is slightly incremental and not a large jump. Student performance in common questions that were
used to check learning gains across classes showed that performance increased as students move from class 4 to 6 to 8 in both language and maths. However, the extent of improvement was often slightly incremental and not a large jump as one would expect. In most cases, nearly 40% of students in class 8 do not seem to have acquired class 4 competencies. Many misconceptions that students have in lower classes still continue in higher classes and in some cases were found to even become stronger.
4. Students find it difficult to express their thoughts in their own words in writing. Their writing does not go beyond the most basic, tried
and tested formulaic sentences they probably trained for while in their lower classes. Their writing shows that they are learning language more as a subject and less as a means of natural communication. The writing has a number of errors in spelling and grammar, and punctuation marks are conspicuous by their absence.
5. In all the states tested, fewer students were found to comprehend what they read. For e.g., in the oral reading test, about 87.1% of
students in Gujarat could read a simple word, but only 40.3% could read a short passage and only 22.6% could comprehend the information implicit in the passage they read.
6. There are significant state-wise differences in student performance across states. Based on the relative performance/rank of the states in
different classes and subjects, an attempt has been made to consolidate the performance of 17 states, as seen in Graph 1. Kerala, Maharashtra, Orissa and Karnataka are clearly performing overall better than the national average. Jammu and Kashmir, Madhya Pradesh and Rajasthan were among the states that ranked among the bottom three overall. Bihar performed the same as the national average.

5 © Educational Initiatives Pvt. Ltd.ASSET is a registered trademark and Mindspark is a trademark of EI
MAIN FINDINGS (Continued...)
A high correlation of 0.85 and above was observed in the performance across the classes and subjects tested in each state. This means that if a state does well in a class or subject compared to other states then it more or less tends to do well compared to other states in other classes and subjects too.
7. Extent of students scoring zero and the overall performance of a state showed differences. A comparison of information in Graph 1 with
that in Graph 2 reveals that Andhra Pradesh, Assam, Chhattisgarh and Jharkhand, although below the national average, have fewer students scoring zero in the test compared to better performing states such as Haryana and Karnataka. This indicates that while the states’ efforts could be addressing the lowest ability students, they do not provide adequate support for overall improvement of all students. Jammu and Kashmir, Madhya Pradesh and Rajasthan which ranked among the bottom 3 in overall performance also had the highest number of students scoring zero indicating that these students are being left behind in these states.
8. The levels of learning of Indian students in government schools in class 4 and class 8 tested is much lower than the international average as represented by studies like Trends in International Maths and Science Study (TIMSS) and Progress in International Reading and Literacy Study (PIRLS). Similarly, on common questions used from an extensive study for private schools in India catering to the elite and upper middle class, students in government schools showed a much lower performance.
9. The comparative performance of boys and girls is similar to many international studies – boys seem to do better in maths, although the
SLS study reveals that it is a meaningful difference that matters in class 8 only.
10. Analysis of Background factors showed that when students perceive themselves as being good at studies and think of the school as a place of fun and learning, they show good performance. Students who said that they read material other than textbooks for at least 30 minutes a day showed higher achievement. This reveals the importance of inculcating reading habits in students. Teacher training is important especially for mathematics teachers, for better achievement of students in the subject. Unexpectedly, analysis shows that students whose teachers have an academic degree developed lower scores in both language and mathematics than those who did not have these.
Can different studies report different performance rankings for states? Measuring student learning is a complex exercise and performance reported is influenced by a number of factors. Assuming that the student samples are selected byrobust procedures in all studies, test scores would further depend on - a. What is measured: Test papers used in different studies may not measure identical things. For example, questions could measure rote learning or questions
could measure deeper understanding of concepts; and there may be differences in the length of the paper, for a longer paper may mean that more informationhas been obtained to arrive at conclusions.
b. How a test is administered: The way the test is administered is very important to come to conclusions about student learning. For example, different tests maybe administered in a classroom or outside a school environment, testing may be carried out by the teacher who is close to the class or evaluators who havebeen specifically trained for standardised administration, teams in different states may be synchronised to follow identical processes or different state teams mayfollow processes that have inherent differences while administering the tests, etc all of which will bring about changes in the test scores.
Is it fair to compare school systems that are known to have wide differences in resources and types of students it caters to? It is well known that schools in other countries as well as the Indian private elite schools may have richer resources with students from better socio-economic strata, which by themselves may contribute to differences in student learning. Hence, the purpose of these comparisons should not be to measure or rank the school systems in terms of performance. However, given the goal for our government school system to achieve the best quality education for students, such comparisons do indicate the performance level students in these schools could aspire for.

6 © Educational Initiatives Pvt. Ltd.ASSET is a registered trademark and Mindspark is a trademark of EI
KNOWLEDGE AND ABILITY BENCHMARKS In an approach that moves away from focusing only on the overall achievement scores, SLS attempts to explain the performances in terms of what students know and are able to do at each of the SLS 2009 national benchmarks of achievement – 90th percentile (advanced), 75th percentile (high), 50th percentile (intermediate), and 25th percentile (low). As per global practices, the scale anchoring methodology has been followed for this purpose. Items anchoring at each anchor level have been further analysed in order to summarise the knowledge and ability of students on the achievement scale in language and maths. The results clearly show which concepts or topics are understood only by students performing at higher levels and which topics are understood by other students also. Insights provided by the Scale Anchoring process can help us understand the way children learn in the different ability levels and plan scientific remediation for improving student performance. For example, given below are the knowledge and ability exhibited by students reaching the intermediate benchmark in Maths class 4. This is a remediation focus area for the student in low benchmarks who are not attaining this knowledge and ability.
Intermediate Benchmark (students reaching 50th percentile ) 50th Percentile IRT Scaled Score: 504
Students are able to write the numeral form of 3 digit numbers when their number names are given. Students can recognise missing numbers in an ascending sequence of 2 digit numbers greater than 20. Students can perform multiplication of a 2 digit number with a 1 digit number, not involving carry over. Students understand the concept of half as a number divided by 2, for example they know that in a group of same objects, 3 out of 6 is half the number of that object. Students are able to recognize patterns in sequences involving shapes. Students are able to apply subtraction operations appropriately and successively in word problems. They are able to represent 'nothing' that remains after the subtractions as a 'zero'. Students are able to apply the appropriate mathematical operation in word problems involving day-to-day life situations such as finding the age of a person from that of another person when the difference is known.
MISCONCEPTION ANALYSIS Detailed analysis of the different answers for each question given by students in both maths and language reveal that students’ understandings of the concepts are often faulty as they seem to harbour many mistaken notions. They also seem to commonly make errors in answering some questions. An example is given below:
Which tree is tallest?
A. Height of tree (1) : 7 metres B. Height of tree (2) : 4.2 metres C. Height of tree (3) : 3.25 metres D. Height of tree (4) : 2 metres This question was asked in class 6. About 40.4% of the students understand the ordering of positive decimal numbers up to 2 decimal places. About 30.8% of students think that 3.25 is greater than 7 and have answered C. They may be having the wrong notion that more the number of digits after a decimal point, larger is the number. It is quite possible that they may have ignored the decimal point and applied the ordering of whole numbers to answer wrongly as C.
BACKGROUND FACTORS ANALYSIS Detailed analysis of information collected from students, teachers, head teachers and school revealed interesting insights. Some of them are below.
Student Questionnaire
School Questionnaire
SLS 2009 Maths Class 4
x
y

7 © Educational Initiatives Pvt. Ltd.ASSET is a registered trademark and Mindspark is a trademark of EI
RECOMMENDATIONS
1. Orienting policies to focus on learning outcomes: While the Central Government initiated Sarva Shiksha Abhiyan (SSA) in 2002 and set the targets of universal primary education in 2007 and Universal Elementary Education (UEE) by 2010 respectively, it has not set itself a target based on quality of student learning outcomes. It is important that all policies are built with a focus on the learning outcomes, for, if students are not learning, then this defeats the purpose even if all other goals are met.
2. Making Low Stakes Diagnostic Assessments – a regular feature of the state programs: Assessments tend to work well when they are
low-stake. Their purpose is to inform students, teachers, schools and even the larger society where schools stand. Without official pressure, the purpose of the assessment is two-fold: to provide support and information, and this itself leads to the creation of a positive peer and/or self pressure. The tests must be created by a body or organisation that is truly independent and is not in a way responsible for providing quality education. Low stakes assessments thus developed should be diagnostic and check for understanding and not simply rote or recall.
3. Extensively use Benchmark data from the study to build reform: A powerful goal of these assessments is to obtain a clear picture
on where students and teachers stand with respect to peers in the state, peers in the rest of the country and peers internationally. These are not just numbers, but detailed statements of strengths and weaknesses which can lead to specific action points.
4. Student Progress Tracking System: We have reached a stage in our development where accuracy of available data alone can make
a significant difference to our development. This brings to the fore the need for computer-based systems like Student Progress Tracking System in helping to achieving universal primary education nationally. Student Progress Tracking System is a computerised system with unique student identification and aids in tracking student learning / progress on both scholastic and non-scholastic domains. Such a system will allow drilling down of information to the level of the individual student and teacher and enable targeting the remediation.
5. Large Scale Awareness campaign to redefine attitudes towards learning - a movement against rote learning and for Learning
with Understanding: Rote learning can deceptively look like learning and be mistaken for it. A consensus needs to be gradually built that rote learning is not learning at all.
6. Widely disseminating the findings of this report among teachers and others: We recommend that each state make a systemic and
detailed plan to disseminate this report, giving every teacher an opportunity to see it, understand and even question and discuss it. The purpose of all this is two-fold: 1. initiate the rote versus learning with understanding debate in the country; and 2. get teachers to start thinking about ‘what are children learning and not learning’ rather than just focussing on ‘what are we teaching or what to teach’.
7. Providing effective teacher support based on the feedback from the assessment: Targeted capacity building in teachers is often
enabled by detailed diagnostic assessments such as the SLS, which reveal absolute performance and trends showing weaknesses in groups of students, schools and sometimes even a region or in the entire state. The background factor analysis in the study reveals that teachers with an academic degree were ineffective in achieving higher scores for their students in language and maths while teachers with teacher training qualification were effective in achieving higher scores for their students in maths. This is an indication for reviewing the teacher recruitment and training system.
The future steps would involve dissemination of the findings at the state level to enable policy and educational reform.
NATIONAL CONFERENCE ON STUDENT LEARNING STUDY A National Conference on ‘Student Learning Study – An India Report’ was organised at Delhi on 24th and 25th May 2010. The report was released by Mr. S. C. Khuntia, Joint Secretary, Bureau of School Education, MHRD; Ms. Kumud Bansal, Former Secretary, Department of Elementary Education & Literacy, MHRD & advisor, National Knowledge Commission, GOI and Mr. Sridhar Rajagopalan, Managing Director, Educational Initiatives. The conference was attended by state officials, various national and international agencies and NGOs working in the field of education. Proceedings of the first day included presentations on the role of assessments in improving educational quality, main findings from the report and 2 panel discussions namely ‘Measuring Educational Quality – Issues and Challenges’ and ‘Using Assessment Data to Create Learning Improvements’. The proceedings of the conference and the final report of the study are available at http://www.ei-india.com/sls/
8 © Educational Initiatives Pvt. Ltd.ASSET is a registered trademark and Mindspark is a trademark of EI
ABOUT EI
Student Learning Study (SLS) is a benchmarking study of student learning conducted by Educational Initiatives (EI), between Jan 2008-December 2009, with financial support from Google.org, USA. The test was developed in 13 languages and administered to more than 1 lakh students in about 2399 schools in 48 districts in the 18 participating states and 1 Union territory. This is a diagnostic study which provides granular information on the quality of children’s learning and this provides insights that can help various stakeholders – ranging from policy makers to curriculum designers to teachers and parents – take appropriate steps to improve the educational quality. Visit http://www.ei-india.com/research-student-learning-study/ to know more about the study. We are an educational research organization that focuses on learning research through assessments. EI has been started by a group of IIM Ahmedabad alumni with first-hand experience of setting up and running educational institutions. It has been formed with a mission to work towards qualitative improvement in India’s educational system and our vision is “A world where children everywhere are ‘Learning with Understanding’”. PROJECTS OF EI: Andhra Pradesh Randomised Evaluation Study (2004 onwards): Done in partnership with Harvard University, Azim Premji Foundation, World Bank and the Government of Andhra Pradesh, this is a longitudinal study across 8-9 years and covers currently 100,000 elementary school kids and measures the impact of various inputs (e.g., block grants, additional teachers) with outcome-based teacher incentives. Assessment of Student Learning in Sarva Shiksha Abhiyan – RGSM, Chhattisgarh (2008 onwards): The test was developed in Hindi and administered to approximately 3 lakh students in about 1900 schools in 16 districts in Chhattisgarh states. The tests have already been conducted for students of class 3 to 8 for Language and Maths and the report submitted to RGSM. Municipal School Benchmarking Study (2004-2007): Supported by ICICI Bank, this study assessed learning in 35,000 municipal school students from class 2, 4 and 6 across the 6 biggest towns in five states- Gujarat, Andhra Pradesh, Rajasthan, Chhattisgarh and Uttarakhand. UNICEF Learning Assessment Study for Quality Education (2005-2006): assessed mathematics and language acquisition among primary school children in the UNICEF quality package schools in 13 states of India. The tests were standardised across 9 languages and involved very intricate development cycle involving language experts from all over India. Teacher Needs Assessment (2008 onwards): is a census study that has been initiated by the Royal Education Council, Government of Bhutan. In this project all teachers of Bhutan are assessed for their general ability, competence in subject knowledge and pedagogical practices. Bhutan Annual Status Student Learning Study (2008-2009): This study was done in partnership with Royal Education Council and Ministry of Education Bhutan. Nearly 34000 students in classes 4, 6 and 8 are tested for learning in Language, Maths and Science in 424 schools. EI’S PRODUCTS AND LEARNING SOLUTIONS: ASSET: is an objective-type, multiple-choice test for students of Classes 3 to 10. It is a scientifically designed, skill based assessment developed in India for Indian schools. It assesses students’ level of proficiency in the skills and concepts underlying the school syllabus and provides them feedback about their strengths and weaknesses. Know more about ASSET at www.ei-india.com Mindspark: is a computer based self-learning programme that helps the child improve her skills. It allows each student to follow a learning path that is based on her need. Mindspark is currently available for Maths for classes 1-10 in English version. Mindspark can be accessed at www.mindspark.in. Rural Mindspark: Hindi version is currently available on demand for some Maths modules. Contact EI to know more about other language versions and modules.
Some Partners / Clients Google Inc. Government of Andhra Pradesh Michael and Susan Dell Foundation Rajiv Gandhi Shiksha Mission, Chhattisgarh Royal Government of Bhutan Suzlon Foundation WIPRO Applying Thought World Bank UNICEF, India CONTACT DETAILS: Educational Initiatives Pvt. Ltd
Head Office Ahmedabad
Bangalore Office
Delhi Office
Hyderabad Office
Mumbai Office
613-615 JB Towers, Opp. Doordarshan Tower, Drive-in Road, Ahmedabad 380054, INDIA Tel: 079 – 40269696, 40269625 Fax: 079-26841400
No.97, 2nd Floor, Robertson Road, Frazer Town, Bangalore-560005 INDIA Tel: 080 – 41657715, 64567049, 41237162
3rd Floor, Lakshey Deep Plaza, A-252A, Sant Nagar, East of Kailash, New Delhi-110065 INDIA Tel: 011-26462264, 40584952
Flat No 401/A, Shri S.K.Vihar, H.No:3-4-578/1, Beside Sri Chaitanya College, Narayanaguda, Hyderabad-500029, INDIA Tel: 040 – 32419534
Row House Number 1,Sea Coast 2, (Near Cidco Guest House), Kille Gaothan, Belapur, Navi Mumbai-400614 INDIA Tel: 022 - 32686329, 27561430
E-mail us at: [email protected] Website: www.ei-india.com JUNE 2010