IOÊIB merit merit merit 3,000B ¥ merit 61IOÊIB merit merit merit 3,000B ¥ merit 61 !

#2018-030
Informal sector innovation in Ghana: Data set and descriptive analysis Elvis Korku Avenyo
Maastricht Economic and social Research institute on Innovation and Technology (UNU‐MERIT) email: [email protected] | website: http://www.merit.unu.edu Maastricht Graduate School of Governance (MGSoG) email: info‐[email protected] | website: http://www.maastrichtuniversity.nl/governance Boschstraat 24, 6211 AX Maastricht, The Netherlands Tel: (31) (43) 388 44 00
Working Paper Series

UNU-MERIT Working Papers ISSN 1871-9872
Maastricht Economic and social Research Institute on Innovation and Technology UNU-MERIT Maastricht Graduate School of Governance MGSoG
UNU-MERIT Working Papers intend to disseminate preliminary results of research carried out at UNU-MERIT and MGSoG to stimulate discussion on the issues raised.

Informal sector innovation in Ghana: Data set and
descriptive analysis ∗
Elvis Korku Avenyo †
University of Johannesburg, Johannesburg, South Africa
United Nations University-MERIT, Maastricht, The Netherlands
Abstract
While informal enterprises and their activities dominate sub-Saharan African (SSA)
economies, data on ‘informal’ innovation activities remain lacking. This paper presents
descriptive statistics from survey data collected in 2016, on the types of innovations infor-
mal enterprises adopt and/or adapt in urban Ghana (Accra and Tema). Using zones defined
in the Ghana Informal Enterprise Survey (GIFS) of the World Bank as area-based frame,
and randomly selecting and canvassing 17 zones, the study identified and interviewed 513 in-
formal enterprises. The analysis reveals that informal enterprises do innovate. Innovations,
as found in formal enterprises as well, are not big swings, that is, not radical but incremen-
tal, and are found to occur over several years. These suggest that incremental innovations,
notwithstanding, are important to the survival of sampled informal enterprises.
Keywords: Innovation; Informal Sector; Survey; Ghana; sub-Saharan Africa.
JEL Codes: C83, D22, H32, L11, O17, O31.
∗Acknowledgement: I acknowledge the financial support provided for this research by UNU-MERIT.I would like to thank Pierre Mohnen and Maty Konte for their invaluable direction and comments. Iam also thankful to my team of researchers who assisted in the data collection, and all respondents whotook time off their busy schedule to share vital information about their enterprises. All errors remainsolely mine.†[email protected]/[email protected]

1 Introduction
Recent decades have seen growing interest in the promotion of innovation activities at all levels
of governance in Africa. The most recent of these policies is the ‘Science, Technology and
Innovation Strategy for Africa 2024 (STISA-2024)’, a short-term strategy adopted by the African
Union in 2014. These policies, in general, are laudable in the attempt to promote and foster
innovation-led development thinking in Africa. They, however, tend to ignore the ‘dualistic’
economic structure, and the economic and social significance of ‘hidden’ innovations in the
informal sector. Given the economic significance of the informal economy in Africa, particularly
sub-Saharan Africa (SSA), examining informal sector innovations is critical for SSA’s economic
and social progress (Iizuka et al., 2015). While some evidence now exists on innovations in the
informal sector in SSA (Bull et al., 2016; Essegbey and Awuni, 2016; Kraemer-Mbula, 2016; Fu
et al., 2015; Gebreeyesus and Mohnen, 2013; Konte and Ndong, 2012; Dawson, 1992, among
others), both data and empirical evidence remain sparse. This may be due to little policy and
research attention.
The objective of this paper is to present detailed information on a survey conducted in urban
Ghana, between May and June 2016, which gathered information on the innovation activities of
informal enterprises. The rest of the paper is organised as follows. The survey methodology is
presented in the next section (2), followed by descriptive statistics from our informal innovations
data set. The last section (3) concludes this descriptive paper.
2 Ghana informal innovations data set
2.1 Survey methodology
Data on informal enterprises and their activities remain scarce in Ghana. The World Bank’s
Informal Surveys provide data on informal enterprises in several developing countries. The
Ghana Informal Survey (GIFS) was conducted in 2013, with the aim of providing information on
the level of informal activity and reasons for informality. The GIFS, therefore, lacks information
on the innovation activities of informal enterprises. In the GIFS, five urban centres namely
Accra, Tema, Takoradi, Kumasi and Tamale were divided into 180 zones from which four
interviews were completed per zone. In total, the GIFS contains 729 firms with service and
manufacturing firms having equal proportions.
Due to the lack of sampling frame, our survey used zones identified in the GIFS as area-based
frame where we randomly selected 17 zones in two urban centers - Accra 9 zones and Tema 8
- at first stage. Zones constructed in the GIFS were deemed convenient to use, and were also
found to offer research design advantages thereby helping to minimise errors. Figure 1 presents
the heat map of all zones covered, both in Accra and Tema.
1

Figure 1: Heat map of all zones.
The second stage of sampling was done by ‘canvassing’ each selected zone and asking screening
questions such as the registration status of the enterprise (see Appendix A, Question number
SC.0). This involved knocking, introduction and asking of screening questions to identify infor-
mal enterprises at the first level. ‘Available’ owners/care-takers of identified enterprises were
then interviewed at the second level.1 This approach was found appropriate as it enabled the
team to easily differentiate informal enterprises from formal counterparts in locations where
such differences were not immediately obvious. This procedure also enabled the team to cover
small informal units that are mostly ignored in surveys (International Labour Office (ILO).,
2013). Figure 2 presents the aerial maps of some selected zones in Accra.
1 As is the case for case studies, owners/care-takers of identified enterprises were not representative of ourpopulation from the ‘statistical stance’. Our approach used purposive sampling to identify informal enterprises.
2

Figure 2: Aerial maps of selected zones in Accra.
Based on survey recommendations by Charmes et al. (2016), we conducted face-to-face inter-
views with owners/assigned care-takers based on a standard semi-structured questionnaire cov-
ering a host of issues such as enterprise registration status, sales, cost, business environment,
labour, registration and innovation activities.2 The survey instrument was prepared on the
guidelines of the Oslo Manual (3rd edition), with some questions adapted from similar projects
such as the NEPAD’s African Science, Technology and Innovation Indicator (ASTII) survey;
the World Bank’s Ghana Informal Surveys (GIFS); the World Intellectual Property Organiza-
tion (WIPO) project; the Diffusion of Innovation in Low Income Countries (DILIC) project;
Essegbey and Awuni (2016); Fu et al. (2014); and Konte and Ndong (2012).3 The interviews
were conducted in 4 languages, namely: English, Twi, Ga and Ewe. The objectives of the
survey and questions were explained to field assistants in a meeting in order to ensure common
understanding of terms and concepts when translating the survey instrument. The survey used
2 See Appendix A for survey questionnaire.3 Some questions were appropriately modified after pretesting in a zone in Kasoa, Central Region.
3
modern electronic data collection procedures and software (specifically, SurveyCTO) to collect
data. The use of SurveyCTO ensured that the data and other information obtained from the
field were of the highest quality in terms of reliability, credibility and utility. This software was
chosen because it was cost-effective, secure, efficient and practical for conditions in the field.
The survey focused on the innovation activities of enterprises between three-year period, which
is 2013-2015.
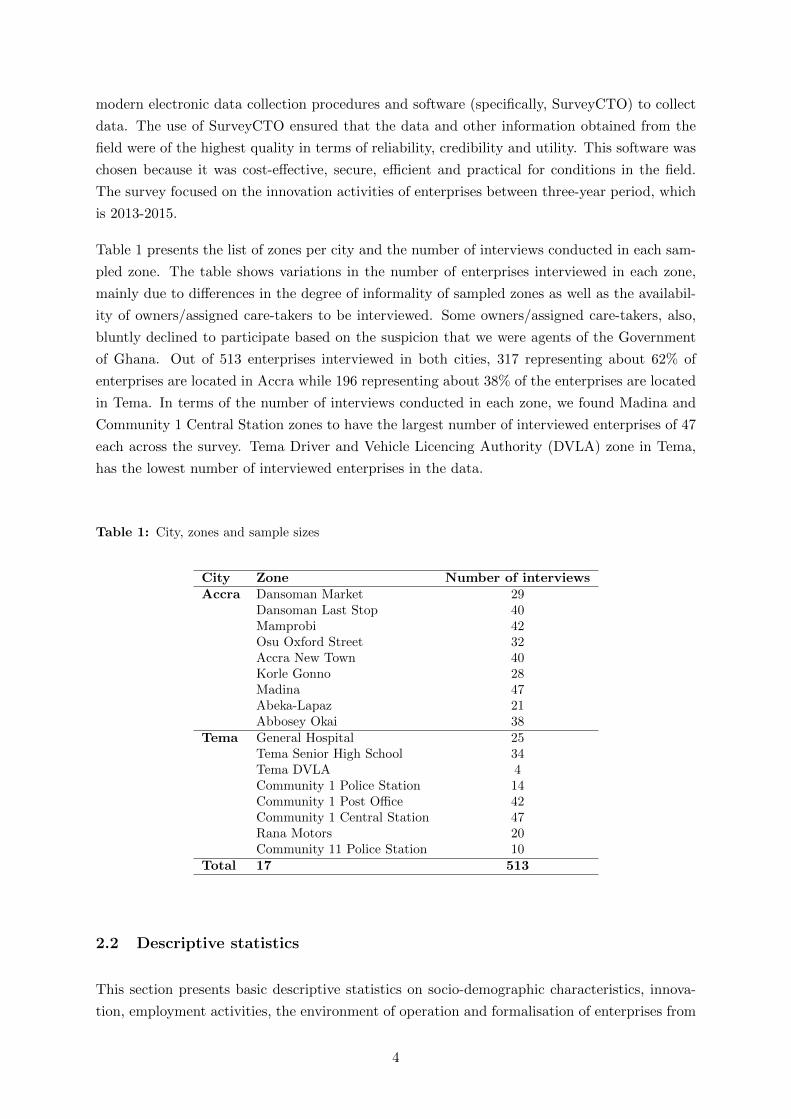
Table 1 presents the list of zones per city and the number of interviews conducted in each sam-
pled zone. The table shows variations in the number of enterprises interviewed in each zone,
mainly due to differences in the degree of informality of sampled zones as well as the availabil-
ity of owners/assigned care-takers to be interviewed. Some owners/assigned care-takers, also,
bluntly declined to participate based on the suspicion that we were agents of the Government
of Ghana. Out of 513 enterprises interviewed in both cities, 317 representing about 62% of
enterprises are located in Accra while 196 representing about 38% of the enterprises are located
in Tema. In terms of the number of interviews conducted in each zone, we found Madina and
Community 1 Central Station zones to have the largest number of interviewed enterprises of 47
each across the survey. Tema Driver and Vehicle Licencing Authority (DVLA) zone in Tema,
has the lowest number of interviewed enterprises in the data.
Table 1: City, zones and sample sizes
City Zone Number of interviewsAccra Dansoman Market 29
Dansoman Last Stop 40Mamprobi 42Osu Oxford Street 32Accra New Town 40Korle Gonno 28Madina 47Abeka-Lapaz 21Abbosey Okai 38
Tema General Hospital 25Tema Senior High School 34Tema DVLA 4Community 1 Police Station 14Community 1 Post Office 42Community 1 Central Station 47Rana Motors 20Community 11 Police Station 10
Total 17 513
2.2 Descriptive statistics
This section presents basic descriptive statistics on socio-demographic characteristics, innova-
tion, employment activities, the environment of operation and formalisation of enterprises from
4

our informal innovations data set.
2.2.1 Enterprise characteristics
Micro enterprises, defined as enterprises with less than 5 employees (owner included), are the
most prevalent in our data. Out of 513 enterprises interviewed, 337 representing about 65.7% are
micro-sized (<5), while about 32.6% and 1.7% are small-sized (5 &<10) and medium-sized(10
&<20) respectively (see Table 2). Table 2 also shows that the majority of interviewed enterprises
are owned by men (about 58%), with the remaining 42% owned by women. In terms of the
sector of activity, the data shows informal enterprises operate mainly in the service sector. The
descriptive statistics show that about 90% of enterprises in our data set provide services4 while
only about 10% of the enterprises make goods. Decomposing the sectors of economic activity,
our data shows 44.8% of enterprises in the service sector operate by selling food and groceries,
indicating the prevalence of retail. This could be due to the low entry cost into these activities.
The majority of these enterprises selling food and groceries are made up of local food joints
and multi purpose container provision shops selling a variety of products from sachet water,
Mcvities short bread cookies, ‘joy daddy’ bitters to red label whisky. From Table 2, we also
found that majority of manufacturing informal enterprises make clothes or shoes. Cloth makers
are tailoring shops operated by experienced tailors who specialise in sewing dresses, sometimes
embodied with local designs. Shoe makers render master shoe repair services, but also produce
sandals and ‘flip-flops’ using locally made machines and raw materials. Family-owned businesses
are less represented in our data as well, with only 21.4% prevalence.
4 Services refers to retail services and non-retail services (other services) following the Enterprise Survey (ES)of the World Bank.
5

Table 2: Characteristics of informal enterprises
Number Proportion in %
Size of business
Micro (<5) 337 65.69
Small (5 &<10) 167 32.55
Medium (10 &<20) 9 1.75
Sex of owner
Male 300 58.48
Female 213 41.52
Main activity
Making goods (Manufacturing) 49 9.55
Clothes or shoes 36 7.02
Baked food 3 0.58
Handcrafts 2 0.39
Furniture 3 0.58
Metal products 3 0.58
Household items 2 0.39
Selling goods or services (Services) 464 90.45
Food or groceries 230 44.83
Clothes or household items 63 12.28
Computer/phone accessories 31 6.04
Transport services 1 0.19
Hairdressing and barbering 48 9.36
Professional services 14 2.73
Repairing services 33 6.43
Other services (not included above) 44 8.58
Family business
Yes 110 21.44
No 403 78.56
2.2.2 Innovation and innovation activities
The overarching goal of our survey was to gather information on informal enterprises’ innova-
tions and innovation activities. As a result, information was collected on various output and
input indicators of innovation. While several definitions exist, our survey followed broadly sta-
tistical definitions in the Oslo Manual (OECD and Eurostat, 2005, Chapter 3). This section
presents the descriptive statistics of some innovation indicators obtained from our survey.
Table 3 shows the descriptive statistics of informal innovation indicators between 2013-2015.
Product innovations are prevalent in informal enterprises, with about 73% of interviewed en-
terprises introducing at least one product innovation. Average percentage sales due to all new
products is about 20% during the period under study. Ideas for new products mainly originate
in-house, with 88% of sampled enterprises indicating ‘enterprise’ as the main source of idea for
6

Table 3: Innovation activities of informal enterprises
Number Proportion (%)
Product innovationProduct innovators 372 72.51% of sales due to all innovative products (mean) - 19.516
Source of idea for innovative productOther informal businesses 183 49.19Formal firms 38 10.22Consumers/clients 295 79.51Enterprise itself 327 88.14
Attempts to develop new productsSuspended before completion 157 30.60Still ongoing 201 39.18
Increase product range innovators 346 93.01Open new market or increase market share innovators 342 91.94
Process innovationProcess innovators 172 33.53
Innovative methods of manufacturing products 154 89.53Innovative logistics, delivery or distribution for products 81 47.09Supporting activity for processes 72 41.86
Source of idea for innovative processOther informal businesses 45 26.16Formal firms 22 12.87Consumers/clients 97 56.40Enterprise itself 139 80.81
Quality-improving innovators 143 83.14Efficiency-improving innovators (production and offering service) 146 84.88Efficiency-improving innovators (customer delivery) 142 82.56
Marketing innovationMarketing innovators 452 88.11
Packaging 54 12.05Branding, logo, name or trademark 98 21.83Products appearance exclusing packaging and branding 72 16.04Advertising methods 79 17.52Promotion of the products 79 17.59Sales channels or sales points 148 32.82Discount schemes 341 75.61Pricing strategies, excluding discount schemes 244 53.98Customer loyalty rewards 419 93.11Payment schemes 262 58.22
Purchase new equipment/software for innovation activityYes 76 14.84No 436 85.16
7

innovative product. Consumers and clients also serve as an important source of ideas for new
products for about 80% of interviewed enterprises. Ample proportion of enterprises are still
undertaking innovation activities with about 39% of enterprises involved in on-going attempts
to introduce new products. Some enterprises, about 30%, have also indicated abandoning in-
novation activities. This shows that not all innovation activities actually result in innovation.
There are several reasons why an enterprise may introduce product innovation. In our data,
we found enterprises innovate largely for 2 main reasons. The first is to increase the range of
products offered by the enterprise, and the second is to open or improve market share. Our
data shows 93% of interviewed enterprises introduced product innovation with the intention of
increasing product range, while 92% innovated in order to improve market share.
Process innovation is low in our sampled informal enterprises. Out of the 513 enterprises
interviewed, 172 representing about 33.5% of enterprises introduced at least one of three process
innovations. Our data show majority of process innovators, about 90%, introduced innovative
methods of manufacturing products or offering services. Ideas for process innovations mainly
originate from within informal enterprises, with 81% of enterprises acknowledging the role of
in-house ideas in generating knowledge for process innovations. Clients and customers also
play an important role in generating process innovations. About 56% of interviewed enterprises
cited consumers/clients as the source of idea for their innovative process. Process innovations
can be intended for several reasons. From our data, we found informal enterprises introduced
process innovation mainly to improve quality of products (about 85% of interviewed enterprises),
followed by the intention to improve efficiency of the production and serving offering methods
(about 83% of interviewed enterprises) as well as improving customer delivery methods (about
83% of interviewed enterprises).
Marketing innovations are widespread in our data. This may be due to the large number of
service enterprises in our data. Table 3 shows about 88% of interviewed enterprises introduced
at least one type of marketing innovation. Customer loyalty rewards are the most dominant
marketing innovation with about 93% of our sampled enterprises introducing it. Discount
schemes and payment schemes are as well prevalent marketing innovations in our data.
Innovation is an output that requires innovation inputs. During our survey, we asked if enter-
prises have purchased new equipment, machinery, or software to develop or produce innovative
products and/or processes (see Appendix A, Question E2). Responses from enterprises indicate
low levels of input activity with only about 15% of interviewed enterprises acquiring machinery
and softwares for innovation.
To further understand the specific innovations introduced by enterprises, we asked innovative
enterprises to describe their main product and process innovations (see Appendix A, Questions
B.5 and C.4). We identified variations across innovative enterprises with regard to the types of
innovations (product and process) developed or adopted.
8

Table 4: Examples of innovations
Type of innovation Description of main innovative activity
Product
Goods
Making of ‘stuffing’ chairs
New material to produce ‘kente’ cloth
Making of new flip-flops for funerals
Using electronic spare parts to produce wall clock
New designs to furniture and clothing
Introduction of a new washing powder
Services
Vulganising services
Remote and home maintenance
Introduction of home services
Car alarm services
House roofing services
Phone repair services
Mobile money payment methods
Process
Introduction of new machines- carving machines, steriliser,
embroidery machine, bead polishing machine, etc.
Software to keep inventory and records of clients
Delivery methods - new methods to order ‘materials’, office
delivery, text messages, etc.
Table 4 presents examples of product and process innovations introduced by enterprises, and it
indicates that sampled enterprises mainly introduced new-to-enterprise innovations. For exam-
ple, a manager of an enterprise selling secondhand car tires indicated to have added vulganising
services to his business during the period under consideration. An enterprise that produces
bathing soaps also indicated to have introduced washing powder entirely based on their ex-
isting knowledge and intermediate products. Process innovations such as the introduction of
new machines for embroidery, ironing, cutting, and styling hair, were found to be dominant
among enterprises engaged in sewing, cutting and dressing of hair. Innovations such as the
introduction of office food delivery services (process innovation) and mobile money payment
services (product innovation), were found to be most prevalent among enterprises engaged in
selling food and groceries.
2.2.3 Labour
The economic significance of informal enterprises in SSA cannot be overemphasised. The infor-
mal economy dominates economic activity in SSA. In spite of this, data remain largely scarce on
the labour market activities of informal enterprises. In our survey, we gathered comprehensive
9

information on the employment activities of our sampled enterprises. Descriptive statistics are
shown in Table 5. The period under consideration witnessed increase in average total employ-
ment in sampled enterprises. Our data show total employment, on the average, increased from
2.44 workers in 2013, to 3.62 workers in 2015. The type of employment created matters. On the
average, permanent employment increased from 1.95 in 2013, to 2.6 in 2015. The data, however,
indicate a drop in the share of permanent employment in total employment from about 90% in
2013, to 80% in 2015. Temporary employment also increased on the average in all enterprises
from 0.5 in 2013, to about 1.1 in 2015. The period also witnessed an increase in the share of
temporary employment in total employment, increasing from 10.23% in 2013, to 20.25% in 2015.
While we see an increase in all types of employment, our descriptive statistics suggest decreasing
share of permanent employment in sampled enterprises over the period under consideration.
Security of employment is important for the welfare of workers. Our survey sought also to find
out the proportion of informal workers covered by social security. The data show only 6.48% of
enterprise owners have social security, with the proportion decreasing drastically to 1.12% and
0.2% when we consider permanent and temporary workers, respectively.
Table 5: Employment activities of informal enterprises, 2013-2015
Mean Share % Std. Dev. Min Max
Total employment in 2015 3.62 100 2.37 1 18
Permanent employment 2.56 79.75 1.39 1 11
Temporary employment 1.06 20.25 1.50 0 15
Number of apprentices .191 3.20 .809 0 8
Total employment in 2013 2.44 100 1.95 1 14
Permanent employment 1.949 89.77 1.33 1 13
Temporary employment .49 10.23 1.31 0 12
Social security cover
Owner .065 6.48 .246 0 1
Permanent workers .012 1.12 .108 0 1
Temporary workers .002 0.20 .044 0 1
2.2.4 Business environment
In the course of their daily activities, informal enterprises, like their formal counterparts, face
many operational hurdles. These obstacles affect the performance of informal enterprises in
diverse ways. While data and empirical evidence remain sparse, our survey gathered information
on the degree to which some of these obstacles affect the operations of informal enterprises.
Descriptive statistics reported in Table 6 indicate sampled enterprises face 3 main obstacles:
competition from informal enterprises, access to land, and lack of electricity and water. 327
enterprises, representing about 64% of all interviewed enterprises, indicated competition from
informal enterprises as an obstacle, with about 75% of these enterprises indicating competition
10

Table 6: Obstacles to informal enterprise operations
Number of enterprises Proportion in %Competition from formal firms 215 41.91
Minor 52 24.19Moderate 6 2.79Major 157 73.02
Acces to finance 230 44.83Minor 36 15.65Moderate 12 5.22Major 182 79.13
Access to land 324 63.16Minor 49 15.12Moderate 12 3.70Major 263 81.17
Corruption 42 8.19Minor 21 50.00Moderate 3 7.14Major 18 42.86
Crime, theft, disorder 197 38.40Minor 88 44.67Moderate 17 8.63Major 92 46.70
Poor public insfrastructure 156 30.41Minor 70 44.87Moderate 17 10.90Major 69 44.23
Low demand for products 256 49.90Minor 52 20.31Moderate 12 4.69Major 192 75.00
Lack of electricity and water 296 57.70Minor 54 18.24Moderate 12 4.05Major 230 77.71
Competition from other informal enterprises 327 63.74Minor 73 22.32Moderate 8 2.45Major 246 75.23
11

from informal enterprises serve as a major obstacle to their operations. This may be due to
the fact that informal enterprises mostly tend to be: clustered at the same location, similar
in size, and tend to compete for the same customers. Access to land remains an obstacle to
informal enterprises. About 63% of enterprises indicated difficulty in accessing land for business.
Out of this percentage, about 81% indicated access to land is, actually, a major hurdle to their
operations. Frequent outage of power (electricity), locally known as ‘dumsor’, and lack of flowing
water are persistent problems in Ghana. They affect operations of informal enterprises with 296
enterprises, representing about 58%, indicating the lack of power and water as obstacles to their
businesses. Our data show 3 obstacles: crime, theft and disorder, poor public infrastructure,
and corruption are the least hurdles to the operations of informal enterprises.
2.2.5 Registration
How to formalise informal enterprises in developing countries remain a development question.
During our survey, we asked informal enterprises if they would want to formalise, and reasons
for their informality (see Appendix A, Section I). Table 7 shows 347 enterprises, making up
about 68%, indicated they would like to be registered. Asking why they are not registered,
we found: long registration procedure, lack of information about registration, registration fees,
taxes, and lack of benefits in registration as some of the main reasons for informality. Of
particular interest here, is the obvious disagreement between the proportion of enterprises who
would like to register (about 68%) and the proportion who indicated there are no benefits to
registration (about 60%). This may be as a result of desirability bias due to the perception that
informality is undesirable.
Table 7: Reasons for informality
Number of enterprises Proportion in %
Register business (formalise) 347 68.31
Reasons for informality
Lack of registration information 362 72.26
Registration procedure (time) 363 73.19
Rgistration fees 355 71.00
Taxes 333 66.60
Inspections 289 57.57
Bribes 175 34.93
No benefit to enterprise 302 60.28
3 Conclusion
Our informal innovations survey in urban Ghana (Accra and Tema) aimed at providing insights
into the innovation activities of informal enterprises, and also to examine research and policy
12

ideas on how to enhance these innovation activities. This paper presents basic descriptive
statistics from the survey.
Randomly selecting 17 zones and canvassing each zone for informal enterprises, we were able
to interview 513 enterprises. Our descriptive statistics show our sampled enterprises are mostly
micro(<5) in size. Product innovations are found to be pervasive in informal enterprises, with
in-house ideas as the main source of innovative products. In terms of employment, we found
only few informal workers have social security, with the share of temporary employment in
total employment increasing between 2013-2015. Enterprises are found to be affected by 3 main
obstacles: competition from informal enterprises, access to land, and lack of electricity and
water. While we found enterprises to have the desire to formalise: long registration procedure,
lack of information about registration fees, taxes, and lack of opportunities after registration,
remain some of the main reasons for informality. Further empirical research exploring the main
findings in this paper could be insightful.
13

References
Bull, C., Daniels, S., Kinyanjui, M., and Hazeltine, B. (2016). A Study of the Informal Met-
alworking Sector in Nairobi. In Kraemer-Mbula, E. and Wunsch-Vincent, S., editors, The
Informal Economy in Developing Nations: Hidden Engine of Innovation?, pages 100–145.
Cambridge University Press, Cambridge.
Charmes, J., Gault, F., and Wunsch-Vincent, S. (2016). Formulating an Agenda for the Mea-
surement of Innovation in the Informal Economy. In Kraemer-Mbula, E. and Wunsch-Vincent,
S., editors, The Informal Economy in Developing Nations: Hidden Engine of Innovation?,
pages 336–370. Cambridge University Press, Cambridge.
Dawson, J. (1992). The Relevance of the Flexible Specialisation Paradigm for Small-Scale
Industrial Restructuring in Ghana. IDS Bulletin, 23(3):34–38.
Essegbey, G. O. and Awuni, S. (2016). Herbal Medicine in the Informal Sector of Ghana.
In Kraemer-Mbula, E. and Wunsch-Vincent, S., editors, The Informal Economy in Devel-
oping Nations: Hidden Engine of Innovation?, pages 194–231. Cambridge University Press,
Cambridge.
Fu, X., Mohnen, P., and Zanello, G. (2015). Innovation, informality, and firms’ growth in
low-income countries. TMD working paper 72. TMCD, Oxford, UK.
Gebreeyesus, M. and Mohnen, P. (2013). Innovation Performance and Embeddedness in Net-
works: Evidence from the Ethiopian Footwear Cluster. World Development, 41:302–316.
Iizuka, M., Mawako, P., and Gault, F. (2015). Innovation for Development in Southern and
Eastern Africa: Challenges for Promoting ST&I Policy. UNU-MERIT Policy Brief 1.
International Labour Office (ILO). (2013). Youth unemployment rate estimates and projections
by region 2007-2017. Technical report, International Labour Office, Geneva.
Konte, A. and Ndong, M. (2012). The informal ICT sector and innovation processes in Senegal.
African Journal of Science, Technology, Innovation and Development, 4(3):61–97.
Kraemer-Mbula, E. (2016). Informal Manufacturing of Home and Personal Care Products in
South Africa. In Kraemer-Mbula, E. and Wunsch-Vincent, S., editors, The Informal Economy
in Developing Nations: Hidden Engine of Innovation?, pages 146–193. Cambridge University
Press, Cambridge.
OECD and Eurostat (2005). Oslo Manual. Guidelines for collecting and interpreting innovation
data. Organisation for Economic Co-operation and Development, Paris, 3rd edition.
14
Appendix A
Field Questionnaire
Brief description of study
Recent studies find innovation to be pervasive in the informal economy. This project’s over-
arching goal is to understand the types of innovations informal firms use and adapt to answer
customers changing needs and demands. The project also aims to provide evidence on the role
of networks and apprenticeship in learning, adopting and adapting innovations in the informal
sector and the labour market implications.
This survey aims to collect valuable information on these variables and the information collected
from this survey will be used strictly for academic purposes to understand the current situation
for improving policy. The study guarantees absolute anonymity of your business and personal
details.
Your kind attention and cooperation is much appreciated.
If you have further queries, please contact Elvis Korku Avenyo ([email protected]).
15

16

17

18

19

20

21

22

23

24

25

The UNU‐MERIT WORKING Paper Series 2018-01 The serendipity theorem for an endogenous open economy growth model by
Thomas Ziesemer 2018-02 Instability constraints and development traps: An empirical analysis of growth
cycles and economic volatility in Latin America by Danilo Sartorello Spinola 2018-03 Natural, effective and BOP‐constrained rates of growth: Adjustment mechanisms
and closure equations by Gabriel Porcile and Danilo Sartorello Spinola 2018-04 The relevance of local structures for economic multiplier effects of social pensions
in Uganda by Maria Klara Kuss, Franziska Gassmann and Firminus Mugumya 2018-05 Regulating the digital economy: Are we moving towards a 'win‐win' or a 'lose‐
lose'? by Padmashree Gehl Sampath 2018-06 The economic impacts of a social pension on recipient households with unequal
access to markets in Uganda by Maria Klara Kuss, Patrick Llewellin and Franziska Gassmann
2018-07 The effect of weather index insurance on social capital: Experimental evidence from Ethiopia by Halefom Y. Nigus, Eleonora Nillesen and Pierre Mohnen
2018-08 Evaluating intergenerational persistence of economic preferences: A large scale experiment with families in Bangladesh by Shyamal Chowdhury, Matthias Sutter and Klaus F. Zimmermann
2018-09 Agricultural extension and input subsidies to reduce food insecurity. Evidence from a field experiment in the Congo by Koen Leuveld, Eleonora Nillesen, Janneke Pieters, Martha Ross, Maarten Voors and Elise Wang Sonne
2018-10 Market integration and pro‐social behaviour in rural Liberia by Stephan Dietrich Gonne Beekman, and Eleonora Nillesen
2018-11 Sanctioning Regimes and Chief Quality: Evidence from Liberia by Gonne Beekman, Eleonora Nillesen and Maarten Voors
2018-12 Chinese development assistance and household welfare in sub‐Saharan Africa by Bruno Martorano, Laura Metzger, Marco Sanfilippo
2018-13 Foreign direct investment in sub‐Saharan Africa: Beyond its growth effect by Hassen Abda Wako
2018-14 Fluctuations in renewable electricity supply: Gains from international trade through infrastructure? by Thomas Ziesemer
2018-15 What is the potential of natural resource based industrialisation in Latin America? An Input‐Output analysis of the extractive sectors by Beatriz Calzada Olvera and Neil Foster‐McGregor
2018-16 Global Value Chains and Upgrading: What, When and How? by Padmashree Gehl Sampath and Bertha Vallejo
2018-17 Institutional factors and people's preferences in the implementation of social protection: the case of Ethiopia by Vincenzo Vinci and Keetie Roelen
2018-18 Towards a European full employment policy by Jo Ritzen and Klaus F. Zimmermann 2018-19 Drivers of growth in Tunisia: Young firms vs incumbents by Hassan Arouri, Adel
Ben Youssef, Francesco Quatraro and Marco Vivarelli 2018-20 Africa Sector Database (ASD): Expansion and update Emmanuel Buadi Mensah
and Adam Szirmai 2018-21 Combatting corruption in higher education in Ukraine by Anna Vasylyeva and
Ortrun Merkle

2018-22 What more can we learn from R&D alliances? A review and research agenda by Andrea Martinez‐Noya and Rajneesh Narula
2018-23 Perpetual growth, distribution, and robots Önder Nomaler and Bart Verspagen 2018-24 R&D, embodied technological change and employment: Evidence from Spain
Gabriele Pellegrino, Mariacristina Piva and Marco Vivarelli 2018-25 Structural change, productivity growth and labour market turbulence in Africa by
Emmanuel Buadi Mensah, Solomon Owusu, Neil Foster‐McGregor and Adam Szirmai
2018-26 Domestic quality certification and growth of Vietnamese MSMEs by Elisa Calza and Micheline Goedhuys
2018-27 Knowledge convergence in European regions: Towards a cohesion? By Semih Akçomak, Erkan Erdil and Umut Yılmaz Çetinkaya
2018-28 Modern industrial policy and public‐private councils at the subnational level: Mexico's experience in an international perspective by Robert Devlin and Carlo Pietrobelli
2018-29 The Eurasian customs union and the economic geography of Belarus: A panel convergence approach Mehmet Güney Celbi Pui‐Hang Wong and Tatjana Guznajeva
2018-30 Informal sector innovation in Ghana: Data set and descriptive analysis by Elvis Korku Avenyo