Working Paper Series The growth of outward FDI and the competitiveness of the underlying economy:...
43
#2013-042 The growth of outward FDI and the competitiveness of the underlying economy: the case of India Rajneesh Narula and Tiju Prasad Kodiyat Maastricht Economic and social Research institute on Innovation and Technology (UNU‐MERIT) email: [email protected] | website: http://www.merit.unu.edu Maastricht Graduate School of Governance (MGSoG) email: info‐[email protected] | website: http://mgsog.merit.unu.edu Keizer Karelplein 19, 6211 TC Maastricht, The Netherlands Tel: (31) (43) 388 4400, Fax: (31) (43) 388 4499 Working Paper Series
Transcript of Working Paper Series The growth of outward FDI and the competitiveness of the underlying economy:...

#2013-042
The growth of outward FDI and the competitiveness of the underlying economy: the case of India
Rajneesh Narula and Tiju Prasad Kodiyat Maastricht Economic and social Research institute on Innovation and Technology (UNU‐MERIT) email: [email protected] | website: http://www.merit.unu.edu Maastricht Graduate School of Governance (MGSoG) email: info‐[email protected] | website: http://mgsog.merit.unu.edu Keizer Karelplein 19, 6211 TC Maastricht, The Netherlands Tel: (31) (43) 388 4400, Fax: (31) (43) 388 4499
Working Paper Series

UNU-MERIT Working Papers
ISSN 1871-9872
Maastricht Economic and social Research Institute on Innovation and Technology, UNU-MERIT
Maastricht Graduate School of Governance
MGSoG
UNU-MERIT Working Papers intend to disseminate preliminary results of research
carried out at UNU-MERIT and MGSoG to stimulate discussion on the issues raised.

1
The growth of outward FDI and the competitiveness of the
underlying economy: the case of India
Rajneesh Narula and Tiju Prasad Kodiyat
John H. Dunning Centre for International Business Henley Business School University of Reading
15 August 2013
Abstract: There has been an impressive spurt in the outward FDI activity of Indian MNEs since the 1990s. However, despite the rhetoric, this growth has not been exceptional, when compared to other similarly developed countries. Received economic arguments propose that successful outward investors tend to be the most competitive domestic firms in their home economy. Their firm-specific assets tend to be a function of the political economy and economic structure of the home economy. In IB terms, this means that the ownership-specific assets of Indian multinationals are a subset of the ownership assets of their parent companies, which in turn are largely determined by the location-specific assets of the home economy.
The evidence suggests that the strengths and weaknesses in the location assets of India have caused pockets of excellence to emerge, but that these conditions do not lend themselves to a broader growth in competitiveness, meaning that further rapid growth is ultimately not sustainable. Systematic upgrading and radical policy changes are needed to build up India’s knowledge infrastructure and institutions to support a shift in India’s competitive advantages to new sectors outside these pockets. This ultimately means a policy emphasis on the manufacturing sector, and within that, promoting a shift from low-tech to higher technology manufacturing sectors, and a strengthening of the formal sector.
Keywords: India, innovation systems, comparative advantage, competitiveness, MNEs, infrastructure, globalization, location advantages JEL: F23, F68, O32.

2
Introduction
The growing international competitiveness of firms from developing countries has become –
once again – an important issue in academic and public policy circles. The idea that the
dominant economic bloc shaping the world economy might radically shift due to the advent
of powerful new economies is a perennially recurring theme: the rise of Japanese MNEs in
the 1970s and 1980s, followed by the rapid growth of MNEs from Asian NICs in the 1990s
(in particular, Korea, Hong Kong and Taiwan) also triggered similar soul-searching. It is a
human failing that we exaggerate our current conundrums, ignoring history at our peril.
This paper takes a rational look at the evidence on the growth of outward FDI (OFDI) activity
by Indian firms. Applying basic principles (see Cantwell 1989, Lall 1992, Narula 1996,
2012), the competitiveness of firms from a given economy derives from the competitiveness
of their home economy. That is to say, the ownership-specific (O) assets of firms are a
function of the economic, social and political milieu of the location where their strategic
activities are based (normally their home country), known as location-specific (L) assets in
the IB literature.
We propose that there is an irrational exuberance about the exceptionalism of Indian outward
FDI, and prospects for its long-term growth. India’s MNEs are a reflection (and a function) of
the Indian economy, and the home country plays a fundamental role in shaping the
competitiveness of its firms, both at home and abroad. In this case, we show that on a macro
level, India’s performance is not different from countries of similar economic structure and
development, and its pockets of excellence are a reflection of its L assets, but that these assets
are insufficient to foster more growth in the long term. Relying on secondary data, this paper
examines the L assets of India relative to other significant outward investor countries, and
demonstrates that there are systemic weaknesses which constrain the long-term
competitiveness of its firms, and ultimately, the competitiveness of its MNEs. Based on our
analysis, the pockets of excellence that drove Indian outward FDI since liberalization are
unlikely to continue to do so.
Examining India’s outward FDI in relative terms
In this section we examine India’s OFDI stock levels relative to other economies. The OFDI
stock of India increased from $0.1 billion in 1991 to $2.5 billion in 2000, and surged to an
accumulated investment of $111.2 billion by 2011 (Table 1). However, the data in Table 1

3
places the Indian story in perspective. First, outward FDI from India – even in absolute terms
– remains modest. In 2011 it was about a third that of China and Singapore ($365 billion and
$339 billion respectively), half that of Brazil ($202 billion), and almost on par with Malaysia
and Mexico ($106 billion and $112 billion respectively). It is true that it has grown rapidly: in
2001, India’s OFDI stock was about the same level as Thailand, and a tenth of Argentina’s.
However, it is a little unfair to compare absolute levels of FDI stocks, without considering the
capacity or the potential of an economy to generate outward FDI, which is a function of the
competitiveness of its economic actors, and therefore that country’s underpinning economy.
States (like other economic actors) are constrained by their resources, and by extension a
small economy (in terms of land area, population or resources) will have a proportionally
smaller firm sector, and only a percentage of these firms will be internationally competitive
and able to sustainably invest abroad. On the other hand, there are certain advantages
bestowed due to a larger economic size. It is for this reason that Table 1 also gives OFDI on a
per capita basis. On this basis, India has underperformed given its potential, relative to its
size. Its outward FDI stock on a per capita basis remains the lowest of these countries (with
the exception of Indonesia) in all three periods, having increased from just $0.1 to $89.6 over
the thirty year period. During the same period China’s per capita OFDI increased from a
negligible level to $271.6. Even in 2011, India’s per capita OFDI stock was less than
countries such as Thailand, Argentina, Colombia, Venezuela, and transition economies of the
erstwhile Soviet Union.
[Insert Table 1 here]
The O assets of Indian MNEs and the competitiveness of its home economy
At the heart of internationalization of any firm remain their O assets. Sustaining
competitiveness requires upgrading O assets which in turn is dependent on innovation, and
this requires research and development (R&D), and a supportive external environment of the
firm (i.e., L assets). Firms have to continuously innovate and upgrade their technological
capabilities to avoid falling behind competitors, and countries have to continuously invest in
upgrading their technological infrastructure. Moreover, technological capability and
production capacity are interdependent because the former generates the latter, and vice versa
(e.g. Bell and Pavitt, 1997). Investment in R&D provides new knowledge for the firm as well
as the absorptive capacity required to acquire, assimilate, adapt, and apply new knowledge.
Firms that conduct their own R&D are better at assimilating external knowledge, and
4
absorptive capacity is developed as a by-product of the firm’s R&D investment (Cohen and
Levinthal, 1990).
The technological activities undertaken by firms in a location reflect the level of
technological advancement in that location, and the specialization of firms and their
competitiveness is reflected in the specialization and areas of competitiveness of the home
country. In other words, the specialization of a country’s firms can be identified by
examining the specialization at the aggregate level.
Examining India’s aggregate expenditures on R&D gives a good indication of its
competitiveness. India’s R&D intensity was 0.7 per cent in 2010 which was lower than
countries like China (1.7 per cent), Brazil (1.2 per cent), Russia (1.2 per cent), and much
lower than developed and newly industrialized countries1 (UNESCO, 2012). India’s R&D
intensity has remained almost constant in the last two decades, while other major developing
countries have increased their spending significantly. For instance, China’s R&D intensity
increased from 0.5 per cent in 1996 to 1.0 per cent in 2002, and 1.7 per cent in 2010. India’s
per capita R&D expenditure was also much lower than major developing and developed
countries. In 2007, India’s per capita R&D expenditure was $20.7 while that of China and
Brazil were more than 5 times, and Russia’s 11 times more than India2 (UNESCO, 2012).
Another indicator of the technological capabilities of a location is the patents its firms
receive. At the aggregate level, during 2008-2012 the US Patents and Trademarks Office
(USPTO) granted 5336 patents to Indian assignees. In terms of sectors, information
technology (IT), software, electronics, pharmaceutical and engineering held more than 85 per
cent of patents.
The evidence on India’s areas of competitiveness can be discerned from examining its
exports and growth of value added activity. India’s exports in manufacturing had risen in the
10 years between 2001 and 2010 from 0.79 per cent of the global total to 1.76 per cent. High-
tech manufacturing exports also rose over the same period from 0.2 per cent to 0.65 per cent
(NSF, 2012), accounting for approximately 11 per cent of all exports. However, in 2001 the
share of high tech sectors was about 60 per cent, indicating that low tech exports had grown
at a much faster pace than high-tech sectors. Indeed, high-tech manufactures grew in current
prices at only about 0.5 per cent per annum over the 10-year period. High tech exports were
1, 2 See also Table 6 on knowledge infrastructure indicators.

5
worth $18.2 billion in 2010. Of this, about 43 per cent were from the pharmaceutical sector
and 34 per cent from the communications, computer and office machinery sectors. To place
India’s competitiveness in context, the high-tech exports of the Philippines were $28 billion
in 2010, and Indonesia’s just under $12 billion. By and large, India has a revealed
comparative advantage – as expected from a country in this stage of economic development -
in Hecksher-Ohlin and Ricardian sectors, which rely on the processing of natural resources
and scale-intensive production of standardized goods, both of which require low
technological content (Burange and Chaddha, 2008; Narula and Dunning, 2000), with a
comparative disadvantage in knowledge intensive sectors – and this trend has not changed
(Kumar and Gupta, 2008).
However, the high-tech manufacturing exports data excludes software and services. India’s
share of global value added activity in all high-tech sectors (including IT services and
software) increased from 0.71 per cent in 2001 to 1.54 per cent in 2010 (NSF 2012).
Focusing even closer on global value-added in commercial knowledge-intensive services,
India’s share in 2010 was 2.1 per cent. Nonetheless, given that services activity is often
provided closer to the customer, this implies that the competitiveness of Indian firms is not
revealed by examining domestic value added or exports.
This data clearly reveals that India’s competitiveness is in a few pockets of excellence, and
with the exception of pharmaceuticals and biotech, India has few high-tech manufacturing
strengths. Indeed, Table 2 gives the R&D intensity of Indian-based firms in several sectors,
and the benchmark international R&D intensity in these same sectors. The four highest R&D
intensities for India were in pharmaceuticals, chemicals, food products, and motor vehicles.
With the exception of food products, no Indian sector comes close to the global R&D
intensity.
[Insert Table 2 here]
The pharmaceutical sector may have had the highest R&D intensity among Indian
companies, but this was still half of its counterparts in the rest of the world (Table 2). Table 3
gives details of the R&D intensity of the largest Indian R&D spenders in 2011, but even here,
the highest R&D intensity was 7.3 per cent (in the pharmaceutical sector). Infosys was the
highest R&D spender in absolute terms in India in 2011 (but with a R&D intensity of just 5.3
per cent). Indian companies in the oil and gas, and iron and steel industries also had high

6
R&D expenditures but had lower R&D intensities than their international counterparts
located elsewhere (Table 3).
[Insert Table 3 here]
Table 4 gives details of patents granted to firms based in India between 2008 and 2012, and
suggests that 3450 US patents granted were to 91 subsidiaries of foreign MNEs. That is, 77
per cent of all patents granted were to foreign firms. Just 45 Indian firms accounted for 688
patents over the same four year period, and 90 per cent of patents to private firms were in two
sectors: pharmaceuticals and IT/software (Table 4). There was only one Indian firm in the 20
largest Indian patent assignees in that period, compared to eight out of the first 20 in China.
The patent data for Indian companies indicate that they had not fully leveraged India’s
location advantages for R&D while foreign multinationals had.
[Insert Table 4 here]
The structure of R&D performers suggests that MNEs control a disproportionately large
share of R&D activity. Estimates are that close to 60 per cent of expenditures in R&D were
made by large Indian business groups, 15 per cent by SOEs, and less than 10 per cent by
MNEs (NISTADS 2008). The following industrial sectors accounted for the majority of R&D
expenditures (in order of significance): Pharmaceuticals, transportation equipment, defence,
electrical and electronic equipment, chemicals, fuels, and IT and software. These are the
same sectors (with the exception of defence) in which India’s OFDI is concentrated. Indeed,
of the more than 1100 M&As by Indian firms in 2011-12, the majority were by software and
business service companies, pharmaceutical and chemical companies and auto parts and
machinery. In other words, the sectors with higher levels of R&D and patenting are also the
sectors which have internationalized the most.
The data reviewed in this section make clear that only a few industries in India are
internationally competitive, with the commensurate innovation capabilities to sustain this.
These industries have higher R&D intensity and patenting levels than others, leading to the
creation of ‘pockets of excellence’. Most of the rapidly internationalising Indian MNEs of the
last two decades are concentrated in these sectors.
How home country L assets shape the competitive advantages of firms

7
Our primary argument rests around the interrelatedness of the home country’s L assets and
the international competitiveness of its firms. Economic development of any given nation
and the growth of its firm sector co-evolve, meaning that lesser developed economies tend to
have a smaller and less competitive firm sector. By extension, such an economy will have
fewer firms that possess O assets which will permit them to engage in viable outward direct
investment, and many of the competitive advantages of domestic firms will be location-
bound. Simply being capital-rich and in the absence of strong non-location bound O assets
permits foreign investment, but not foreign direct investment. Resource-rich countries may
acquire assets and firms in foreign locations, for instance through sovereign wealth funds or
state-owned enterprises. However, such acquisitions are akin to portfolio investments, where
control of these foreign assets is not on-going and actively or systematically coordinated and
managed (as indeed is the case with the ‘direct investments’ associated with a number of
middle-eastern oil-exporting economies) and therefore are not ‘multinational enterprises’ in
the sense that we understand.
The fundamental basis of these principles of economic theory has not changed with
globalization. Countries demonstrate a broadly similar economic structure (and set of L
assets) at different levels of economic development, and also a similar degree of
competitiveness of their domestic economic actors (and therefore its MNEs), given
exogenous limitations due to their resources constraints or abundance (Dunning 1981, Narula
1996, Narula and Dunning 2000, 2010).
From a more general (and IB) perspective, the relationship between outward FDI and the
home country can be stated as follows (Narula 2012). Internationalization requires O assets,
and the ability to be competitive in overseas markets depends on acquiring, maintaining and
developing these assets. The home country plays a significant role in constraining and
defining the kinds of assets an MNE possesses, and provide the initial conditions for its
international expansion. These ‘initial conditions’ are the L assets of a country. There are of
course inevitable differences in the L assets between home countries, because countries have
different resource endowments, innovation systems and political economies, and as such
there are differences in the economic structure of different home countries, and by extension,
the sectors in which they develop competitive firms.
Countries evolve as they grow, with a consequent upgrading of L assets through a variety of
means and interactions. Broadly speaking, there is a movement away from labour- and

8
natural resource-intensive activity towards capital-intensive activity, and later to more
knowledge-intensive activity (Dunning and Narula 1996). The country’s comparative
advantages and the competitive advantages of its firms show a high degree of
interdependence. Strong initial comparative advantages biases a country’s economic structure
towards industries that utilize this initial advantage in future periods. Agglomerations tend to
build around such specializations, with subsequent growth in both upstream and downstream
aspects (as well as related sectors). Firms of each country tend to embark on a path of
knowledge accumulation within the envelope of these L assets, and shape a distinct profile of
national technological specialization (Cantwell 1989). The technological specialization of
firms also changes very slowly given that there is a close overlap with the technological
specialization of their home country. The O assets of nascent MNEs – which are the progeny
of the more competitive domestic firms from these environments – therefore continue to
reflect the home country innovation systems, and industrial structure and specialization
(Narula 1996, 2003). The O assets of firms in any given period tend to be a function of the
home country’s L assets, but only when these L assets are internalized (Narula 2012).
[Insert Figure 1 here]
Thus initial internationalization by ‘nascent’ or ‘infant’ MNEs will tend to reflect the home
country L assets in their mobile O assets to a much greater extent, because as the Uppsala
model of internationalization makes clear, firms embed themselves in host countries only
gradually (Figure 1). Thus, the effect of host country L assets on the MNE’s portfolio will
initially be minimal. More mature MNEs with greater international experience will have
become integrated with the host country innovation system and socio-economic milieu, and
will become multiply embedded (Meyer et al 2011). Nonetheless, the influence of the home
country continues to persist, not least because multiple embeddedness requires considerable
organizational and managerial capacity. Although it has often been argued that nascent
MNEs are able to acquire host country L assets through strategic asset seeking activity,
‘instantaneously’, there is simply no evidence that the requisite recombinant O assets to do so
are widely available. Indian MNEs have been especially active in making large acquisitions
in what has been dubbed the ‘big bang approach’ to internationalization (Chittoor and Jana
2013). Indeed, Chittoor and Jana (2013) find that the majority of Indian acquisitions are not
integrated into the parent company, allowing the acquired firm to maintain a high degree of
organizational and managerial autonomy. While this approach avoids the classical problems
of integrating different organizational cultures, it also reduces the synergies that might

9
ordinarily evolve from an M&A. Put another way, the absence of the requisite skills to
manage complex and diverse MNE in multiple locations is rationalized not to be a
disadvantage, although the implication is that many of these acquisitions are in essence a
collection of portfolio investments in the guise of direct investments.
Examining location-specific assets
Our principle thesis in this paper is that the strengths and weaknesses of the L assets of the
Indian economy shape and determine the kinds of O assets of its domestic firms, and by
extension, the O assets of its MNEs. A secondary thesis is that by examining the L assets of
the Indian economy, it is possible to observe the potential for growth of the OFDI activity by
Indian firms.
It is fairly uncontroversial that the competitiveness of firms derives from their ability to
leverage, develop and upgrade their knowledge assets, which presumes a certain extent of
formal and informal innovation activities. While innovation is utilized and internalized at the
firm level, firms exist as part of ‘systems’. Firms are embedded through historical, social and
economic ties to other actors in their home country (Narula 2003, 2014). Of course, the
environment involves broader factors shaping the behaviour of firms: the social and perhaps
cultural context; the institutional and organizational framework; infrastructure; the processes
which create and distribute scientific knowledge, and so on.
It is out of the scope of this paper to conduct a comprehensive review of the Indian economy,
or of the theory of L assets. To simplify the task we will examine L assets within three broad
categories:
1. There are L assets that can be described a ‘basic infrastructure’ because they are
public goods, and are available to all firms at marginal cost. All L assets are in
principle ‘generic, multi-user and indivisible’, and this is also the case for this
category. Examples include unskilled human capital, health care, utilities, telecoms,
ports, security, public transport etc. Basic infrastructure is fundamental to attracting
FDI flows and promoting growth (e.g. Dunning, 1981; Wheeler and Mody, 1992;
Asiedu, 2002; Kinoshita and Campos, 2006; UNCTAD, 2008). The efficient
provision of basic infrastructure has a positive influence on the cost structure and
productivity of firms operating in a location. If infrastructure services are not publicly
provided, firms seek to create their own private networks, leading to wastage of

10
resources and duplication, thereby affecting the efficiency of firms (Erenberg, 1993).
In this paper we classify unskilled human capital as a ‘basic’ L asset, distinguishing it
from skilled human capital which falls into the next category.
2. The second category of L assets is ‘knowledge infrastructure’ which consists of public
research institutes, universities, organizations for standards, intellectual property
protection, etc. that enables and promotes science and technology development (Smith
1997). Knowledge infrastructure is synonymous with what can be usefully described
as the ‘non-firm sector’, because it is not driven by a rent motive (Narula 2002). Such
L assets play an important role in promoting the innovatory and absorptive capacity of
firms. They also act as a mechanism to “direct” technology strategy and as a
mechanism to implement industrial and innovation policy. Progress towards more
knowledge-intensive manufacturing and service activities crucially depends on the
existence of knowledge infrastructure. Knowledge infrastructure has the unusual
characteristic that it is often not a purely public good, but a quasi-public good. They
are available differentially to different players, either because of government policy,
or because they are controlled by a group of incumbents. In short they are not freely
available, and may not be used by others without (some) detriment to their value. This
knowledge may be available to incumbents (whether domestic or foreign), by virtue
of their existing activities on that location, and acquired through experience.
Quasi-public goods imply exclusive access, but in the case of developing countries
which are resource-constrained, when a certain set of assets is in limited supply, those
with access to them may not wish to compete with others through markets for this
access, thereby creating barriers to entry. That is, L assets can move from the public
to the private domain (i.e., they are internalized by specific economic actors), and
they are no longer L assets but constitute O assets.
In addition to L assets that derive from the non-firm sector, knowledge infrastructure
also needs to include inward FDI. Foreign-owned affiliates engaged in knowledge
intensive activities generate spillovers that are in principle also L assets because they
are potentially available to all firms in the same location. Thus, collocation with
foreign affiliates has potential knowledge externalities for domestic firms (Criscuolo
and Narula 2008; Narula and Santangelo 2012). Foreign MNEs are likely to establish
local operations in sectors where the L assets are strongest, and in so doing further
reinforce the L assets available in a given location.

11
3. The third category of L assets is institutions. The interactions between the various
actors within an economy are governed by institutions. They are the ‘glue’ that binds
the various actors together, and determine the efficacy of their interaction (or lack
thereof). Institutions are taken here to be of two types, informal and formal, and are
generally understood as ‘sets of common habits, routines, established practises, rules,
or laws that regulate the interaction between individuals and groups’ (Edquist and
Johnson 1997). In essence, institutions underlay the cumulative causation of all
elements within a system in the sense proposed by Myrdal (1957). Institutions are
associated with public goods, but are not exclusively so, and therefore classified
separately in this paper.
Government policies are an essential component of institutions, and include the
appropriate intellectual property rights regime, competition policy, the creation of
technical standards, taxation, the establishment of incentives and subsidies for
innovation, the funding of education, etc. Government policies also foster informal
institutions, for example, by encouraging firms and individuals to collaborate, or by
promoting entrepreneurial spirit, and good governance (Narula 2014).
In the following sections we examine the strengths and weaknesses of India’s L assets with
these three categories.
Basic infrastructure bottlenecks
Well-developed basic infrastructure is considered to be a L asset. For instance, an
uninterrupted supply of electricity and efficient transportation network enables firms to meet
production targets, reduce costs and supply customers on time. In the case of India, the per
capita consumption of electricity is much lower than other major developing countries (Table
5). In 2010, electricity power consumption was 616 kWh, while China and Brazil consumed
4 times and 3 times more than India on a per capita basis. It was also lower than countries
such as Thailand, Venezuela, and Indonesia. Growth of consumption is spectacularly low: in
1991 the per capita power consumption of India (286 kWh) was higher than Indonesia (159
kWh), but by 2010 Indonesia has moved ahead of India.
Good infrastructure leads to increase in productivity and decrease in production costs, but it
has to expand fast enough to respond to economic growth, which is especially significant for

12
developing economies. In India, physical infrastructure has not only failed to reach the levels
of developing countries at a similar stage of development, but has also failed to expand in
response to the rapid economic growth of the last two decades. For instance, during the
Eleventh Five-Year Plan period (2007-2012), in spite of the creation of new generation
capacity there was still an energy shortage of 8.7 per cent as of 2012 (Ministry of Finance,
2013). More than 40 per cent of firms had invested in private generators due to frequent
power blackouts and brownouts (World Bank, 2006). In addition to the widening gap
between energy demand and supply, electric power transmission and distribution losses are
considerable. The value lost through electrical outages remains very high in India compared
to other major developing countries (Table 5).
Along with energy, transportation forms an important component of the backbone of any
economy. An efficient transportation network provides economic and social opportunities,
and leads to multiplier effects through additional investment, accessibility to markets, and
increases in employment. Transport infrastructure is also considered to have great impact on
the ‘supply chain capability’ of a country, given that firms are intricately linked to a variety
of customers and suppliers of goods and services, and the efficiency with which intermediates
and other inputs for the focal organization can be delivered (Alam and Bagchi, 2011). It has a
pronounced effect on the efficiency and competitiveness of firms operating in that location.
This has much to do with the logistical infrastructure, and in particular, transport.
Although India has one of the largest rail networks in the world, it has consistently
underinvested in upgrading its network. Between 1950 and 2010, the size of the network
grew at a compound annual growth rate (CAGR) of 3 per cent, while freight and passenger
traffic grew at a CAGR of 54 per cent, leading to oversaturation of the rail network (Deloitte,
2012). Although India had a larger network than China in 1990, China made significant
investments3 in its railway infrastructure over the last two decades, and by 2011 the total
route length in China exceeded India’s (Table 5). In addition to the lack of investment in
infrastructure, transit times for freight in India are long and uncertain. For instance, a freight
train takes as much as 6-8 days to travel a distance of 2000 kilometres (Deloitte, 2012).
61 per cent of cargo is moved by road in India compared to 37 per cent in the US and 22 per
cent in China. However, the percentage of paved roads in India is lower than countries like
3 China spent $8.8 billion on railway infrastructure construction in the first quarter of 2013 (Wall Street Journal, 2013).

13
China, Russia, Indonesia, and the developed world (Table 5). In addition to the inadequate
road network and poor quality of roads, transit times are also long. For instance, according to
a study by Transport Corporation of India, a 2150 kilometre journey between Kolkata and
Mumbai trucks typically have to stop for as much as 32 hours at various checkpoints at 26
different locations, taking up to 8 days to cover the distance (Economist, 2006).
[Insert Table 5 here]
In addition to railways and roads, other modes of transport also suffer from several issues.
For example, the average turnaround time for ships in an Indian port is more than double the
turnaround time in ports in Colombo, Singapore, Hong Kong and Rotterdam (Deloitte, 2012).
Air cargo also suffers from issues such as congestion and long waiting time as a result of
inadequate infrastructure and bureaucratic delays. For instance, the waiting time for exports
in India is 50 hours compared to world average of 12 hours while the waiting time for
imports in India is 182 hours compared to world average of 24 hours (Deloitte, 2012).
Telecommunication forms an integral part of the physical infrastructure in a country. An
efficient telecommunication network reduces the transaction costs of firms. As the
telecommunication infrastructure improves in a location, the costs of doing business
decreases, leading to an increase in output for the firm (Leff, 1984). In addition, growth
effects are considered to be significantly higher in countries where telecommunications
infrastructure has reached universal service (Roller and Waverman, 2001). For instance, a 10
per cent increase in broadband penetration increases per capita income growth by 0.9-1.5 per
cent (Czernich et al, 2011)
Although India is one of the fastest growing telecom markets in the world, it lags behind
other developing countries in terms of broadband penetration. Just 1 per cent of India’s
population has broadband access compared to 11.6 per cent in China, 8.5 per cent in Brazil,
and 13.1 per cent in Russia. Overall internet penetration in India is 11.4 per cent of total
population which is one of the lowest among developing countries (Table 5).
Knowledge infrastructure bottlenecks
Knowledge and innovation activities are often concentrated in space, which implies that
knowledge spillovers generated by innovative and technological activities often stay within
the location in which knowledge was originally created, leading to regions of specialization.
In the absence of a strong knowledge infrastructure, spillovers may be lost. The main

14
function of the knowledge infrastructure is production and diffusion of knowledge, protection
of knowledge through regulation and standards, creating skilled workforce through education
and training, and generating spin-offs (Smith, 1997).
The single most important constituent of knowledge infrastructure in any location is skilled
human capital. One channel through which human capital affects economic growth is by
facilitating the adoption of new technology (e.g. Nelson and Phelps, 1966; Acemoglu, 2003;
Caselli and Coleman, 2006). This is particularly important for firms from developing
countries that are considered to be in a phase of catch-up with their developed country
counterparts. Human capital is an important source of competitive advantage for firms
because knowledge is acquired and used by the people in an organization, both collectively
and individually.
As Table 6 shows, the number of researchers in R&D per million people in 2009 was 863.2
in China, 703.7 in Brazil, 3092.3 in Russia, 1091.2 in Argentina, while there were only 135.8
researchers per million people in India. The gap between India and newly industrialized and
developed countries is much wider as can be seen in the table. Similarly, only 13.1 per cent of
total researchers in India have advanced research qualifications such as PhD’s, lower than
other major economies (Table 6).
[Insert Table 6 here]
Indeed, India’s output of doctorates in science and engineering (S&E) is possibly insufficient
to meet demand, both currently and in the future. A recent report indicates that most IIT’s,
India’s top-tier technical universities have on average almost half their academic positions
vacant4, in part due to the lack of qualified PhD’s, and in part due to the greater financial
prospects in industry (and abroad). Herstatt et al (2008) suggest that the shortfall in qualified
PhD-level teaching positions in India was in the range of 40,000. It is worth noting that
between 2006 and 2009, there were 8266 Indian recipients of US doctorates, of whom 88 per
cent indicated they had plans to stay on in the US. This suggests a rather large (and possibly
permanent) brain drain (NSF 2012). Contrast this with the fact that Indian universities
produced fewer than 8000 doctorates in 2006, the most recent year for which data is available
(NSF 2012). This is significantly lower than China, which produces three times as many S&E
PhD’s.
4 Times of India (2013).

15
This lack of academic staff amongst universities has implications for the expansion of
university education to meet growing demand for S&E graduates. Although India produces
more than half a million S&E graduates every year, a study suggests that in 2011 only 17.5
per cent of the engineers were employable in the IT support services sector, while a mere 2.7
per cent of engineers are employable by information technology product companies which
require high levels of knowledge of algorithms and computer science (Aspiring Minds,
2011). Of the 355 universities in India in 2008, only 140 were accredited, of which only a
third were rated by the Indian government as ‘A’ grade (National Knowledge Commission,
2009). Indeed, the low quality problem amongst S&E graduates has been noted elsewhere,
including Herstatt et al (2008). As is the case with much of Indian infrastructure, there are
important pockets of excellence. The IIT’s are generally acknowledged to be world class
institutions, but are limited in what they can do. Although they doubled their intake from
2003 to 2012, they admitted just over 12000 students in 2012. Given that demand for S&E
graduates has increased year-on-year for the last 10 years at approximately 20-25 per cent,
capacity increases have simply not kept up. The emigration of the best graduates from these
institutions – possibly a third to half – to postgraduate programmes in the US – coupled with
another third moving into management training – creates a further drain, meaning that fewer
highly skilled engineers are available to Indian firms, given that a substantial proportion also
prefer to work for MNEs in India. Although the Indian government has turned to the private
sector to create new capacity in the tertiary education sector, this has yet to make any
significant contribution5 (Ministry of Human Resource Development, 2009). India has one of
the lowest expenditures on higher education per student in Asia, in addition to having one of
the lowest gross enrolment ratios in the developing world (National Knowledge Commission,
2009). There are considerable bottlenecks in the provision of vocational training, primary of
which is that there is simply an insufficient supply of graduates.
These shortages of skilled workers puts an upwards pressure on the costs of employing the
most competent graduates, and this is perhaps the largest single bottleneck underlying Indian
industry over the next few decades. Under-qualified workers due to the deficiencies in the
educational system require expensive in-house training programmes, which is an additional
cost to employers. Indeed, several large companies maintain quite considerable in-house
training capacity for this reason (Modwel and Jelassi 2010). A related issue is the bottleneck
5 The Yashpal Committee Report indicates that 108 private universities had been set up by 2008. However, in the absence of clear guidelines, accreditation systems and monitoring, the quality remains quite ambiguous.

16
in skilled and experienced managers, which ultimately tends to be sourced from the same
pool of employees within firms. For instance, McKinsey (2001) found that by 2010 there
would be a shortfall of 200,000 managers in the IT sector alone.
Interactive learning within an economy depends in large part on collaboration between firms,
universities and public research organizations. The non- firm sector plays a dual role as
providers of R&D and as providers of human capital (Pavitt, 1984), which is essential for
firms to build absorptive capacity. There is limited interaction between academic and
research institutions and firms in India (D’Costa, 2009), which points to the nascent nature of
national innovation system in India.
Indeed, while India has a large non-firm sector, with about 2000 public research institutes
(Ministry of Science and Technology, 2010), most of these is run along administrative lines
similar to government ministries, and suffers from considerable inefficiencies (NISTADS
2008). Just one Indian organization6 belonging to the non-firm sector appears in the top 20
USPTO patent assignees from India during the period 2008-2012. The number of patents held
by the non-firm sector in China and South Korea is higher in the top 20 patent assignees.
Although there is only one non-firm7 in the top 20 patent assignees from China, it holds more
patents than all Indian non-firms combined. Similarly, there are three non-firms8 in the top 20
patent assignees from Korea, and together they were granted seven times more patents than
Indian non-firms.
Almost 75 per cent of India’s public R&D expenditures were directed towards atomic energy,
space research, defence and agriculture. 15 per cent was accounted for by biotechnology, IT,
ocean development, non-conventional and renewable energy sources, medical research and
environment and forests, and 10 per cent to industrial research (NISTADS 2008).
Firms are extremely dependent on their internal resources for financing of innovation
activities, including human resource development, with limited resources and support from
the public research sector. This is unlike the case in the US and Europe where the innovation
6 Council of Scientific and Industrial Research (CSIR) is the only Indian organization in the top 20 patent assignees in India. USPTO granted 260 patents to CSIR during 2008-2012. 7 Tsinghua University was granted 435 patents by USPTO during 2008-2012, which is higher than 334 patents (see Table 4) granted to nine Indian non-firms during the same period. 8 Electronics and Telecommunication Research Institute, Korea Advanced Institute of Science and Technology, and Korea Institute of Science and Technology were granted a total of 2620 patents by USPTO during 2008-2012.

17
system mitigates the uncertainty within innovation, both financial and technological (Arora
2011).
Many of these research organizations suffer from a fundamental mismatch between their
mandate and demand. Although the Indian economy was liberalized in 1991, public research
organizations continue to prioritize self-reliance rather than developing products and services
to compete in international markets. Instead, India’s public research efforts were designed to
disseminate best practice within its hitherto protected internal markets, as expected from an
import-substituting model of industrialization. India’s non-firm sector was not designed to
promote domestic enterprises to achieve competitiveness at an international level, as would
be expected for an export-oriented policy of economic development (NISTADS 2008). As
such, these organizations suffer from systemic inertia, and are acutely unsuited to support
industry for the challenges of the global economy (Narula 2003).
An exception to this is the Council of Scientific and Industrial Research (CSIR), which
coordinates 40 subsidiary centres. CSIR has a stock of highly specialized 4,600 scientists and
8,000 scientific and technical support personnel. It supports 7,000 research scholars for
doctoral research in S&T throughout the country and awards over a 1000 doctorates annually.
It is also the single largest Indian patent assignee in India. 65 per cent of their budget is spent
on pharmaceuticals, biotech, electronics/electrical equipment, and chemicals/petrochemicals
research.
Despite this immense public infrastructure, India has a low share of public sector R&D, and
public R&D has fallen in real terms with economic growth, with the private share of total
R&D increasing from about 50 per cent to 65 per cent between 2003 and 2005 (NISTADS
2008). Six industrial sectors (pharmaceutical, automotive, electrical, electronics, chemicals
and defence) account for about two-thirds of the total industrial R&D. The higher education
sector contributes about 5 per cent of total R&D expenditures, but remains highly
concentrated in a few institutions. However, Herstatt et al (2008) suggest that prospects to
expand the role of universities to undertake more R&D is limited, given the shortage of
academic staff at the IITs (discussed earlier), while many of the lower-tier universities are
primarily teaching institutions.
Institutional bottlenecks

18
Research on economic growth and development has identified various factors that determine
economic performance across regions and countries in the world. Productivity, technology,
openness, income distribution, infrastructure and resource endowments are some of the
factors that influence growth and development. In recent years, additional factors such as the
quality of a country’s institutions have been highlighted as the reason behind differences in
competitiveness between countries (Acemoglu et al 2001, Glaeser et al 2004, Rodrik et al
2004). Institutional quality has also been found to influence FDI flows. Poor institutions at
home drive away firms in search of locations with better institutional development (e.g. Witt
and Lewin 2007).
The dominant view in research on institutions and development is that institutions determine
economic performance (e.g. Acemoglu et al 2005). Although India has achieved rapid strides
in economic development since liberalization in the early 1990s, institutional development
has not kept pace. For example, the settlement of industrial disputes in the organized sector is
still governed by the Industrial Disputes Act 1947. Firms employing more than 100 workers
still need to obtain government permission before firing employees or closing down.
The quality of administrative practices such as costs of starting a business, obtaining
permissions and licences, and hiring employees are important inputs for new enterprise
creation and improving productivity (e.g. World Bank 2010; Branstetter et al 2013).
Procedural delay due to red tape is another constraint faced by firms and multinationals in
India. As shown in Table 7, the time taken to enforce a contract in India is double the time
taken in Brazil, three times that of China, and five times that of Russia. Senior management
of a typical firm in India spends 6.7 per cent of management time in a week to deal with
government regulation related to taxes, customs, licensing and labour regulation compared to
0.9 per cent in China, 1.6 per cent in Indonesia and 0.4 per cent in Thailand. It takes almost
30 days to obtain an electrical connection in India whereas it takes only about 7 days in China
and 4 days in South Korea. The time taken to clear exports through customs in India is 15
days while it is much lower in other developing Asian economies (Table 7). A delay in
shipping a product by an additional day reduces the volume of trade by more than 1 per cent
(Djankov et al 2010).
[Insert Table 7 here]
Another aspect of institutional quality that influences development and competitiveness is
corruption (e.g. Shleifer and Vishny 1991). Corruption is also linked to the procedural delays

19
faced by businesses in many countries. According to the World Bank Enterprise Survey, 47.5
per cent of firms in India are expected to make informal payments to ‘get things done’. This
is much lower in all other countries in Table 7. 25.6 per cent of firms in the survey considered
corruption as a major constraint in India while this is only 0.6 per cent of firms in China.
India has strong democratic political institutions which encourages legislation through
debates and discussions. However, this has also created deadlocks due to disruption of the
parliament by opposition parties, and also because of the pressure on the leading ruling party
to satisfy the ideological whims of its coalition partners to ensure coalition stability (e.g.
Spary and Garimella, 2013). This has often resulted in a logjam of bills to be passed by the
parliament, many of them pertaining to important policy decisions.
Informal institutions also play a role in business. Research has shown that national pride
influences attitudes towards global economic issues (e.g. Muller-Peters 1998) as well as
M&A decisions (e.g. Hope et al 2011). Hope et al (2011: 129) define national pride as ‘‘an
indication that national, social, or political considerations could influence decision-making of
individual decision-makers (business owners or managers), either rationally or irrationally’’.
Developing countries have been found to bid higher on average to acquire assets in developed
countries. Tata Steel acquired Corus in 2007 for $12 billion, a price that was inflated mainly
due to the bidding war with Companhia Siderúrgica Nacional (CSN) of Brazil. Corus has
faced losses since 2009, made 2500 job cuts in the UK, and is trying to dispose assets and
refinance debts (Financial Times, 2013). A report by Ambit Capital says that Indian
companies become ‘victims of their own success’, and ‘arrogance and hubris’ results in
inorganic expansion into unfamiliar territories at the expense of discipline on cost and quality
(Financial Times, 2013). Informal institutions such as culture and customs impede human
capital development to an extent. For example, the tendency of people in India to get married
at a young age hampers their prospect of further education such as pursuing a PhD.
Discussion and implications for Indian MNE growth
The discussion heretofore makes the point that the O assets of MNEs are a function of O
assets of domestic firms, and these in turn are determined by the home country’s L assets. We
have examined the strengths and weaknesses of India’s economy and the pockets of
excellence that have arisen therefrom that have shaped the growth of OFDI. In this section
we discuss the implications of our preceding analysis, paying special attention to the
bottlenecks to long-term competitiveness of India’s economic sectors, and the prospects for

20
outward FDI. The evidence suggests that the strengths and weaknesses in the L assets of
India have caused pockets of excellence to emerge, but that these conditions do not lend
themselves to a broader growth in competitiveness, meaning that further rapid growth is
ultimately not sustainable.
Growth in the services sector
The growth of India’s service sector is an important curiosity for several reasons. First, quite
unlike other developing countries, the gradual shrinking of the relative importance of the
agricultural sector over the last 40 years has not been associated with a commensurate growth
in India’s manufacturing sector, which has shown only marginal changes in its share of the
economy, with the slack being taken up by the growth of the service economy (Kumar and
Gupta 2008). To some extent service sector growth has happened despite government policy.
Second, although it requires knowledge infrastructure, this sector has grown through firms
substituting public goods with private goods. Service firms by definition are even more
dependent upon recruiting skilled workers (which make up the majority of their
employment), and for whom output is crucially associated with the quality of these
employees. ILO (2013) notes that salaried workers in services reported a 150 per cent
increase in wages between 2006 and 2010, three times the increase in the consumer price
index. The bottlenecks in the education sector discussed earlier, coupled with the high rates
of attrition means that Indian firms are pushed to move abroad, as wage costs go up but
labour productivity does not demonstrate a commensurate increase. The services sector has
benefitted from a large inflow on FDI by highly competitive MNEs, causing domestic firms
to ‘raise their game’ through greater innovativeness. At the same time, this has also caused an
upwards pressure on wages.
Data show that over the period 1980-2004, over 60 per cent of the total factor productivity
growth in India came from the services sector. (Das, et al, 2010) The services sector in India
will struggle to grow at quite the same pace it enjoyed during the last two decades because of
fundamental shortage of skilled (and affordable) manpower, both technical and managerial.
The services sector will see greater internationalization, because there will be a ‘push’ effect
to overcome shortage of critical inputs, in addition to its natural propensity - by virtue of its
demand driven nature - for proximity to the customer. Indeed, services and software are
already the largest areas of outward FDI.

21
The state-owned enterprise sector
The SOE sector – while not as large as China – is still relatively large at approximately 15 per
cent of GDP (Dougherty et al 2009), and a similar share of employment. State-ownership is
considerable in sectors as diverse as telecommunications, energy, banking and dairy
processing, and in most instances remains highly inefficient. McKinsey (2001) estimated that
continued state ownership supressed GDP growth by approximately 0.7 per cent annually and
there is little evidence that this has been addressed in the decade since this study.
Industries dominated by a few state-owned firms (or indeed firms of any kind of ownership)
rarely benefit from the competition effect from inward FDI. India has a larger number of
sectors where output is concentrated in the hands of a very small number of actors.
Dougherty et al (2009) estimated that India’s share of highly concentrated industries was
three times as large as that of China or the US. This suggests that there is a much greater
potential for anti-competitive behaviour by firms, and less of an incentive to upgrade their O
assets. It also means that such firms are able to generate monopoly rents and are less likely to
venture abroad, and where they do so, will not be concerned with the commercial viability of
these activities.
Indian SOEs in India are known to be poorly managed at home, and suffer from low
productivity. These firms enjoy a near monopoly (or at least have a market-making position)
in some sectors guaranteeing their profits however unproductive they may be. Poorly-
performing SOEs in industries open to competition such as steel and retail banking can get
government support, allowing them, too, to survive despite their inefficiencies (McKinsey
2001). In some sectors, the government controls both the large players and the regulators,
creating an uneven playing field for private competitors. Any expansion of this sector abroad
– primary amongst them are resource intensive SOEs – will in any case not be based on a
financial or performance motive.
Growth in the manufacturing sector
FDI from India’s manufacturing sector is abysmally low. From textiles and apparel to
pharmaceuticals there is considerable evidence that while there are opportunities for export
growth, Indian firms remain concentrated in the upstream and low(er) value adding parts of
the value chain. The low levels of OFDI compared to the high share of exports of these two
sectors indicate that their O assets are location-bound, and location-specific. In
22
pharmaceuticals, despite improvements in India’s IPR laws, protection for patents remains
weak, acting to limit inward FDI as well as discouraging domestic firms from expanding into
new drug discovery (as evidenced by the low R&D intensity of Indian companies).
In sectors such as automotive components and textiles, domestic growth will be limited by
the problems of small scale production by the multitude of micro-enterprises that dominate in
India, in sectors where there are large minimum efficient scales, and there are considerable
economies of scale.
The automobile sector has gone shopping for acquisitions to overcome their limited O assets
portfolio, and the growing competition from inward FDI. They have responded by engaging
in significant acquisitions abroad, but the evidence is that they are able to acquire but not to
merge. That is, they maintain their foreign acquisitions as autonomous subsidiaries. From
their failure to upgrade the products from their domestic operations with superior technology
from these acquired firms, it seems clear that they do not have the organizational and
managerial skill to engage in systematic reverse technology transfer. There are few reasons to
believe that Indian firms can substitute for weaknesses in the L assets at home by going
abroad, or avoiding investing in R&D themselves by buying up firms with an existing
portfolio of technological assets. Both require recombination advantages and an especially
high absorptive capacity.
Certainly, there are opportunities in inter-industry integration. For instance, the growth of
inward FDI in the IT/software sector is partly driven by hardware companies that seek
complementarities in software from India. There is great potential in the hardware side of IT,
if the innovation system were upgraded to promote an integrated approach that boosts the
hardware and software sectors simultaneously.
There are other areas for possible cross-fertilization, where India’s existing pockets of
excellence can ‘cross-over’, such as, for instance, bio-informatics, and the growth of
biotechnology (an area where the government has invested considerably (NISTADS 2008)).
However, each presents its own challenges, and broadly speaking, the same bottlenecks in
terms of basic and knowledge infrastructure, as well as institutions will constrain each of
these ‘new’ sectors.
Prospects for new pockets of excellence

23
Outward FDI by Indian firms from its existing ‘pockets of excellence’ has limited potential
for sequential growth, except perhaps where it is to ‘escape’ the confines of India’s limited
innovation system. Growth in new sectors depends in large part upon new pockets of
excellence developing, but this depends crucially upon developing new sectors within
manufacturing. This in turn means developing the appropriate L assets. However, there are
several reasons why we are pessimistic that this can happen without considerable and radical
changes to the innovation milieu.
Although India potentially has an almost limitless supply of people given its large population,
it is also a particular feature of the Indian economy that a very large share of the economy
remains in the informal sector, and this share has grown rather than shrunk. 94 per cent of
total employment in 2003 was in the informal sector, increasing from 92.6 per cent in 1993.
Much of this increase has been in the non-agriculture sector, while the formal sector has
shrunk over the same period, along with the agricultural sector (Dougherty et al 2009).
Employment in the private sector manufacturing industry was just over 5 million in 2007-08,
an increase of just half a million from 1990. This growth is dismal in a country where 10
million workers are estimated to join the work force annually (Bhagwati and Panagariya
2013).
Several facts are worth noting here9. First, the formal sector accounts for the vast majority of
India’s exports. Second, the Indian manufacturing sector is dominated by micro-enterprises,
of which the overwhelming majority are in the informal sector. Third, these micro-enterprises
have a total factor productivity that is half that of larger enterprises. Fourth, Indian
manufacturing is concentrated in sectors where there are considerable scale economies. Fifth,
they are sectors which are also capital intensive, which works against India’s comparative
advantage.
It is a fundamental paradox that the informal sector has grown, despite its greater
inefficiencies. This is ultimately a result of India’s labour legislation and pre-reform
regulations that provides on the one hand special incentives to micro-enterprises by limiting
entry to larger firms in certain sectors, while on the other hand, limiting the ability of larger
firms to lay off or replace workers, or declare bankruptcy. Firms therefore prefer to be
capital-intensive rather than labour-intensive to avoid the complexities of becoming larger.
Large firms also tend to fragment outsourced activities to a considerable number of small
9 Based on Dougherty et al (2009)
24
units (perhaps because the smaller firms predominate) creating further inefficiencies. From
our perspective it means that there will be fewer firms with O assets that can be exploited
abroad, at least within the manufacturing sector.
There is no evidence to suggest that the domestic manufacturing sector is likely to grow, at
least not in the knowledge-intensive sectors. Poor physical and knowledge infrastructure limit
India’s competitiveness in such sectors, and this applies not only to knowledge-intensive
sectors (where India does not have a comparative advantage). Even more labour-intensive
sectors such as textiles and apparel are becoming less competitive due to rising costs caused
by infrastructure bottlenecks.
In particular, the weakness of state sector support in education and training creates a cost for
private firms, since they must privately provide what is normally a public good, making them
less competitive. Larger firms are able to overcome some of these gaps in public goods by
investing in their own infrastructure – building training centres and institutes, generating their
own electricity, and so on, but smaller firms (and less successful ones) simply cannot absorb
such costs.
This makes Indian firms less competitive in international markets. Firms without the political
clout to seek exceptions from politicians and policy makers (typically the large business
groups and SOEs that dominate the Indian economy) will seek to ‘exit’. From the point of
view of OFDI, it means we are likely to see the more competitive firms seeking to escape
institutional voids, and India’s growing location disadvantages by relocating abroad.
The high degree of illiteracy, the large (and inefficient) informal agricultural sector, and the
problems of internal migration means despite a large population, there is a shortage of
workers with basic skills where demand is greatest. Besides, Indian firms have a disincentive
to employ more workers due to unwieldy labour regulations10, preferring to substitute capital
for labour, assisted by low costs of borrowing during the boom era. As the cost of capital has
risen, and liquidity in the domestic sector decreased further growth through this means is
limited. Where firms in these sectors have non-location-bound O assets, it is possible that we
see an increase in OFDI to lower wage nations in the region. However, in sectors such as
textiles and apparel, there is no indication that they can expand abroad, because they remain
in the low value adding aspect of the industry, and act as outsourcers to larger non-Indian
10 For example, producers of certain textile products face limits on their spending on new plants.

25
MNEs that own the knowledge-intensive and proprietary O assets further downstream11. In
addition, due to their small size they simply do not have the resources to do so, and these
resource constraints include a lack of managerial capacity to expand abroad. Where they are
able to overcome their resource constraints, their scale of activity is often far below the
minimum efficient scale to compete abroad12.
Indeed, there are two issues that seem to apply across the board. First, the limits to growth
from derive from poor institutions that dis-incentivize firm growth (seen by the fact that the
informal sector’s share of employment has expanded, rather than shrunk, during the last two
decades). The success of the services sector derives in part from the fact that many restrictive
labour laws, including the Factories Act, did not apply to the service industries such as
software. These laws, in combination with the unwieldy regulations that on the one hand
encourages micro-enterprises, but on the other then puts brakes on their ability and
willingness to expand, hold back the ability of firms to develop O assets in much of the
manufacturing sector.
Second, there are fundamental gaps in the infrastructure in India. The limited physical
infrastructure is not simply a cost for firms in terms of moving goods, and achieving just-in-
time delivery. It also presents a cost in terms of labour mobility. MNEs and domestic firms
must concentrate themselves in specific areas, since there are very low levels of internal
migration. Domestic firms do not easily relocate themselves (or establish subsidiaries) to
take advantage of lower wages in other locations, or less onerous employment regulations
(there is considerable variation between Indian states, which work on a federal basis). Indeed,
wage differentials between different parts of the country mean that moving abroad can in
some instances be cheaper than relocating within India. Limited migration within India has
adverse impacts of trade liberalization, and ultimately for firm competitiveness, particularly
for states with heavily protected labour markets.
Systematic upgrading and radical policy changes are needed to build up India’s knowledge
infrastructure and institutions to support a shift in India’s competitive advantages to new
sectors outside these pockets. There are reasons to be pessimistic that radical action to correct
these structural impediments to growth will be acted upon boldly, and this has to do with the
11 India’s technology value-added in manufactured products in 2009 was 8 per cent, considerably less than China (31 per cent), Brazil (14 per cent) and Mexico (21 per cent) (Rajan 2012) 12 The average Indian textiles factory has only about 50 machines, compared to over 500 in a Chinese plant (McKinsey 2001).
26
fact that Indian policy makers face a dual and sometimes conflicting set of challenges. They
must invest in technologies and assets that reduce inequality and poverty, particularly in the
rural areas through resource-saving but labour-intensive ‘appropriate’ technologies, which
provide no advantages in international markets. Simultaneously they must promote R&D in
state-of-the-art emerging knowledge-intensive sectors that increase the competitiveness of
Indian firms. The social and political costs of neglecting the first have to be weighed against
the economic costs of underperforming in the second. However as Drèze and Sen (2013)
argue, in the long run, this is not an either/or scenario. In a world where the space between
domestic and global markets has shrunk so radically, indecision is not an option.

27
References
Acemoglu, D. (2003). Patterns of skill premia, Review of Economic Studies, 70(1): 199-230.
Acemoglu, D., Johnson, S., and Robinson, J. A. (2001). The colonial origins of comparative
development: An empirical investigation, American Economic Review, 91(5): 1369-1401.
Acemoglu, D., S. Johnson, and Robinson, J. A. (2005). Institutions as the Fundamental Cause
of Long-Run Growth. In Aghion, P. and Durlauf, S. (eds.), Handbook of Economic Growth,
Amsterdam: North-Holland, 385–472.
Alam, A. and Bagchi, P. K. (2011). Supply chain capability as a determinant of FDI,
Multinational Business Review, 19(3): 229-49.
Arora, P. (2011). Innovation in Indian firms: Evidence from the pilot national innovation
survey, ASCI Journal of Management, 41(1): 75-90.
Asiedu E. (2002). On the determinants of foreign direct investment to developing countries:
Is Africa different? World Development, 30(1): 107–118.
Aspiring Minds (2011). National Employability Report: Engineering Graduates, Annual
Report 2011, Gurgaon: Aspiring Minds.
Bell, M. and Pavitt, K. (1997). Technological accumulation and industrial growth: contrasts
between developed and developing countries. In: Archibugi, D. and Michie, J. (eds),
Technology, Globalisation and Economic Performance, Cambridge: Cambridge University
Press, 83–137.
Bhagwati, J., and Panagariya, A. (2013). Why Growth matters: How Economic Growth in
India reduced Poverty and the lessons for Other Developing Countries, New York: Public
Affairs.
Branstetter, L., Lima, F., Taylor, L. J. and Venâncio, A. (2013), Do entry regulations deter
entrepreneurship and job creation? Evidence from recent reforms in Portugal, The Economic
Journal. doi: 10.1111/ecoj.12044.
Burange, L. G., and Chaddha, S. J. (2008). India’s revealed comparative advantage in
merchandise trade, Artha Vijnana, 50(4): 332-363.

28
Cantwell, J. (1989). Technological Innovations and Multinational Corporations, Oxford:
Basil Blackwell.
Caselli, F., and Coleman, J. W. (2006). The world technology frontier, American Economic
Review, 96(3): 499–522.
Chittoor, R., and Jana, D. (2013). Understanding the overseas acquisitions of Indian
transnational corporations, ISB Insight, 11(1): 14-21.
Cohen, W., and Levinthal, D. (1990). Absorptive capacity: a new perspective on learning and
innovation, Administrative Science Quarterly, 35: 128-152.
Criscuolo, P., and Narula, R. (2008). A novel approach to national technological
accumulation and absorptive capacity: aggregating Cohen and Levinthal, European Journal
of Development Research, 20(1): 56-73.
Czernich, N., Falck, O., Kretschmer, T., and Woessmann, L. (2011). Broadband penetration
and economic growth, The Economic Journal, 121: 505-532.
Das, D. K., Erumban, A. A., Aggarwal, S., and Wadhwa, D. (2010). Total factor productivity
growth in India in the reform period: A disaggregated sectoral analysis, Paper presented at
World KLEMS Conference, Harvard University.
D'Costa, A. P. (2009). Extensive Growth and Innovation Challenges in Bangalore, India. In
Parayil, G. and D'Costa, A. P. (eds.), The New Asian Innovation Dynamics: China and India
in Perspective, New York: Palgrave Macmillan, 79–109.
Deloitte (2012). Logistics sector: present situation and way forward, Deloitte Touche
Tohmatsu India, January 2012.
Djankov, S., Freund, C., and Pham, C. S. (2010). Trading on time, Review of Economics and
Statistics, 92(1): 166-173.
Dougherty, S. M., Herd, R., and Chalaux, T. (2009). What is holding back productivity
growth in India? Recent micro evidence, OECD Journal: Economic Studies, 1: 1-22.
Drèze, J., and Sen, A. (2013). An Uncertain Glory: India and its Contradictions, London:
Penguin.

29
Dunning J. H. (1981). Explaining the international direct investment position of countries:
Towards a dynamic or developmental approach, Weltwirtschaftliches Archiv, 119: 30-64.
Dunning, J. H., and Narula, R. (1996) (eds.), Foreign Direct Investment and Governments:
Catalysts for Economic Restructuring, London: Routledge.
Economist (2006). The long journey, June 1.
Edquist, C. and Johnson, B. (1997). Institutions and Organizations in Systems of Innovation.
In: Edquist, C. (ed), Systems of Innovation: Technologies, Institutions and Organizations.
London: Pinter, 41-63.
Erenberg, S. J. (1993). The real effects of public investment on private investment, Applied
Economics, 23: 831–837.
Financial Times (2013). Indian companies v international peers: ‘less chance of success’,
June 10.
Glaeser, E., La Porta, R., Lopez-de-Silanes, F., and Shleifer, A. (2004). Do institutions cause
growth? Journal of Economic Growth, 9(3): 271-303.
Herstatt, C., Tiwari, R., Ernst, D., and Buse, S. (2008). India’s national innovation system:
Key elements and corporate perspectives, Institute of Technology and Innovation
Management – Hamburg University of Technology Working Paper, No. 51.
Hope, O-. K., Thomas, W., and Vyas, D. (2011). The cost of pride: Why do firms from
developing countries bid higher? Journal of International Business Studies, 42: 128-151.
ILO (2013). Global Wage Report 2012/13: Wages and equitable growth, Geneva:
International Labour Organization.
Kinoshita, Y. and N. F. Campos (2006), A re-examination of determinants of foreign direct
investment in transition economies, Mimeo, Washington, DC: IMF.
Kumar, R., and Gupta, A. S. (2008). Towards a competitive manufacturing sector, Indian
Council for Research on International Economic Relations Working Paper, No. 203.
Lall, S. (1992). Technological capabilities and industrialization, World Development, 20(2):
165-186.

30
Leff, N. H. (1984). Externalities, information costs, and social benefit-cost analysis for
economic development: An example from telecommunications, Economic Development and
Cultural Change, 32(2): 255-76.
McKinsey (2001). India: The Growth Imperative, McKinsey Global Institute.
Meyer, K. E., Mudambi, R., and Narula, R. (2011). Multinational enterprises and local
contexts: The opportunities and challenges of multiple embeddedness, Journal of
Management Studies, 48(2): 235-252.
Ministry of Finance (2013). Energy, Infrastructure and Communications, Economic Survey
2012-13, New Delhi: Government of India.
Ministry of Human Resource Development (2009). Report of the Committee to Advice on
Renovation and Rejuvenation of Higher Education - Yashpal Committee Report, New Delhi:
Government of India.
Ministry of Science and Technology (2010). Directory of R&D Institutions, New Delhi:
Government of India.
Modwel, S., and Jelass1, T. (2010). Productivity of India’s Offshore Outsourcing Sector:
Business-based Evidence, Sciences Po – Groupe de’Economie Mondiale Policy Brief,
February.
Muller-Peters, A. (1998). The significance of national pride and national identity to the
attitude toward the single European currency: A Europe-wide comparison, Journal of
Economic Psychology, 19(6): 701–719.
Myrdal, G. (1957). Economic Theory and Underdeveloped Regions, London: Gerald
Duckworth.
Narula, R. (1996), Multinational Investment and Economic Structure, London: Routledge.
Narula, R. (2002). Innovation systems and ‘inertia’ in R&D location: Norwegian firms and
the role of systemic lock-in, Research Policy, 31: 795–816.
Narula, R. (2003). Globalisation and Technology: Interdependence, Innovation Systems and
Industrial Policy, Cambridge: Polity Press.

31
Narula, R. (2012). Do we need different frameworks to explain infant MNEs from developing
countries? Global Strategy Journal, 2: 188-204.
Narula, R (2014). Using a systems perspective to explain the limits of internationalization by
developing country firms: The role of ‘members-only’ location advantages, In Cuervo-
Cazurra, A., and Ramamurti, R. (eds.) Understanding Multinationals from Emerging
Markets, Cambridge: Cambridge University Press.
Narula, R., and Dunning, J. H. (2000). Industrial development, globalization and
multinational enterprises: New realities for developing countries, Oxford Development
Studies, 28(2): 141-167.
Narula, R., and Dunning, J.H. (2010). Multinational enterprises, development and
globalisation: Some clarifications and a research agenda, Oxford Development Studies, 38(3):
263-287.
Narula, R., and Santangelo, G. D. (2012). Location and collocation advantages in
international innovation, Multinational Business Review, 20(1): 6-25.
National Knowledge Commission (2009). Report to the nation 2006-2009, New Delhi:
Government of India.
Nelson, R. R., and Phelps, E. S. (1966). Investment in humans, technical diffusion, and
economic growth, American Economic Review, 56(2): 69–75.
NISTADS (2008). Industrial R&D in India: contemporary scenario, India: Science and
Technology 2008, National Institute of Science, Technology and Development Studies, New
Delhi: CSIR.
NSF (2012). Science and Engineering Indicators, National Science Foundation.
Pavitt, K. (1984). Sectoral patterns of technical change: towards a taxonomy and a theory,
Research Policy, 13: 343–373.
Rajan, Y. S. (2012). Shaping the national innovation system: The Indian perspective. In
Dutta, S. (ed.) The Global Innovation Index 2012: Stronger Innovation Linkages for Global
Growth, INSEAD and World Intellectual Property Organization, 131-141.

32
Rodrik, D., Subramanian, A., and Trebbi, F. (2004). Institutions rule: The primacy of
institutions over geography and integration in economic development, Journal of Economic
Growth, 9: 131–65.
Roller, L-. H. and Waverman, L. (2001). Telecommunications infrastructure and economic
development: A simultaneous approach, American Economic Review, 91(4): 909-923.
Shleifer, A., and Vishny, R. (1991). Corruption, Quarterly Journal of Economics, 109(3):
599-617.
Smith, K. (1997). Economic infrastructures and innovation systems. In Edquist, C. (ed.),
Systems of Innovation: Technologies, Institutions and Organisations, London: Pinter, 86-106.
Spary, C. and Garimella, R. (2013) Managing disruptions in the Indian parliament: interview
with Mr Ravindra Garimella, Lok Sabha Secretariat, Parliament of India, Democratization,
20(3): 539-552.
Times of India (2013). 43% of teaching slots in IITs lying unfilled. March 30.
UNCTAD (2008). World Investment Report: Transnational corporations and the
infrastructure challenge. Geneva: UNCTAD.
UNESCO (2012). Science and technology indicators, UNESCO Institute for Statistics.
Wall Street Journal (2013). Railway spending up in China, April 16.
Wheeler, D. and A. Mody (1992), International investment location decisions: The case of
US firms, Journal of International Economics, 33: 57–76.
Witt, M. A., and Lewin, A. Y. (2007). Outward foreign direct investment as escape response
to home country institutional constraints, Journal of International Business Studies, 38: 579-
594.
World Bank (2006). Enterprise Survey. Available at http://www.enterprisesurveys.org.
Accessed on 29-06-2013.
World Bank (2010). Doing Business in 2010. Washington DC: The World Bank.

33
Table 1: OFDI stock and OFDI per capita from major home countries.
1981 1991 2001 2011
Country OFDI OFDI per
capita
OFDI OFDI per
capita
OFDI OFDI per
capita
OFDI OFDI per
capita Developing countries
China 39.4 0.0 5368.0 4.7 34653.8 27.6 365981.0 271.6
Brazil 38751.9 311.0 42059.1 276.4 49688.6 280.9 202586.3 1030.2
India 80.1 0.1 113.1 0.1 2531.8 2.4 111257.0 89.6
Russia _ _ _ _ 44219.0 302.5 362101.0 2535.1
Mexico 1663.2 23.7 2849.3 33.2 55628.2 549.0 112087.8 976.4
Indonesia 5.0 0.0 99.0 0.5 _ _ 9502.0 39.2
Argentina 5863.4 205.3 6106.7 184.5 21282.6 570.5 31329.0 768.5
S. Africa 6059.3 203.1 16100.4 427.2 17580.0 387.3 72284.7 1432.5
Thailand 13.8 0.3 603.3 10.5 2626.0 41.1 33226.0 477.9
Venezuela 29.0 1.9 1368.0 67.8 7894.0 318.2 19808.0 672.9
Newly industrialized countries
S. Korea 148.9 3.9 3327.6 76.7 19966.9 432.1 159338.9 3292.7
Malaysia 474.5 33.5 762.8 40.8 8354.2 348.6 106216.6 3680.5
Singapore 819.0 332.5 9312.4 3004.5 83556.1 20989.0 339095.1 65362.3
Developed countries Germany - - 173265.2 2175.2 617766.1 7498.5 1441611.0 17545.8 Japan 24506.0 209.7 231791.0 1889.0 300113.8 2383.8 962789.5 7611.1
UK 85714.8 1516.7 232140.8 4031.5 869700.4 14660.9 1731094.6 27629.1
USA 228348.0 970.1 827537.0 3189.2 2314934.0 7997.1 4499962.0 14198.1
Source: UNCTADStat
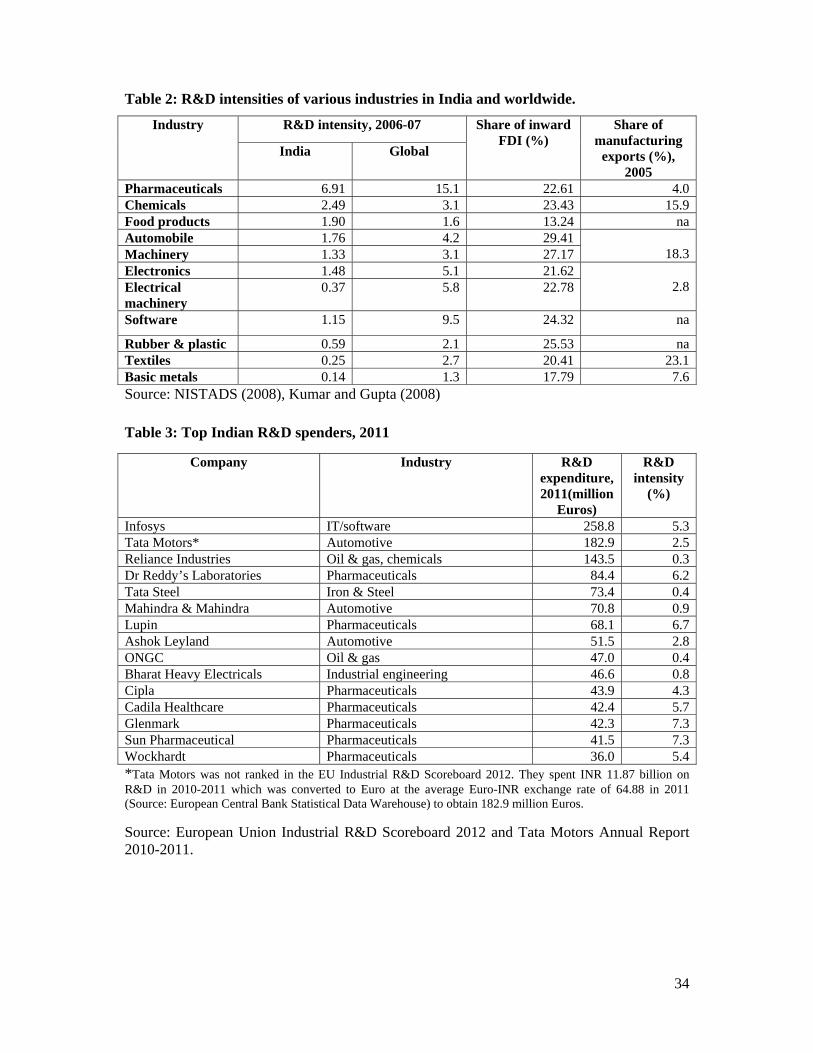
34
Table 2: R&D intensities of various industries in India and worldwide.
Industry R&D intensity, 2006-07 Share of inward FDI (%)
Share of manufacturing
exports (%), 2005
India Global
Pharmaceuticals 6.91 15.1 22.61 4.0Chemicals 2.49 3.1 23.43 15.9Food products 1.90 1.6 13.24 naAutomobile 1.76 4.2 29.41
18.3Machinery 1.33 3.1 27.17 Electronics 1.48 5.1 21.62
2.8Electrical machinery
0.37 5.8 22.78
Software 1.15 9.5 24.32 na
Rubber & plastic 0.59 2.1 25.53 naTextiles 0.25 2.7 20.41 23.1Basic metals 0.14 1.3 17.79 7.6Source: NISTADS (2008), Kumar and Gupta (2008)
Table 3: Top Indian R&D spenders, 2011
Company Industry R&D expenditure, 2011(million
Euros)
R&D intensity
(%)
Infosys IT/software 258.8 5.3Tata Motors* Automotive 182.9 2.5Reliance Industries Oil & gas, chemicals 143.5 0.3Dr Reddy’s Laboratories Pharmaceuticals 84.4 6.2Tata Steel Iron & Steel 73.4 0.4Mahindra & Mahindra Automotive 70.8 0.9Lupin Pharmaceuticals 68.1 6.7Ashok Leyland Automotive 51.5 2.8ONGC Oil & gas 47.0 0.4Bharat Heavy Electricals Industrial engineering 46.6 0.8Cipla Pharmaceuticals 43.9 4.3Cadila Healthcare Pharmaceuticals 42.4 5.7Glenmark Pharmaceuticals 42.3 7.3Sun Pharmaceutical Pharmaceuticals 41.5 7.3Wockhardt Pharmaceuticals 36.0 5.4*Tata Motors was not ranked in the EU Industrial R&D Scoreboard 2012. They spent INR 11.87 billion on R&D in 2010-2011 which was converted to Euro at the average Euro-INR exchange rate of 64.88 in 2011 (Source: European Central Bank Statistical Data Warehouse) to obtain 182.9 million Euros.
Source: European Union Industrial R&D Scoreboard 2012 and Tata Motors Annual Report 2010-2011.

35
Table 4: Sectoral distribution of USPTO patent assignees in India* (2008-2012)
Industry Total Indian firms Foreign firms Number
of firms Patents Number
of firms Patents Number
of firms Patents
IT/software 49 1909 10 188 39 1721Pharmaceutical 36 506 32 457 4 49Electronics 32 1003 1 12 31 991Telecommunication 6 48 0 0 6 48Engineering 4 497 1 5 3 492Chemicals 3 88 1 8 2 80Medical/healthcare 2 14 0 0 2 14Automotive 1 34 0 0 1 34Oil and gas 1 13 1 13 0 0Energy 1 5 0 0 1 5Textile 1 5 1 5 0 0Financial service 1 11 0 0 1 11Media service 1 5 0 0 1 5 Non-firm 9 334 9 334 0 0 Total 147 4472 56 1022 91 3450* Includes all organizations that received five or more utility patents and excludes individual patent assignees. Note that industry classification of patents is based on industry of patenting firm, not industry of patent granted.
Source: US Patents and Trademarks Office

36
Table 5: Basic infrastructure indicators for major countries
Country Access to electricity (% of population) – 2009
Electric power consumption (kWh per capita) – 2010
Electric power transmission and distribution losses (% of output) – 2010
Value lost to electrical outages (% of sales) – 2002-2012*
Rail line (total route kilometres) – 2011
Paved roads (% of total roads) – 2008-2011*
Fixed broadband internet subscribers (per 100 people) – 2011
Internet penetration (% of population) - 2012
Developing countries China 99.4 2943.8 6.1 1.3 66239 84.1 11.6 40.1 Brazil 98.3 2383.7 16.6 3.0 29817 12.9 8.5 45.6 India 66.3 616.2 21.9 8.1 63974 49.5 1.0 11.4 Russia - 6430.6 10.1 2.0 85292 79.0 13.1 47.7 Mexico - 1990.4 16.3 3.4 26704 36.4 10.2 36.5 Indonesia 64.5 641.3 9.3 2.2 - 56.9 1.1 22.1 Argentina 97.2 2904.4 13.4 3.5 25023 - 10.5 66.4 S. Africa 75.0 4802.5 9.5 1.6 22051 - 1.8 17.4 Thailand 99.3 2243.4 6.3 1.5 4429 - 5.0 30.0 Venezuela 99.0 3286.6 19.3 8.3 - - 6.1 41.0 Newly industrialized countries S. Korea - 9744.5 3.6 0.0 3379 79.3 36.9 82.5 Malaysia 99.4 4117.3 6.5 3.0 1665 80.4 7.4 60.7 Singapore 100.0 8306.7 7.0 - - 100.0 25.6 75.0 Developed countries Germany - 7215.4 3.8 0.0 33708 - 33.1 83.0 Japan - 8394.1 4.4 - 20035 - 27.6 79.5 UK - 5733.1 7.1 - 31471 100.0 32.7 83.6 USA - 13393.9 5.9 - 228513 100.0 27.4 78.1 *For each country, the latest available year of data is used.
Source: World Bank World Development Indicators, CIA World Factbook, Internet World Stats
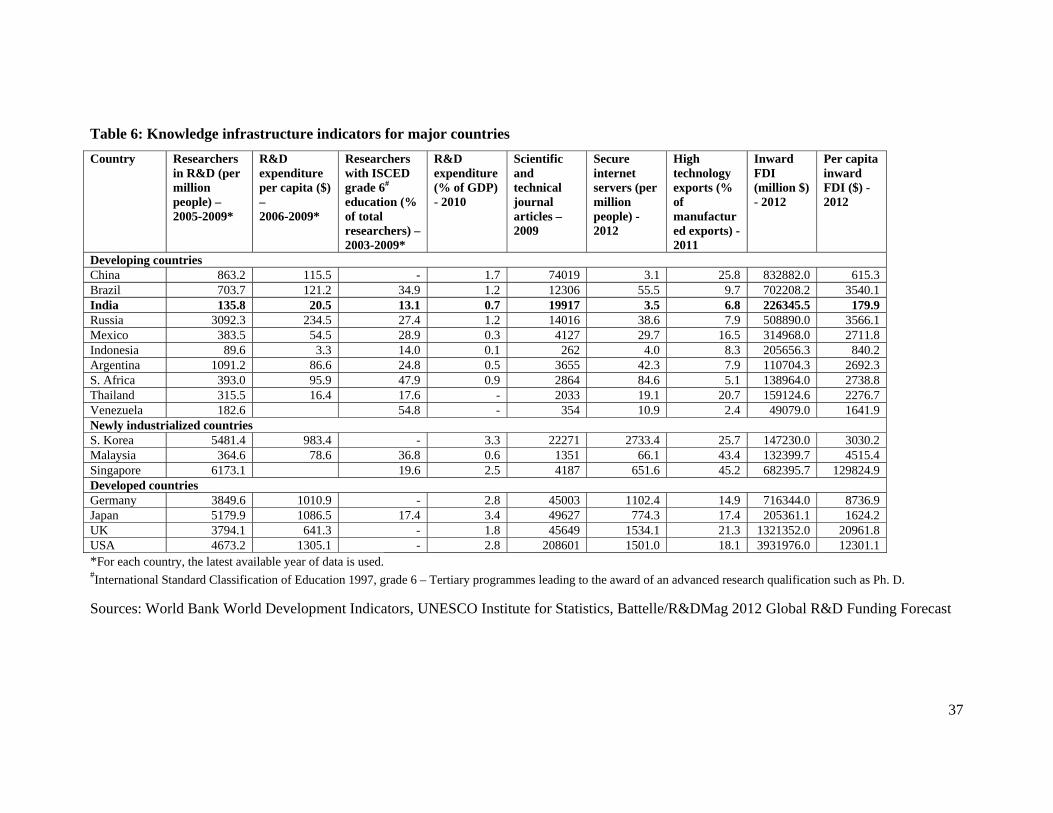
37
Table 6: Knowledge infrastructure indicators for major countries
Country Researchers in R&D (per million people) – 2005-2009*
R&D expenditure per capita ($) – 2006-2009*
Researchers with ISCED grade 6# education (% of total researchers) – 2003-2009*
R&D expenditure (% of GDP) - 2010
Scientific and technical journal articles – 2009
Secure internet servers (per million people) - 2012
High technology exports (% of manufactured exports) - 2011
Inward FDI (million $) - 2012
Per capita inward FDI ($) - 2012
Developing countries China 863.2 115.5 - 1.7 74019 3.1 25.8 832882.0 615.3 Brazil 703.7 121.2 34.9 1.2 12306 55.5 9.7 702208.2 3540.1 India 135.8 20.5 13.1 0.7 19917 3.5 6.8 226345.5 179.9 Russia 3092.3 234.5 27.4 1.2 14016 38.6 7.9 508890.0 3566.1 Mexico 383.5 54.5 28.9 0.3 4127 29.7 16.5 314968.0 2711.8 Indonesia 89.6 3.3 14.0 0.1 262 4.0 8.3 205656.3 840.2 Argentina 1091.2 86.6 24.8 0.5 3655 42.3 7.9 110704.3 2692.3 S. Africa 393.0 95.9 47.9 0.9 2864 84.6 5.1 138964.0 2738.8 Thailand 315.5 16.4 17.6 - 2033 19.1 20.7 159124.6 2276.7 Venezuela 182.6 54.8 - 354 10.9 2.4 49079.0 1641.9 Newly industrialized countries S. Korea 5481.4 983.4 - 3.3 22271 2733.4 25.7 147230.0 3030.2 Malaysia 364.6 78.6 36.8 0.6 1351 66.1 43.4 132399.7 4515.4 Singapore 6173.1 19.6 2.5 4187 651.6 45.2 682395.7 129824.9 Developed countries Germany 3849.6 1010.9 - 2.8 45003 1102.4 14.9 716344.0 8736.9 Japan 5179.9 1086.5 17.4 3.4 49627 774.3 17.4 205361.1 1624.2 UK 3794.1 641.3 - 1.8 45649 1534.1 21.3 1321352.0 20961.8 USA 4673.2 1305.1 - 2.8 208601 1501.0 18.1 3931976.0 12301.1 *For each country, the latest available year of data is used. #International Standard Classification of Education 1997, grade 6 – Tertiary programmes leading to the award of an advanced research qualification such as Ph. D.
Sources: World Bank World Development Indicators, UNESCO Institute for Statistics, Battelle/R&DMag 2012 Global R&D Funding Forecast

38
Table 7: Institutional indicators for major countries (2005-2012)*
Country Number of days to enforce a contract
Percentage of firms expected to make informal payments to ‘get things done’
Management time spent on dealing with government regulation (% of mgmt time in a week)
Days to obtain an electrical connection
Days to clear exports through customs
Developing countries China 406 10.7 0.9 6.9 7.6 Brazil 731 11.9 18.7 36.8 15.9 India 1420 47.5 6.7 29.5 15.1 Russia 270 20.5 14.7 120.4 5.6 Mexico 415 11.6 13.6 17.1 7.0 Indonesia 498 14.9 1.6 15.5 2.3 Argentina 590 18.1 20.8 54.2 7.3 S. Africa 600 15.1 6.0 15.8 4.5 Thailand 440 - 0.4 27.9 1.3 Venezuela 510 23.6 27.6 13.9 18.4 Newly industrialized countries S. Korea 230 14.1 0.1 3.9 7.2 Malaysia 425 - 7.8 10.7 2.7 Singapore 150 - - -- - Developed countries Germany 394 - 1.2 3.2 4.7 Japan 360 - - - - UK 399 - - - - USA 370 - - - -
*For each country, the latest available year of data is used.
Source: World Bank Doing Business, World Bank World Enterprise Survey

39
Figure 1: Relationship between O assets and L assets
}
Basic infrastructure Unskilled labour Transportation Telecommunication Healthcare
Institutions Government Policies Taxation Bureaucracy Entrepreneurial spirit
Host country A location-specific assets
Ownership-specific assets of domestic
firms
Socio-economic and political milieu of the home country
Ownership-specific assets of MNEs
Host country B location-specific assets
Knowledge infrastructure Universities Public research institutes IPR Organization for standards Inward FDI

The UNU‐MERIT WORKING Paper Series 2013-01 Effects of innovation on employment in Latin America by Gustavo Crespi and
Ezequiel Tacsir 2013-02 Revisiting the porter hypothesis: An empirical analysis of green innovation for the
Netherlands George van Leeuwen and Pierre Mohnen 2013-03 Impact of external knowledge acquisition strategies on innovation ‐ A comparative
study based on Dutch and Swiss panel data by Spyros Arvanitis, Boris Lokshin, Pierre Mohnen and Martin Wörter
2013-04 Interactive knowledge exchanges under complex social relations: A simulation modelRobin by Cowan and Anant Kamath
2013-05 Innovation systems framework: still useful in the new global context? by Michiko Iizuka
2013-06 The importance of intrinsic and extrinsic motivation for measuring IQ by Lex Borghans, Huub Meijers and Bas ter Weel
2013-07 Firms' innovation capability‐building paths and the nature of changes in learning mechanisms: Multiple case‐study evidence from an emerging economy by Paulo N. Figueiredo , Marcela Cohen and Saulo Gomes
2013-08 A set of time series data labour market stocks and flows for the Netherlands 1980 to 2010 by Manuel Müllers, Joan Muysken and Erik de Regt
2013-09 Designing an optimal 'tech fix' path to global climate stability: R&D in a multi‐phase climate policy framework by Adriaan van Zon and Paul A. David
2013-10 Complementarity between internal knowledge creation and external knowledge sourcing in developing countries by Jun Hou and Pierre Mohnen
2013-11 Summarizing large spatial datasets: Spatial principal components and spatial canonical correlation by Samyukta Bhupathiraju, Bart Verspagen and Thomas Ziesemer
2013-12 Regional systems of innovation in the Arab region by Samia Satti Osman Mohamed Nour
2013-13 Development and social justice: Education, training and health in Sudan by Samia Satti Osman Mohamed Nour
2013-14 The economic importance and impacts of intellectual property rights (IPRs) in Sudan by Samia Satti Osman Mohamed Nour
2013-15 Overview of knowledge economy in the Arab region by Samia Satti Osman Mohamed Nour
2013-16 The importance (impacts) of knowledge at the macro‐micro levels in the Arab Gulf countries by Samia Satti Osman Mohamed Nour
2013-17 Political determinants and impact analysis of using a cable system as a complement to an urban transport system by Diego Escobar‐García, Francisco García‐Orozco and Carlos Cadena‐Gaitán
2013-18 Women entrepreneurs in the informal economy: Is formalization the only solution for business sustainability? By Shyama V. Ramani, Ajay Thutupalli, Tamas Medovarszki, Sutapa Chattopadhyay, Veena Ravichandran
2013-19 Heterogeneity in innovation strategies, evolving consumer preferences and market structure: An evolutionary multi‐agent based modelling approach by Salih Çevikarslan

2013-20 Optimal patent length and patent breadth in an R&D driven market with evolving consumer preferences: An evolutionary multi‐agent based modelling approach by Salih Çevikarslan
2013-21 Innovation and productivity: An update by Pierre Mohnen and Bronwyn H. Hall 2013-22 Fathers' use of parental leave. What do we know? by Nevena Zhelyazkova 2013-23 Eliciting Illegal migration rates through list randomization by David McKenzie and
Melissa Siegel 2013-24 How do ICT firms in Turkey manage innovation? Diversity in expertise versus
diversity in markets by Semih Akçomak, Erdal Akdeve and Derya Fındık 2013-25 Dynamic models of R&D, innovation and productivity: Panel data evidence for
Dutch and French manufacturing by Wladimir Raymond, Jacques Mairesse, Pierre Mohnen and Franz Palm
2013-26 Centre‐based versus home‐based childcare by Robert Bauchmüller 2013-27 Microeconometric evidence of financing frictions and innovative activity by
Amaresh K Tiwari, Pierre Mohnen, Franz C Palm and Sybrand Schim van der Loeff 2013-28 Innovation for economic performance: The case of Latin American firms by Elena
Arias Ortiz, Gustavo Crespi, Ezequiel Tacsir, Fernando Vargas and Pluvia Zuñiga 2013-29 Is money all? Financing versus knowledge and demand constraints to innovation
Gabriele Pellegrino and Maria Savona 2013-30 Child deprivation in Ontario ‐ A (less than perfect) comparison with Europe by
Geranda Notten 2013-31 Measuring performance: does the assessment depend on the poverty proxy? by
Geranda Notten 2013-32 How big is the impact of infrastructure on trade? Evidence from meta‐analysis by
Mehmet Güney Celbis, Peter Nijkamp and Jacques Poot 2013-33 Using a 'Systems' Perspective to Explain the Limits of 'New' Multinational
Enterprises: the role of 'members‐only' location advantages by Rajneesh Narula 2013-34 Foreign direct investment as a driver of industrial development: why is there so
little evidence? by Rajneesh Narula 2013-35 The end of the multifibre arrangement (MFA) and the heterogeneous performance
of quota‐constrained countries by Mulu Gebreeyesus 2013-36 Techological capability building in MNE‐related social businesses of less developed
countries: The experience of Grameen‐Danone Foods in Bangladesh by Jahan A. Peerally and Paulo N. Figueiredo
2013-37 The links between economic integration and remittances behaviour of migrants in the Netherlands by Özge Bilgili
2013-38 The influence of vulnerability on migration intentions in Afghanistan by Craig Loschmann and Melissa Siegel
2013-39 How unemployment insurance savings accounts affect employment duration: Evidence from Chile by Paula Nagler
2013-40 Self‐organization of knowledge economies by François Lafond 2013-41 Designing an optimal 'tech fix' path to global climate stability: Directed R&D and
embodied technical change in a multi‐phase framework by Adriaan van Zon & Paul A. David
2013-42 The growth of outward FDI and the competitiveness of the underlying economy: the case of India by Rajneesh Narula and Tiju Prasad Kodiyat