WORKING PAPER SERIES - ecb.europa.eu · WORKING PAPER SERIES NO. 299 / JANUARY 2004 IMPORT PRICES...
38
WORKING PAPER SERIES NO. 299 / JANUARY 2004 IMPORT PRICES AND PRICING-TO-MARKET EFFECTS IN THE EURO AREA by Thomas Warmedinger
-
Upload
hoangthuan -
Category
Documents
-
view
216 -
download
3
Transcript of WORKING PAPER SERIES - ecb.europa.eu · WORKING PAPER SERIES NO. 299 / JANUARY 2004 IMPORT PRICES...

WORK ING PAPER S ER I E SNO. 299 / J ANUARY 2004
IMPORT PRICES ANDPRICING-TO-MARKETEFFECTS IN THEEURO AREA
by Thomas Warmedinger

In 2004 all ECB publications will feature
a motif taken from the
€100 banknote.
WORK ING PAPER S ER I E SNO. 299 / J ANUARY 2004
IMPORTPRICES AND
PRICING-TO-MARKETEFFECTSIN THE
EURO AREA1
by Thomas Warmedinger 2
2 European Central Bank, Kaiserstrasse 29, D-60311 Frankfurt am Main.
This paper can be downloaded without charge from http://www.ecb.int or from the Social Science Research Network
electronic library at http://ssrn.com/abstract_id=515043.
1 I would like to thank members of the ESCB Working Group on Econometric Modelling and in particular Jérôme HenryAndreas Beyer, Gabriel Fagan and Melanie Ward-Warmedinger for their valuable suggestions and comments on
earlier versions of this paper. The paper benefited also from the comments and suggestions made by an anonymous referee. The views expressed in this paper are my own and do not necessarily reflect those of the ECB.

© European Central Bank, 2004
AddressKaiserstrasse 2960311 Frankfurt am Main, Germany
Postal addressPostfach 16 03 1960066 Frankfurt am Main, Germany
Telephone+49 69 1344 0
Internethttp://www.ecb.int
Fax+49 69 1344 6000
Telex411 144 ecb d
All rights reserved.
Reproduction for educational and non-commercial purposes is permitted providedthat the source is acknowledged.
The views expressed in this paper do notnecessarily reflect those of the EuropeanCentral Bank.
The statement of purpose for the ECBWorking Paper Series is available from theECB website, http://www.ecb.int.
ISSN 1561-0810 (print)ISSN 1725-2806 (online)

3ECB
Work ing Paper Ser ie s No . 299January 2004
CONTENT SAbstract 4
Non-technical summary 5
1 Introduction 7
2 Pricing-to-market effects 8
3 Model for the import deflator 9
4 Estimation results for thebig-5 countries 11
4.1 Data and estimation issues 11
4.2 Long-run import price equation 11
4.3 Short-run dynamic equations 13
4.4 Test of stability 15
5 Euro area 15
5.1 Intra- and extra-area components 15
5.2 Aggregation of country resultsand PTM effects in the euro area 15
5.3 Area-wide model (AWM) 17
5.4 Euro area estimation 18
5.5 Short-run dynamic equation 19
5.6 Test of stability: OLS-CUSUM 19
6 Simulation analysis 19
6.1 10 % increase in the priceof energy 20
6.2 10 % depreciation of the euro 21
6.3 Interpretation of the simulationresults 21
7 Conclusions 21
References 23
Appendix 25
Table 29
European Central Bankworking paper series 31
Abstract
Keyw ords: Printing-to-m arket, im port prices, exchange-rate pass-through, euro area.
JEL classification: C 32, E31, F14, F47.
Pricing-to-market (PTM) behaviour implies that exporters adjust their prices to the prevailing
prices in their export markets. For the importing country, PTM effects can be interpreted as a
measure of the stability of domestic prices against foreign price and exchange rate
developments. PTM behaviour can be attributed to the level of competitiveness and price
stickiness in the importing country.
This paper investigates PTM behaviour in the euro area from the importing country’s
perspective, for both individual countries and the euro area as a whole. Analysis firstly
involves the estimation of PTM effects in the five largest euro area countries. Secondly, PTM
effects in the euro area as a whole are estimated to be slightly higher than one half. The
results from illustrative simulations suggest that the increase in euro-area inflation during the
first two years of monetary union can be largely attributed to oil price and exchange rate
developments.
4ECBWork ing Paper Ser ie s No . 299January 2004
Non-technical summary
From a monetary policy perspective, with the objective of price stabilisation, it is important to
know the extent to which domestic prices are affected by foreign price developments and
exchange rate fluctuations. Foreign prices and exchange rate fluctuations are transmitted to
domestic prices through the import deflator. The import deflator, as the link between
domestic and foreign prices, is determined by domestic and foreign factors, as well as the
exchange rate. The foreign determinants are the index of trade-weighted foreign export
prices and oil prices. If there would only be foreign determinants of import prices there would
be a full pass-through of foreign price and exchange rate movements. The limitation to the
pass-through arises because foreign exporters have to compete against domestic products.
In doing so they have to align their prices to some extent to the prevailing domestic market
prices in their export markets. One domestic determinant of the import deflator is thus the
domestic price level. Moreover, the degree to which foreign competitors have to align their
prices to the prevailing domestic prices is also determined by domestic factors, in particular
the degree of competitiveness and price stickiness in the domestic markets. This price-
setting behaviour of foreign exporters is generally referred to as pricing-to-market behaviour
(PTM).
Given the relevance of PTM effects for monetary policy, this paper estimates the magnitude
of such effects for the euro area. General empirical difficulties with the estimation of euro
area behavioural equations arise in view of the short history of European monetary union.
For this reason and for robustness, the analysis of PTM effects is undertaken for EMU
countries individually as well as for the euro area as a whole. This approach makes the most
out of the information contained in country and area-wide data.
In the first step the analysis involves the estimation of import price equations for the ESCB's
multi-country model (MCM), with the focus on the "big-5" member countries Germany,
France, Italy, Spain and Netherlands. The results from the country analysis reveal that long-
run PTM effects are with 0.44 largest in Germany and lowest (even non-existent) in the
Netherlands, suggesting that PTM effects depend on the country size. Long-run PTM effects
in the other three countries range between 0.16 and 0.26.
In the second step empirical results are derived for the euro area as a whole. This is done on
the one hand by aggregating the single country results derived before, and on the other hand
by estimating import price equations from area-wide data. Previous work on country
aggregation for the euro area has shown that the main advantage of analysis using country
level data is the ability to develop country-specific structures. Furthermore, the potential
problem of aggregation bias is of less relevance (Fabiani and Morgan, 2003). A specific case
5ECB
Work ing Paper Ser ie s No . 299January 2004

is given for the aggregation of import price equations. The country-specific intra- and extra-
area components of competitors' prices play an important role for the aggregation of country
results. This is because intra-area competitors' prices form part of the euro area 'domestic'
prices. The analysis of PTM effects in the euro area can thus not be derived from a
straightforward aggregation of country results, as the impact from competitors' prices within
the euro area forms part of the aggregate PTM effects. Data restrictions preclude a separate
treatment of intra and extra area import prices. The paper shows that the use of a simple
accounting measure allows the estimation of PTM effects. The evidence from country
aggregation, the area-wide model and some new estimates for the euro area point towards
PTM effects in the euro area in the order of magnitude of 0.55 in the long run, in other words
the pass-through is less than one half. In the short run PTM effects are even as high as 0.80.
The analysis in these first two sections of the paper focuses on the impact of foreign price
developments on the import deflator. The results reported above are only static first-round
results. Second-round effects arise because the import deflator affects domestic prices,
which in turn affect import prices through PTM effects. In order to quantify the second-round
effects, simulation analyses are undertaken using estimated import price equations and
bridge equations for domestic prices. An important illustrative result from the simulation
analysis is that the increase in euro-area inflation during the first two years of monetary union
can be largely attributed to oil price and exchange rate developments.
6ECBWork ing Paper Ser ie s No . 299January 2004

1. Introduction
Pricing-to-market (PTM) effects correspond to the extent to which exporters adjust their prices
to reflect the prevailing prices set by their competitors. In other words, PTM effects arise through
the limited pass-through of foreign prices and the exchange rate. From a monetary policy
perspective, with the objective of price stabilisation, it is important to know the extent to which
domestic prices are affected by foreign price developments and exchange rate fluctuations. The
degree of openness is often the only indicator used to address this issue. However, a relatively
limited pass-through of foreign prices would offset a relatively high degree of openness. The
analysis of PTM effects is therefore an important element in assessing the robustness of
domestic prices against foreign influences.
Given the relevance of PTM effects for monetary policy, this paper estimates the magnitude of
such effects for the euro area. Empirical difficulties arise in view of the short history of European
monetary union. For this reason and for robustness, the analysis of PTM effects is undertaken
for EMU countries individually as well as for the euro area as a whole. Since PTM behaviour is
analysed from the perspective of the importing country, both domestic prices and foreign
determinants are considered. The first part of the analysis involves the estimation of import price
equations for the ESCB's multi-country model (MCM), with the focus on the "big-5" member
countries Germany, France, Italy, Spain and Netherlands3. The second part derives empirical
results for the euro area as a whole from both an aggregation of the single country results and
from area-wide data. Previous work on country aggregation for the euro area has shown that
the main advantage of analysis using country level data is the ability to develop country-specific
structures. Furthermore, the potential problem of aggregation bias is of less relevance (Fabiani
and Morgan, 2003). This part argues that the country-specific intra- and extra-area components
of competitors' prices play an important role for the aggregation of country results. This is
because intra-area competitors' prices form part of the euro area 'domestic' prices.
The analysis in the first two sections of the paper focuses on the impact of foreign price
developments on the import deflator. The remainder of the paper considers in addition the
impact on domestic prices. For this purpose, simulation analyses are undertaken using
estimated import price equations and bridge equations for domestic prices. The simulation
results suggest that the increase in euro-area inflation during the first two years of monetary
union can be largely attributed to oil price and exchange rate developments.
The remainder paper is organised as follows. Part 2 provides a theoretical and empirical
background to the PTM hypothesis, and highlights some aspects of PTM in the context of
3 The limitation to the big-5 is a simplification, but they provide a close approximation to the euro area as a whole.
According to 1999 GDP weights at actual exchange rates the big-5 comprise of 85.9 % of euro12 (i.e. includingGreece) GDP. Using PPP exchange rates their share is 84.9 %.
7ECB
Work ing Paper Ser ie s No . 299January 2004
monetary union. Part 3 briefly introduces the model used for the estimation of import prices. The
estimation results are then shown in part 4. Part 5 contains the analysis of import prices and
PTM effects in the euro area as an aggregate. Diagnostic simulations of an oil price and
exchange rate shocks are conducted in part 6 in order to evaluate the speed of adjustment to
long-run equilibrium. Part 7 concludes.
2. Pricing-to-market effects
PTM effects describe the limited pass-through of foreign prices and the exchange rate due to
the adjustment to competitors’ prices. From a microeconomic perspective, PTM effects are
mainly attributed to product differentiation and imperfect competition (see e.g. Krugman (1987)).
Following either domestic cost rises or exchange rate movements, exporting firms seek to
maintain their market shares in foreign markets and to secure future sales. This is mainly a
feature of the short run, especially in situations characterised by considerable volatility in the
nominal exchange rate. PTM effects may also feature, however, in the long run when suppliers
in imperfect competition set market- and country-specific prices. The mark-up in this case might
be expected to be dependent on the elasticity of demand in the respective markets.
One important element of the above arguments is that changes in the exporters' cost structure
and exchange rate movements have the same effect on the exporters' profits at a given export
price. Fluctuations in the exchange rate are therefore in the long run transmitted in the same
way as changes in production costs. However, this is only a feature in a long-run perspective. In
comparison to fluctuations in domestic costs, exporters will in the short run react differently to
fluctuations in exchange rates, so that the pass-through might be quite different, not least
because the exchange-rate is much more volatile than production costs.
Jaeger et al. (2001) argue that low inflation regimes may reduce pass-through effects, i.e.
exhibit higher PTM effects. That is to say that if prices are relatively rigid, then increases in
costs are not passed on, as long as expectations of future costs and prices are low. The
formation of monetary union itself could be argued to have had such an impact, increasing PTM
effects in two ways. First, it may have caused a regime shift in participating countries towards
lower inflation and less exchange rate volatility. Second, as argued by Devereux et al. (1999),
the adoption of a single currency will have resulted in European prices being more insulated
from exchange-rate volatility, as is already the case in the United States. Since retailers must
choose whether to set prices in the consumers' or in the producers' currency, the existence of
many different currencies in Europe would induce numerous pricing decisions for a retailer
dealing in European markets, who may therefore be more likely to set his prices in the
8ECBWork ing Paper Ser ie s No . 299January 2004

producer's currency or a single numeraire currency, e.g. the US$. In contrast, a single currency
in Europe would increase the likelihood of setting prices in euro.
Given the short history of monetary union, the specific effects that could be attributed to its
formation can only be minor within the time span that is considered in this paper4. Monetary
union, however, is not the only common feature of the countries in the euro area. Membership
to the EC/EU could also play a role, as 4 of the big-5 are founding members of the EC, and
Spain joined already in 1986. The argument here would be that the abolition of customs and
duties within the union and later the formation of a single market would have led exporters from
both within and outside the union to formulate their prices for this market as a whole. Even more
generally, the simple geographic proximity of the countries in Europe might lead exporters to
some extent to formulate the same pricing strategy for such an area.
There are various contributions to support the hypothesis for PTM effects. Firstly from a
theoretical perspective, Brauer (1999) uses an oligopolistic framework to explain the pass
through of prices as a reaction to exchange rate or cost changes. The most influential factor for
the price setter is the price elasticity of demand, which is a function of reservation prices and the
substitutability between products. Examples for empirical PTM case studies include Khalaf and
Kichian (2000) for the case of the transportation equipment industry, Bernhofen and Xu (2000)
for the case of the petrochemical industry or Gross and Schmitt (2000) for the case of
automobiles. Independent of the particular aspects that the papers deal with, there is
unambiguous evidence for the existence of PTM effects.
3. Model for the import deflator
For our model we assume monopolistic competition with product differentiation and a fixed long-
run mark-up on production costs. Import prices pim are primarily explained by external factors,
since they are mainly set by foreign producers. In addition to competitors’ prices on the import
side in domestic currency (pcomp), the other external determinant for import prices is the price of
energy (pen). pcomp consists of two components, the price development in the trading partners’
countries measured in US$ (pcomp,US), and the nominal exchange rate against the US$ (er), i.e.
pcomp = pcomp, US ∗ er (1)
These are the ‘direct’ determinants of the import price in terms of a mark-up on marginal costs,
including the exchange rate pass-through. Furthermore, following the argument that foreign
4 The empirical parts of this paper (parts 4 and 5) relate to the sample period 1980 to the second quarter of 1999, i.e.
only 2 quarters of monetary union are part of the sample.
9ECB
Work ing Paper Ser ie s No . 299January 2004
trading partners exhibit pricing-to-market behaviour, the prevailing domestic prices p will also
have an impact on the import price.
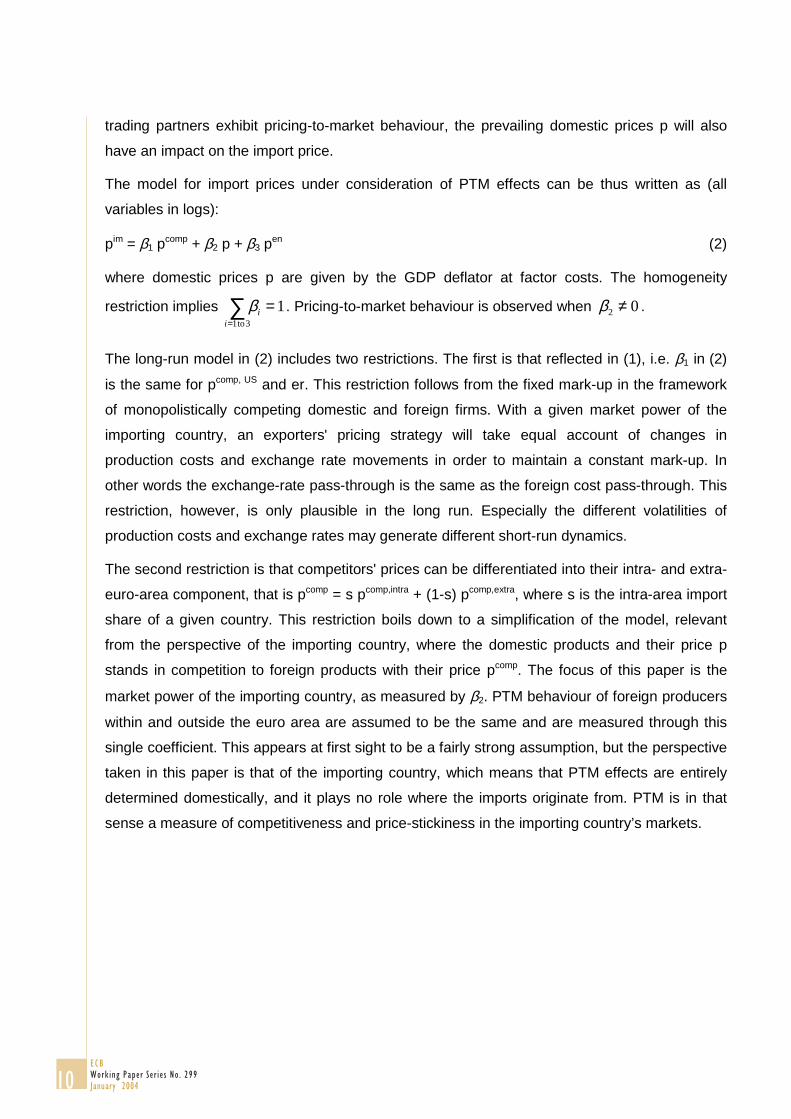
The model for import prices under consideration of PTM effects can be thus written as (all
variables in logs):
pim = β1 pcomp + β2 p + β3 p
en (2)
where domestic prices p are given by the GDP deflator at factor costs. The homogeneity
restriction implies 13to1
=∑=i
iβ . Pricing-to-market behaviour is observed when 02 ≠β .
The long-run model in (2) includes two restrictions. The first is that reflected in (1), i.e. β1 in (2)
is the same for pcomp, US and er. This restriction follows from the fixed mark-up in the framework
of monopolistically competing domestic and foreign firms. With a given market power of the
importing country, an exporters' pricing strategy will take equal account of changes in
production costs and exchange rate movements in order to maintain a constant mark-up. In
other words the exchange-rate pass-through is the same as the foreign cost pass-through. This
restriction, however, is only plausible in the long run. Especially the different volatilities of
production costs and exchange rates may generate different short-run dynamics.
The second restriction is that competitors' prices can be differentiated into their intra- and extra-
euro-area component, that is pcomp = s pcomp,intra + (1-s) pcomp,extra, where s is the intra-area import
share of a given country. This restriction boils down to a simplification of the model, relevant
from the perspective of the importing country, where the domestic products and their price p
stands in competition to foreign products with their price pcomp. The focus of this paper is the
market power of the importing country, as measured by β2. PTM behaviour of foreign producers
within and outside the euro area are assumed to be the same and are measured through this
single coefficient. This appears at first sight to be a fairly strong assumption, but the perspective
taken in this paper is that of the importing country, which means that PTM effects are entirely
determined domestically, and it plays no role where the imports originate from. PTM is in that
sense a measure of competitiveness and price-stickiness in the importing country’s markets.
10ECBWork ing Paper Ser ie s No . 299January 2004

4. Estimation results for the big-5 countries
4.1 Data and estimation issues
The data base used for this exercise is currently based on ESA795 definitions, and updated
from 1997 with growth rates from ESA95 data. Country-specific forecast experiences indicated
that a shift in the intercept is sufficient to account for this change in the accounting framework.
The estimation of the import price equations takes account of the impact of the data revisions
on the long- and short-run specification of these equations. In addition, there have been further
potential sources for structural change in recent years. One relates to data issues, as monetary
unification brought about some further harmonisation in definitions for a number of key
variables. The other potential source for structural change relates to monetary union itself, when
behavioural relationships may have changed as a result of a new economic framework.
Furthermore, as argued above, the increasing integration of Europe may have led to increased
PTM behaviour. As the effects of structural change are of particular policy relevance, stability of
the estimated import price equations will be tested. Apart from the direct evidence of stability in
the values of estimated coefficients, OLS-CUSUM tests are performed to test stability more
formally.
4.2 Long-run import price equations
The traditional two-step approach, used in such large structural macro-econometric models,
entails a co-integrating long-term relationship and dynamic short-term equations. The long-term
equation must form part of a stable and well defined long-run equilibrium. The stationary
residual of this long-run equation enters the short-run equation, where the prime objective is to
achieve a good fit to the data. The short-term dynamic equation then allows for different
adjustments of import prices to changes in foreign competitors' prices pcomp, US and the exchange
rate er.
The coefficients of the long-run equations are estimated using the fully-modified estimation
method (FME, Phillips et al. 1990, Phillips 1990). The advantage of this estimation method is
that FME applies corrections to OLS to take care of endogeneity and serial correlation
problems. This is appropriate if there is a single cointegrating relationship between I(1)
variables6 (Phillips 1995). The estimation is based on the sample period 1980Q1 to 1999Q2.
The table below shows the estimated coefficients of the long-run equations in the big-5 euro
area countries. The t-values are given in small print under the estimated coefficients.
5 European System of national Accounts.6 Stationarity tests have shown that all variables in question are I(1), although there are some borderline cases
between I(1) and I(2).
11ECB
Work ing Paper Ser ie s No . 299January 2004

Table 1: Long-run import price equations in the big-5 countries7
MCM-5 DE FR IT ES NL
c -0.557 -1.379 -3.674 -2.961 -0.782
pcomp 0.476
7.95
0.731
9.49
0.532
10.94
0.651
11.13
0.929
87.95
p 0.439 0.155
2.64
0.261
7.00
0.176
4.01
-
pen 0.085
4.93
0.115 0.207 0.173 0.071
D901p - - -0.063
-7.17
- -
D911p -0.050
-11.63
- - - -
D921p - - - -0.067
-5.86
-
D971p -0.082
-11.63
-0.045
-4.21
- -0.047
-3.67
-0.014
-1.00
ADFcrit. val. 3.06 /2.77
(5% / 10 %)
-3.42 -3.11 -2.87 -4.10 -3.67
Estimation sample period: 1980Q1 to 1999Q2
A step dummy from 1997Q1 (D971p) is included in the estimation to take account of the change
in the data series from that date. It proves significant in all countries but Italy. A step dummy is
also needed for German unification from 1991Q1 (D911p) and for Italy and Spain in order to
obtain a stationary residual (D901p from 1990q1 and D921p from 1992q1).
The table shows the results of an augmented Dickey-Fuller test for stationarity of the residual.
The critical values are -3.06 and -2.77 at 5% and 10% significance levels respectively. All
residuals from the long-run equations pass this stationarity test at 5% significance, except for
the Italian residual, which only passes at the 10% significance level. In order to use the results
of this estimation for aggregation in the later part of this paper, all 5 countries had to be dealt
with in a homogeneous manner. It is in this sense a satisfactory result, as it was possible to
formulate stable and homogeneous long-term relations for all 5 countries under consideration.
Consistent with the hypothesis that PTM effects are more pronounced in larger countries,
Germany exhibits the largest PTM effect. For the Netherlands, the smallest of the five countries,
domestic prices do not co-integrate with the other variables and have therefore been left out.
7 The missing t-statistics are due to the homogeneity restriction.
12ECBWork ing Paper Ser ie s No . 299January 2004

PTM effects in France are found to be smaller than in Italy and Spain. Energy prices play a
more important role in Italy and Spain.
The order of magnitude of the PTM effects is quite high for Germany, where even in the long
run less than 60 % of foreign and energy price developments and changes in the exchange rate
are passed onto German import prices. The second largest economy in the euro area, France,
exhibits at first sight substantially smaller PTM effects. However, this conclusion is drawn on the
basis of the coefficients on domestic prices in the import price equations. There are of course
other elements in PTM behaviour, such as the impact of import prices on domestic prices, but
these elements lie outside the scope of this part of the analysis.
4.3 Short-run dynamic equations
The short-run ECM equations are given as
1630
530
430
330
,2
311 −
−=−=−=−=−−=
+∆+∆+∆+∆+∆+=∆ ∑∑∑∑∑ ectpperppcptoi
eni
toii
toii
toi
UScompi
toi
imi
im αααααα (3)
where ect is the residual from the long-run equation, i.e. the error-correction term. Competitors'
prices in domestic currency pcomp are divided into two components: Competitors' prices in US-
Dollar pcomp, US and the exchange rate er. In the short-term analysis it is therefore possible to
have different dynamic adjustments to long-term equilibrium, since it is conceivable that cost
developments abroad and exchange-rate movements are passed on differently to import prices,
or that there are generally non-common factors in both components. The significance of the
difference in pcomp, US and er is tested. The set of variables entering the short-run dynamic
equation is not restricted to be the same in all countries.
Moving on to the results of this model, the coefficient of the error-correction term is found to be
significant in all countries8. Adjustment to long-run equilibrium, as measured by this coefficient,
is fastest in Germany, but there are also other factors that will influence the adjustment time
which are discussed in the simulation analysis below. The distinction between changes in actual
cost effects and the exchange rate turned out to be significant in all countries but Italy9. The
pass-through of foreign prices in Germany, France and the Netherlands is stronger than the
pass-through of changes in the exchange rate. In Spain no short-term impact of foreign prices is
revealed and a relatively small impact of the exchange rate can be identified. Instead, domestic
8 This should not be misinterpreted in a sense of testing for co-integration, as different critical values would be
applicable for that (see Banerjee et al. 1998). Testing for Co-integration has already been done in the frameworkof the long-run equations, where stationarity of the residual term has been formally checked.
9 An F-test on the coefficients of ∆ pcomp, US and ∆ er being equal for lags 0 and 1 resulted in F(2,68) = 0.15, i.e. thehypothesis is accepted at all conventional significance levels.
13ECB
Work ing Paper Ser ie s No . 299January 2004

prices p are found to have a stronger impact than in other countries with a coefficient of 0.678
(first lag), i.e. PTM effects in Spain are particularly strong in the short run. In Germany, France
and Italy PTM effects have the same order of magnitude in the short run as in the long-run
equations. For the Netherlands, as in the long run, we find no PTM effects in the short run.
Table 2: Short-run dynamic equations in the big-5 countries
MCM-5 DE FR IT ES NL
constant -0.004
-2.48
-0.002
-1.66
-0.003
-1.33
-0.003
-1.12
-0.000
-0.04
ect-1 -0.388
-4.43
-0.109
-2.01
-0.159
-2.44
-0.219
-3.32
-0.117
-1.95
∆ pim -2 0.329
4.29
0 0 0 0
∆ pcomp, US 0 0.624
4.93
0.363
8.49
0 0.729
3.88
∆ pcomp, US -1 0.700
5.47
0.363
3.07
0.141
3.26
0 0
∆ er 0.235
10.37
0.492
6.83
0.363
(8.49)10
0.147
4.40
0.523
5.33
∆ er-1 0.356
5.70
0.237
3.72
0.141
(3.26)
0.109
3.28
0
∆ p 0.448
2.71
0.172
1.67
0.328
3.11
0 0
∆ p-1 0 0 0 0.678
4.07
0
∆ ln pen 0.112
10.46
0.159
11.87
0.100
5.63
0.106
8.10
∆ pen -1 0.035
2.30
0 0 0.043
2.37
0
∆ pen -2 -0.083
-4.93
0 0 0 0
D971 -0.052
-4.79
0 0 0 0
R2 0.80 0.88 0.88 0.74 0.71
DW 1.97 1.55 1.89 0.88 1.78
Estimation sample period: 1980Q2 to 1999Q2 (NL), 1980Q3 to 1999Q2 (FR, IT, ES), 1980Q4 to 1999Q2 (DE)
10 The difference in the coefficients on ∆ pcomp, US and ∆ er are insignificant in Italy.
14ECBWork ing Paper Ser ie s No . 299January 2004

4.4 Test of stability
Both statistical and economic factors suggest that there may have been a structural break in the
sample. Economically, structural change might have occurred in the run-up and in the
implementation of monetary union. The issue of structural change in the context of monetary
union is further elaborated in Fagan et al. (2001) and Henry (1999). Moreover, as described
above, the data set used in this paper is based on ESA79 data until 1996Q4, supplemented
until the end of the sample period with ESA95 growth rates. The break in the data in 1997 has
been taken account of by inclusion of a dummy variable. However, in order to test for stability
more formally, OLS-CUSUM tests (Ploberger et al. 1992) were performed in the dynamic short-
run equations. As compared to the standard CUSUM test based on recursive residuals, neither
version is uniformly superior to the other. In case of structural shifts which occur late in the
sample, however, OLS-CUSUM performs better. Given the late break in the data in 1997, OLS-
CUSUM will thus be reported here. Standard CUSUM tests have nevertheless been performed,
and all the results from OLS-CUSUM were confirmed. The graphical result of the OLS-CUSUM
tests is shown in the appendix. It shows that if there was any structural break in the parameters
it has been sufficiently accounted for by inclusion of a dummy variable.
5. Euro area
5.1 Intra- and extra-area components
For analysis of the euro area as a whole, it is necessary to introduce a distinction, which will be
important in determining PTM effects in the euro area. The import price, as well as its key
explanatory variable, i.e. the competitors’ price on the import side, now have an intra and an
extra euro area component. The average import price takes the prices of imports from within
and from outside the area into account, whereas the consolidated import price refers only to the
price of imports from outside. Similarly, the competitors’ price on the import side has an intra
and extra area dimension. Sufficiently long time series data are currently only available for
average euro area import deflators, whereas competitors’ price indices can be constructed
based on intra or extra area definitions.
5.2 Aggregation of country results and PTM effects in the euro area
When looking at the euro area as a whole, the intra-area effect from competitors’ prices pcomp
can be attributed to the pricing-to-market effect, as extra-area exporters have to align the prices
of their products to domestic prices in individual countries, but also to trade prices between
15ECB
Work ing Paper Ser ie s No . 299January 2004

countries. The intra-area import prices form, in that sense, part of euro area domestic prices.
Undoubtedly, this can only be seen as an accounting measure, a second best to a complete
data set including import prices for both intra- and extra-area components. The long-run
equations estimated for the individual countries above were given as
pim = β1 pcomp + β2 p + β3 p
en (4)
A simple aggregation of the country coefficients across the big-5 countries using GDP weights11
would result in
pim = 0.60 pcomp + 0.27 p + 0.13 pen (5)
This should not be interpreted in the same way as an estimated equation, because, for
example, the country coefficients do not result from a simultaneous estimation. However, the
focus is here on the PTM effects. Decomposing therefore the competitors' prices into their intra
and extra component, using the share of intra euro area imports sj in total imports for each
country j in the euro area,
pcompj = sj p
comp, intraj + (1-sj) p
comp, extraj (6)
allows then to approximate PTM effects on an area-wide level as follows.
NLITFRESDEjppspsp en
jjj
j
compjjj
jjjjj
im ,,,,,)1()( 3121 =+−++= ∑∑∑ βωβωββω (7)
where ωj are the GDP weights and sj the shares12 of intra-area imports of each country. The
result of this aggregation is
pim = 0.565 p + 0.305 pcomp, extra + 0.129 pen (8)
The euro area as a whole thus exhibits PTM effects of 0.57, larger than in any individual country
effect. It is important to note that this result comes out of a long-run set-up where, as detailed
above, fluctuations in the exchange rate are transmitted in the same way as changes in
production costs. In other words there is a constant mark-up on production costs, determined in
the producing country, and represented through the coefficient on pcomp in the model. In
contrast, the extent of the pass-through, i.e. the PTM effects, are determined in the importing
country and are a function of the competitive conditions that prevail in that country. The latter is
represented in the model through the coefficient on domestic prices p, which is thus
independent from that distinction between productions costs and exchange rate movements.
The equal treatment of the pass-through of exchange rate fluctuations and producers’ costs is
particularly important when adding the intra-area competitors’ prices to the domestic price
11 Using 1999 country weights based on PPP exchange rate conversions and re-scaling the 5 countries under
consideration to 100%.12 Average import shares 1995-1997.
16ECBWork ing Paper Ser ie s No . 299January 2004

component in the euro area, because the exchange rate movements that are entailed in the
intra-area competitors’ price for the estimation period play obviously no more part in monetary
union. Moreover, the stability tests reported above indicate that historic events like e.g. the
exchange rate movements in the 1992 ERM crises did not have an impact on the coefficients of
the equations.
5.3 Area-wide model (AWM)
The evidence on PTM effects from the ECB's AWM (Fagan et al., 2001) are taken as a
reference point. The model is estimated on aggregate data for the euro area. Irrespective of any
PTM effects, both import and export deflators in the AWM include some intra-area effect already
by construction. The import deflator in the AWM is, in the long run, given as (all variables in
logs)
pim = 0.65 pex + 0.1 pf + 0.25 pcom (9)
where pex is the export deflator, pf the foreign deflator, and pcom is a commodity price index
which contains the price of energy. pex refers to both intra and extra area export prices, i.e.
fex ppp 3.07.0 += (10)
The PTM effect for import prices in the euro area is represented by intra-area export prices. A
reduced-form equation for import prices which shows PTM effects can thus be derived as
fcomim p 0.23 p 0.25 p0.52p ++= (11)
The PTM effect as measured by the coefficient on domestic prices p is here slightly lower than
the one found through aggregation of single-country equations above, but still higher than in any
individual country. There is, however, a substantial difference in the impact of energy prices,
which is found in the AWM to be about twice as large as in the aggregated single countries
equation. This can possibly be attributed to a different definition of the energy variable. A further
potential source for differences is that the AWM encases all euro area countries, whereas the
big-5 only account for a GDP share of about 85 %.
17ECB
Work ing Paper Ser ie s No . 299January 2004

5.4 Euro area estimation
The coefficients of the import equation in the AWM are not directly comparable to those in the
individual country equations, as different explanatory variables are included in both. It is
therefore necessary to complete the analysis with an estimation of area-wide import price
equations which are analogous to the single-country analysis. The estimation method for the
long-run equations is also FME.
For better comparison, the coefficients from the aggregation of single country results and the
AWM are also shown in the table below. The last column shows the results of the estimation of
the following model:
D971pD911ppppp comcompim543210 ββββββ +++++= (12)
Table 3: Long-run import price equations and PTM effects in the euro area
EA Country aggregation AWM FME
β0 - - -0.284
-3.81
β1 0.60 - 0.732
13.45
β2 0.27 - 0.185
4.88
β3 0.13 0.25 0.08413
β4 - - -0.020
-3.72
β5 - - -0.014
-3.03
PTM 0.56 0.52 0.55
pcomp,extra 0.31 0.23 0.37
ADFcrit. val. 3.06 /2.77
(5% / 10 %)
- - -4.79
Sample period 1980q1 to 1999q2.
The residual from the estimated long-run euro-area import prices equation passes the Dickey-
Fuller test for stationarity. According to this estimation, import prices in the euro area are mainly
explained by competitors' prices pcomp. However, as pcomp refers to the intra- and extra- area
definition, the intra-area share is again added to domestic prices p in order to obtain a measure
13 T-statistic missing due to homogeneity restriction.
18ECBWork ing Paper Ser ie s No . 299January 2004

for PTM effects. The intra-area share of euro area imports is 0.5. PTM effects according to this
measure are thus 0.55. The three measures for PTM effects are therefore found to be in a very
narrow range of 0.52 to 0.56. Noteworthy is also the proximity of the PTM effects resulting from
the aggregation of country coefficients and the estimated coefficients from the area-wide, which
are 0.56 and 0.55. This is a very remarkable result, given the difficulties in aggregating the intra-
and extra-components, and also the fact that the country analysis comprised only of the big-5
euro area countries.
5.5 Short-run dynamic equation
For completeness, the short-run dynamic equation is also included in the analysis. After
dropping the insignificant variables, the following short-run dynamic equation results:
sample period: 1980q2 to 1999q2
∆ ln pim = -0.003-2.06 - 0.275-3.53 ect + 0.7435.71 ∆ ln pcomp, US + 0.6437.33 ∆ ln er +0.4323.67 ∆ ln p
+ 0.0494.43 ∆ ln pcom + 0.0514.62 ∆ ln pcom -1 (13)
R2 = 0.91 DW = 1.14
The hypothesis that the coefficients of pcomp,US and er are the same can be rejected at the 5 %
significance level14. We find that, as in the country analysis, the adjustment to changes in
competitors' prices pcomp,US is slightly stronger in the short run than the adjustment to changes in
the exchange rate. PTM effects are very high in the short run. Using the same accounting
measure again, and interpret the intra-area share of competitors' prices as domestic prices, we
obtain PTM effects of 0.80.
5.6 Test of stability: OLS-CUSUM
Similarly to the single-country analysis an OLS-CUSUM test was applied to the residuals from
both short-run dynamic equations above. The Null Hypothesis of stability cannot be rejected
(See graph in the appendix).
6. Simulation analysis
In this section, two diagnostic shocks, an exchange rate and an oil-price shock, are simulated in
order to evaluate the overall effect of such shocks as well as the adjustment path of import
prices. The data used for these simulations comprises of the historical data as well as the
14 F(1, 69) = 4.63, significance level 0.03.
19ECB
Work ing Paper Ser ie s No . 299January 2004

forecast data until 2002q4. The simulations are run in isolated mode, which means that all
variables on the right hand side (except any lagged endogenous) are treated as exogenous.
Additionally, the simulations were also run in a mode in which domestic prices p are themselves
a function of the import price. This has been implemented in a very stylised way by using the
following calibrated equations
∆����� �∆ p-1�������� ��µ ∆ pim + ε (14)
where is the adjustment parameter which is arbitrarily set at 0.8, µ is the import share in each
country15, and ε is a residual term fitting the equation to the data. This equation ensures that a
change in the import price will eventually be passed onto the domestic price to the extent of the
import share in that country.
This type of simulation exercise shows the adjustment of the endogenous variable, in this case
the import price, to a change in its explanatory variable. The graphs in the appendix show the
effect of the shocks on 5 variables for each country as a percentage deviation from baseline.
The dotted line shows the effect on prices resulting from the above equation. The two horizontal
lines show the long-run effect on the import price for both cases, i.e. with and without inclusion
of a price effect. The remaining two lines show the actual effect on the import price for both
cases. As there are no PTM effects in the Netherlands, there are only three lines in the graph.
6.1 10 % increase in the price of energy
The table provided in the appendix shows the impact of this shock on import prices as a
percentage deviation from baseline. The last row shows the long-term impact, as determined by
the long-run equation. For ease of illustration graphs of these impacts are also presented in the
appendix.
The long-term impact is given by the estimated coefficient on pen (euro area: pcom) in the long-
run equation. The speed of adjustment to long-run equilibrium is mainly determined by the
coefficients of the error-correction-term, but also by the coefficient on pen (pcom) in the short-run
dynamic equation. The coefficients on the error-correction term are highest in Germany (-0.39)
and the euro area (-0.27), whereas the other countries exhibit a larger short-term coefficient on
pen. From the coefficients, there are thus no obvious differences in the speed of adjustment. For
the Netherlands, independently from this being the only country with no PTM effects,
adjustment to the new long-run equilibrium is from above, i.e. there is some overshooting in the
short run. In Germany there is also an overshooting effect, although very small and with a few
quarters delay. In France the adjustment to long-run equilibrium takes place almost instantly. In
Spain, Italy and the euro area adjustment is a bit smoother, and import prices are close to their 15 As an average from 1980-1996, which are DE 0.26, FR 0.25, IT 0.17, ES 0.23, NL 0.47 and euro area 0.25.
20ECBWork ing Paper Ser ie s No . 299January 2004

new long-run equilibrium within 3-4 years. The inclusion of the price equation has no significant
effect on the adjustment pattern. Only in Germany, where PTM effects are relatively high,
inclusion of the price equation has a noticeable effect16. The overall impact on import prices
ranges from 0.7 % to 2.5 %.
6.2 10 % depreciation of the euro
The main difference to the previous simulation is the scale of the effect. The long-run impact on
import prices ranges here between 4.6 % and 9.3 %. In this scenario there is an overshooting
effect in Germany and the euro area, and some minor overshooting also in France. Again, the
adjustment paths are fairly independent of whether price effects are included or not. However,
the inclusion of price effects accelerates the otherwise rather slow adjustment to long-run
equilibrium in Spain.
6.3 Interpretation of the simulation results
The simulation results have an interesting interpretation in the context of the depreciation of the
Euro and the rise in the oil price at the beginning of monetary union. The commodity price index
used in the AWM increased in the first two years of monetary union by about 35%, whilst the
Euro depreciated against the US-Dollar by more than 20% in the same period. Using the
simulation results for the two shocks, i.e. a rise in the import deflator after two years of 1.6%
following a 10% increase in the price of energy, and a 5.6% rise in the import deflator following
a 10% depreciation of the Euro, and multiplying these numbers by 3.5 and 2, respectively, in
order to mimic the actual developments in the first two years of monetary union, adds up to an
increase in the import deflator of 17%. Calculating the impact on domestic prices using the
calibrated equation would imply an increase of 3.4%. The actual increase in the GDP deflator at
factor cost was 2.4% in that period, i.e. the simulation results exhibit a slightly exaggerated
effect on prices. The difference between actual and simulated price effects is however certainly
small enough to attribute it to factors that have not been taken into account in the simulations.
Overall, the simulation results suggest that the rise in inflation in the euro area in 2000 can be
largely explained by the external factors of oil-price and exchange rate.
7. Conclusions
The analysis undertaken within this paper reveals evidence for PTM effects in Germany,
France, Italy and Spain, but not in the Netherlands. Stable long-run cointegrating relationships
are found for all five countries in a harmonised way in the sense of resulting from an identical
16 The euro area results are based on the estimated equation, not the accounting equation with higher PTM effects.
21ECB
Work ing Paper Ser ie s No . 299January 2004

model. This was a prerequisite for the aggregation of country results. Using this harmonised
approach, PTM effects in individual countries are the largest, at 0.44 in Germany and for the
other countries of a magnitude of around 0.2.
The analysis of PTM effects in the euro area can not be derived from a straightforward
aggregation of country results, as the impact from competitors' prices within the euro area forms
part of the aggregate PTM effects. Data restrictions preclude a separate treatment of intra and
extra area import prices. The paper shows that the use of a simple accounting measure allows
the estimation of PTM effects. The evidence from country aggregation, the area-wide model and
some new estimates for the euro area point towards PTM effects in the euro area in the order of
magnitude of 0.55 in the long run. In the short run PTM effects are as high as 0.80.
Simulation analyses undertaken on the basis of the estimated equations for the import deflator
provide insights into the price developments in the early stages of monetary union. The results
suggest that the increase in euro-area inflation during the first two years of monetary union can
be largely attributed to oil price and exchange rate developments.
22ECBWork ing Paper Ser ie s No . 299January 2004

References
Anderton B. [2001], "Euro area import prices and exchange rate pass-through", mimeo ECB.
Banerjee A., J. J. Dolado and R. Mestre [1998], "Error-correction mechanism tests for
cointegration in a single-equation framework", Journal of Time Series Analysis Vol. 19, No. 3.
Bergin P. R. and R. C. Feenstra [2001], "Pricing-to-market, staggered contracts, and real
exchange rate persistence", Journal of International Economics 54, 333-359.
Bernhofen B. and P. Xu [2000], "Exchange rates and market power: evidence from the
petrochemical industry", Journal of International Economics 52, 283-297.
Brauer H. [1999], "Price setting in international markets", Kiel Working Paper No. 915.
Devereux M. B., C. Engel and C. Tille [1999], "Exchange Rate Pass-Through and the Welfare
Effects of the Euro", NBER Working Paper 7382.
Fabiani S. and J. Morgan [2003], “Aggregation and euro area Phillips curves”, ECB Working
Paper No. 213.
Fagan G., J. Henry and R. Mestre [2001], "An area-wide model (AWM) for the euro area", ECB
Working Paper No. 42.
Faruqee H. [1995], "Pricing to Market and the Real Exchange Rate", IMF Working Paper,
95/12.
Gross D. M. and N. Schmitt [2000], "Exchange rate pass-through and dynamic oligopoly: an
empirical investigation", Journal of International Economics 52, 89-112.
Henry J. [1999], “Euro area-wide and country modelling at the start of EMU”, Economic and
Financial Modelling, Autumn, 103-148.
Jaeger A., K. Ross, Z. Kontelemis, M. Kieler and G. Meredith [2001], "Monetary and
Exchange Rate Policies of the Euro Area", mimeo International Monetary Fund.
Karlsson, T. [2000], "Definition of trade variables", mimeo ECB.
Khalaf L. and M. Kichian [2000], "Testing the Pricing-to-Market Hypothesis: Case of the
Transportation Equipment Industry", Bank of Canada Working Paper 2000-8.
Krugman P. [1987], "Pricing to market when the exchange rate changes", NBER Working
Paper No. 1926.
Obstfeld M. and K. Rogoff [1996], "Foundations of International Macroeconomics", MIT Press.
Phillips P. C. B. [1990], "Fully modified least squares and vector autoregression",
Econometrica, No. 5, 1023-1078.
23ECB
Work ing Paper Ser ie s No . 299January 2004

Phillips P. C. B. and B. E. Hansen [1990], “Statistical Inference in Instrumental Variable
Regression with I(1) Processes”, Review of Economic Studies, 57, 99-125.
Ploberger W. and W. Krämer [1992], "The CUSUM Test with OLS Residuals", Econometrica,
Vol. 60, No. 2, 271-285.
24ECBWork ing Paper Ser ie s No . 299January 2004

Appendix 1: Residuals from the long-run equations
Long-run residuals
Germany
1980 1982 1984 1986 1988 1990 1992 1994 1996 1998-0.100
-0.075
-0.050
-0.025
-0.000
0.025
0.050
0.075
0.100
France
1980 1982 1984 1986 1988 1990 1992 1994 1996 1998-0.100
-0.075
-0.050
-0.025
-0.000
0.025
0.050
0.075
0.100
Netherlands
1980 1982 1984 1986 1988 1990 1992 1994 1996 1998-0.100
-0.075
-0.050
-0.025
-0.000
0.025
0.050
0.075
0.100
Italy
1980 1982 1984 1986 1988 1990 1992 1994 1996 1998-0.100
-0.075
-0.050
-0.025
-0.000
0.025
0.050
0.075
0.100
Spain
1980 1982 1984 1986 1988 1990 1992 1994 1996 1998-0.100
-0.075
-0.050
-0.025
-0.000
0.025
0.050
0.075
0.100
DE
FR
ES
NL
IT
EA
Euro Area
1980 1982 1984 1986 1988 1990 1992 1994 1996 1998-0.100
-0.075
-0.050
-0.025
-0.000
0.025
0.050
0.075
0.100
25ECB
Work ing Paper Ser ie s No . 299January 2004

Appendix 2: OLS-CUSUM tests
Germany
1980 1982 1984 1986 1988 1990 1992 1994 1996 1998-1.5
-1.0
-0.5
0.0
0.5
1.0
1.5
France
1980 1982 1984 1986 1988 1990 1992 1994 1996 1998-1.5
-1.0
-0.5
0.0
0.5
1.0
1.5
Netherlands
1980 1982 1984 1986 1988 1990 1992 1994 1996 1998-1.5
-1.0
-0.5
0.0
0.5
1.0
1.5
OLS-CUSUM Tests
Italy
1980 1982 1984 1986 1988 1990 1992 1994 1996 1998-1.5
-1.0
-0.5
0.0
0.5
1.0
1.5
Spain
1980 1982 1984 1986 1988 1990 1992 1994 1996 1998-1.5
-1.0
-0.5
0.0
0.5
1.0
1.5
Euro Area
1980 1982 1984 1986 1988 1990 1992 1994 1996 1998-1.5
-1.0
-0.5
0.0
0.5
1.0
1.5
DE
FR
ES
NL
IT
EA
26ECBWork ing Paper Ser ie s No . 299January 2004

Appendix 3: Simulation analysis
Table 4: Impact on import prices of a 10% increase in the price of energy.
Time DE ES FR IT NL EA DE ES FR IT NL EA
without price effect with price effect
Q1 0.00 0.96 1.07 1.58 1.02 0.56 0.00 0.96 1.08 1.61 1.02 0.57
Q2 0.65 1.53 1.08 1.67 0.98 1.22 0.67 1.56 1.09 1.72 0.98 1.25
Q3 -0.08 1.58 1.08 1.75 0.94 1.33 -0.07 1.66 1.10 1.81 0.94 1.37
Year 1 0.48 1.63 1.08 1.82 0.91 1.40 0.51 1.74 1.11 1.89 0.91 1.46
Q1 0.37 1.67 1.08 1.88 0.88 1.46 0.40 1.81 1.12 1.96 0.88 1.53
Q2 0.73 1.71 1.09 1.94 0.86 1.50 0.77 1.86 1.12 2.03 0.86 1.58
Q3 0.72 1.73 1.09 1.99 0.84 1.53 0.78 1.90 1.12 2.08 0.84 1.61
Year 2 0.88 1.76 1.09 2.03 0.82 1.55 0.95 1.93 1.13 2.13 0.82 1.64
3 0.85 1.83 1.09 2.16 0.76 1.59 0.95 1.98 1.14 2.27 0.76 1.71
4 0.81 1.86 1.10 2.24 0.73 1.60 0.91 1.99 1.14 2.36 0.73 1.73
5 0.81 1.88 1.10 2.29 0.71 1.60 0.92 1.99 1.14 2.40 0.71 1.74
6 0.81 1.89 1.10 2.33 0.70 1.60 0.92 1.98 1.15 2.43 0.70 1.74
7 0.81 1.90 1.10 2.35 0.69 1.60 0.92 1.97 1.15 2.45 0.69 1.74
8 0.81 1.90 1.10 2.36 0.69 1.60 0.92 1.96 1.15 2.46 0.69 1.74
9 0.81 1.90 1.10 2.37 0.68 1.60 0.92 1.96 1.15 2.47 0.68 1.74
10 0.81 1.90 1.10 2.37 0.68 1.60 0.92 1.96 1.15 2.47 0.68 1.74
Long run 0.81 1.91 1.10 2.38 0.68 1.60 0.92 1.96 1.15 2.48 0.68 1.74
27ECB
Work ing Paper Ser ie s No . 299January 2004

DE
NL
IT
FR
ES
EA
- 0 . 2 0
0 . 0 0
0 . 2 0
0 . 4 0
0 . 6 0
0 . 8 0
1 . 0 0
1 2 3 4 5 6 7 8 9 1 0
0 . 0 0
0 . 5 0
1 . 0 0
1 . 5 0
2 . 0 0
2 . 5 0
1 2 3 4 5 6 7 8 9 1 0
0 . 0 0
0 . 2 0
0 . 4 0
0 . 6 0
0 . 8 0
1 . 0 0
1 . 2 0
1 . 4 0
1 2 3 4 5 6 7 8 9 1 0
0 . 0 0
0 . 5 0
1 . 0 0
1 . 5 0
2 . 0 0
2 . 5 0
3 . 0 0
1 2 3 4 5 6 7 8 9 1 0
0 . 0 0
0 . 2 0
0 . 4 0
0 . 6 0
0 . 8 0
1 . 0 0
1 . 2 0
1 2 3 4 5 6 7 8 9 1 0
0 . 0 0
0 . 2 0
0 . 4 0
0 . 6 0
0 . 8 0
1 . 0 0
1 . 2 0
1 . 4 0
1 . 6 0
1 . 8 0
2 . 0 0
1 2 3 4 5 6 7 8 9 1 0
28ECBWork ing Paper Ser ie s No . 299January 2004

Table 5: Impact on import prices of a 10% depreciation of the euro against the US-Dollar.
Time DE ES FR IT NL EA DE ES FR IT NL EA
without price effects with price effects
Q1 2.27 1.21 4.80 3.85 5.11 6.24 2.32 1.21 4.84 3.91 5.11 6.34
Q2 6.74 3.00 7.46 4.00 5.59 5.93 6.96 3.04 7.56 4.10 5.59 6.10
Q3 6.71 3.53 7.43 4.13 6.01 5.71 7.07 3.67 7.58 4.27 6.01 5.94
Year 1 7.40 3.99 7.41 4.25 6.39 5.54 7.93 4.21 7.60 4.42 6.39 5.82
Q1 6.31 4.38 7.39 4.35 6.72 5.42 6.93 4.68 7.60 4.55 6.72 5.74
Q2 5.89 4.71 7.37 4.45 7.01 5.34 6.58 5.08 7.61 4.66 7.01 5.68
Q3 5.05 5.00 7.35 4.53 7.27 5.28 5.74 5.42 7.61 4.76 7.27 5.64
Year 2 4.75 5.25 7.34 4.61 7.50 5.23 5.44 5.70 7.61 4.84 7.50 5.61
3 4.49 5.92 7.29 4.83 8.19 5.14 5.09 6.44 7.59 5.08 8.19 5.56
4 4.66 6.28 7.26 4.97 8.61 5.12 5.27 6.76 7.57 5.22 8.61 5.55
5 4.65 6.48 7.25 5.06 8.86 5.11 5.27 6.89 7.55 5.31 8.86 5.55
6 4.64 6.58 7.24 5.12 9.02 5.11 5.26 6.92 7.54 5.35 9.02 5.55
7 4.64 6.63 7.23 5.15 9.11 5.11 5.26 6.92 7.53 5.38 9.11 5.55
8 4.64 6.66 7.22 5.17 9.17 5.11 5.26 6.92 7.53 5.40 9.17 5.55
9 4.64 6.68 7.22 5.19 9.20 5.11 5.26 6.91 7.53 5.41 9.20 5.55
10 4.64 6.69 7.22 5.20 9.23 5.11 5.26 6.90 7.52 5.41 9.23 5.55
Long run 4.64 6.70 7.22 5.21 9.26 5.11 5.26 6.89 7.52 5.42 9.26 5.55
29ECB
Work ing Paper Ser ie s No . 299January 2004

DE
NL
IT
FR
ES
EA
0 . 0 0
1 . 0 0
2 . 0 0
3 . 0 0
4 . 0 0
5 . 0 0
6 . 0 0
7 . 0 0
8 . 0 0
1 2 3 4 5 6 7 8 9 1 0
0 . 0 0
1 . 0 0
2 . 0 0
3 . 0 0
4 . 0 0
5 . 0 0
6 . 0 0
7 . 0 0
8 . 0 0
1 2 3 4 5 6 7 8 9 1 0
0 . 0 0
1 . 0 0
2 . 0 0
3 . 0 0
4 . 0 0
5 . 0 0
6 . 0 0
7 . 0 0
8 . 0 0
1 2 3 4 5 6 7 8 9 1 0
0 . 0 0
1 . 0 0
2 . 0 0
3 . 0 0
4 . 0 0
5 . 0 0
6 . 0 0
1 2 3 4 5 6 7 8 9 1 0
0 . 0 0
1 . 0 0
2 . 0 0
3 . 0 0
4 . 0 0
5 . 0 0
6 . 0 0
7 . 0 0
8 . 0 0
9 . 0 0
1 0 . 0 0
1 2 3 4 5 6 7 8 9 1 0
0 . 0 0
1 . 0 0
2 . 0 0
3 . 0 0
4 . 0 0
5 . 0 0
6 . 0 0
7 . 0 0
1 2 3 4 5 6 7 8 9 1 0
30ECBWork ing Paper Ser ie s No . 299January 2004

European Central Bank working paper series
For a complete list of Working Papers published by the ECB, please visit the ECB�s website(http://www.ecb.int).
202 �Aggregate loans to the euro area private sector� by A. Calza, M. Manrique and J. Sousa,January 2003.
203 �Myopic loss aversion, disappointment aversion and the equity premium puzzle� byD. Fielding and L. Stracca, January 2003.
204 �Asymmetric dynamics in the correlations of global equity and bond returns� byL. Cappiello, R.F. Engle and K. Sheppard, January 2003.
205 �Real exchange rate in an inter-temporal n-country-model with incomplete markets� byB. Mercereau, January 2003.
206 �Empirical estimates of reaction functions for the euro area� by D. Gerdesmeier andB. Roffia, January 2003.
207 �A comprehensive model on the euro overnight rate� by F. R. Würtz, January 2003.
208 �Do demographic changes affect risk premiums? Evidence from international data� byA. Ang and A. Maddaloni, January 2003.
209 �A framework for collateral risk control determination� by D. Cossin, Z. Huang,D. Aunon-Nerin and F. González, January 2003.
210 �Anticipated Ramsey reforms and the uniform taxation principle: the role of internationalfinancial markets� by S. Schmitt-Grohé and M. Uribe, January 2003.
211 �Self-control and savings� by P. Michel and J.P. Vidal, January 2003.
212 �Modelling the implied probability of stock market movements� by E. Glatzer andM. Scheicher, January 2003.
213 �Aggregation and euro area Phillips curves� by S. Fabiani and J. Morgan, February 2003.
214 �On the selection of forecasting models� by A. Inoue and L. Kilian, February 2003.
215 �Budget institutions and fiscal performance in Central and Eastern European countries� byH. Gleich, February 2003.
216 �The admission of accession countries to an enlarged monetary union: a tentativeassessment� by M. Ca�Zorzi and R. A. De Santis, February 2003.
217 �The role of product market regulations in the process of structural change� by J. Messina,March 2003.
31ECB
Work ing Paper Ser ie s No . 299January 2004

218 �The zero-interest-rate bound and the role of the exchange rate for monetary policy inJapan� by G. Coenen and V. Wieland, March 2003.
219 �Extra-euro area manufacturing import prices and exchange rate pass-through� byB. Anderton, March 2003.
220 �The allocation of competencies in an international union: a positive analysis� by M. Ruta,April 2003.
221 �Estimating risk premia in money market rates� by A. Durré, S. Evjen and R. Pilegaard,April 2003.
222 �Inflation dynamics and subjective expectations in the United States� by K. Adam andM. Padula, April 2003.
223 �Optimal monetary policy with imperfect common knowledge� by K. Adam, April 2003.
224 �The rise of the yen vis-à-vis the (�synthetic�) euro: is it supported by economicfundamentals?� by C. Osbat, R. Rüffer and B. Schnatz, April 2003.
225 �Productivity and the (�synthetic�) euro-dollar exchange rate� by C. Osbat, F. Vijselaar andB. Schnatz, April 2003.
226 �The central banker as a risk manager: quantifying and forecasting inflation risks� byL. Kilian and S. Manganelli, April 2003.
227 �Monetary policy in a low pass-through environment� by T. Monacelli, April 2003.
228 �Monetary policy shocks � a nonfundamental look at the data� by M. Klaeffing, May 2003.
229 �How does the ECB target inflation?� by P. Surico, May 2003.
230 �The euro area financial system: structure, integration and policy initiatives� byP. Hartmann, A. Maddaloni and S. Manganelli, May 2003.
231 �Price stability and monetary policy effectiveness when nominal interest rates are boundedat zero� by G. Coenen, A. Orphanides and V. Wieland, May 2003.
232 �Describing the Fed�s conduct with Taylor rules: is interest rate smoothing important?� byE. Castelnuovo, May 2003.
233 �The natural real rate of interest in the euro area� by N. Giammarioli and N. Valla,May 2003.
234 �Unemployment, hysteresis and transition� by M. León-Ledesma and P. McAdam,May 2003.
235 �Volatility of interest rates in the euro area: evidence from high frequency data� byN. Cassola and C. Morana, June 2003.
32ECBWork ing Paper Ser ie s No . 299January 2004

236 �Swiss monetary targeting 1974-1996: the role of internal policy analysis� by G. Rich, June 2003.
237 �Growth expectations, capital flows and international risk sharing� by O. Castrén, M. Millerand R. Stiegert, June 2003.
238 �The impact of monetary union on trade prices� by R. Anderton, R. E. Baldwin andD. Taglioni, June 2003.
239 �Temporary shocks and unavoidable transitions to a high-unemployment regime� byW. J. Denhaan, June 2003.
240 �Monetary policy transmission in the euro area: any changes after EMU?� by I. Angeloni andM. Ehrmann, July 2003.
241 Maintaining price stability under free-floating: a fearless way out of the corner?� byC. Detken and V. Gaspar, July 2003.
242 �Public sector efficiency: an international comparison� by A. Afonso, L. Schuknecht andV. Tanzi, July 2003.
243 �Pass-through of external shocks to euro area inflation� by E. Hahn, July 2003.
244 �How does the ECB allot liquidity in its weekly main refinancing operations? A look at theempirical evidence� by S. Ejerskov, C. Martin Moss and L. Stracca, July 2003.
245 �Money and payments: a modern perspective� by C. Holthausen and C. Monnet, July 2003.
246 �Public finances and long-term growth in Europe � evidence from a panel data analysis� byD. R. de Ávila Torrijos and R. Strauch, July 2003.
247 �Forecasting euro area inflation: does aggregating forecasts by HICP component improveforecast accuracy?� by K. Hubrich, August 2003.
248 �Exchange rates and fundamentals� by C. Engel and K. D. West, August 2003.
249 �Trade advantages and specialisation dynamics in acceding countries� by A. Zaghini,August 2003.
250 �Persistence, the transmission mechanism and robust monetary policy� by I. Angeloni,G. Coenen and F. Smets, August 2003.
251 �Consumption, habit persistence, imperfect information and the lifetime budget constraint�by A. Willman, August 2003.
252 �Interpolation and backdating with a large information set� by E. Angelini, J. Henry andM. Marcellino, August 2003.
253 �Bond market inflation expectations and longer-term trends in broad monetary growth andinflation in industrial countries, 1880-2001� by W. G. Dewald, September 2003.
33ECB
Work ing Paper Ser ie s No . 299January 2004

254 �Forecasting real GDP: what role for narrow money?� by C. Brand, H.-E. Reimers andF. Seitz, September 2003.
255 �Is the demand for euro area M3 stable?� by A. Bruggeman, P. Donati and A. Warne,September 2003.
256 �Information acquisition and decision making in committees: a survey� by K. Gerling,H. P. Grüner, A. Kiel and E. Schulte, September 2003.
257 �Macroeconomic modelling of monetary policy� by M. Klaeffling, September 2003.
258 �Interest rate reaction functions and the Taylor rule in the euro area� by P. Gerlach-Kristen, September 2003.
259 �Implicit tax co-ordination under repeated policy interactions� by M. Catenaro andJ.-P. Vidal, September 2003.
260 �Aggregation-theoretic monetary aggregation over the euro area, when countries areheterogeneous� by W. A. Barnett, September 2003.
261 �Why has broad money demand been more stable in the euro area than in othereconomies? A literature review� by A. Calza and J. Sousa, September 2003.
262 �Indeterminacy of rational expectations equilibria in sequential financial markets� byP. Donati, September 2003.
263 �Measuring contagion with a Bayesian, time-varying coefficient model� by M. Ciccarelli andA. Rebucci, September 2003.
264 �A monthly monetary model with banking intermediation for the euro area� byA. Bruggeman and M. Donnay, September 2003.
265 �New Keynesian Phillips Curves: a reassessment using euro area data� by P. McAdam andA. Willman, September 2003.
266 �Finance and growth in the EU: new evidence from the liberalisation and harmonisation ofthe banking industry� by D. Romero de Ávila, September 2003.
267 �Comparing economic dynamics in the EU and CEE accession countries� by R. Süppel,September 2003.
268 �The output composition puzzle: a difference in the monetary transmission mechanism inthe euro area and the US� by I. Angeloni, A. K. Kashyap, B. Mojon and D. Terlizzese,September 2003.
269 �Zero lower bound: is it a problem with the euro area?" by G. Coenen, September 2003.
270 �Downward nominal wage rigidity and the long-run Phillips curve: simulation-basedevidence for the euro area� by G. Coenen, September 2003.
271 �Indeterminacy and search theory� by N. Giammarioli, September 2003.
34ECBWork ing Paper Ser ie s No . 299January 2004

272 �Inflation targets and the liquidity trap� by M. Klaeffling and V. López Pérez,September 2003.
273 �Definition of price stability, range and point inflation targets: the anchoring of long-terminflation expectations� by E. Castelnuovo, S. Nicoletti-Altimari and D. Rodriguez-Palenzuela, September 2003.
274 �Interpreting implied risk neutral densities: the role of risk premia� by P. Hördahl andD. Vestin, September 2003.
275 �Identifying the monetary transmission mechanism using structural breaks� by A. Beyer andR. Farmer, September 2003.
276 �Short-term estimates of euro area real GDP by means of monthly data� by G. Rünstler,September 2003.
277 �On the indeterminacy of determinacy and indeterminacy" by A. Beyer and R. Farmer,September 2003.
278 �Relevant economic issues concerning the optimal rate of inflation� by D. R. Palenzuela,G. Camba-Méndez and J. Á. García, September 2003.
279 �Designing targeting rules for international monetary policy cooperation� by G. Benignoand P. Benigno, October 2003.
280 �Inflation, factor substitution and growth� by R. Klump, October 2003.
281 �Identifying fiscal shocks and policy regimes in OECD countries� by G. de Arcangelis and S. Lamartina, October 2003.
.
282 �Optimal dynamic risk sharing when enforcement is a decision variable� by T. V. Koeppl,
October 2003.
283 �US, Japan and the euro area: comparing business-cycle features� by P. McAdam,
November 2003.
284 �The credibility of the monetary policy ‘free lunch’� by J. Yetman, November 2003.
285 �Government deficits, wealth effects and the price level in an optimizing model�
by B. Annicchiarico, November 2003.
286 �Country and sector-specific spillover effects in the euro area, the United States and Japan�
by B. Kaltenhaeuser, November 2003.
287 �Consumer inflation expectations in Poland� by T. Łyziak, November 2003.
288 �Implementing optimal control cointegrated I(1) structural VAR models� by F. V. Monti,
November 2003.
289 �Monetary and fiscal interactions in open economies� by G. Lombardo and A. Sutherland,
November 2003.
35ECB
Work ing Paper Ser ie s No . 299January 2004

291 �Measuring the time-inconsitency of US monetary policy� by P. Surico, November 2003.
290 �Inflation persistence and robust monetary policy design� by G. Coenen, November 2003.
292 �Bank mergers, competition and liquidity� by E. Carletti, P. Hartmann and G. Spagnolo, November 2003.
293 �Committees and special interests” by M. Felgenhauer and H. P. Grüner, November 2003.
294 �Does the yield spread predict recessions in the euro area?” by F. Moneta, December 2003.
295 �Optimal allotment policy in the eurosystem’s main refinancing operations?” by C. Ewerhart, N. Cassola, S. Ejerskov and N. Valla, December 2003.
296 �Monetary policy analysis in a small open economy using bayesian cointegrated structural VARs?” by M. Villani and A. Warne, December 2003.
297 �Measurement of contagion in banks’ equity prices� by R. Gropp and G. Moerman, December 2003.
298 �The lender of last resort: a 21st century approach” by X. Freixas, B. M. Parigi and J.-C. Rochet, December 2003.
299 �Import prices and pricing-to-market effects in the euro area� by T. Warmedinger, January 2004.
36ECBWork ing Paper Ser ie s No . 299January 2004