WORKING PAPER - Prosperous America
16
WORKING PAPER Coalition for a Prosperous America CPA | prosperousamerica.org |Washington, DC
Transcript of WORKING PAPER - Prosperous America

WORKING PAPER
Modeling the Effect of the Market Access Charge on
Exchange Rates, Interest Rates and the US Economy
By Steven L Byers, PhD. and Jeff Ferry
SEPTEMBER 2020
Coalition for a Prosperous America
CPA | prosperousamerica.org |Washington, DC
Modeling the Effect of the Market Access Charge on Exchange Rates, Interest Rates and the US Economy
By Steven L Byers, PhD. and Jeff Ferry
Introduction The US dollar exchange rate is a critical economic variable affecting US exports and imports, the performance of the US economy, and international capital flows. In a previous working paper, “Quantifying Economic Growth and Job Creation from a competitive Dollar (2019)1, we showed that a 27 percent realignment in the trade weighted US dollar exchange rate over five years would eliminate the US trade deficit, result in an additional $1 trillion in GDP and create 5.2 million new jobs.
In this paper, we examine how much of a charge on incoming capital, using a proposed capital flow management tool called the Market Access Charge (MAC) is needed to move the dollar exchange rate to a current account balancing price. We use a well-known model from the Federal Reserve Board called the FRB/US macroeconomic model to conduct the inquiry.
The MAC, which is proposed in a recent Senate bill, is intended to reduce incoming capital flows into dollar-denominated assets with a transaction fee on their purchase by non-US residents. The aim of the MAC is to realign the dollar to a competitive rate, produce balanced trade over the medium term, and thereby increase employment, wages and growth in the real economy.
We find that a 5 percent MAC would be sufficient to depreciate the US dollar exchange rate by 27 percent, balance the current account and add 4.9 percent to real GDP and 4.6 million jobs over and above our baseline five-year forecast.
We also look at the impact of a MAC on the financial sector, including interest rates and federal government debt service costs. Using the FRB/US macroeconomic model we find the MAC would have a small impact on US interest rates and debt service. Importantly, the MAC would raise more revenue for the US Treasury, between $300 billion and $600 billion, than the added debt service, which is only $42 billion. Our results provide further evidence that a MAC would produce positive effects the US economy, including increases in GDP, average wages, and employment levels.
This paper is organized as follows: Section 1- The Relationship Between International Capital Flows and the Exchange Rate, Section 2-The Market Access Charge and Capital Flows, Section 3 – Incorporating the MAC into the FRB/US Model, Section 4-Effects on the US Economy, Section 5-Conclusion.
1 https://www.prosperousamerica.org/quantifying_economic_growth_job_creation_competitive_dollar
Coalition for a Prosperous America
CPA | prosperousamerica.org |Washington, DC
2
Section 1 – The Relationship Between International Capital Flows and the Exchange Rate The standard open-economy macroeconomic models2 predict that under a floating exchange rate regime, when a country runs a trade deficit/surplus, the exchange rate will adjust to eliminate the imbalance.
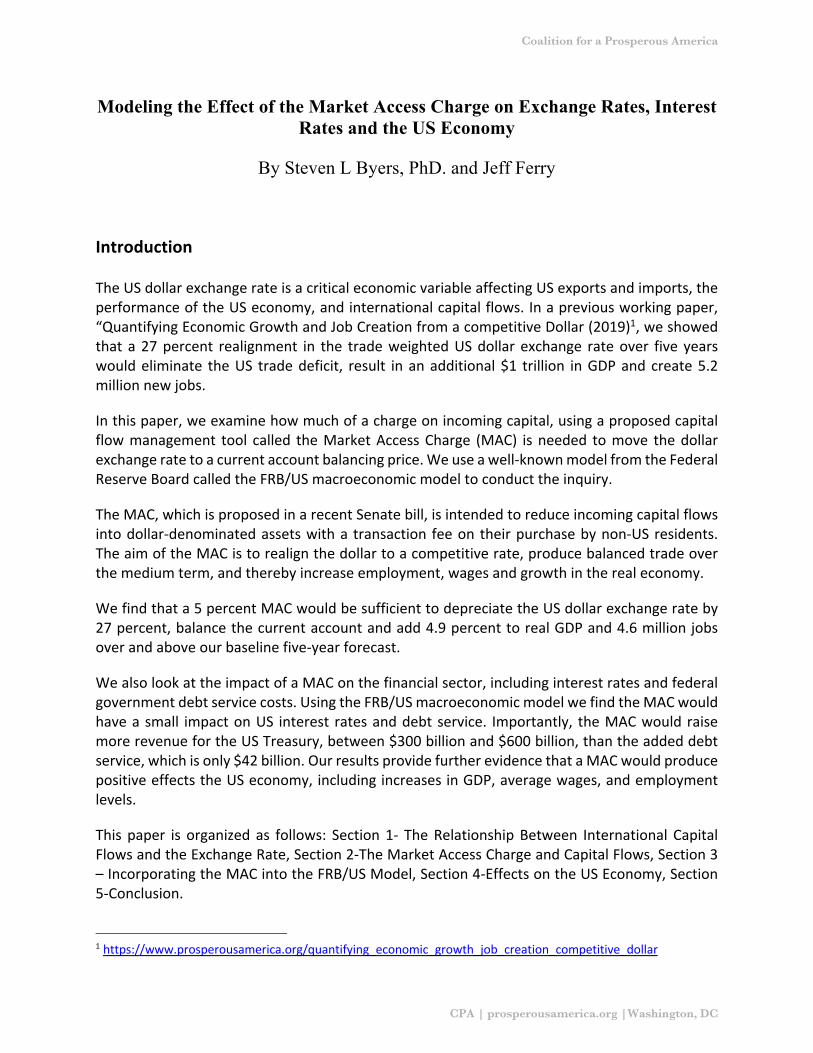
However, exchange rates have not adjusted and imbalances have persisted. The US trade and current account deficits have continued to run at some 2%-3% of US GDP for decades (Figure 1), suggesting that other forces are preventing the deficits from correcting themselves.
A growing body of literature primarily aimed at emerging economies, but applicable to the US, shows that under flexible exchange rates, excessive capital inflows can prevent the exchange rate from adjusting to eliminate imbalances. Capital flows can also introduce exchange rate volatility and potentially destabilizing forces into a national economy3. Large, persistent, capital inflows can cause a persistent overvaluation of a currency which results in a loss of competitiveness. What follows is deindustrialization.
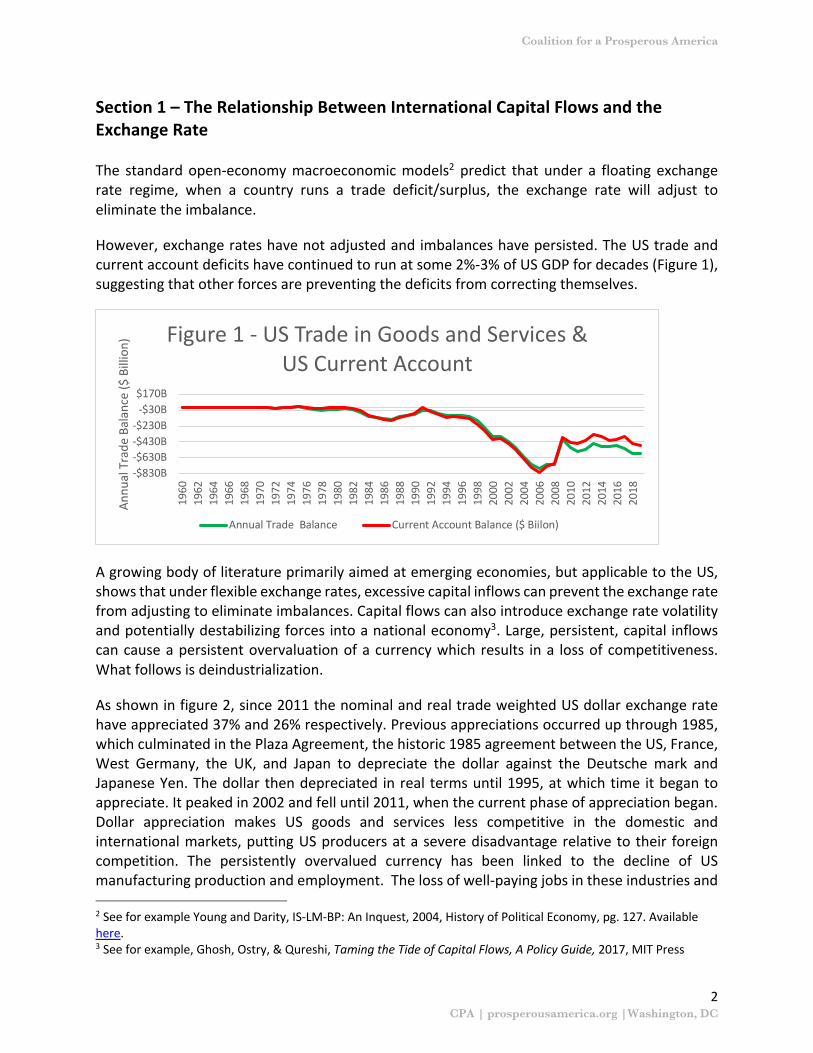
As shown in figure 2, since 2011 the nominal and real trade weighted US dollar exchange rate have appreciated 37% and 26% respectively. Previous appreciations occurred up through 1985, which culminated in the Plaza Agreement, the historic 1985 agreement between the US, France, West Germany, the UK, and Japan to depreciate the dollar against the Deutsche mark and Japanese Yen. The dollar then depreciated in real terms until 1995, at which time it began to appreciate. It peaked in 2002 and fell until 2011, when the current phase of appreciation began. Dollar appreciation makes US goods and services less competitive in the domestic and international markets, putting US producers at a severe disadvantage relative to their foreign competition. The persistently overvalued currency has been linked to the decline of US manufacturing production and employment. The loss of well-paying jobs in these industries and
2 See for example Young and Darity, IS-LM-BP: An Inquest, 2004, History of Political Economy, pg. 127. Available here. 3 See for example, Ghosh, Ostry, & Qureshi, Taming the Tide of Capital Flows, A Policy Guide, 2017, MIT Press
-$830B-$630B-$430B-$230B
-$30B$170B
1960
1962
1964
1966
1968
1970
1972
1974
1976
1978
1980
1982
1984
1986
1988
1990
1992
1994
1996
1998
2000
2002
2004
2006
2008
2010
2012
2014
2016
2018
Annu
al T
rade
Bal
ance
($ B
illio
n) Figure 1 - US Trade in Goods and Services & US Current Account
Annual Trade Balance Current Account Balance ($ Biilon)
Coalition for a Prosperous America
CPA | prosperousamerica.org |Washington, DC
3
the failure of displaced workers to find comparable paying jobs in other sectors has increased income inequality and resulted in a variety of debilitating social ills.
As we will show, the dollar’s rise is driven, in substantial part, by inflows into dollar-denominated assets. Most notable among international capital flows are foreign exchange trading and trading in US securities. According to Bank of International Settlements data for 20194, foreign exchange trading has risen steadily to average $6.6 trillion a day. The US dollar is estimated to be on one side of such trades 88% of the time.
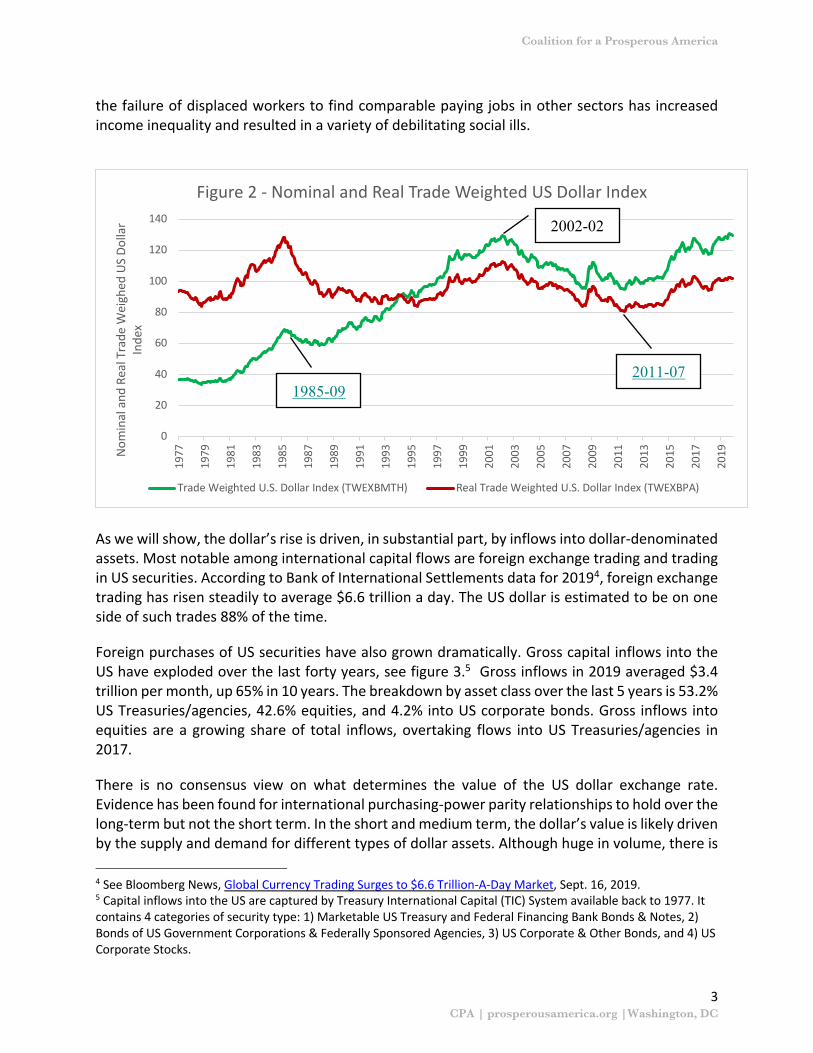
Foreign purchases of US securities have also grown dramatically. Gross capital inflows into the US have exploded over the last forty years, see figure 3.5 Gross inflows in 2019 averaged $3.4 trillion per month, up 65% in 10 years. The breakdown by asset class over the last 5 years is 53.2% US Treasuries/agencies, 42.6% equities, and 4.2% into US corporate bonds. Gross inflows into equities are a growing share of total inflows, overtaking flows into US Treasuries/agencies in 2017.
There is no consensus view on what determines the value of the US dollar exchange rate. Evidence has been found for international purchasing-power parity relationships to hold over the long-term but not the short term. In the short and medium term, the dollar’s value is likely driven by the supply and demand for different types of dollar assets. Although huge in volume, there is
4 See Bloomberg News, Global Currency Trading Surges to $6.6 Trillion-A-Day Market, Sept. 16, 2019. 5 Capital inflows into the US are captured by Treasury International Capital (TIC) System available back to 1977. It contains 4 categories of security type: 1) Marketable US Treasury and Federal Financing Bank Bonds & Notes, 2) Bonds of US Government Corporations & Federally Sponsored Agencies, 3) US Corporate & Other Bonds, and 4) US Corporate Stocks.
0
20
40
60
80
100
120
140
1977
1979
1981
1983
1985
1987
1989
1991
1993
1995
1997
1999
2001
2003
2005
2007
2009
2011
2013
2015
2017
2019N
omin
al a
nd R
eal T
rade
Wei
ghed
US
Dolla
r In
dex
Figure 2 - Nominal and Real Trade Weighted US Dollar Index
Trade Weighted U.S. Dollar Index (TWEXBMTH) Real Trade Weighted U.S. Dollar Index (TWEXBPA)
2011-071985-09
2002-02
Coalition for a Prosperous America
CPA | prosperousamerica.org |Washington, DC
4
no data on prices or volumes in the cash foreign exchange market, which is dominated by a small number of banks in major financial centers, all of whom guard their proprietary data closely.
In this paper, we focused on trading in US securities, including US government, agency and corporate bonds and corporate equities. This data is reported monthly to the US Treasury and published on the Treasury website.
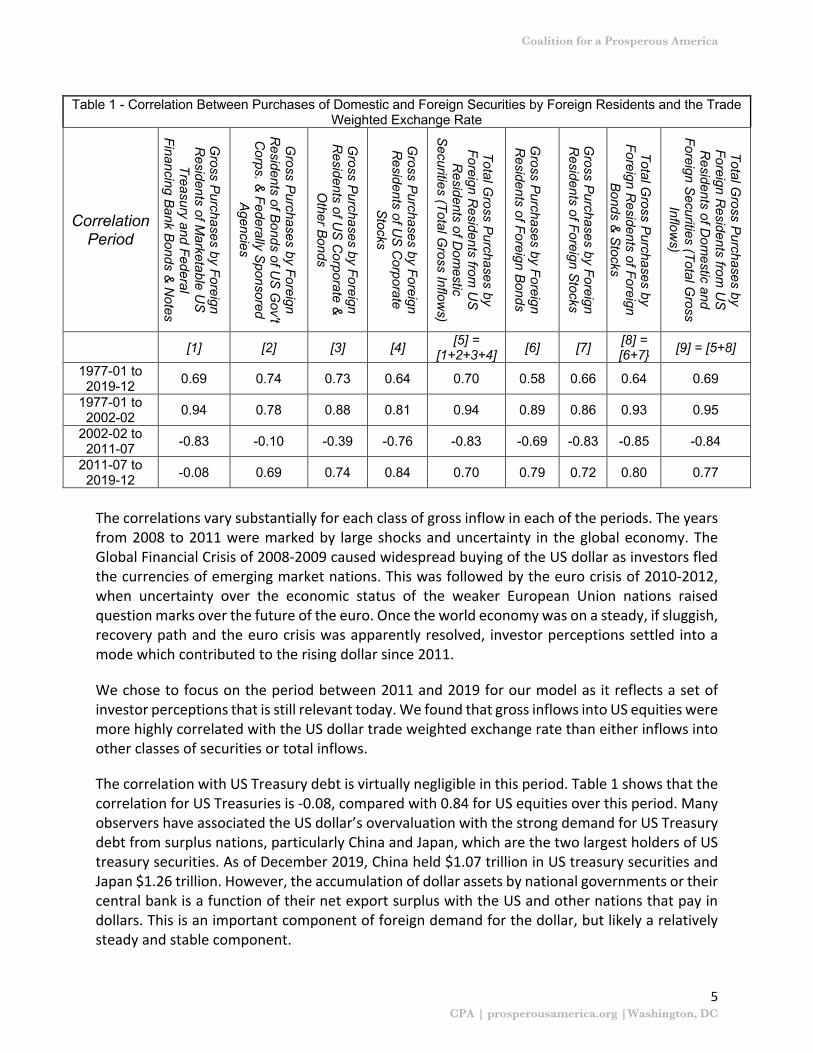
We calculated the correlation between foreign purchases of each class of security separately and in total in relation to the trade weighted exchange rate. Table 1 shows these correlations for 4 different periods: 1) 1977-01 to 2019-12, 2) 1977-01 to 2002-02’; 3) 2002-02 to 2011-07, and 4) 2011-07 to 2019-12. We chose these sub-periods as they correspond to major inflection points in the trade weighted exchange rate as shown in figure 2. The year 2002 marked a high for the US dollar. After 2002 the dollar fell for nine years, until it bottomed in 2011 and rose from then until today. Within each period of long-term rise or decline, there were also episodes of short-term volatility, often reflecting periods of heightened uncertainty in the global economy.
$0B$1,000B$2,000B$3,000B$4,000B$5,000B$6,000B$7,000B
1977
1979
1981
1983
1985
1987
1989
1991
1993
1995
1997
1999
2001
2003
2005
2007
2009
2011
2013
2015
2017
2019
Figure 3 - Monthly Gross Capital Inflows by Security Type
Marketable US Treasury and Federal Financing Bank Bonds & Notes
Bonds of US Gov't Corps & Federally Sponsored Agencies
US Corporate & Other Bonds
US Corporate Stocks
Total Flows
Euro Crisis
Global Financial Crisis
Covid-19
Coalition for a Prosperous America
CPA | prosperousamerica.org |Washington, DC
5
Table 1 - Correlation Between Purchases of Domestic and Foreign Securities by Foreign Residents and the Trade Weighted Exchange Rate
Correlation Period
Gross P
urchases by Foreign R
esidents of Marketable U
S
Treasury and Federal Financing B
ank Bonds &
Notes
Gross P
urchases by Foreign R
esidents of Bonds of U
S G
ov't C
orps. & Federally S
ponsored A
gencies
Gross P
urchases by Foreign R
esidents of US
Corporate &
O
ther Bonds
Gross P
urchases by Foreign R
esidents of US
Corporate
Stocks
Total Gross P
urchases by Foreign R
esidents from U
S
Residents of D
omestic
Securities (Total G
ross Inflows)
Gross P
urchases by Foreign R
esidents of Foreign Bonds
Gross P
urchases by Foreign R
esidents of Foreign Stocks
Total Gross P
urchases by Foreign R
esidents of Foreign B
onds & S
tocks
Total Gross P
urchases by Foreign R
esidents from U
S
Residents of D
omestic and
Foreign Securities (Total G
ross Inflow
s)
[1] [2] [3] [4] [5] = [1+2+3+4] [6] [7] [8] =
[6+7} [9] = [5+8]
1977-01 to 2019-12 0.69 0.74 0.73 0.64 0.70 0.58 0.66 0.64 0.69
1977-01 to 2002-02 0.94 0.78 0.88 0.81 0.94 0.89 0.86 0.93 0.95
2002-02 to 2011-07 -0.83 -0.10 -0.39 -0.76 -0.83 -0.69 -0.83 -0.85 -0.84
2011-07 to 2019-12 -0.08 0.69 0.74 0.84 0.70 0.79 0.72 0.80 0.77
The correlations vary substantially for each class of gross inflow in each of the periods. The years from 2008 to 2011 were marked by large shocks and uncertainty in the global economy. The Global Financial Crisis of 2008-2009 caused widespread buying of the US dollar as investors fled the currencies of emerging market nations. This was followed by the euro crisis of 2010-2012, when uncertainty over the economic status of the weaker European Union nations raised question marks over the future of the euro. Once the world economy was on a steady, if sluggish, recovery path and the euro crisis was apparently resolved, investor perceptions settled into a mode which contributed to the rising dollar since 2011.
We chose to focus on the period between 2011 and 2019 for our model as it reflects a set of investor perceptions that is still relevant today. We found that gross inflows into US equities were more highly correlated with the US dollar trade weighted exchange rate than either inflows into other classes of securities or total inflows.
The correlation with US Treasury debt is virtually negligible in this period. Table 1 shows that the correlation for US Treasuries is -0.08, compared with 0.84 for US equities over this period. Many observers have associated the US dollar’s overvaluation with the strong demand for US Treasury debt from surplus nations, particularly China and Japan, which are the two largest holders of US treasury securities. As of December 2019, China held $1.07 trillion in US treasury securities and Japan $1.26 trillion. However, the accumulation of dollar assets by national governments or their central bank is a function of their net export surplus with the US and other nations that pay in dollars. This is an important component of foreign demand for the dollar, but likely a relatively steady and stable component.
Coalition for a Prosperous America
CPA | prosperousamerica.org |Washington, DC
6
The purchases and sales of equity investments by non-US persons are more closely correlated with movements in the dollar exchange rate. It may be that foreigners’ demand for US equities is directly driving the dollar exchange rate. It may also be that demand for US equities and movements in the exchange rate both reflect other underlying economic forces, such as investors’ expectations of relative economic growth rates of major nations. In such a scenario, expectations that US economic growth will outpace other nations could be a factor in the dollar’s rise since 2011. Investing in the US equity market would then be a logical way to profit from US growth. This trend may be intensified by the low yield available on most fixed-income assets in major nations, making equities more attractive.
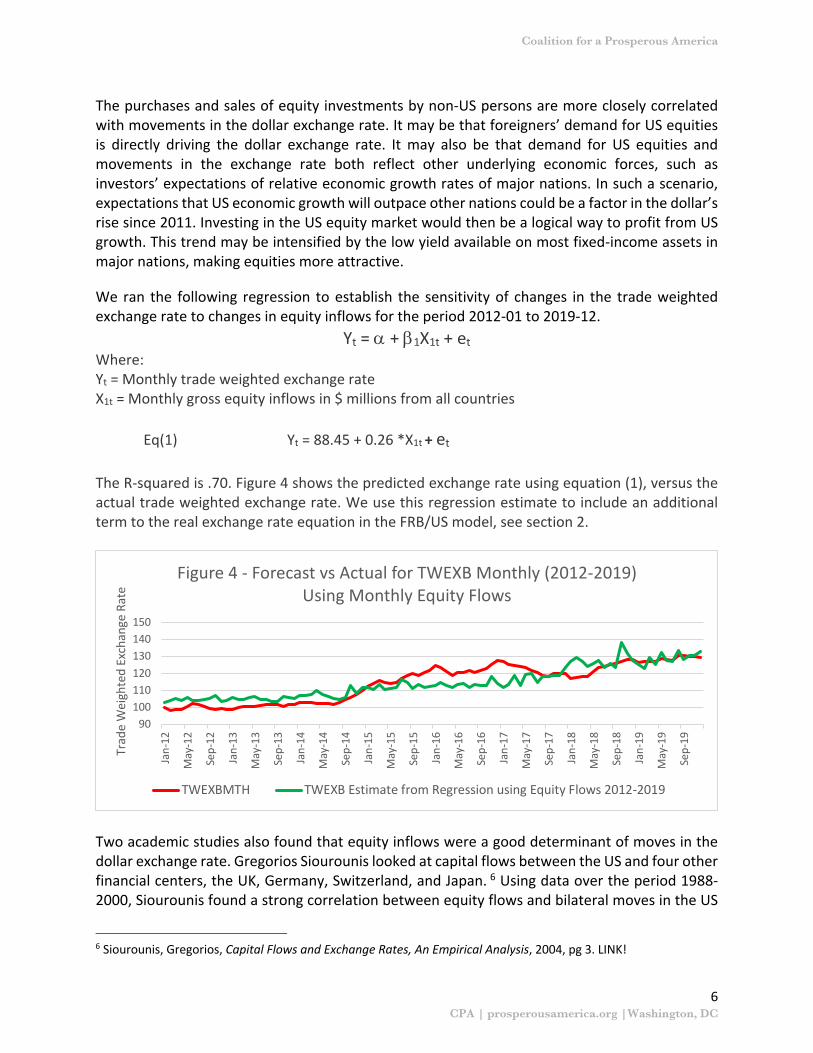
We ran the following regression to establish the sensitivity of changes in the trade weighted exchange rate to changes in equity inflows for the period 2012-01 to 2019-12.
Yt = a + b1X1t + et Where: Yt = Monthly trade weighted exchange rate X1t = Monthly gross equity inflows in $ millions from all countries
Eq(1) Yt = 88.45 + 0.26 *X1t + et
The R-squared is .70. Figure 4 shows the predicted exchange rate using equation (1), versus the actual trade weighted exchange rate. We use this regression estimate to include an additional term to the real exchange rate equation in the FRB/US model, see section 2.
Two academic studies also found that equity inflows were a good determinant of moves in the dollar exchange rate. Gregorios Siourounis looked at capital flows between the US and four other financial centers, the UK, Germany, Switzerland, and Japan. 6 Using data over the period 1988-2000, Siourounis found a strong correlation between equity flows and bilateral moves in the US
6 Siourounis, Gregorios, Capital Flows and Exchange Rates, An Empirical Analysis, 2004, pg 3. LINK!
90100110120130140150
Jan-
12
May
-12
Sep-
12
Jan-
13
May
-13
Sep-
13
Jan-
14
May
-14
Sep-
14
Jan-
15
May
-15
Sep-
15
Jan-
16
May
-16
Sep-
16
Jan-
17
May
-17
Sep-
17
Jan-
18
May
-18
Sep-
18
Jan-
19
May
-19
Sep-
19
Trad
e W
eigh
ted
Exch
ange
Rat
e
Figure 4 - Forecast vs Actual for TWEXB Monthly (2012-2019) Using Monthly Equity Flows
TWEXBMTH TWEXB Estimate from Regression using Equity Flows 2012-2019
Coalition for a Prosperous America
CPA | prosperousamerica.org |Washington, DC
7
dollar. His finding on the bond market was similar to ours, despite the fact that we looked at a much later period. Referring to the dollar’s bilateral exchange rate with major trading partners, Siourounis wrote: “Net US equity purchases have a stable and consistent impact on the British, German and Swiss currencies…Net purchases of US or foreign bonds, however, are irrelevant for exchange rate movements.” Siourounis found that for Japan, results were different, with bond flows showing a stronger association with the dollar-yen exchange rate. Siourounis also cites several previous studies documenting a correlation between equity flows and the dollar rate.
A study published earlier this year by Nelson Camanho, Harald Hau and Helene Rey, Global Portfolio Rebalancing and Exchange Rates,7 found similar results. These economists offered the following specific relationships based on their estimates: “by the end of 2014 only about US$3.9bn in net US outflows are needed to trigger a 1% depreciation of the effective US dollar exchange rate. For the Euro, the British Pound and the Canadian Dollar, the corresponding net outflows triggering a 1% depreciation are lower at €1.7bn, £0.8bn, and C$0.5bn.”8
Section 2 – The MAC, Capital Flows and the Dollar Exchange Rate Having established a relationship between equity inflows and the dollar exchange rate, we then examined how a charge on capital inflows is likely to impact inflows and the exchange rate. We focus upon a capital flow management tool called the Market Access Charge (MAC).
The MAC was described in a Coalition for a Prosperous America Working Paper titled, “The Threat of U.S. Dollar Overvaluation: How to Calculate True Exchange Rate Misalignment & How to Fix It.” The MAC was also proposed in a Senate bill introduced in July 2019, S.2357, titled the “Competitive Dollar for Jobs and Prosperity Act.” It was introduced by Sen. Tammy Baldwin (D-WI) and Josh Hawley (R-MO).9
The MAC would be a one-time fee paid on the purchase of any U.S. dollar financial asset by a foreign entity or individual. The MAC is designed to moderate foreign demand for dollar assets and realign the US dollar exchange rate to a trade-balancing level. The Baldwin-Hawley bill specifies that the Federal Reserve Board would set and manage the MAC to achieve current account balance within a five-year time horizon. Once balance was achieved, the Fed would manage the MAC to keep the US economy close to current account balance over time.
A capital flow and exchange rate management policy would be a departure from current US policy. The US Treasury has traditionally favored free and open capital movements. On the other hand, the IMF changed its official view in 2012 to support capital flow management tools in
7 8 Ibid, pg. 25. 9 https://www.congress.gov/bill/116th-congress/senate-bill/2357/text
Coalition for a Prosperous America
CPA | prosperousamerica.org |Washington, DC
8
certain circumstances, especially to “support macroeconomic adjustment and safeguard financial stability.”10
The United States has, in the past, deployed capital controls when it deemed them necessary. In the 1960’s the US Congress passed the Interest Equalization tax (IET) to control capital outflows and prevent depletion of the nation’s gold reserves. Over the decade beginning in 1960, the US current account and capital account experienced drastic swings that had substantial macroeconomic consequences. The IET was levied on US persons’ acquisition of foreign financial assets. The tax could go as high as 15 percent of the purchase value of the asset. The IET was in effect from 1963 until 1974 and by reducing US capital outflows, helped reduce the US balance of payments deficit and maintain the viability of the Bretton Woods system of fixed exchange rates.
In this paper, we model the impact of a MAC on foreign inflows into US equities and the dollar exchange rate. Crucial to modeling the effectiveness of the MAC is understanding the sensitivity of capital inflows to the level of the MAC.
The MAC is a one-time charge on the initial purchase of a dollar denominated asset by persons outside the US. The MAC reduces their return on US domestic assets. For example, a foreign resident can invest in a one-year government bond in their home country to receive that bond’s annual interest payment. Alternatively, they can invest in a US Treasury bond or corporate equity and receive the US asset’s interest or dividend yield.
The yield spread between a foreign financial center asset and a US asset is typically small, i.e. between -5 and +5 percentage points. (We focus upon the financial assets of advanced nations, which are the major alternatives to dollar investments for most investors.) A one percent MAC imposed upon a foreign resident buying a US Treasury bond should reduce the spread between the US asset and the foreign asset significantly, reducing the demand for the US asset. Reduced demand for US dollar-denominated assets should result in lower demand for US dollars and put downward pressure on the dollar exchange rate.
The impact of the MAC in reducing demand for dollar-based assets is unlikely to be the same for assets held over varying time periods. Foreign investors holding US assets for longer periods would be impacted less by the MAC because the one-time MAC fee would be amortized over a longer period. The MAC is therefore likely to have a more pronounced impact on short term capital inflows.
Standard portfolio theory tells us that investors invest in equities for two reasons, yield and capital appreciation. The spread between US and non-US asset yields should impact investment flows into the US directly as investors are attracted if US yields are higher than alternatives. The oft cited “carry trade” reflects the view that higher US yields have prompted investment in US financial assets as a way to profit from yield differentials. The spread may also impact capital appreciation. A higher US interest rate may indicate that US authorities are expecting higher
10 IMF, The IMF’s Institutional View on Capital Flows in Practice, 2018 Available here.
Coalition for a Prosperous America
CPA | prosperousamerica.org |Washington, DC
9
economic growth than they would like. That higher growth may be reflected in rising equity prices. Some commentators saw the opposite effect occurring in the markets in the summer of 2020: aggressive action by the Federal Reserve towards looser money suggested concern about a weaker US economy leading to a significant fall in the US dollar exchange rate.
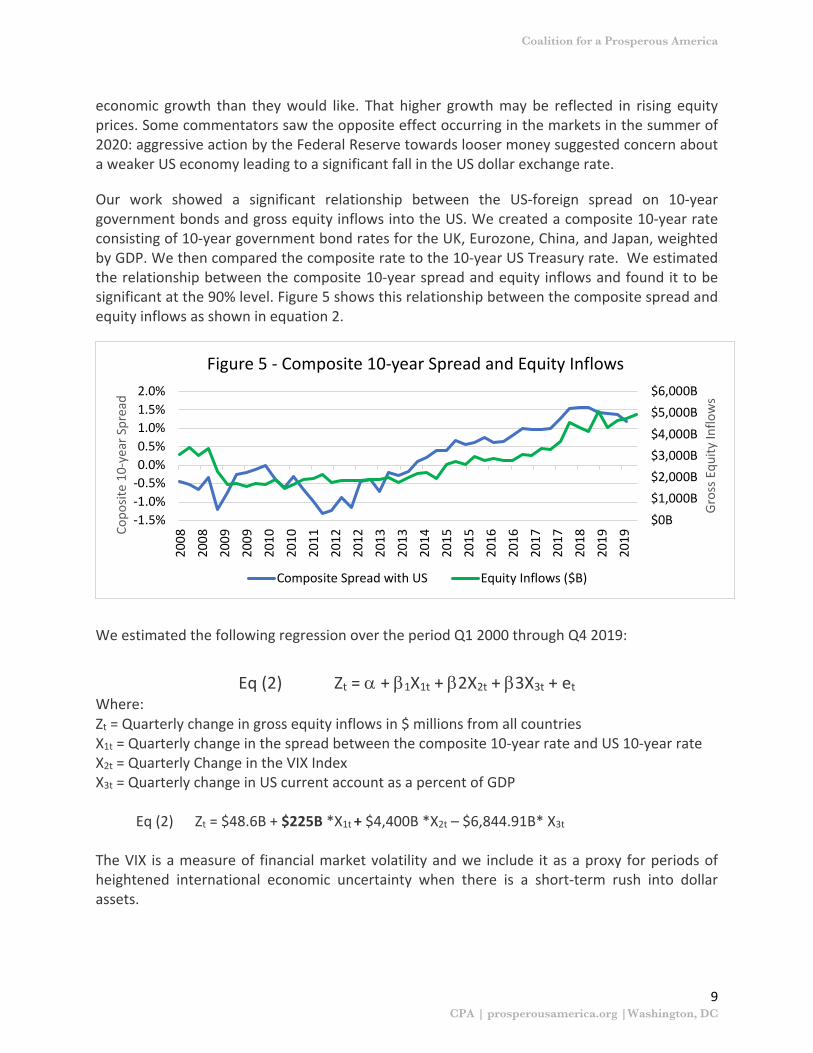
Our work showed a significant relationship between the US-foreign spread on 10-year government bonds and gross equity inflows into the US. We created a composite 10-year rate consisting of 10-year government bond rates for the UK, Eurozone, China, and Japan, weighted by GDP. We then compared the composite rate to the 10-year US Treasury rate. We estimated the relationship between the composite 10-year spread and equity inflows and found it to be significant at the 90% level. Figure 5 shows this relationship between the composite spread and equity inflows as shown in equation 2.
We estimated the following regression over the period Q1 2000 through Q4 2019:
Eq (2) Zt = a + b1X1t + b2X2t + b3X3t + et Where: Zt = Quarterly change in gross equity inflows in $ millions from all countries X1t = Quarterly change in the spread between the composite 10-year rate and US 10-year rate X2t = Quarterly Change in the VIX Index X3t = Quarterly change in US current account as a percent of GDP Eq (2) Zt = $48.6B + $225B *X1t + $4,400B *X2t – $6,844.91B* X3t
The VIX is a measure of financial market volatility and we include it as a proxy for periods of heightened international economic uncertainty when there is a short-term rush into dollar assets.
$0B$1,000B$2,000B$3,000B$4,000B$5,000B$6,000B
-1.5%-1.0%-0.5%0.0%0.5%1.0%1.5%2.0%
2008
2008
2009
2009
2010
2010
2011
2012
2012
2013
2013
2014
2015
2015
2016
2016
2017
2017
2018
2019
2019
Gros
s Equ
ity In
flow
s
Copo
site
10-y
ear S
prea
d
Figure 5 - Composite 10-year Spread and Equity Inflows
Composite Spread with US Equity Inflows ($B)
Coalition for a Prosperous America
CPA | prosperousamerica.org |Washington, DC
10
The regression tells us that every one percent reduction in the spread of US yields over composite foreign yields will reduce equity inflows by $225 billion dollars per quarter. Assuming that foreigners’ average holding period of a US asset is one year, we can say that for every one percent MAC applied, gross equity inflows will decrease $225 billion per quarter. Combining Equation 1 on the relationship between the dollar exchange rate and equity inflows and Equation 2 on the relationship between yield spreads and equity inflows allows us to estimate the impact of the MAC on the US dollar exchange rate. Equation 1 shows that the trade weighted exchange rate index value changes by 0.026 for every billion dollar change in equity inflows. Equation 2 shows that equity inflows rise by $225 billion for every one percent widening in the spread between US and foreign assets. Combining the two results gives us the following:
Eq(3) D in exchange rate = 0.026 * $225B *(MAC) The equations show that for a 1 percent MAC and with the recent trade weighted exchange rate of 114.94, the change in the exchange rate is 0.026 * $225 * 1 = 5.85. Therefore, a 1 percent MAC is likely to cause a dollar exchange rate decline of approximately 5.1% (5.85/114.94 = 5.1%). Section 3 – How the MAC Impacts Interest Rates We then sought to estimate the impact of the MAC on the financial sector with a focus upon interest rates and government debt service costs. The Federal Reserve Board’s standard macroeconomic model, known as FRB/US, includes all the major economic variables in the US financial sector11. The FRB/US model has the real US dollar exchange rate dependent upon interest rate differentials between the US and a composite foreign interest rate, differentials between expected US and foreign consumer price inflation, and the level of outstanding US liabilities to foreigners as a share of US GDP.
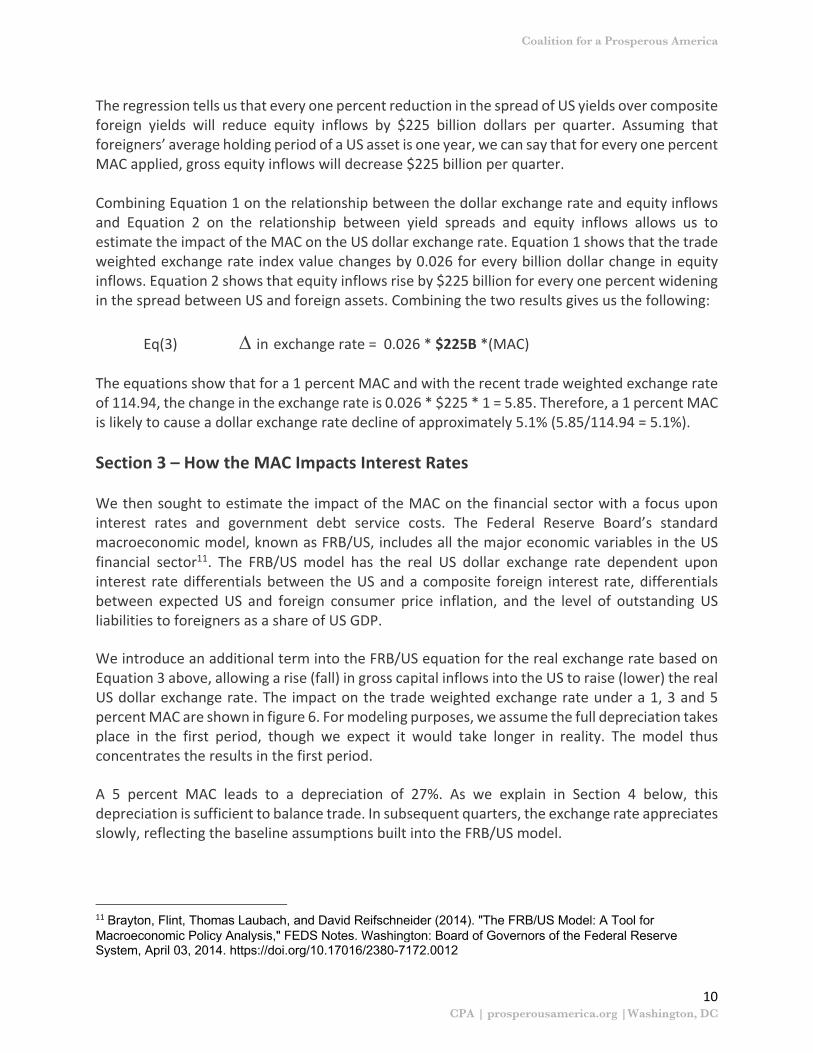
We introduce an additional term into the FRB/US equation for the real exchange rate based on Equation 3 above, allowing a rise (fall) in gross capital inflows into the US to raise (lower) the real US dollar exchange rate. The impact on the trade weighted exchange rate under a 1, 3 and 5 percent MAC are shown in figure 6. For modeling purposes, we assume the full depreciation takes place in the first period, though we expect it would take longer in reality. The model thus concentrates the results in the first period.
A 5 percent MAC leads to a depreciation of 27%. As we explain in Section 4 below, this depreciation is sufficient to balance trade. In subsequent quarters, the exchange rate appreciates slowly, reflecting the baseline assumptions built into the FRB/US model.
11 Brayton, Flint, Thomas Laubach, and David Reifschneider (2014). "The FRB/US Model: A Tool for Macroeconomic Policy Analysis," FEDS Notes. Washington: Board of Governors of the Federal Reserve System, April 03, 2014. https://doi.org/10.17016/2380-7172.0012
Coalition for a Prosperous America
CPA | prosperousamerica.org |Washington, DC
11
Interest Rates
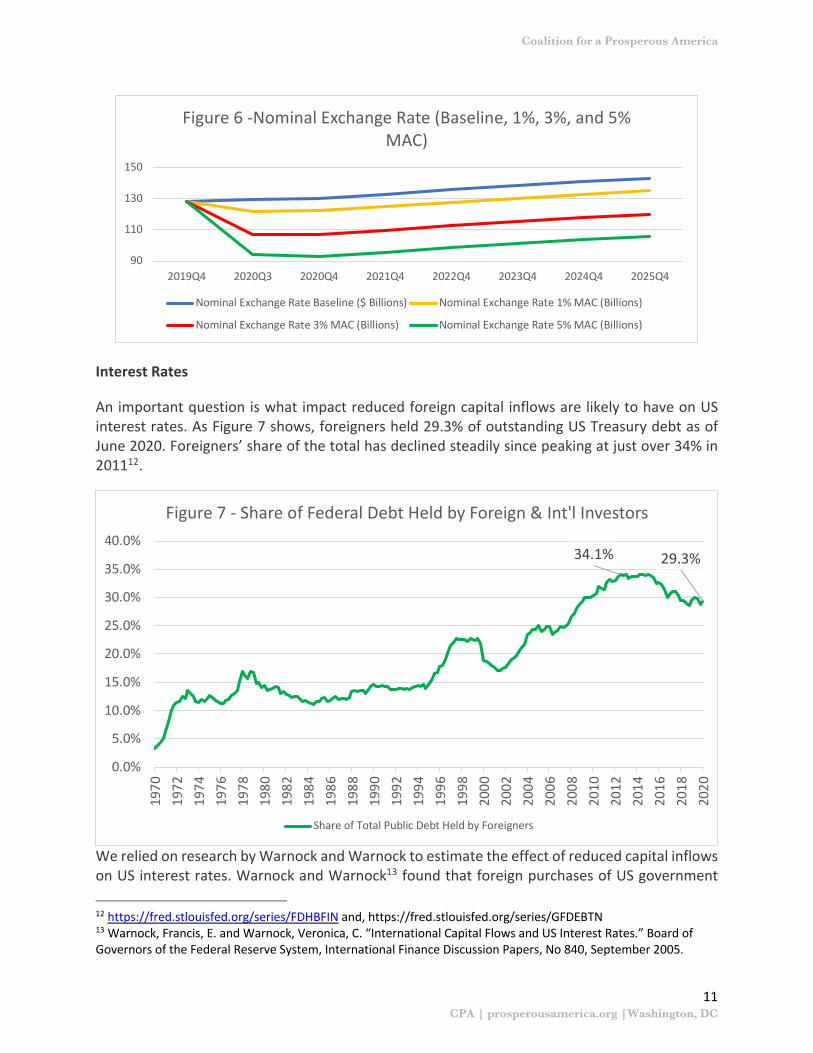
An important question is what impact reduced foreign capital inflows are likely to have on US interest rates. As Figure 7 shows, foreigners held 29.3% of outstanding US Treasury debt as of June 2020. Foreigners’ share of the total has declined steadily since peaking at just over 34% in 201112.
We relied on research by Warnock and Warnock to estimate the effect of reduced capital inflows on US interest rates. Warnock and Warnock13 found that foreign purchases of US government
12 https://fred.stlouisfed.org/series/FDHBFIN and, https://fred.stlouisfed.org/series/GFDEBTN 13 Warnock, Francis, E. and Warnock, Veronica, C. “International Capital Flows and US Interest Rates.” Board of Governors of the Federal Reserve System, International Finance Discussion Papers, No 840, September 2005.
90
110
130
150
2019Q4 2020Q3 2020Q4 2021Q4 2022Q4 2023Q4 2024Q4 2025Q4
Figure 6 -Nominal Exchange Rate (Baseline, 1%, 3%, and 5% MAC)
Nominal Exchange Rate Baseline ($ Billions) Nominal Exchange Rate 1% MAC (Billions)
Nominal Exchange Rate 3% MAC (Billions) Nominal Exchange Rate 5% MAC (Billions)
34.1% 29.3%
0.0%
5.0%
10.0%
15.0%
20.0%
25.0%
30.0%
35.0%
40.0%
1970
1972
1974
1976
1978
1980
1982
1984
1986
1988
1990
1992
1994
1996
1998
2000
2002
2004
2006
2008
2010
2012
2014
2016
2018
2020
Figure 7 - Share of Federal Debt Held by Foreign & Int'l Investors
Share of Total Public Debt Held by Foreigners
Coalition for a Prosperous America
CPA | prosperousamerica.org |Washington, DC
12
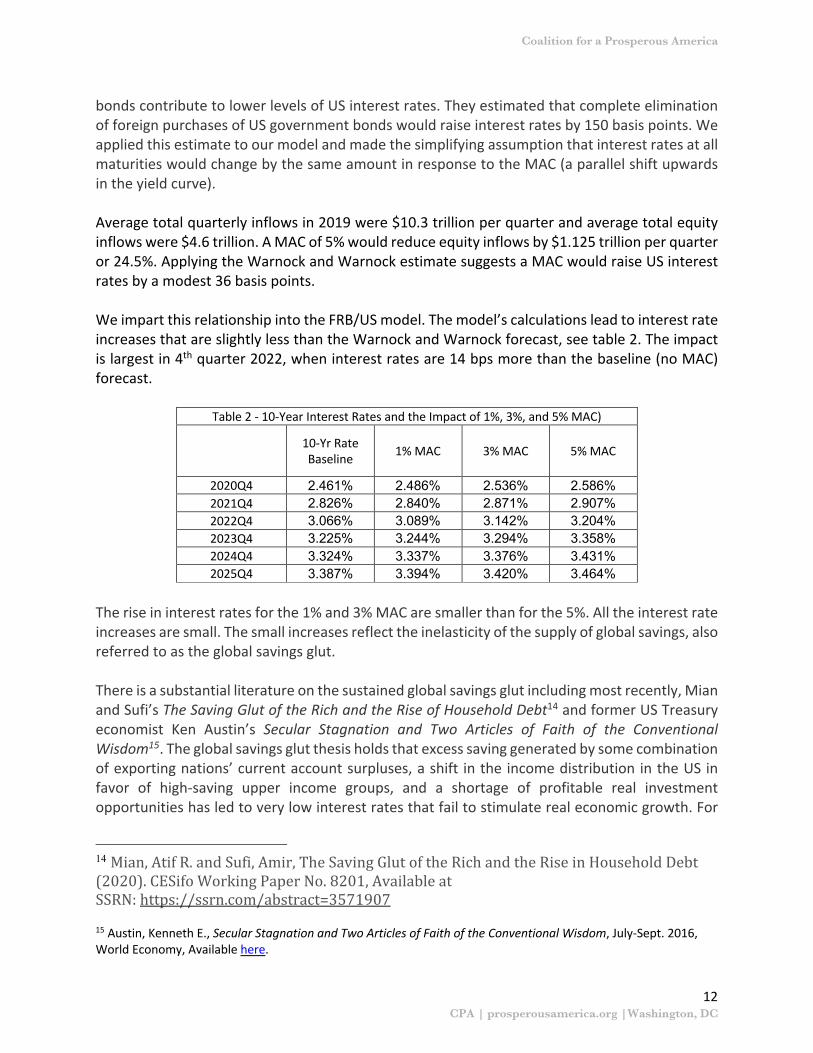
bonds contribute to lower levels of US interest rates. They estimated that complete elimination of foreign purchases of US government bonds would raise interest rates by 150 basis points. We applied this estimate to our model and made the simplifying assumption that interest rates at all maturities would change by the same amount in response to the MAC (a parallel shift upwards in the yield curve). Average total quarterly inflows in 2019 were $10.3 trillion per quarter and average total equity inflows were $4.6 trillion. A MAC of 5% would reduce equity inflows by $1.125 trillion per quarter or 24.5%. Applying the Warnock and Warnock estimate suggests a MAC would raise US interest rates by a modest 36 basis points. We impart this relationship into the FRB/US model. The model’s calculations lead to interest rate increases that are slightly less than the Warnock and Warnock forecast, see table 2. The impact is largest in 4th quarter 2022, when interest rates are 14 bps more than the baseline (no MAC) forecast.
Table 2 - 10-Year Interest Rates and the Impact of 1%, 3%, and 5% MAC)
10-Yr Rate Baseline 1% MAC 3% MAC 5% MAC
2020Q4 2.461% 2.486% 2.536% 2.586% 2021Q4 2.826% 2.840% 2.871% 2.907% 2022Q4 3.066% 3.089% 3.142% 3.204% 2023Q4 3.225% 3.244% 3.294% 3.358% 2024Q4 3.324% 3.337% 3.376% 3.431% 2025Q4 3.387% 3.394% 3.420% 3.464%
The rise in interest rates for the 1% and 3% MAC are smaller than for the 5%. All the interest rate increases are small. The small increases reflect the inelasticity of the supply of global savings, also referred to as the global savings glut. There is a substantial literature on the sustained global savings glut including most recently, Mian and Sufi’s The Saving Glut of the Rich and the Rise of Household Debt14 and former US Treasury economist Ken Austin’s Secular Stagnation and Two Articles of Faith of the Conventional Wisdom15. The global savings glut thesis holds that excess saving generated by some combination of exporting nations’ current account surpluses, a shift in the income distribution in the US in favor of high-saving upper income groups, and a shortage of profitable real investment opportunities has led to very low interest rates that fail to stimulate real economic growth. For
14 Mian,AtifR.andSufi,Amir,TheSavingGlutoftheRichandtheRiseinHouseholdDebt(2020).CESifoWorkingPaperNo.8201,AvailableatSSRN:https://ssrn.com/abstract=3571907 15 Austin, Kenneth E., Secular Stagnation and Two Articles of Faith of the Conventional Wisdom, July-Sept. 2016, World Economy, Available here.
Coalition for a Prosperous America
CPA | prosperousamerica.org |Washington, DC
13
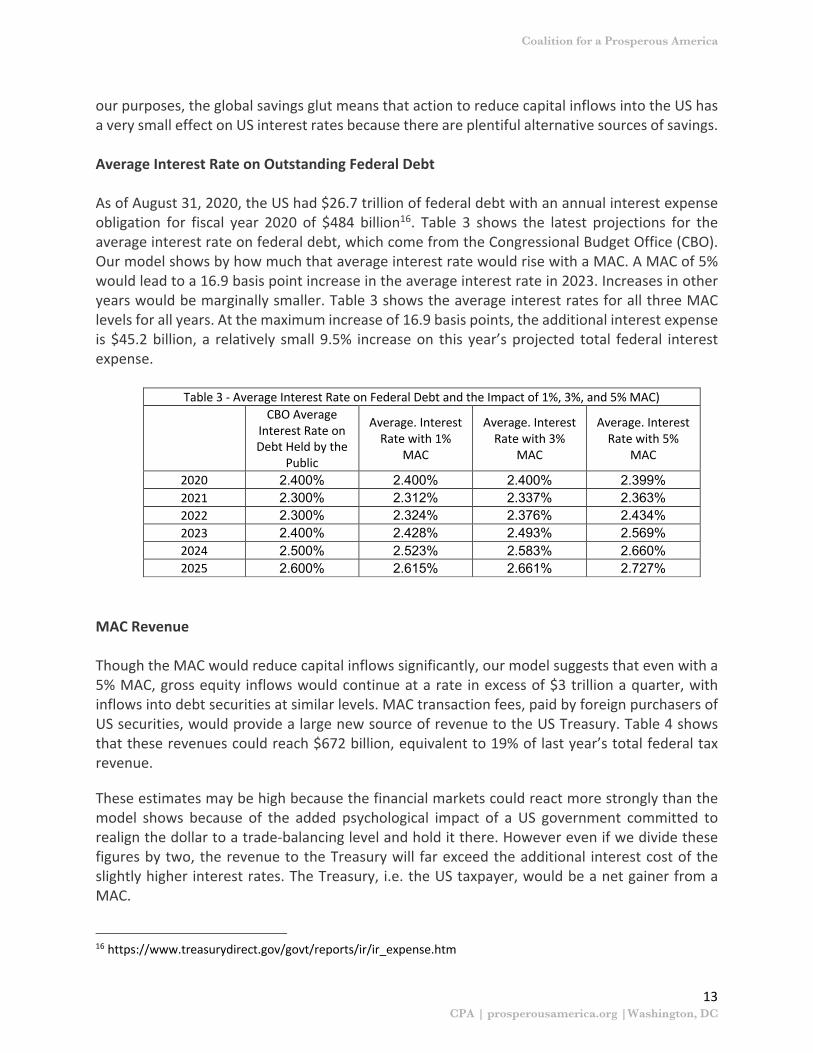
our purposes, the global savings glut means that action to reduce capital inflows into the US has a very small effect on US interest rates because there are plentiful alternative sources of savings. Average Interest Rate on Outstanding Federal Debt As of August 31, 2020, the US had $26.7 trillion of federal debt with an annual interest expense obligation for fiscal year 2020 of $484 billion16. Table 3 shows the latest projections for the average interest rate on federal debt, which come from the Congressional Budget Office (CBO). Our model shows by how much that average interest rate would rise with a MAC. A MAC of 5% would lead to a 16.9 basis point increase in the average interest rate in 2023. Increases in other years would be marginally smaller. Table 3 shows the average interest rates for all three MAC levels for all years. At the maximum increase of 16.9 basis points, the additional interest expense is $45.2 billion, a relatively small 9.5% increase on this year’s projected total federal interest expense.
Table 3 - Average Interest Rate on Federal Debt and the Impact of 1%, 3%, and 5% MAC)
CBO Average Interest Rate on Debt Held by the
Public
Average. Interest Rate with 1%
MAC
Average. Interest Rate with 3%
MAC
Average. Interest Rate with 5%
MAC
2020 2.400% 2.400% 2.400% 2.399% 2021 2.300% 2.312% 2.337% 2.363% 2022 2.300% 2.324% 2.376% 2.434% 2023 2.400% 2.428% 2.493% 2.569% 2024 2.500% 2.523% 2.583% 2.660% 2025 2.600% 2.615% 2.661% 2.727%
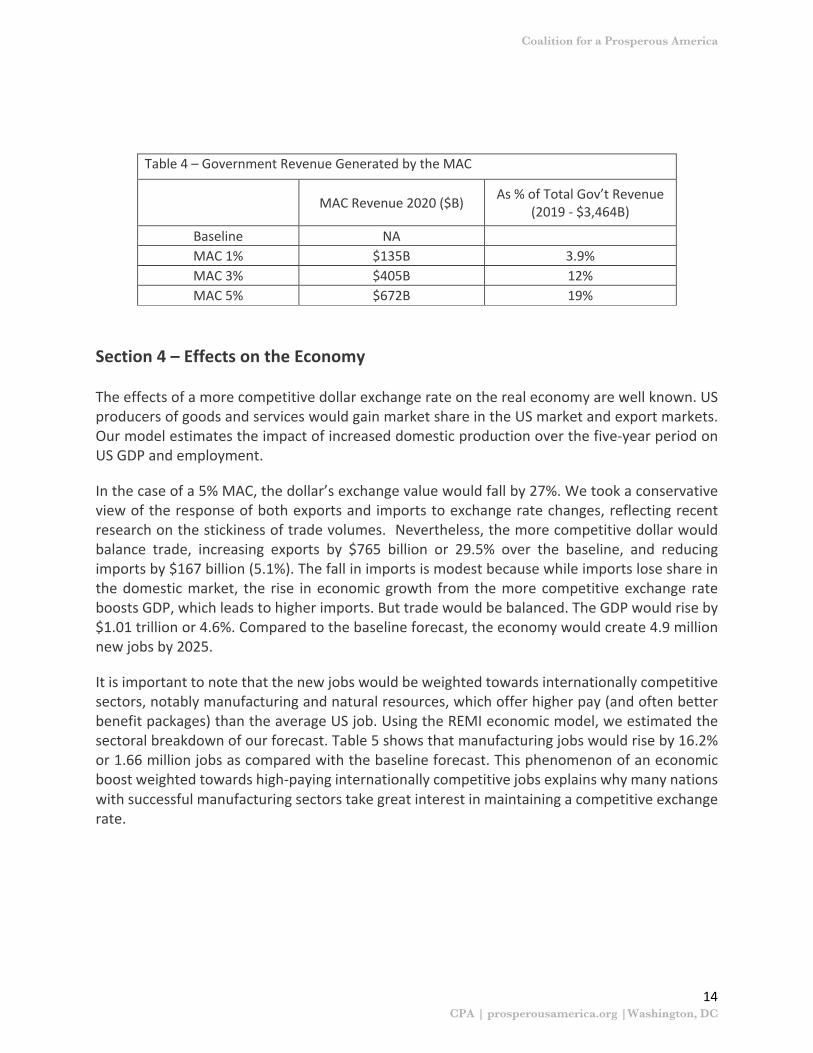
MAC Revenue Though the MAC would reduce capital inflows significantly, our model suggests that even with a 5% MAC, gross equity inflows would continue at a rate in excess of $3 trillion a quarter, with inflows into debt securities at similar levels. MAC transaction fees, paid by foreign purchasers of US securities, would provide a large new source of revenue to the US Treasury. Table 4 shows that these revenues could reach $672 billion, equivalent to 19% of last year’s total federal tax revenue.
These estimates may be high because the financial markets could react more strongly than the model shows because of the added psychological impact of a US government committed to realign the dollar to a trade-balancing level and hold it there. However even if we divide these figures by two, the revenue to the Treasury will far exceed the additional interest cost of the slightly higher interest rates. The Treasury, i.e. the US taxpayer, would be a net gainer from a MAC.
16 https://www.treasurydirect.gov/govt/reports/ir/ir_expense.htm
Coalition for a Prosperous America
CPA | prosperousamerica.org |Washington, DC
14
Table 4 – Government Revenue Generated by the MAC
MAC Revenue 2020 ($B) As % of Total Gov’t Revenue (2019 - $3,464B)
Baseline NA
MAC 1% $135B 3.9% MAC 3% $405B 12% MAC 5% $672B 19%
Section 4 – Effects on the Economy The effects of a more competitive dollar exchange rate on the real economy are well known. US producers of goods and services would gain market share in the US market and export markets. Our model estimates the impact of increased domestic production over the five-year period on US GDP and employment.
In the case of a 5% MAC, the dollar’s exchange value would fall by 27%. We took a conservative view of the response of both exports and imports to exchange rate changes, reflecting recent research on the stickiness of trade volumes. Nevertheless, the more competitive dollar would balance trade, increasing exports by $765 billion or 29.5% over the baseline, and reducing imports by $167 billion (5.1%). The fall in imports is modest because while imports lose share in the domestic market, the rise in economic growth from the more competitive exchange rate boosts GDP, which leads to higher imports. But trade would be balanced. The GDP would rise by $1.01 trillion or 4.6%. Compared to the baseline forecast, the economy would create 4.9 million new jobs by 2025.
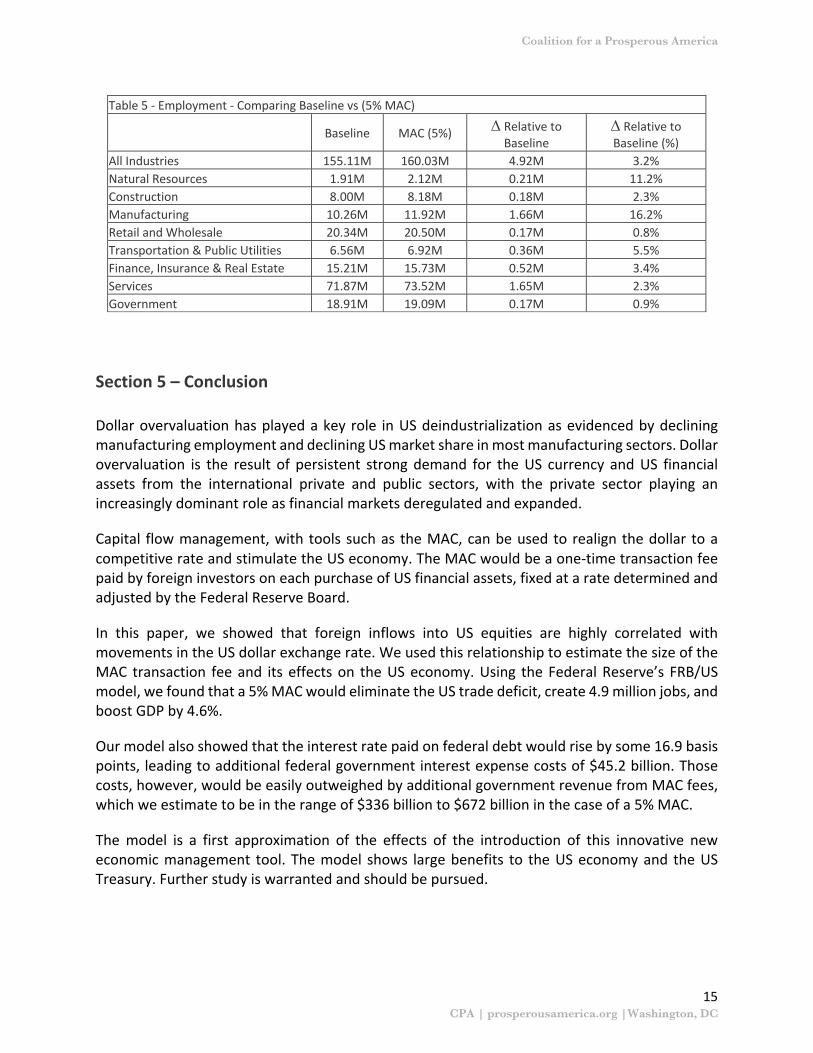
It is important to note that the new jobs would be weighted towards internationally competitive sectors, notably manufacturing and natural resources, which offer higher pay (and often better benefit packages) than the average US job. Using the REMI economic model, we estimated the sectoral breakdown of our forecast. Table 5 shows that manufacturing jobs would rise by 16.2% or 1.66 million jobs as compared with the baseline forecast. This phenomenon of an economic boost weighted towards high-paying internationally competitive jobs explains why many nations with successful manufacturing sectors take great interest in maintaining a competitive exchange rate.
Coalition for a Prosperous America
CPA | prosperousamerica.org |Washington, DC
15
Table 5 - Employment - Comparing Baseline vs (5% MAC)
Baseline MAC (5%) D Relative to Baseline
D Relative to Baseline (%)
All Industries 155.11M 160.03M 4.92M 3.2% Natural Resources 1.91M 2.12M 0.21M 11.2% Construction 8.00M 8.18M 0.18M 2.3% Manufacturing 10.26M 11.92M 1.66M 16.2% Retail and Wholesale 20.34M 20.50M 0.17M 0.8% Transportation & Public Utilities 6.56M 6.92M 0.36M 5.5% Finance, Insurance & Real Estate 15.21M 15.73M 0.52M 3.4% Services 71.87M 73.52M 1.65M 2.3% Government 18.91M 19.09M 0.17M 0.9%
Section 5 – Conclusion Dollar overvaluation has played a key role in US deindustrialization as evidenced by declining manufacturing employment and declining US market share in most manufacturing sectors. Dollar overvaluation is the result of persistent strong demand for the US currency and US financial assets from the international private and public sectors, with the private sector playing an increasingly dominant role as financial markets deregulated and expanded.
Capital flow management, with tools such as the MAC, can be used to realign the dollar to a competitive rate and stimulate the US economy. The MAC would be a one-time transaction fee paid by foreign investors on each purchase of US financial assets, fixed at a rate determined and adjusted by the Federal Reserve Board.
In this paper, we showed that foreign inflows into US equities are highly correlated with movements in the US dollar exchange rate. We used this relationship to estimate the size of the MAC transaction fee and its effects on the US economy. Using the Federal Reserve’s FRB/US model, we found that a 5% MAC would eliminate the US trade deficit, create 4.9 million jobs, and boost GDP by 4.6%.
Our model also showed that the interest rate paid on federal debt would rise by some 16.9 basis points, leading to additional federal government interest expense costs of $45.2 billion. Those costs, however, would be easily outweighed by additional government revenue from MAC fees, which we estimate to be in the range of $336 billion to $672 billion in the case of a 5% MAC.
The model is a first approximation of the effects of the introduction of this innovative new economic management tool. The model shows large benefits to the US economy and the US Treasury. Further study is warranted and should be pursued.
Coalition for a Prosperous America
CPA | prosperousamerica.org |Washington, DC