
Working Paper April 2021 Mind the Gap: Home Price ...
24
Working Paper April 2021 Mind the Gap: Home Price Differences by Race and Student Debt Dr. Jessica Lautz, National Association of REALTORS® Dr. Michael White, Nottingham Trent University Abstract The wealth gap among African-American and Hispanic households compared to White Non-Hispanic households has been tracked for three decades. This paper examines the purchase price differences among home buyers from January 2014 to December 2017 who purchased a primary residence property. In addition, the paper examines how the purchase price can lead to further wealth gaps through equity in homeownership. The quantitative approach used is Two-Stage Least Squares (2SLS) using the outcome variable of log of price of home purchased to examine if the price of successful home buyers differs among those with student loan debt, those who are Hispanic/Latino, and those who are Black/African American. The model controls for household income of the buyer, financial help from friends and family, home characteristics, region, and economic environment of the local area of purchase. The instrumental variable used is total search (before a buyer finds a real estate agent and after the buyer works with an agent). The data used is from a survey sample from the National Association of Realtors Profile of Home Buyers and Sellers and is representative of home buyers on a state level over that period.
Transcript of Working Paper April 2021 Mind the Gap: Home Price ...
Working Paper April 2021
Mind the Gap: Home Price Differences by Race and Student Debt Dr. Jessica Lautz, National Association of REALTORS®
Dr. Michael White, Nottingham Trent University
Abstract
The wealth gap among African-American and Hispanic households compared to White Non-Hispanic
households has been tracked for three decades. This paper examines the purchase price differences
among home buyers from January 2014 to December 2017 who purchased a primary residence
property. In addition, the paper examines how the purchase price can lead to further wealth gaps
through equity in homeownership. The quantitative approach used is Two-Stage Least Squares (2SLS)
using the outcome variable of log of price of home purchased to examine if the price of successful home
buyers differs among those with student loan debt, those who are Hispanic/Latino, and those who are
Black/African American. The model controls for household income of the buyer, financial help from
friends and family, home characteristics, region, and economic environment of the local area of
purchase. The instrumental variable used is total search (before a buyer finds a real estate agent and
after the buyer works with an agent). The data used is from a survey sample from the National
Association of Realtors Profile of Home Buyers and Sellers and is representative of home buyers on a
state level over that period.

2 Mind the Gap: Home Price Differences by Race and Student Debt J. Lautz and M. White
Introduction
The homeownership rate for White/Caucasian Americans was 31.2 percentage points higher than
Black/African Americans and 25.8 percentage points higher than Hispanic/Latinos in 2019. The
household wealth in 2016 was $17,600 for Black/African Americans and $20,700 for Hispanic/Latino
families in comparison to $171,000 for White/Caucasian households. Scott-Clayton and Li (2016) found
four years after college graduation, Black/African Americans owe $52,726 in student debt compared to
$28,006 among White/Caucasians (Scott-Clayton and Li 2016).
Through this backdrop of racial wealth differences, home buyers post-Great Recession, face a housing
market with waning housing affordability and an acute housing supply shortage for entry-level buyers.
As a result, home prices have increased by an inflation-adjusted 40 percent from 2012 to 2018 (National
Association of Realtors 2018b) and has become out of reach for many Americans as incomes have risen
14 percent in the same timeframe (U.S. Census Bureau 2018a). The home search time for buyers who
are first-time buyers or buyers with limited income can be arduous with limited inventory. This paper
examines how the price of the home purchased among successful home buyers who enter the housing
market exacerbates these trends and further widens the homeownership and wealth gap.
By using data from recent home buyers who purchased homes from January 2014 to December 2017,
the 2SLS model will explore whether the price of the home purchased changed based on:
• Those who have student debt in comparison to other buyers while controlling for household
income, downpayment assistance, and home characteristics?
• Among buyers of different races while controlling for household income, downpayment
assistance, and home characteristics?
In the model, the outcome variable is the log of home price purchased. The instrumental variable used is
the total search time a buyer put into in the home buying process.
3 Mind the Gap: Home Price Differences by Race and Student Debt J. Lautz and M. White
Literature Review
In the years after the Great Recession, housing affordability became a concern as demand outpaced
supply (Rosen et al. 2017, Joint Center for Housing Studies of Harvard University 2019). Affordability of
housing became a greater concern among Hispanic/Latino and Black/African American populations who
have lower incomes and high student debt amounts.
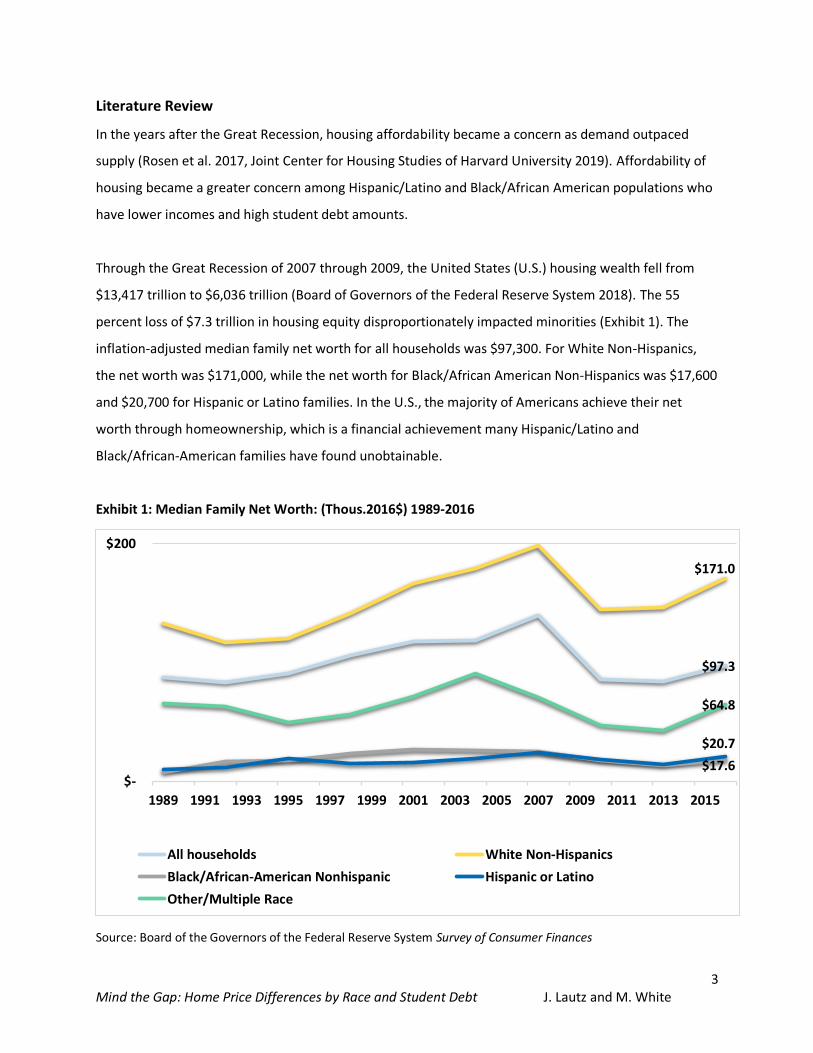
Through the Great Recession of 2007 through 2009, the United States (U.S.) housing wealth fell from
$13,417 trillion to $6,036 trillion (Board of Governors of the Federal Reserve System 2018). The 55
percent loss of $7.3 trillion in housing equity disproportionately impacted minorities (Exhibit 1). The
inflation-adjusted median family net worth for all households was $97,300. For White Non-Hispanics,
the net worth was $171,000, while the net worth for Black/African American Non-Hispanics was $17,600
and $20,700 for Hispanic or Latino families. In the U.S., the majority of Americans achieve their net
worth through homeownership, which is a financial achievement many Hispanic/Latino and
Black/African-American families have found unobtainable.
Exhibit 1: Median Family Net Worth: (Thous.2016$) 1989-2016
Source: Board of the Governors of the Federal Reserve System Survey of Consumer Finances
$97.3
$171.0
$17.6
$20.7
$64.8
$-
$200
1989 1991 1993 1995 1997 1999 2001 2003 2005 2007 2009 2011 2013 2015
All households White Non-Hispanics
Black/African-American Nonhispanic Hispanic or Latino
Other/Multiple Race
4 Mind the Gap: Home Price Differences by Race and Student Debt J. Lautz and M. White
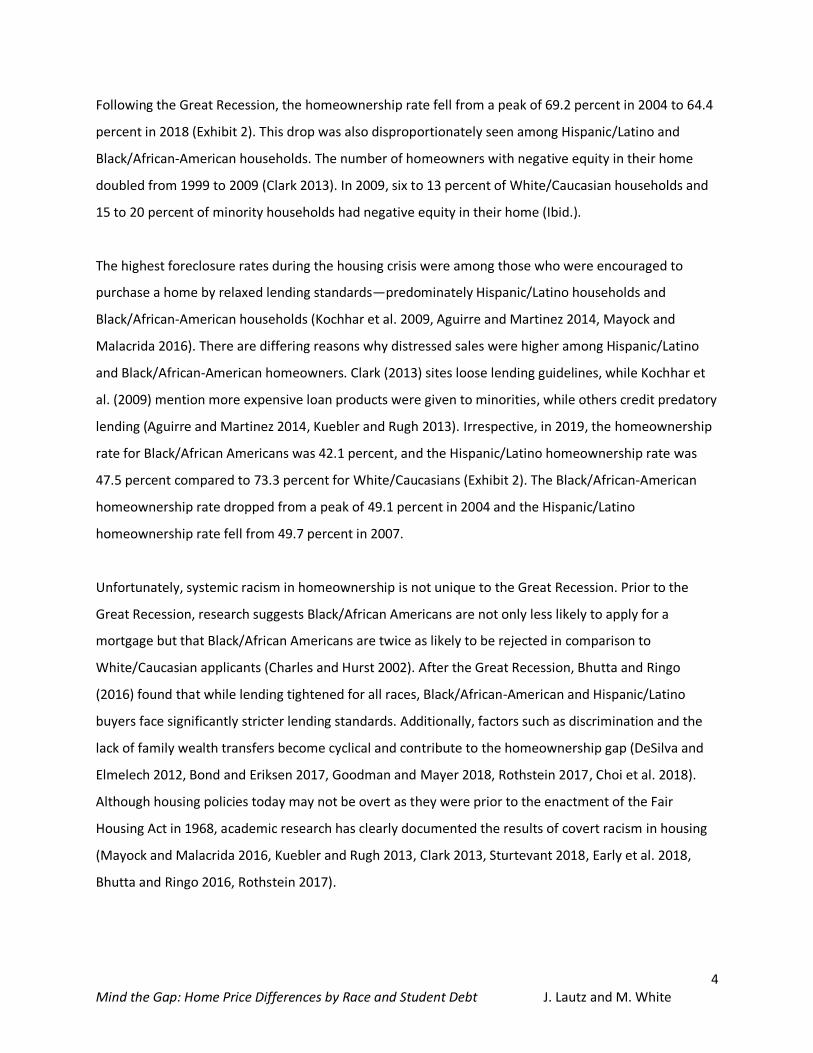
Following the Great Recession, the homeownership rate fell from a peak of 69.2 percent in 2004 to 64.4
percent in 2018 (Exhibit 2). This drop was also disproportionately seen among Hispanic/Latino and
Black/African-American households. The number of homeowners with negative equity in their home
doubled from 1999 to 2009 (Clark 2013). In 2009, six to 13 percent of White/Caucasian households and
15 to 20 percent of minority households had negative equity in their home (Ibid.).
The highest foreclosure rates during the housing crisis were among those who were encouraged to
purchase a home by relaxed lending standards—predominately Hispanic/Latino households and
Black/African-American households (Kochhar et al. 2009, Aguirre and Martinez 2014, Mayock and
Malacrida 2016). There are differing reasons why distressed sales were higher among Hispanic/Latino
and Black/African-American homeowners. Clark (2013) sites loose lending guidelines, while Kochhar et
al. (2009) mention more expensive loan products were given to minorities, while others credit predatory
lending (Aguirre and Martinez 2014, Kuebler and Rugh 2013). Irrespective, in 2019, the homeownership
rate for Black/African Americans was 42.1 percent, and the Hispanic/Latino homeownership rate was
47.5 percent compared to 73.3 percent for White/Caucasians (Exhibit 2). The Black/African-American
homeownership rate dropped from a peak of 49.1 percent in 2004 and the Hispanic/Latino
homeownership rate fell from 49.7 percent in 2007.
Unfortunately, systemic racism in homeownership is not unique to the Great Recession. Prior to the
Great Recession, research suggests Black/African Americans are not only less likely to apply for a
mortgage but that Black/African Americans are twice as likely to be rejected in comparison to
White/Caucasian applicants (Charles and Hurst 2002). After the Great Recession, Bhutta and Ringo
(2016) found that while lending tightened for all races, Black/African-American and Hispanic/Latino
buyers face significantly stricter lending standards. Additionally, factors such as discrimination and the
lack of family wealth transfers become cyclical and contribute to the homeownership gap (DeSilva and
Elmelech 2012, Bond and Eriksen 2017, Goodman and Mayer 2018, Rothstein 2017, Choi et al. 2018).
Although housing policies today may not be overt as they were prior to the enactment of the Fair
Housing Act in 1968, academic research has clearly documented the results of covert racism in housing
(Mayock and Malacrida 2016, Kuebler and Rugh 2013, Clark 2013, Sturtevant 2018, Early et al. 2018,
Bhutta and Ringo 2016, Rothstein 2017).
5 Mind the Gap: Home Price Differences by Race and Student Debt J. Lautz and M. White
Other papers on race discuss segregation and home price differences within neighborhoods. Perry et al.
(2018) found neighborhoods that have at least 50 percent Black/African-American residents (10 percent
of neighborhoods) are valued at half the price of neighborhoods with no Black/African-American
residents. The same year, another article found higher price appreciation among Black/African-American
owners than White/Caucasian owners in 15 large metropolitan areas (Immergluck et al. 2018).
Immergluck et al. (2018) conclude that post Great Recession homeownership is a wealth building tool
for Black/African-American families.
Exhibit 2: U.S. Homeownership Rate by Race 1994-2019
Source: U.S. Census Bureau Housing Vacancies and Homeownership
In the years following the Great Recession, housing affordability due to a housing shortage has moved to
the forefront of the economic discussion on housing. As of May 2020, there have been 99 straight
months of year-over-year home price growth in the U.S. (Simmons 2020). As a result, home prices have
increased by an inflation-adjusted 40 percent from 2012 to 2018 (National Association of Realtors
2018b) and has become out of reach for many Americans as incomes have risen 14 percent in the same
timeframe (U.S. Census Bureau 2018a).
Emerging from the Great Recession, amidst the backdrop of the loss of household wealth and
homeownership, and housing affordability constraints, was the push towards higher education.
64.6%
73.3%
42.1%
50.8%
57.7%
47.5%
40%
80%
1994 2019
U.S. Non-Hispanic White
Black American Indian or Alaskan Native
Asian or Native Hawaiian/Pacific Islander Hispanic or Latino

6 Mind the Gap: Home Price Differences by Race and Student Debt J. Lautz and M. White
Education allows Americans to retrain in a different skill set or go back to college to obtain a graduate
degree. While households deleveraged debt after the Great Recession and avoided car loans, home
equity lines of credit and credit card debt, student debt was an outlier and increased post-recession.
Student debt in the first quarter of 2003 was $0.24 trillion compared to $1.54 trillion in the first quarter
of 2020. (Exhibit 3)
Exhibit 3: Total Debt Balance and Its Composition: 2003Q1-2020Q1 (Trillions of Dollars)
Source: New York Federal Reserve Consumer Credit Panel/Equifax
Student debt is a hurdle to enter homeownership and results in a lower homeownership rate among
those who hold student debt (Bleemer et al. 2017, Cooper and Wang 2014, Miller and Nikaj 2018,
National Association of Realtors 2017, Gicheva and Thompson 2015). However, while these studies
looked at borrowers regardless of their race, other studies suggest by race, among successful graduates,
debt disproportionately impacts Hispanic/Latinos and Black/African Americans. Scott-Clayton and Li
(2016) found the debt for Black/African Americans and White/Caucasians four years after graduation
was $52,726 compared to $28,006, respectively. The authors cite contributing factors such as
White/Caucasian borrowers have better job prospects, but also higher pay, and are less likely to default,
and less likely to attend for-profit colleges (Ibid.).
$0.24
$1.54
$-
$2
$4
$6
$8
$10
$12
$14
$16
03
:Q1
03
:Q4
04
:Q3
05
:Q2
06
:Q1
06
:Q4
07
:Q3
08
:Q2
09
:Q1
09
:Q4
10
:Q3
11
:Q2
12
:Q1
12
:Q4
13
:Q3
14
:Q2
15
:Q1
15
:Q4
16
:Q3
17
:Q2
18
:Q1
18
:Q4
19
:Q3
Mortgage HE Revolving Auto Loan Credit Card Student Loan Other
7 Mind the Gap: Home Price Differences by Race and Student Debt J. Lautz and M. White
Data Source and Descriptive Statistics
The data source for this study was the annual Profile of Home Buyers and Sellers survey from the
National Association of Realtors. The survey has been conducted annually since 1981 and surveys
primary residence home buyers who purchased within the last year. Data for this study was combined
from the survey sample using home buyers who purchased from January 2014 to December 2017.
Annually, between 5,000 and 10,000 respondents take the survey. The sample size is 18,771. The data
was weighted to reflect home sales on a state level. The survey allows for respondents to take the
survey via paper or online, and is conducted in both English and Spanish and allows for respondents to
skip questions they do not want to answer. The descriptive statistics of the sample are found in Exhibit
4.

8 Mind the Gap: Home Price Differences by Race and Student Debt J. Lautz and M. White
Exhibit 4: Primary Residence Home Buyers With and Without Student Debt January 2014 to December 2017
Variables All Respondents
Buyer With Student Debt
Buyer Without Student Debt
Levene's Test for Equality of Variance F-Statistic
Sig.
Purchase Price (Median) $235,000 $225,000 $252,000 114.299 0.000
Have Student Debt 27% 100% 0% NA NA
Age (Median) 44 34 51 2835.311 0.000
Children Under 18 (Median)
0 0 0 67.126 0.000
Gift Friends Relatives 12% 19% 9% 1861.169 0.000
Loan Friends Relatives 3% 4% 2% 295.929 0.000
White/Caucasian 84% 82% 85% 89.575 0.000
Black/African American 5% 8% 4% 757.261 0.000
Hispanic/Latino/Mexican/ Puerto Rican
7% 8% 7% 59.580 0.000
Asian/Pacific Islander 5% 4% 5% 64.829 0.000
Other Race 3% 3% 3% 4.904 0.278
First-Time Buyer 34% 54% 26% 1968.595 0.000
Born in US 91% 93% 90% 354.008 0.000
Suburban/Subdivision 53% 52% 52% 31.466* 0.000
Urban 20% 20% 20%
Small Town 13% 16% 13%
Rural 12% 12% 12%
Resort 2% 1% 3%
Married Couples 66% 68% 64% 64.316* 0.000
Single Female 16% 14% 17%
Single Male 8% 5% 9%
Unmarried Couple 8% 11% 7%
Other Marital 2% 2% 2%
Prior Living Own 47% 29% 54% 665.636* 0.000
Prior Living Rent 42% 56% 37%
Prior Living Live W Parents
11% 15% 10%
HH Income Less than 35k 6% 4% 7% 29.270* 0.000
HH Income 35k-55K 13% 13% 14%
HH Income 55k-75k 17% 17% 16%
HH Income 75k-100k 20% 22% 19%
HH Income 100k-125k 15% 17% 15%
HH Income 125k-175k 15% 16% 15%
HH More than 175k 12% 11% 14%
Sq FT (Median) 1,900 1,800 1,900 46.655 0.000
Full Bathrooms (Median) 2 2 2 76.996 0.000
*See appendix for full Tamhane results

9 Mind the Gap: Home Price Differences by Race and Student Debt J. Lautz and M. White
The median purchase price for this time period was $235,000. However, among those who had student
debt the purchase price was $225,000, compared to the purchase price of a home for those with no
student debt whichwas $252,000. The typical buyer was 44 years of age, but among those with debt, the
buyer was 34, and 51 for those with no student debt. In the sample, 34 percent of buyers are first-time
home buyers. More than half of student debt holders are first-time buyers.
The majority of the sample is White/Caucasian at 84 percent. However, buyers with student debt are
more likely to cite they are Black/African American and Hispanic/Latino/Mexican/Puerto Rican. In the
survey, buyers are allowed to select more than one racial category. Ninety-one percent of the sample
was born in the U.S.
A growing share of buyers rely on assistance from friends and family with their downpayment to enter
homeownership. In the sample, 12 percent received a gift and 3 percent received a loan from friends or
family to purchase a home. Among those with student debt, this was more common—23 percent either
received a gift or loan compared to 11 percent among those who did not have debt. Studies have
suggested receiving financial gifts from friends and family is one way to receive help, but there is also a
transfer of knowledge and inherent encouragement among parents who are homeowners to their
children (Choi et al. 2018, Haurin et al. 1996).
Friends and family can also help by allowing others to stay in their home and not pay rent before
purchasing. This allows the buyer to save for a downpayment, or pay down other debt, without having
the expense of rent. In the sample, 47 percent owned their home before purchasing, 42 percent rented,
and 11 percent lived with family. Student debt holders were more likely to rent at 56 percent and more
likely to live with family at 15 percent, while those who did not have debt were more likely to own at 54
percent.
Buyers with and without student debt purchased in similar locations, however it was more likely for
student debt holders to purchase in small towns and more likely for those without debt to purchase in
resort areas. The typical home purchased was 1,900 square feet and had 2 full bathrooms. The typical
home purchased was smaller for student debt holders.
10 Mind the Gap: Home Price Differences by Race and Student Debt J. Lautz and M. White
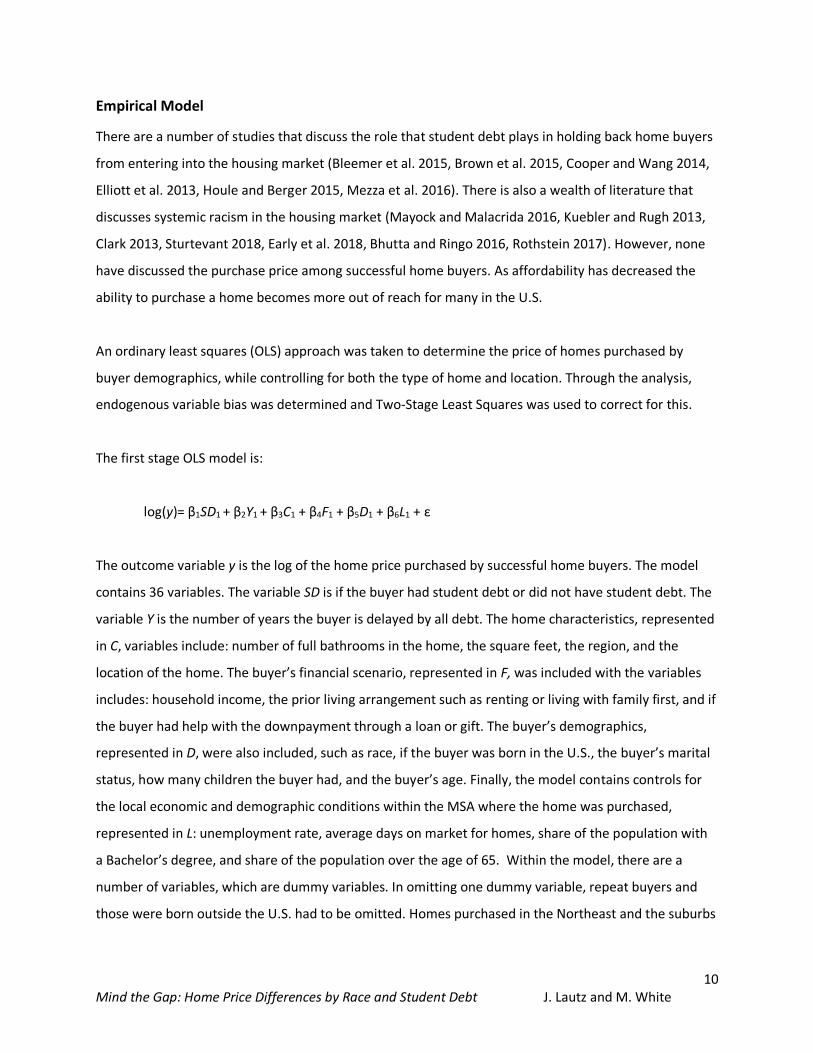
Empirical Model
There are a number of studies that discuss the role that student debt plays in holding back home buyers
from entering into the housing market (Bleemer et al. 2015, Brown et al. 2015, Cooper and Wang 2014,
Elliott et al. 2013, Houle and Berger 2015, Mezza et al. 2016). There is also a wealth of literature that
discusses systemic racism in the housing market (Mayock and Malacrida 2016, Kuebler and Rugh 2013,
Clark 2013, Sturtevant 2018, Early et al. 2018, Bhutta and Ringo 2016, Rothstein 2017). However, none
have discussed the purchase price among successful home buyers. As affordability has decreased the
ability to purchase a home becomes more out of reach for many in the U.S.
An ordinary least squares (OLS) approach was taken to determine the price of homes purchased by
buyer demographics, while controlling for both the type of home and location. Through the analysis,
endogenous variable bias was determined and Two-Stage Least Squares was used to correct for this.
The first stage OLS model is:
log(y)= β1SD1 + β2Y1 + β3C1 + β4F1 + β5D1 + β6L1 + ε
The outcome variable y is the log of the home price purchased by successful home buyers. The model
contains 36 variables. The variable SD is if the buyer had student debt or did not have student debt. The
variable Y is the number of years the buyer is delayed by all debt. The home characteristics, represented
in C, variables include: number of full bathrooms in the home, the square feet, the region, and the
location of the home. The buyer’s financial scenario, represented in F, was included with the variables
includes: household income, the prior living arrangement such as renting or living with family first, and if
the buyer had help with the downpayment through a loan or gift. The buyer’s demographics,
represented in D, were also included, such as race, if the buyer was born in the U.S., the buyer’s marital
status, how many children the buyer had, and the buyer’s age. Finally, the model contains controls for
the local economic and demographic conditions within the MSA where the home was purchased,
represented in L: unemployment rate, average days on market for homes, share of the population with
a Bachelor’s degree, and share of the population over the age of 65. Within the model, there are a
number of variables, which are dummy variables. In omitting one dummy variable, repeat buyers and
those were born outside the U.S. had to be omitted. Homes purchased in the Northeast and the suburbs

11 Mind the Gap: Home Price Differences by Race and Student Debt J. Lautz and M. White
had to be omitted. If the buyer had an income of under $35,000, they were omitted. Married couples
were omitted. White/Caucasian buyers were also omitted.
Full results are shown in Exhibit 5 below for OLS. The sample size is 10,233. The smaller sample is due to
respondents who did not complete survey questions.

12 Mind the Gap: Home Price Differences by Race and Student Debt J. Lautz and M. White
Exhibit 5: Ordinary Least Squares Results: Log of Home Price Between January 2014-December 2017 N=10,233 Adjusted R Squared=.360 F-Statistic=160.836
Unstandardized Beta Standard Error T-Test P-value Significance
(Constant) 7.350 0.194 37.886 0.000
Have Student Debt -0.061 0.016 -3.908 0.000
Years Debt Delayed -0.004 0.002 -2.048 0.041
Gift for Downpayment 0.051 0.020 2.574 0.010
Loan for Downpayment 0.037 0.038 0.987 0.324
Black/African American -0.141 0.031 -4.614 0.000
Hispanic/Latino -0.109 0.025 -4.318 0.000
Asian/Pacific Islander 0.073 0.035 2.102 0.036
Other Race -0.072 0.041 -1.745 0.081
First-time Buyer -0.021 0.020 -1.079 0.281
Born in U.S. -0.011 0.026 -0.421 0.673
Single Female -0.004 0.021 -0.171 0.864
Single Male -0.056 0.025 -2.197 0.028
Unmarried Couple -0.050 0.024 -2.058 0.040
Other Marital -0.068 0.050 -1.355 0.175
Age of Buyer -0.001 0.001 -1.650 0.099
Number of Children -0.019 0.005 -3.426 0.001
Rent Prior -0.046 0.018 -2.606 0.009
Live w/Family Prior -0.111 0.025 -4.421 0.000
HHI 35k to 55K 0.146 0.033 4.353 0.000
HHI 55k to 75k 0.253 0.033 7.758 0.000
HHI 75k to 100k 0.384 0.033 11.664 0.000
HHI 100k to 125k 0.466 0.035 13.419 0.000
HHI 125k to 175k 0.588 0.035 16.650 0.000
HHI More Than 175k 0.722 0.038 19.163 0.000
Urban 0.046 0.020 2.296 0.022
Small Town -0.009 0.019 -0.498 0.618
Rural -0.065 0.023 -2.844 0.004
Resort 0.145 0.054 2.665 0.008
Log Square Feet 0.482 0.024 19.941 0.000
Full Bathrooms 0.114 0.012 9.358 0.000
Midwest -0.119 0.026 -4.644 0.000
South -0.015 0.024 -0.630 0.528
West 0.327 0.026 12.755 0.000
Purchase Sept ‘16-July ‘18 -0.013 0.014 -0.948 0.343
Unemployment Rate MSA 1.971 0.710 2.775 0.006
Share With Bachelor’s MSA 0.021 0.001 18.356 0.000
a Dependent Variable: loghomeprice
13 Mind the Gap: Home Price Differences by Race and Student Debt J. Lautz and M. White
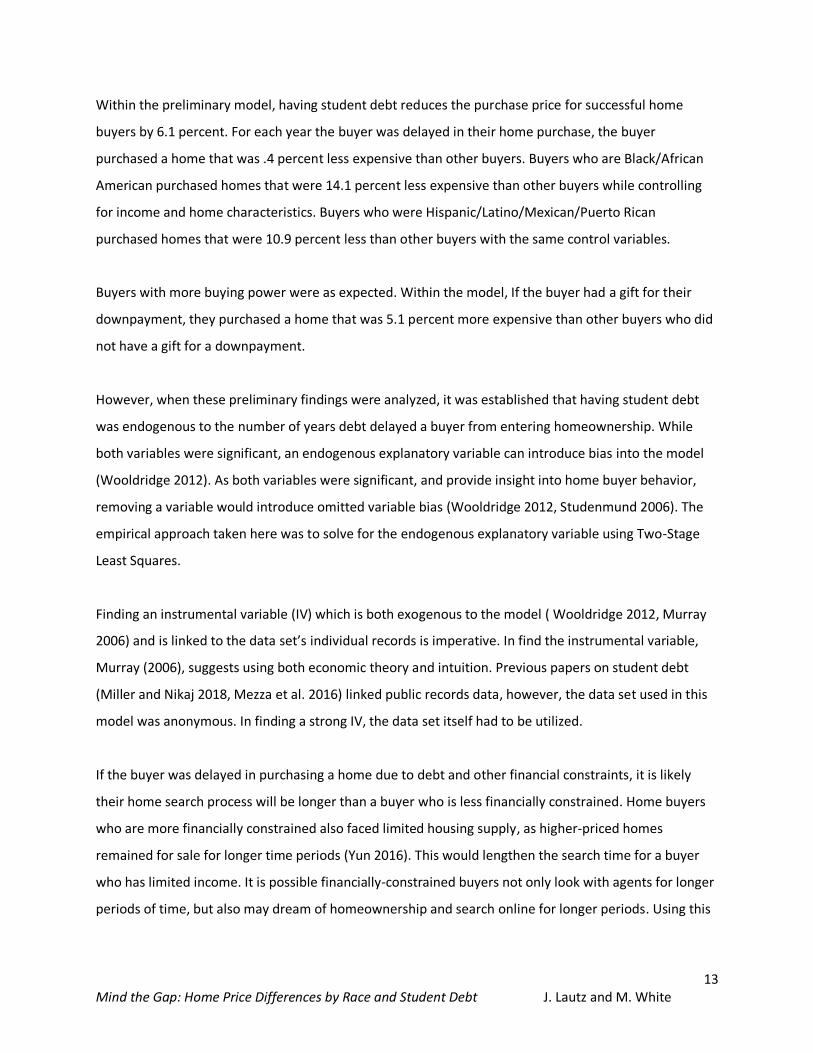
Within the preliminary model, having student debt reduces the purchase price for successful home
buyers by 6.1 percent. For each year the buyer was delayed in their home purchase, the buyer
purchased a home that was .4 percent less expensive than other buyers. Buyers who are Black/African
American purchased homes that were 14.1 percent less expensive than other buyers while controlling
for income and home characteristics. Buyers who were Hispanic/Latino/Mexican/Puerto Rican
purchased homes that were 10.9 percent less than other buyers with the same control variables.
Buyers with more buying power were as expected. Within the model, If the buyer had a gift for their
downpayment, they purchased a home that was 5.1 percent more expensive than other buyers who did
not have a gift for a downpayment.
However, when these preliminary findings were analyzed, it was established that having student debt
was endogenous to the number of years debt delayed a buyer from entering homeownership. While
both variables were significant, an endogenous explanatory variable can introduce bias into the model
(Wooldridge 2012). As both variables were significant, and provide insight into home buyer behavior,
removing a variable would introduce omitted variable bias (Wooldridge 2012, Studenmund 2006). The
empirical approach taken here was to solve for the endogenous explanatory variable using Two-Stage
Least Squares.
Finding an instrumental variable (IV) which is both exogenous to the model ( Wooldridge 2012, Murray
2006) and is linked to the data set’s individual records is imperative. In find the instrumental variable,
Murray (2006), suggests using both economic theory and intuition. Previous papers on student debt
(Miller and Nikaj 2018, Mezza et al. 2016) linked public records data, however, the data set used in this
model was anonymous. In finding a strong IV, the data set itself had to be utilized.
If the buyer was delayed in purchasing a home due to debt and other financial constraints, it is likely
their home search process will be longer than a buyer who is less financially constrained. Home buyers
who are more financially constrained also faced limited housing supply, as higher-priced homes
remained for sale for longer time periods (Yun 2016). This would lengthen the search time for a buyer
who has limited income. It is possible financially-constrained buyers not only look with agents for longer
periods of time, but also may dream of homeownership and search online for longer periods. Using this

14 Mind the Gap: Home Price Differences by Race and Student Debt J. Lautz and M. White
economic theory also matched the specification that the variable of total search time was not correlated
to the log of home price purchased (Exhibit 6).
Exhibit 6: Correlation of Log of Home Price and Total Search Time
Total Search Time loghomeprice
Total Search Time Pearson Correlation 1 0.012
Sig. (2-tailed) 0.135
N 16754 16691
loghomeprice Pearson Correlation 0.012 1
Sig. (2-tailed) 0.135
N 16691 18684
The reduced form model is:
YD= β0ST0 + β1SD1 + β3C1 + β4F1 + β5D1 + β6L1 + v
In the reduced form model, Y, the number of years the buyer is delayed by all debt becomes the
outcome variable. The variable ST is the total time the buyer searched for a home, before and after
finding an agent. All exogenous variables remain in the model: if the buyer has student debt,
represented by SD, home characteristics, represented in C; the buyer’s financial scenario, represented in
F; the buyer’s demographics, represented in D, local economic and demographic conditions within the
MSA where the home was purchased, represented in L. In the Staiger and Stock (1997) method, the
instrumental variable would be considered acceptable, as the F-statistic in this model was 19.119.
Staiger and Stock (1997) define an F-statistic above 10 for the bias in the instrumental variable to be
under 10 percent in the reduced form model. Exhibit 7 provides results of the reduced form model.

15 Mind the Gap: Home Price Differences by Race and Student Debt J. Lautz and M. White
Exhibit 7: Reduced Form: Years Debt Delayed Between January 2014-December 2017
N=9,193
Adjusted R Squared=.066
F-Statistic=19.119
Unstandardized Beta Standard Error T-Test P-value Significance
(Constant) 0.665 0.979 0.679 0.497
Total Search Time 0.004 0.001 3.084 0.002
Have Student Debt 1.008 0.078 12.860 0.000
Gift for Downpayment 0.192 0.100 1.923 0.055
Loan for Downpayment 0.485 0.192 2.530 0.011
Black/African American -0.232 0.157 -1.480 0.139
Hispanic/Latino 0.239 0.129 1.856 0.063
Asian/Pacific Islander 0.200 0.176 1.137 0.256
Other Race -0.240 0.208 -1.153 0.249
First-time Buyer 0.729 0.099 7.380 0.000
Born in U.S. -0.137 0.132 -1.044 0.296
Single Female 0.150 0.103 1.446 0.148
Single Male 0.568 0.129 4.399 0.000
Unmarried Couple -0.021 0.121 -0.172 0.863
Other Marital -0.106 0.251 -0.424 0.672
Age of Buyer 0.034 0.003 10.876 0.000
Number of Children 0.200 0.027 7.384 0.000
Rent Prior 0.886 0.090 9.888 0.000
Live w/Family Prior 0.536 0.127 4.221 0.000
HHI 35k to 55K -0.074 0.168 -0.441 0.659
HHI 55k to 75k 0.136 0.165 0.822 0.411
HHI 75k to 100k 0.192 0.166 1.156 0.248
HHI 100k to 125k 0.265 0.176 1.504 0.133
HHI 125k to 175k 0.166 0.179 0.922 0.356
HHI More Than 175k 0.253 0.192 1.320 0.187
Urban 0.113 0.100 1.129 0.259
Small Town 0.085 0.095 0.894 0.372
Rural 0.136 0.116 1.172 0.241
Resort 0.139 0.283 0.492 0.623
Log Square Feet -0.290 0.122 -2.390 0.017
Full Bathrooms -0.067 0.062 -1.089 0.276
Midwest -0.006 0.129 -0.050 0.960
South -0.047 0.122 -0.382 0.703
West -0.045 0.129 -0.350 0.726
Purchase Sept ‘16-July ‘18 0.061 0.072 0.844 0.399
Unemployment Rate MSA 1.074 3.565 0.301 0.763
Share With Bachelor’s MSA -0.002 0.006 -0.391 0.696
a Dependent Variable: YearsDEBTDELAYED

16 Mind the Gap: Home Price Differences by Race and Student Debt J. Lautz and M. White
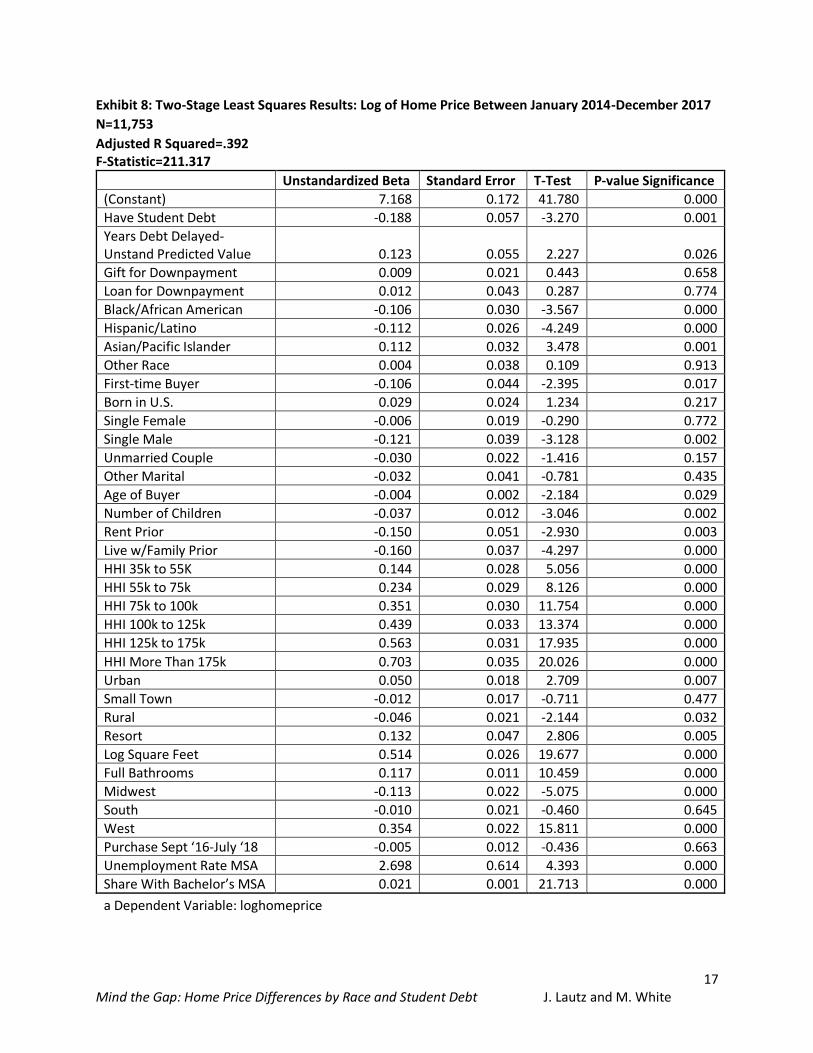
The Two-Stage Least Squares (2SLS) structural form model results are found in Exhibit 8. The structural
form model has a sample size of 11,753 and an adjusted R squared of .392. The structural model:
log(y)= β1SD1 + β2Ŷ1 + β3C1 + β4F1 + β5D1 + β6L1 + ε
The outcome variable y is the log of home price purchased by successful home buyers. In the structural
model, Ŷ, the unstandardized predicted value is from the reduced form model, where Ŷ is the number of
years the buyer is delayed by all debt regressed with the exogenous outcome variables and the total
weeks a buyer searched for a home before and after finding an agent. All other variables remain in the
model from the first stage: home characteristics, represented in C; the buyer’s financial scenario,
represented in F; the buyer’s demographics, represented in D, local economic and demographic
conditions within the MSA where the home was purchased, represented in L.
17 Mind the Gap: Home Price Differences by Race and Student Debt J. Lautz and M. White
Exhibit 8: Two-Stage Least Squares Results: Log of Home Price Between January 2014-December 2017
N=11,753
Adjusted R Squared=.392 F-Statistic=211.317
Unstandardized Beta Standard Error T-Test P-value Significance
(Constant) 7.168 0.172 41.780 0.000
Have Student Debt -0.188 0.057 -3.270 0.001
Years Debt Delayed-Unstand Predicted Value 0.123 0.055 2.227 0.026
Gift for Downpayment 0.009 0.021 0.443 0.658
Loan for Downpayment 0.012 0.043 0.287 0.774
Black/African American -0.106 0.030 -3.567 0.000
Hispanic/Latino -0.112 0.026 -4.249 0.000
Asian/Pacific Islander 0.112 0.032 3.478 0.001
Other Race 0.004 0.038 0.109 0.913
First-time Buyer -0.106 0.044 -2.395 0.017
Born in U.S. 0.029 0.024 1.234 0.217
Single Female -0.006 0.019 -0.290 0.772
Single Male -0.121 0.039 -3.128 0.002
Unmarried Couple -0.030 0.022 -1.416 0.157
Other Marital -0.032 0.041 -0.781 0.435
Age of Buyer -0.004 0.002 -2.184 0.029
Number of Children -0.037 0.012 -3.046 0.002
Rent Prior -0.150 0.051 -2.930 0.003
Live w/Family Prior -0.160 0.037 -4.297 0.000
HHI 35k to 55K 0.144 0.028 5.056 0.000
HHI 55k to 75k 0.234 0.029 8.126 0.000
HHI 75k to 100k 0.351 0.030 11.754 0.000
HHI 100k to 125k 0.439 0.033 13.374 0.000
HHI 125k to 175k 0.563 0.031 17.935 0.000
HHI More Than 175k 0.703 0.035 20.026 0.000
Urban 0.050 0.018 2.709 0.007
Small Town -0.012 0.017 -0.711 0.477
Rural -0.046 0.021 -2.144 0.032
Resort 0.132 0.047 2.806 0.005
Log Square Feet 0.514 0.026 19.677 0.000
Full Bathrooms 0.117 0.011 10.459 0.000
Midwest -0.113 0.022 -5.075 0.000
South -0.010 0.021 -0.460 0.645
West 0.354 0.022 15.811 0.000
Purchase Sept ‘16-July ‘18 -0.005 0.012 -0.436 0.663
Unemployment Rate MSA 2.698 0.614 4.393 0.000
Share With Bachelor’s MSA 0.021 0.001 21.713 0.000
a Dependent Variable: loghomeprice

18 Mind the Gap: Home Price Differences by Race and Student Debt J. Lautz and M. White
Using the 2SLS model, if a buyer is delayed by debt by one year, the price of the home purchased
increases by 12.3 percent. The sign from the OLS model does change from negative to positive,
however, this is plausible. The home buyer not only purchased a home a year later, while prices have
continually increased, but the buyer also paid off debt, allowing them to purchase a higher priced home.
Within the 2SLS model, if a buyer had student debt, they purchased a home that was 18.8 percent less
expensive than other buyers. While this does compare to the descriptive statistics, the model controls
for the home characteristics and the income of the home buyer.
This price difference helps to explain findings seen by other academics on this topic, which showed
lower homeownership rates and purchases by those with student debt (Bleemer et al. 2017, Cooper and
Wang 2014, Miller and Nikaj 2018, National Association of Realtors 2017, Gicheva and Thompson 2015).
In the economic context of 2014 to 2017 with rapid price growth, it would be difficult for a home buyer
who is looking for a home and with a significant amount of debt, to buy given the limited buying power.
A buyer seeking a home that is priced 18.8 percent less may look to a completely new city, seek a home
in a different metro area or rural area which may not provide the same employment prospects. These
limited job prospects may make it difficult to pay off student debt.
The results of the 2SLS model also show that a buyer who is Hispanic/Latino/Mexican/Puerto Rican
purchases a home that is 11.2 percent less than other buyers. A Black/African-American home buyer
purchased a home that was 10.6 percent less than other buyers. While Asian/Pacific Islander home
buyers purchased homes that were 11.2 percent more than other home buyers. These findings are
notable as the model controls for household income, square foot of home purchased, and the region
within the U.S. While there is no variable for wealth, the model controls for intergenerational transfers
of family wealth through downpayment assistance through a loan or gift.
These findings further the discussion of intergenerational wealth and knowledge transfer of
homeownership among generations as described by (Choi et al. 2018, Haurin et al. 1996). Additionally,
these findings also suggest that segregation among neighborhoods still exists and
Hispanic/Latino/Mexican/Puerto Ricans and Black/African Americans may purchase in lower priced
neighborhoods. While segregation and home price has been discussed by academics in recent literature
(Immergluck et al. 2018, Perry et al. 2018), a concern arises with these results. If buyers purchase lower

19 Mind the Gap: Home Price Differences by Race and Student Debt J. Lautz and M. White
priced homes, even with higher price appreciation for Black/African-American households seen by
Immergluck et al. (2018), the wealth gap between races will continue to be a struggle to close.
Further results show first-time home buyers purchase homes that are 10.6 percent less expensive than
other buyers, which is notable when controlling for income and home characteristics. This finding
suggests the equity earned by repeat buyers contributes to the downpayment in a way that first-time
buyers do not have access to, and are limited to relying on either savings or help from friends and
family. Notably, in the 2SLS results, those who did have downpayment assistance from friends and
family are not statistically significant, whereas gifts from friends and family were in the OLS model. If a
buyer lived with family prior to purchasing a home, the purchased home was 16 percent less expensive
than for other buyers, while a buyer who rented before purchasing bought a home that was 15 percent
less expensive than other buyers. This suggests the buyers who lived with family first may have needed
to do so more than others and may have struggled saving for a downpayment and closing costs.
Among buyers who were single males, the purchased home was 12.1 percent less expensive than for
other buyers. It is possible they were more willing to concede on location or were more willing to find a
home that was a fixer upper in comparison to other home buyers. Buyers who had children purchased
homes that were 3.7 percent less in price than other buyers. This suggests there are opportunity costs of
children in the home, and also may allude to families moving to better school districts and purchasing
lower priced homes as a tradeoff. As income increased for home buyers, the home price consistently
increases.
Among buyers in urban areas, the price of the home purchased increased by 5 percent and for buyers in
resort settings the purchase price was 13.2 percent higher. This indicates there was a price premium for
these locations. For buyers in rural areas, the purchase price was 4.6 percent less than for other buyers.
For buyers in the West the home purchase price was 35.4 percent more and for buyers in the Midwest,
the price was 11.3 percent less than other buyers.

20 Mind the Gap: Home Price Differences by Race and Student Debt J. Lautz and M. White
Conclusion
Using a 2SLS to determine the price of homes purchased by recent home buyers, while controlling for
household income and home purchase characteristics has suggested findings that have long-term
impacts and short-term concerns. Buyers who have student debt purchase homes that are 18.8 percent
less expensive than other buyers. Hispanic/Latino/Mexican/Puerto Rican buyers purchases homes that
are 11.2 percent less expensive than other buyers. Black/African-American buyers purchased homes
that are 10.6 percent less expensive than other buyers.
In the immediate term, these home buyers who purchase lower priced homes than other buyers are
more likely to be impacted by housing affordability constraints. This has already been apparent in recent
years as White/Caucasian homeownership has not only largely rebounded from the Great Recession,
and remains more than 30 percentage points higher than Black/African-American households and 25
percentage points higher than Hispanic/Latino households.
However, in the long-term, these buyers are more likely to lose out on housing wealth accumulation.
Even using the results from Immergluck et al. (2018) which found great price appreciation for minority
owners, on a base level Black/African-American and Hispanic/Latino buyers purchased a home that was
at a lower price point when buying. The lost wealth accumulation is likely to not just be a personal
result, but also creates a cycle of lost wealth and even possibly lost homeownership among
Hispanic/Latino and Black/African American families for further generations. Perry et al. 2018, find
homes in majority Black neighborhoods have a valuation that is nearly $50,000 less than homes in other
neighborhoods. Findings from this paper and others (Perry et al. 2018) suggest purchase price
differences combined with neighborhood valuation will lead to further wealth divides in the U.S.
between White and Black/African-American households.
Findings from the 2SLS analysis reflect the dire prospects for student loan debt holders. Not only do they
face the largest home purchase price differences, they do so in a housing landscape that is experiencing
an affordability crisis with housing supply constraints. The housing shortage is most likely to impact
entry level buyers who may be priced out of the home buying market, facing a need to move to a rural
area with fewer job prospects, which limits the ability to pay off debt. If they enter the housing market,
student debt holders purchase homes at a price point that may never catch up to their peers through
wealth accumulation through housing.

21 Mind the Gap: Home Price Differences by Race and Student Debt J. Lautz and M. White
There are a number of policy steps that may help to close both the homeownership and wealth
accumulation gap. 1. Financial literacy to understand the benefits of homeownership and potential
wealth gains of homeownership. Additionally, financial literacy in high school may assist in helping with
post-secondary planning. 2. Examination of student debt payment plans and to allow borrowers to
refinance their student loans. Student loan debt disproportionately impacts minority borrowers, and
assistance through refinancing into lower interest loans, or education about Income Based Repayment
plans may help student borrowers in the long-term. 3. Expansion of mortgage financing options. Allow
for alternative credit scoring models which may bring in an additional 115,000 Black/African-American
borrowers per year (Carr et al. 2017). 4. Expand awareness of downpayment assistance programs that
are available in state and local areas. Borrowers may qualify for local plans that help mitigate closing
costs, property taxes, pay off student debt, and even help with the downpayment. Expand a public
awareness campaign around these programs.

22 Mind the Gap: Home Price Differences by Race and Student Debt J. Lautz and M. White
References
AGUIRRE, A. and MARTINEZ, R., 2014. The Foreclosure Crisis, the American Dream, and Minority Households in the United States: A Descriptive Profile. Social Justice, 40(3), pp. 6-15.
BOARD OF GOVERNORS OF THE FEDERAL RESERVE SYSTEM, October 19, 2018-last update, Households;
Owners' Equity in Real Estate, Level [OEHRENWBSHNO] [Homepage of retrieved from FRED, Federal
Reserve Bank of St. Louis], [Online]. Available: https://fred.stlouisfed.org/series/OEHRENWBSHNO
[October 20, 2018].
BLEEMER, Z., BROWN, M., LEE, D. and VAN DER KLAAW, W., 2015. Debt, Jobs, Or Housing: What's Keeping Millennials at Home? 700. New York: Federal Reserve Bank of New York.
BLEEMER, Z., BROWN, M., LEE, D., STRAIR, K. and VAN DER KLAAW, W., 2017. Echoes of Rising Tuition in
Students’ Borrowing, Educational Attainment, and Homeownership in Post-Recession America. 820.
New York, NY: Federal Reserve Bank of New York.
BHUTTA, N. and RINGO, D., 2016. Credit Availability and the Decline in Mortgage Lending to Minorities after the Housing Boom. Washington: Board of Governors of the Federal Reserve System: FEDS Notes.
BOND, S.A. and ERIKSEN, M.D., 2017. The Role of Parents on the Home Ownership Experience of Their Children: Evidence from the Health and Retirement Study. Research Paper No. 2017-001. Cincinnati: University of Cincinnati Lindner College of Business.
BROWN, M., STEIN, S. and ZAFAR, B., 2015. The Impact of Housing Markets on Consumer Debt: Credit Report Evidence from 1999 to 2012. Journal of Money, Credit, and Banking, 47, pp. 175.
CARR, J., ZONTA, M. and HORBURG, S.P., 2017. State of Housing in Black America. Lanham, MD:
National Association of Real Estate Brokers.
CHARLES, K.K. and HURST, E., 2002. The Transition to Home Ownership and the Black-White Wealth Gap. Review of Economics and Statistics, 84(2), pp. 281-297.
CHOI, J., ZHU, J. and GOODMAN, L., 2018. Intergenerational Homeownership The Impact of Parental Homeownership and Wealth on Young Adults’ Tenure Choices. 1. Washington, DC: Urban Institute.
CLARK, W.A.V., 2013. The aftermath of the general financial crisis for the ownership society: what happened to low-income homeowners in the US? International Journal of Housing Policy, 227(246), pp. 1-20.
COOPER, D. and WANG, J., 2014. Student loan debt and economic outcomes. Current Policy Perspectives
14-7. Boston, MA: Federal Reserve Bank of Boston.
DESILVA, S. and ELMELECH, Y., 2012. Housing Inequality in the United States: Explaining the White-Minority Disparities in Homeownership. Housing Studies, 27(1), pp. 1-26.
23 Mind the Gap: Home Price Differences by Race and Student Debt J. Lautz and M. White
EARLY, D.W., CARRILLO, P.E. and OLSEN, E.O., June 18, 2018, 2018-last update, Racial Rent Differences in U.S. Housing Markets [Homepage of SSRN], [Online]. Available: https://papers.ssrn.com/sol3/papers.cfm?abstract_id=3200655 [July 1, 2018, 2018].
ELLIOTT, W., GRINSTEIN-WEISS, M. and NAM, I., 2013. Is Student Debt Compromising Homeownership as a Wealth-Building Tool? Working Paper No.13-33. Washington University of St. Louis: Center for Social Development George Warren Brown School of Social Work.
FEDERAL RESERVE BANK OF NEW YORK, May 2020-last update, Household Debt and Credit Report (Q1
2020) [Homepage of Federal Reserve Bank of New York], [Online]. Available:
https://www.newyorkfed.org/microeconomics/hhdc.html [July 4, 2020].
GICHEVA, D. and THOMPSON, J., 2015. The Effects of Student Loans on Long-Term Household Financial Stability. In: B. HERSHBEIN and K.M. HOLLENBECK, eds, Student Loans and the Dynamics of Debt. First edn. Kalamazoo, Michigan: W.E. Upjohn Institute for Employment Research, pp. 287-316.
GOODMAN, L. and MAYER, C., 2018. Homeownership and the American Dream. Journal of Economic Perspectives, 32(1), pp. 31-58.
HAURIN, D.R., HENDERSHOTT, P.H. and WACHTER, S.M., 1996. Borrowing Constraints and the Tenure Choice of Young Households. Working Paper 5630. Cambridge, MA: National Bureau of Economic Research.
HOULE, J. and BERGER, L., 2015. The End of the American Dream? Student Loan Debt and Homeownership Among Young Adults. Washington, DC: The Third Way.
IMMERGLUCK, D. EARL, S. and POWELL, A., 2018. Black Homebuying after the Crisis: Appreciation and Segregation Patterns in Fifteen Large Metropolitan Areas. City & Community. 10.1111/cico.12436.
JOINT CENTER FOR HOUSING STUDIES OF HARVARD UNIVERSITY, 2019. The State of the Nation’s
Housing. Boston, MA: Harvard University.
KOCHHAR, R., GONZALEZ-BARRERA, A. and DOCKTERMAN, D., 2009. Through Boom and Bust: Minorities, Immigrants and Homeownership. 1. Washington, DC: Pew Research Center.
KUEBLER, M. and RUGH, J.S., 2013. New evidence on racial and ethnic disparities in homeownership in the United States from 2001 to 2010. Social science research, 42(5), pp. 1357-1374.
MAYOCK, T. and MALACRIDA, R.S., 2016. Socioeconomic and racial disparities in the financial returns to homeownership. Regional Science and Urban Economics, 70(May 2018), pp. 80-96.
MEZZA, A., RINGO, D., SHERLUND, S. and SOMMER, K., 2016. On the Effect of Student Loans on Access to Homeownership. Washington: Board of Governors of the Federal Reserve System: Finance and Economics Discussion Series 2016-010.
MILLER, J.J. and NIKAJ, S., 2018. Student loan debt, educational attainment, and tenure choice.
Education Economics, 26(4), pp. 1-18.
24 Mind the Gap: Home Price Differences by Race and Student Debt J. Lautz and M. White
MURRAY, M.P., 2006. Avoiding Invalid Instruments and Coping with Weak Instruments. The Journal of
Economic Perspectives, 20(4), pp. 111-132.
NATIONAL ASSOCIATION OF REALTORS, AMERICAN STUDENT ASSISTANCE, 2017. Student Loan Debt and Housing Report 2017 When Debt Holds You Back. 2. Washington, DC: National Association of Realtors.
PERRY, A., ROTHWELL J., and HARSHBARGER D. 2018. The Devaluation of Assets in Black Neighborhoods: The Case of Residential Property. Washington, DC: Metropolitan Policy Program at Brookings and Gallup. [Online]. Available: https://www.brookings.edu/research/devaluation-of-assets-in-black-neighborhoods/ [July 12, 2020].
ROSEN, K., BANK, D., BELFOR, H., ECKSTEIN, A., GADE, A. and TCHEAU, M., 2017. Hurdles to
Homeownership: Understanding the Barriers. 2. Berkeley, CA: Fisher Center for Real Estate and Urban
Economics University of California Berkeley.
ROTHSTEIN, R., 2017. The Color of Law. First edn. New York, NY: Liveright Publishing Corporation.
SCOTT-CLAYTON, J. and LI, J., 2016. Black-White Disparity in Student Loan Debt More Than Triples After
Graduation. Washington, DC: Brookings Institution.
SIMMONS, Q, 2020. Existing-Home Sales Fall 9.7% in May While NAR Expects Strong Rebound in Coming
Months, [Newsroom page of National Association of Realtors], [Online]. Available:
https://www.nar.realtor/newsroom/existing-home-sales-fall-9-7-in-may-while-nar-expects-strong-
rebound-in-coming-months [July 11, 2020].
STAIGER, D. and STOCK, J.H., 1997. Instrumental Variables Regression with Weak Instruments. Econometrica, 65(3), pp. 557-586.
STUDENMUND, A.H., 2006. Using econometrics : a practical guide. Fifth edn. Boston, MA: Pearson
Addison Wesley.
STURTEVANT, L., 2018. Fair Housing at 50: Expanding Access to Opportunity. 1. Washington, DC: National Association of Realtors.
WOOLDRIDGE, J.M., 2012. Introductory Econometrics a Modern Approach. Fifth edn. Mason, OH: South-
Western.
YUN, L., September 27, 2016, 2016-last update, Seasonal Housing Slowdown [Homepage of Forbes], [Online]. Available: https://www.forbes.com/sites/lawrenceyun/2016/09/27/seasonal-housing-slowdown/#43975a8b5b12 [November 12, 2018].