Working Paper 78 - OpenDocs Home
34
Working Paper 78 Regulatory Burdens in Tax Administration and Firms’ Compliance Costs in Africa Merima Ali May 2018
Transcript of Working Paper 78 - OpenDocs Home

Working Paper 78
Regulatory Burdens in Tax Administration and Firms’ Compliance Costs in Africa
Merima Ali
May 2018

1
ICTD Working Paper 78
Regulatory Burdens in Tax Administration and Firms’ Compliance Costs in Africa
Merima Ali May 2018

2
Regulatory Burdens in Tax Administration and Firms’ Compliance Costs in Africa
Merima Ali
ICTD Working Paper 78
First published by the Institute of Development Studies in May 2018
© Institute of Development Studies 2018
ISBN: 978-1-78118-445-5
This is an Open Access paper distributed under the terms of the Creative Commons Attribution Non Commercial 4.0 International license,
which permits downloading and sharing provided the original authors and source are credited – but the work is not used for commercial
purposes. http://creativecommons.org/licenses/by-nc/4.0/legalcode
Available from:
The International Centre for Tax and Development at the Institute of Development Studies, Brighton BN1 9RE, UK
Tel: +44 (0) 1273 606261
Email: [email protected]
Web: www.ictd/en/publications
IDS is a charitable company limited by guarantee and registered in England
Charity Registration Number 306371
Charitable Company Number 877338

3
Regulatory Burdens in Tax Administration and Firms’ Compliance Costs
in Africa
Merima Ali
Summary This paper examines the effect of regulatory burdens related to tax administration on firms’ compliance costs in Africa. Using cross-country firm-level data, the results show that regulatory burdens related to tax administration significantly increase firms’ compliance costs compared to burdens related to other kinds of government regulations. The results further show that firms’ relationships with tax officials affect their compliance costs. While firms that are frequently inspected by tax officials have higher compliance costs, firms that are requested to pay bribes by tax officials, on the other hand, have lower compliance costs. These results, which remain robust after accounting for other firm-, sector- and country-specific factors, highlight that regulatory burdens related to taxation play a bigger role in increasing overall compliance costs in Africa than other forms of regulatory burdens, and that firms may look to informal ways to reduce the burden by paying bribes to tax officials.
Keywords: regulatory burden; tax administration; compliance costs, firms; Africa.
Merima Ali is Senior Researcher at CMI (Chr. Michelsen Institute) in Bergen, Norway and Assistant Professor of Economics at Syracuse University, USA.

4
Contents
Summary 3 Acknowledgements 6 Introduction 7
1 Compliance costs, institutional quality and tax administration burden 8 2 Variables and hypothesis 13
2.1 Firm-specific factors 13 2.2 Sector-specific factors 14 2.3 Location-specific factors 14
3 Empirical results 15 3.1 Benchmark result 15 3.2 Compliance costs and tax administration burden 16 3.3 Compliance costs, institutional quality and legal origin 18 3.4 Robustness check using country-level tax compliance cost indicators 21 3.5 Compliance costs, inspection by tax officials and bribe payments 23 4 Conclusion 27
Appendix 29 References 31
Tables Table 1 Pairwise correlation between management time spent in dealing with government regulations and perceptions about the burden of different government regulations 11 Table 2 Benchmark result with firm-specific factors and sector, location and country fixed effects 16 Table 3 Compliance costs and business’s perception about different regulatory burdens 17 Table 4 Data source and year for country-level indicators 18 Table 5 Pairwise correlation between country-level variables 19 Table 6 Compliance costs, institutional quality and legal origin 20 Table 7 Pairwise correlation between country-level tax compliance indicators 21 Table 8 Robustness check using country-level tax compliance cost indicators 22 Table 9 Bribe payment, frequency of inspection and tax administration 25 Table 10 Compliance costs, tax inspection and bribe payment 27 Table 11 Descriptive characteristics 30 Figures Figure 1 Average percentage of management time spent in dealing with government regulations 9 Figure 2 Cross-country correlation between compliance costs and regulatory quality 10 Figure 3 Percentage of firms that respond that tax administration is a major and very severe obstacle to their business 12
5
Figure 4 Cross-country correlation between government regulation compliance costs and tax compliance costs 12 Figure 5 Statistically significant regression coefficients of different sectors 16 Figure 6 Cross-country correlation between compliance costs and frequency of inspection by tax officials 23 Figure 7 Cross-country correlation between compliance costs and regulatory quality excluding South Sudan and Sudan 29

6
Acknowledgements The author would like to thank Mick Moore and two anonymous referees for thoughtful comments and suggestions that have greatly improved this paper. She would also like to thank the International Centre for Tax and Development for the financial support.

7
Introduction A high fiscal tax burden on businesses and its negative effects on foreign direct investment (FDI) inflows, investment and entrepreneurship has been the topic of considerable research (see for example Nam and Radulescu 2007; Djankov, Ganster, McLiesh, Famalho and Shleifer 2008; Johannes, Clemens and Nadin 2012; Haufler, Norbäck and Persson 2014). However, the costs that businesses incur in actually paying their taxes have not been given sufficient attention in public policy debates, especially in developing countries (Bird 2015). Tax compliance costs, which sometimes are also considered as hidden costs, are the extra costs incurred by taxpayers besides the actual tax liability in the process of becoming and remaining tax compliant (Evans 2008). It is noted that developing countries in general have inefficient tax administration, often associated with corruption, that contributes to higher compliance costs (Bird 2015). Such costs can be in the form of the opportunity cost of staff time in collecting and organising receipts, completing tax forms, appealing taxes and remitting returns, and the monetary costs of outsourcing such activities to professionals. Studies show that tax compliance costs may be larger than the actual taxes paid by businesses (Sandford 1995) and that they are regressive, with smaller businesses carrying a disproportionately higher burden (Evans 2008; Coolidge and Ilic 2009). Just like other regulatory burdens that firms face, tax compliance may impose economic costs by diverting productive resources away from producing goods and services towards complying with taxes (Loayza and Servén 2010). Such costs can create inefficiencies at the firm level, which may alter business activities by affecting their competitiveness, productivity and incentives to innovate. Higher levels of compliance costs may also encourage firms to work outside of the legal framework and become informal (Thiessen 2003). In general, it is more likely for countries with weak institutional set-ups to have an inefficient tax administration system and hence higher tax compliance costs, making the issue more relevant for developing countries. As noted by Bird (2015), efficient tax administration is important in not only reducing compliance costs but also in shaping economic development and building an effective state. Although several studies on tax compliance have been carried out in developed countries (see Evans 2008 and Eichfelder and Vaillancourt 2014 for an overview), similar evidence on businesses in developing countries in general and Africa in particular is largely missing due to lack of data. A number of surveys carried out by the World Bank gave evidence on tax compliance costs from selected developing and transition countries (Coolidge 2012). Although the information is the first of its kind to provide firm-level comprehensive and detailed data on compliance costs, it covers only four African countries. Dabla-Norris, Misch, Cleary and Khwaja (2017) use country-level tax administration quality indices to examine the effect of the tax compliance burden on firm performance in developing and transition countries. The tax administration quality index captures the different aspects of the tax compliance burden borne by firms, starting from the support that businesses get in terms of taxpayer information, to the actual tax compliance costs both when filing and post-filing taxes, and the extent of accountability and transparency on the part of the tax authorities. However, the tax administration quality index is not extracted directly from firms’ responses but rather from expert assessment of the respective countries. The expert assessment, which provides an aggregate figure of the tax administration quality index at the country level, thus does not allow one to assess how the quality varies across firms. The objective of this paper is to examine the effect of regulatory burdens related to tax administration on firms’ compliance costs. The paper uses firm-level indicators of compliance costs measured as an opportunity cost of staff time dealing with various government regulations including those related to taxation. Data is obtained from the World Bank Enterprise Surveys.1 The surveys collect data on firms of different sizes operating in different
1 Enterprise Surveys offer economic data on 131,000 firms in 139 countries. http://www.enterprisesurveys.org/

8
sectors. One key advantage of this dataset is its use of standardised questionnaires and its broad coverage of different variables that are comparable across countries, such as firms’ age, sector, location, employment, and their perceptions about the extent to which different kinds of government regulations are a burden to businesses performance. As most countries are not surveyed each year, the study uses the most recent data available for each country between the years 2014 and 2016. The study uses all 17 sub-Saharan African countries (SSA) that are available in the dataset between the years 2014 and 2016.2 Various country-level indicators from different sources complement the Enterprise Surveys. The results show that regulatory burdens related to tax administration significantly increase compliance costs compared to burdens related to other kinds of government regulations, such as labour regulations, customs and trade regulations and business licences and permits. The paper further examines the effect of firms’ relationships with tax-officials on their compliance costs. While firms that are frequently inspected by tax officials have higher compliance costs, firms that are requested to pay bribes by tax officials, on the other hand, have lower compliance costs. These results, that remain robust after accounting for other firm-, sector- and country-specific factors, highlight that, of the different kinds of government regulations that firms face, those related to taxation play a bigger role in increasing compliance costs in SSA than other forms of regulatory burdens and that firms may look to informal ways to reduce the burden by paying bribes to tax officials. This study expands the literature on tax compliance costs in several dimensions. First, the study compares regulatory burdens related to tax administration with other forms of government regulations in taking up staff time. Second, unlike a previous study that focuses on few African countries, the study provides cross-country evidence on a number of SSA countries. Third, the firm-level measure of compliance costs allows us to look at variations among firms within the same country and examine the correlation with policy relevant micro- and macro-level indicators. It also adds to studies that have looked at the impact of the business environment and regulations on both overall economic performance and on firms’ performance. For example, Berthold and Arilton (2011) looked at how regulations that put a barrier on new firm entry affect long-term growth. Barseghyan (2008) also investigated how entry costs affect output and productivity of firms and Dutz, Kessides, O’Connell and Willig (2011) linked a better business environment with product and process innovation of young firms. Just like other government regulations, those related to tax administration are also expected to add a burden to firms and have an economy-wide implication by affecting firms’ performance. The study is organised as follows. Section 1 presents a descriptive analysis of compliance costs across SSA and presents its link with regulatory burdens related to tax administration. Section 2 presents the econometric specification and the hypothesis to be tested. Section 3 presents the regression results and Section 4 concludes.
1 Compliance costs, institutional quality and
tax administration burden
The outcome variable in this study is a firm-level indicator of compliance costs, which is measured as the percentage of management time spent in dealing with various government regulations in one week, such as taxes, customs, labour regulations, licensing and registration. Data is obtained from the World Bank Enterprise Surveys. The study uses the
2 These countries are Burundi, the Democratic Republic of the Congo (DRC), Djibouti, Ethiopia, Ghana, Kenya,
Madagascar, Malawi, Mauritania, Namibia, Nigeria, Senegal, South Sudan, Sudan, Tanzania, Uganda and Zambia.

9
most recent data available for each country between the years 2014 and 2016. Descriptive statistics of the compliance cost measure and other variables from the Enterprise Surveys that are used throughout the study are provided in Table 11 in the appendix. Figure 1 shows the average compliance costs across countries. On average, managers in a typical firm in a formal sector in SSA spend about 10 per cent of their time dealing with government regulations every week. If a typical manager of a firm works for eight hours a day and five days a week, regulation alone will take up to four hours of their time in one week or 208 hours in one year. 3 This is equivalent to 1.3 months spent every year in a typical firm in SSA just dealing with government regulations. This figure is expected to be much higher as most enterprises, especially family-owned businesses, are likely to work overtime. Looking at the data for specific countries indicates that firms in South Sudan have the highest compliance costs, with a typical manager spending on average around 18 per cent of their time per week dealing with various government regulations. Madagascar, Ethiopia and Mauritania also have their managers spending on average 12-13 per cent of their time dealing with government regulations in one week. Countries like DRC, Djibouti, Sudan, Burundi and Tanzania, on the other hand, have low levels of compliance costs, with a manager in a typical firm spending on average less than 5 per cent of their time dealing with government regulations.
Figure 1 Average management time spent in dealing with government regulations (in per cent)4
The study next looks at the correlation between compliance costs and the quality of institutions. There are good reasons to expect that countries where firms face high compliance costs are also countries with weak institutional qualities. This is because, in general, countries with better institutions tend to create an environment that is more conducive for businesses to flourish and are more likely to enforce rules and regulations in a more transparent and predictable way. Figure 2 depicts the correlation between country-level compliance costs (which are constructed by averaging compliance costs for firms in each
3 40 hours of work per week x 10 per cent = four hours per week. Four hours per week x 52 weeks = 208 hours in one year. 4 Sampling weights are used to calculate the percentages.
0
.05
.1
.15
.2
Southsudan
Madagascar
Ethiopia
Mauritania
ZambiaNigeria
KenyaMalawi
Namibia
Senegal
Ghana
UgandaDRC
DjiboutiSudan
Burundi
Tanzania

10
country) and index for regulatory quality that captures the ‘perceptions of the ability of the government to formulate and implement sound policies and regulations that permit and promote private sector development’.5 Data on regulatory quality is obtained from the World Bank’s Worldwide Governance Indicators6 for the year 2013 (one year before the start of the individual level data from the Enterprise Surveys). The figure depicts a strong correlation whereby countries with better regulatory quality are associated with lower compliance costs. However, the negative correlation might be driven by outlier countries that have either the highest compliance costs or the weakest institutional quality, or both. The correlation graph is constructed again without outlier countries like South Sudan and Sudan. This figure, which is presented in the appendix, shows that the negative correlation still exists with a slightly lower correlation index of -0.30.
Figure 2 Cross-country correlation between compliance costs and regulatory quality
The study next looks at the correlation between compliance costs and different regulatory burdens that firms face. Respondents in each firm were asked to rank the extent to which different regulations are becoming an obstacle to the current operation of a particular firm with the following choices: it does not apply to them, no obstacle, minor obstacle, moderate obstacle, major obstacle and very severe obstacle. Respondents in each firm were asked to respond regarding four types of regulations: tax administration, labour regulations, customs and trade regulations, and regulations related to business licensing and permits. Those firms which responded that the specific regulation does not apply or that it is not an obstacle are given a value of 0. Then a value of 1-4 is given for those firms which responded that it is a minor, moderate, major or very severe obstacle, respectively. The higher the value, the more a particular government regulation is a burden on the performance of the firm. Descriptive statistics of the ranked responses are provided in Table 11 in the appendix.
Table 1 below shows the pairwise correlation between compliance costs and the different kinds of regulatory burdens that firms face. The results show that, compared to other
5 Quote from http://info.worldbank.org/governance/wgi/pdf/rq.pdf The index is constructed based on surveys of the
perceptions of enterprises, citizens, and experts. 6 http://info.worldbank.org/governance/WGI/#home
BDI
ZAR DJI
ETH
GHA
KEN
MDG
MWI
MRT
NAM
NGA
SEN
SSD
SDN
TZA
UGA
ZMB
Correlation: -0.430
.05
.1
.15
.2
Avera
ge m
an
ag
em
en
t tim
e s
pe
nt to
dea
l with r
egu
lation
s
-1.5 -1 -.5 0Regulatory Quality

11
regulatory burdens, the one that is related to tax administration is significantly and strongly correlated with compliance costs.
Table 1 Pairwise correlation between management time spent in dealing with government regulations and perceptions about the burden of different government regulations
Log % of management time in dealing with govt. regulations
Tax administration burden (rank)
Business licensing/ permits (rank)
Customs/ trade regulations (rank)
Labour regulations (rank)
Log % of management time in dealing with govt. regulations
1.0000
Tax administration burden (rank)
0.1196*** (0.0000)
1.0000
Business licensing/ permits (rank)
0.0493*** (0.0000)
0.4714*** (0.0000)
1.0000
Customs/trade regulations (rank)
0.0549*** (0.0000)
0.3143*** (0.0000)
0.3610*** (0.0000)
1.0000
Labour regulations (rank)
-0.0407*** (1.0000)
0.2621*** (0.0000)
0.3598*** (0.0000)
0.3006*** (0.7383)
1.0000
*** p < 0.01, P-values in parentheses, sampling weight is used.
Figure 3 shows the percentage of firms in each country which responded that tax administration is a major obstacle and a very severe obstacle for the performance of their business. As can be seen in the figure, more than 80 per cent of firms in Ethiopia consider tax administration as a major or very severe obstacle. According to the World Development Report, Ethiopia is next to Brazil in terms of having a large proportion of firms considering tax administration as a serious burden (WDR 2004). Figure 3 further shows that close to 40 per cent of firms in Namibia consider tax administration as a serious obstacle. This is followed by Uganda, Tanzania and Nigeria where close to 20 per cent of firms responded accordingly. The study further checks the cross-country correlation between the average compliance costs of government regulations and the tax compliance cost measure. Data on the latter is obtained from the World Bank’s Doing Business database7 that measured the time (in hours) that a typical firm spent in preparing and paying taxes for 2013 (one year before the start of the individual level data from the Enterprise Surveys).8 Figure 4 shows a positive correlation in which countries that spend more time in preparing and paying taxes tend to have firms that on average spend more staff time in dealing with various government regulations, including those related to taxation. This confirms, once again, that compliance costs related to taxation are likely to be the most important regulatory burden that firms face in SSA in terms of increasing the opportunity cost of staff time. These correlations are further confirmed in Section 3 of this study using econometric estimations that control for various firm-, sector-, location- and country-level variables.
7 The ‘Doing Business’ project provides objective measures of business regulations for local firms in 190 economies and
selected cities at the subnational level. http://www.doingbusiness.org/ 8 Data for South Sudan was obtained for 2014.

12
Figure 3 Percentage of firms that responded that tax administration is a major and very severe obstacle to their business9
Figure 4 Cross-country correlation between government regulation compliance costs and tax compliance costs
9 Sampling weights are used to calculate the percentages.
0
20
40
60
80
Ethiopia
Namibia
Uganda
Tanza
nia
Nigeria
Zambia
Malawi
Senegal
Burundi
Kenya
Sudan
Madagasc
ar
Maurit
aniaDRC
Ghana
Djibouti
Southsu
dan

13
2 Variables and hypothesis
The following equation is estimated as a benchmark to analyse the determinants of compliance costs.
Where, 𝑖, 𝑗 and 𝑘 refer to the firm, industry and country respectively. 𝐶𝐶 captures the firm-level compliance cost measure as a logarithm of the percentage of management time spent in dealing with various government regulations. 𝑍 is a vector of standard firm-specific factors
and 𝑅 is a vector of respondents’ perception at firm level about the burden of various
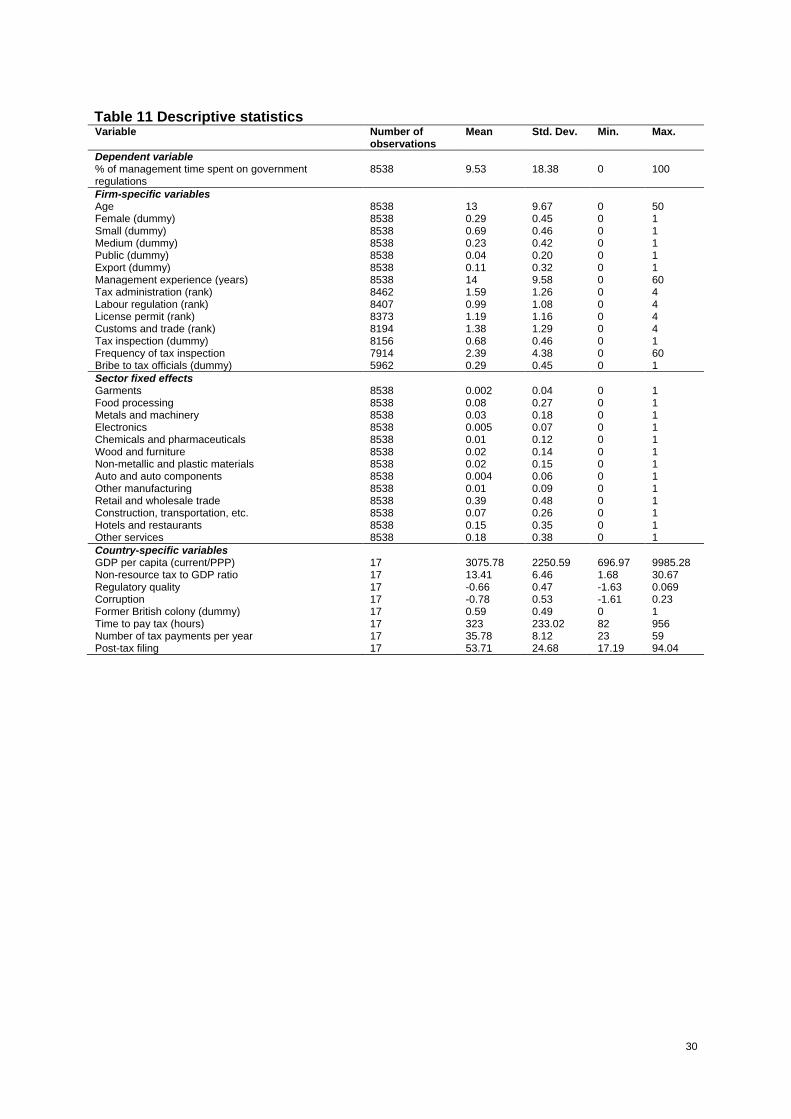
government regulations. 𝑆, 𝐿 and 𝑌 indicate industry, location and country fixed effects. Descriptive statistics of variables included in the different economic estimations throughout this study are provided in Table 11 in the appendix.
2.1 Firm-specific factors Firm-specific factors included in the above specification are the age and size of the firm; the experience of the manager; whether the owner is female or not; the firm’s ownership status; and whether it exports its products or not. A firm’s age and size are used to proxy for its competence in complying with various government regulations. Older firms are expected to have acquired the necessary experience and knowhow to achieve lower compliance costs. Similarly, larger firms tend to have economies of scale advantages to absorb compliance costs because of their high turnover and their ability to hire specialised staffs to deal with such regulations (SBP 2008). A firm’s age is captured by years since the business was established. The average age of firms in the sample is 13 years. The size variable is generated from the total number of full time employees, adjusted for temporary workers. Dummy variables for different categories of firm size are used. Following the definition used by the Enterprise Surveys, a dummy variable for small sized firms is generated if employment is less than 20. Dummy variables for medium and large firms are generated if employment is between 20 and 100 and greater than 100, respectively. The majority of the firms in the sample are small firms (69 per cent) that employ fewer than 20 people. In addition to a firm’s age and size, compliance costs may also depend on the competence of the staff who are dealing with various government regulations. For this, we use the experience of the top manager of the firm in terms of years that he/she has been working in the sector. Top managers of firms in the sample have an average of 14 years of experience working in a specific sector. A number of studies suggest that female-owned businesses are smaller due to various formal and informal institutional constraints they face compared to male-owned businesses (Coleman 2007). Studies also suggest that female-owned businesses are burdened more with regulations related to the labour market and tax legislation compared to male-owned businesses (Aidis, Welter, Smallbone and Isakova 2007). Given that a large proportion of small firms in SSA are likely to be owned by women (Amin 2010), one might expect that such businesses may be more burdened with compliance costs compared to male-owned ones. Female ownership is captured by a dummy variable that has a value of 1 if more than 75 per cent of the enterprise is owned by women and 0 otherwise. In the sample, 29 per cent of firms are owned by women.

14
Even though all firms in the formal sector of a certain country are expected to be subject to the same set of regulations and administrative procedures, the burden is likely to differ based on the ownership structure of firms. Some argue that state-owned enterprises are likely to face lower burdens from government regulations since they tend to have more information about regulatory procedures (Shapiro and Willig 1990). State ownership is also likely to reduce the transactions costs of regulations as contracting becomes easier when the ‘state both owns and regulates’ (Jalilian, Kirkpatrick and Parket 2007). On the other hand, others argue that combined production and regulatory roles can create inherent conflicts of interest that may reduce public-owned enterprises from complying with various government regulations (Djankov and Murrell 2002). Public enterprises may also face a higher burden in meeting various government regulations because they lack the necessary resources due to limited budget support from the government or because their ‘prices are regulated with political criteria’ (WDR 2004: 97). Public ownership is captured by a dummy variable with a value of 1 if the firm is publicly owned and 0 otherwise. Only 4 per cent of firms in the sample are publicly owned. Government regulations in general are known to negatively affect firms’ competitiveness and innovation performance (Aghion, Blundell, Griffith, Howitt and Prandtl 2006). One area where firms can exercise their innovative performance is in the export sector. Studies show that firms that export have a higher propensity to become innovative and are more competitive compared to firms that do not export (Roper and Love 2002). Previous studies also found that government regulations negatively affect firms’ export performance (see for example Freund and Rocha 2011; and Portugal-Perez and Wilson 2012). The effect could also go the other way. Given the volume of their transactions and scale of operation, export-oriented firms might face a disproportionate burden to meet the various government regulations compared to domestic-oriented firms. A dummy variable that has a value of 1 if the firm exports its products and 0 otherwise is generated in order to see the difference in compliance costs between firms depending on their market orientation. Eleven per cent of firms in the sample export their products.
2.2 Sector-specific factors To capture the heterogeneity in compliance costs across sectors, the study uses dummies for detailed industrial classification, as presented in Table 1 in the appendix.
2.3 Location-specific factors Although businesses in the same country are expected to face the same regulatory laws regardless of where they are operating, the burden is likely to differ by location. However, how location can determine compliance costs may depend on a number of factors. On the one hand, businesses operating in areas where there is better infrastructure in terms of access to roads, electricity and the internet are likely to face less of a compliance burden compared to those that do not have such access. Furthermore, bigger cities tend to have an agglomeration of businesses that help facilitate flow of information among firms and reduce compliance costs that may arise from information asymmetry. On the other hand, due to their proximity, government officials may inspect firms operating in bigger cities more often compared to those in remote areas, which may increase the compliance costs in terms of opportunity cost of staff time. In order to capture heterogeneity in compliance costs across locations, the study uses dummy variables based on the population size of the cities that business are operating in. Five dummies are generated based on the following categories: whether the location is a capital city or not; and whether the location has a population greater than 1 million, between 250,000 and one million, between 50,000 and 250,000, or less than 50,000.

15
In addition to location fixed effects, country fixed effects are included in the above econometric specification to control for country-level time invariant factors that can be correlated with compliance costs, such as those related to policy, institutions, regulatory quality and aggregate economic growth. In Section 3.3, alternative econometric specification is used to look at specific policy-relevant country-level indicators that determine compliance costs.
3 Empirical results
3.1 Benchmark result
Table 2 reports the benchmark results using firm-specific factors and sector, location and country fixed effects estimated using the ordinary least squares method. The results show that medium-sized firms are disproportionately burdened with higher compliance costs.10 The result in column IV shows that medium-sized firms spend on average 26 per cent more of their staff time in one week to deal with government regulations than large firms. This indicates that the relationship between compliance costs and firms’ size is not linear and that it first increases and then decreases with size. Since small firms have limited transactions and smaller operations, they might not have to deal with government regulations as much as medium-sized and large firms. Smaller firms can also reduce their compliance costs through either informality or evasion (WDR 2004). Similarly, large firms may use their economies of scale to absorb the extra burdens of complying with government regulations. Furthermore, larger firms are likely to be politically connected, which can make them ‘immune’ to different regulatory burdens and hence face lower compliance costs (Fisman 2001). As expected, firms operating in the export sector are correlated with high compliance costs. Those in the export sector spend about 23 per cent more management time dealing with government regulations compared to those that do not export. Results on management experience and public dummy have the expected signs but are not statistically significant. Figure 5 shows statistically significant regression coefficients on the different sector dummies. The coefficients are obtained from the econometric specification in column IV of table 2. The figure depicts that in general, the manufacturing sector faces a higher compliance cost on government regulations compared to other sectors. Manufacturing sectors such as auto and auto components, wood furniture, chemicals and pharmaceuticals, food processing, garment sector, and other manufacturing sectors face a higher burden. On the other hand, the electronics, metal and machinery and the leather sector in general face a lower compliance cost. Among the service sectors, the one that faces the highest compliance cost is the construction and transportation sector. Sectors like hotels and restaurants and other services are not significantly affected by compliance costs, hence are not included in the figure. Retail and wholesale trade also have a statistically significant compliance cost, but not as much as most of the manufacturing sectors and the construction and transportation sector. Evidence on compliance cost differences by sector will have relevant policy implications for whether high compliance costs can cause misallocation of resources by diverting investment from sectors with high compliance costs to sectors with low compliance costs.
10 A different classification for firm size, where small firms are defined as those employing less than 10 people and
medium-sized firms as those employing between 10-100, was also used, which gave similar results.

16
Table 2 Benchmark result with firm-specific factors and sector, location and country fixed effects Dependent variable: Log percentage of management time spent in dealing with government regulations
I II III IV
Log age -0.01 0.04 0.04 0.00 (0.06) (0.05) (0.05) (0.06)
Small (dummy) 0.13 0.14 0.14 0.21 (0.14) (0.14) (0.14) (0.14)
Medium (dummy) 0.32** 0.33** 0.31** 0.26* (0.13) (0.12) (0.14) (0.13)
Female (dummy) -0.03 -0.06 -0.07 -0.08 (0.14) (0.12) (0.12) (0.08)
Log management experience -0.13 -0.14 -0.14 -0.11 (0.12) (0.12) (0.11) (0.09)
Public (dummy) -0.01 -0.01 -0.03 0.14 (0.11) (0.11) (0.11) (0.10)
Export (dummy) 0.13** 0.15 0.20* 0.23* (0.05) (0.11) (0.10) (0.12)
Sector fixed effect Yes Yes Yes City population fixed effect Yes Yes Country fixed effect Yes
Constant 1.56*** 1.13*** 0.61*** 1.12*** (0.34) (0.32) (0.19) (0.15)
R2 0.008 0.025 0.036 0.115 Number of firms 8538 8538 8538 8538
Robust standard errors, clustered at industrial sectors, are in parentheses. Sampling weight is used in the regression.
∗ Significant at 10%, ∗∗ significant at 5%, ∗∗∗ significant at 1%.
Figure 5 Statistically significant regression coefficients of different sectors
3.2 Compliance costs and tax administration burden
This section reports results on the correlations between overall compliance costs and various government regulations. As mentioned in Section 1 above, respondents’ perceptions at firm level of four different types of government regulations are used in the regression. The ranked responses indicate to what extent tax administration, business licensing and permits, customs and trade regulations and labour regulations are considered as a burden to the current operation of business. The higher the rank, the more serious the particular regulation is considered to be an obstacle for businesses. Some firms responded ‘I don’t know’ when asked to rank the burden of the various regulations. This results in a slight decline in the sample size as indicated in Table 3.
-0.6 -0.4 -0.2 0 0.2 0.4 0.6 0.8 1 1.2 1.4 1.6
Leather
Food processing
Electronics
Wood and furniture
Other manufacturing
Construction, Transportation, etc.

17
Table 3 Compliance cost and businesses’ perception about different regulatory burdens Dependent variable: Log percentage of management time spent in dealing with government regulations
I II III IV
Log age 0.00 -0.01 0.01 -0.01 (0.06) (0.06) (0.06) (0.05)
Small (dummy) 0.20 0.19 0.19 0.19 (0.14) (0.15) (0.15) (0.15)
Medium (dummy) 0.25 0.25 0.25 0.24 (0.15) (0.16) (0.16) (0.16)
Log management experience -0.11 -0.09 -0.09 -0.09 (0.10) (0.09) (0.09) (0.09)
Female (dummy) -0.11 -0.13* -0.13* -0.12* (0.08) (0.07) (0.07) (0.07)
Public (dummy) 0.17* 0.20* 0.20* 0.20* (0.10) (0.10) (0.10) (0.10)
Export (dummy) 0.26** 0.26** 0.26** 0.23** (0.11) (0.11) (0.11) (0.12)
Tax administration (rank) 0.17*** 0.18*** 0.17*** 0.14*** (0.02) (0.02) (0.01) (0.02)
Labour regulation (rank) -0.05 -0.05 -0.07 (0.05) (0.05) (0.05)
License permit (rank) 0.04** 0.04** (0.02) (0.02)
Customs and trade (rank) 0.06 (0.05)
Constant 0.71*** 0.71*** 0.68*** 0.68*** (0.16) (0.18) (0.18) (0.23)
R2 0.135 0.139 0.140 0.142 Number of firms 8462 8407 8373 8194
Sector fixed effect, city population fixed effect and country fixed effect are included in all of the specifications. Robust standard errors, clustered at industrial sectors, are in parentheses. Sampling weight is used in the regression.
∗ Significant at 10%, ∗∗ significant at 5%, ∗∗∗ significant at 1%.
Table 3 shows regression results between the various indicators of regulatory burdens and the compliance cost measure after accounting for firm-specific factors and sector, location and country fixed effects. The regression results in column IV indicate that an increase in firms’ perception about the tax administration burden by one unit increases the percentage of management time spent in dealing with government regulations by 14 per cent. The regulatory burden relating to license and business permits also contributes to overall compliance costs, but only marginally (by about 4 per cent). Regulatory burdens related to labour regulations and customs and trade do not have a statistically significant relationship with overall compliance costs. This indicates that of the different types of government regulations that firms face, the one associated with tax administration seems to result in a higher compliance cost in terms of the opportunity cost of staff time. The regression results reported in Table 3 also show that after controlling for responses on the perception of various regulatory burdens, the coefficient on size becomes insignificant, while the coefficient on the export sector remains significant. In addition, the coefficients on female ownership and public ownership become statistically significant. Unlike the expected results, female-owned businesses face lower compliance costs than male-owned businesses. A possible explanation for the negative relationship between female ownership and compliance costs could be that most female-owned businesses are much smaller compared to male-owned businesses. In the sample, almost 38 per cent of the female-owned businesses employed fewer than 10 people and close to 58 per cent employed fewer than 20 people. Following the non-linear relationship between size and compliance costs indicated in Table 2, female-owned businesses may then face lower compliance costs either because of their limited transactions or due to informality or evasion. The positive coefficient of the public ownership dummy highlights that publicly-owned firms in SSA may lack the necessary resources to lower their compliance costs.

18
3.3 Compliance costs, institutional quality and legal origin
This section reports results on the correlation between various country-level economic and institutional quality indicators and firm-level compliance costs. Most of the country-level variables, as indicated in Table 4, are obtained for the year 2013, one year before the data on firm-level indicators from the Enterprise Surveys begins. The first country-level variable used is GDP per capita. Studies show that in general, countries with low income are often associated with poor public service provision and burdensome regulatory framework (Caballero and Hammour 1996). The second variable is non-resource tax as a share of GDP, which is an indicator of the overall fiscal capacity of each country in general and the tax administration infrastructure in particular. Countries with lower tax to GDP ratio are expected to have higher regulatory burdens on firms, because of lack of resources and the bare minimum tax administration infrastructure and underdeveloped market institutions in those countries (Bird 2015). Table 4 Data source and year for country-level indicators
Variable Source Year
GDP per capita (current/PPP) World Bank Development Indicator 2013 Non-resource tax to GDP ratio ICTD Government Revenue Dataset 2013 Regulatory quality Worldwide Governance Indicators 2013 Corruption Worldwide Governance Indicators 2013
Time to pay tax (hours)∗ Doing Business Database (World Bank) 2013
Number of tax payments per year∗ Doing Business Database (World Bank) 2013
Post-tax filing index Doing Business Database (World Bank) 2017 ∗ Data for South Sudan was obtained for 2014
In addition to income and fiscal capacity, overall institutional quality may also determine firms’ compliance cost. In general, countries with better institutions tend to create an environment that is more conducive for business, and are more likely to enforce rules and regulations in a more transparent and predictable way. Firms operating in countries with better institutional qualities are hence expected to face lower compliance costs. The study used two indicators of institutional quality: regulatory quality and corruption. Both indicators are based on surveys of the perceptions of enterprises, citizens, and experts.11 The regulatory quality index captures the ‘ability of the government to formulate and implement sound policies and regulations that permit and promote private sector development’.12 The higher the value of the index, the better is the regulatory quality of a particular country. The other indicator of institutional quality used in the study is control over corruption. Djankov, La Porta, Lepez-de-Silanes and Shleifer (2002) argue that some countries may deliberately make regulatory procedures complex in order to benefit the regulators themselves, through bribes and informal payments to break or ‘bend the rules’. If this is the case, firms operating in countries with better control on corruption are expected to face lower compliance costs. The index captures ‘perceptions of the extent to which public power is exercised for private gain, including both petty and grand forms of corruption, as well as “capture” of the state by elites and private interests’.13 The higher the index, the better that the country is able to control corruption. Historical factors are likely to shape the current regulatory environment of different countries. Legal traditions introduced into various countries through colonisation and various occupations tend to have a strong correlation with regulations (see La Porta, Lopez-de-Silanes and Shleifer 2008 for an overview). Specifically, studies show that regulatory burdens such as those related to starting a business and the labour markets are correlated with legal origins (Djankov et al., 2002). In general, civil law is associated with burdensome regulations and common law is associated with greater judicial independence (Djankov, La
11 These indicators are constructed from various data sources gathered from a number of survey institutes, think tanks,
non-governmental organisations, international organisations, and private sector firms. For a more detailed discussion of how the indicators are constructed, please see http://info.worldbank.org/governance/wgi/#home.
12 http://info.worldbank.org/governance/wgi/pdf/rq.pdf 13 https://info.worldbank.org/governance/wgi/pdf/cc.pdf

19
Porta, Lepez-de-Silanes and Shleifer 2003 and La Porta, Lopez-de-Silanes, Pop-Eleches and Shleifer 2004). Following this, it is expected that firms that operate in countries that are likely to have common law legal origin will have lower compliance costs compared to those operating in countries with civil law legal origins. In the sample, 10 countries were former British colonies, four countries were former French colonies and two countries were former Belgian colonies. A dummy variable is generated to capture whether the country is a former British colony or not as a proxy for common law legal origin. Table 5 Pairwise correlation between country-level variables
Log GDP per capita
Tax to GDP ratio
Regulatory quality
Corruption Former British colony (dummy)
Log GDP per capita
1.0000
Tax to GDP ratio
0.2966*** (0.0000)
1.0000
Regulatory quality
0.2897*** (0.0000)
0.6582*** (0.0000)
1.0000
Corruption 0.0193 (0.3823)
0.8199* *** (0.0000)
0.5271*** (0.0000)
1.0000
Former British colony (dummy)
0.6104* (0.0000)
0.0294 (0.0157) 0.3552*** (0.0000)
-0.3765*** (0.0000)
1.0000
*** p < 0.01, P-values in parentheses.
Table 5 reports the pairwise correlation between the different economic and institutional country-level indicators used in the regression. Higher GDP per capita is correlated significantly with high tax to GDP ratio and better regulatory quality. Former British colonies have positive correlation with GDP per capita and tax to GDP ratio and better regulatory quality, and negative correlation with control over corruption. Regulatory quality is also strongly correlated with better control over corruption.

20
Table 6 Compliance costs, institutional quality and legal origin Dependent variable: Log percentage of management time spent in dealing with government regulations
I II III IV
Log age 0.04 0.03 0.03 -0.01 (0.06) (0.06) (0.06) (0.06)
Small (dummy) 0.17 0.13 0.19 0.20 (0.14) (0.15) (0.15) (0.14)
Medium (dummy) 0.27 0.23 0.25 0.25 (0.16) (0.17) (0.15) (0.15)
Log management experience -0.16 -0.15 -0.13 -0.09 (0.12) (0.12) (0.11) (0.09)
Female (dummy) -0.08 -0.05 -0.05 -0.08 (0.10) (0.08) (0.07) (0.06)
Public (dummy) -0.07 0.00 0.06 0.12 (0.15) (0.16) (0.12) (0.12) Export (dummy) 0.28** 0.28** 0.30** 0.28**
(0.11) (0.11) (0.11) (0.11) Tax administration (rank) 0.14*** 0.13*** 0.11*** 0.12***
(0.02) (0.02) (0.02) (0.02) Labour regulation (rank) -0.10*** -0.11*** -0.08* -0.08*
(0.03) (0.03) (0.04) (0.04) License permit (rank) 0.02 0.01 0.03* 0.04*
(0.02) (0.02) (0.02) (0.02) Customs and trade rank) 0.05 0.03 0.04 0.04
(0.06) (0.06) (0.06) (0.06) Log GDP per capita (current/PPP) -0.27*** -0.05 -0.01 -0.01
(0.07) (0.05) (0.03) (0.08) Tax to GDP -0.04*** -0.02 -0.00
(0.01) (0.01) (0.01) Regulatory quality -0.64*** -0.50***
(0.14) (0.11) Corruption 0.25 -0.18
(0.22) (0.12) Former British colony (dummy) -0.35
(0.31)
Constant 2.84*** 2.06*** 1.22** 0.95*** (0.78) (0.63) (0.58) (0.32)
R2 0.075 0.092 0.108 0.115 Number of firms 8194 8194 8194 8194
Sector fixed effects, city population fixed effects and region fixed effects are included in all the specifications. Robust standard
errors, clustered at industrial sectors, are in parentheses. Sampling weight is used in the regression. ∗ Significant at 10%, ∗∗
significant at 5%, ∗∗∗ significant at 1%.
Table 6 reports the regression results. Column 1 reports the regression results after including GDP per capita. As expected, countries with higher income are correlated with lower compliance costs. Column II reports the results after including the non-resource tax as a share of GDP that has the expected negative sign. The coefficient on income becomes insignificant once the tax to GDP ratio is included in column II. Column III reports results after including the two institutional quality indicators. The correlation with regulatory quality is very strong. Increasing regulatory quality by one unit is associated with lower compliance costs by about 64 per cent.14 The coefficients on income and tax to GDP ratio become insignificant when institutional quality indicators are included in the regression. The result on corruption has the wrong sign in column III, but once the indicator for legal origins is controlled for in column IV, the results confirm the expected sign, but remain insignificant. Column IV reports results after including the legal origin indicator. Although the result on legal origin as captured by the former British colony dummy has the expected sign, it is not significant. The other individual level variables remain significant. The results on the various regulatory burdens confirm that tax administration remains the most important determinant of compliance costs even after controlling for various country-level indicators.
14 Using rule of law as an alternative indicator of institutional quality gave the same result. The rule of law index has a very
high correlation of 0.86 with the regulatory quality index. Hence using it in the same regression with regulatory quality will result in multi-collinearity. Rule of law captures perceptions of ‘the extent to which agents have confidence in and abide by the rules of society, and in particular the quality of contract enforcement, property rights, the police, and the courts, as well as the likelihood of crime and violence.’ http://info.worldbank.org/governance/wgi/pdF/rl.pdF
21
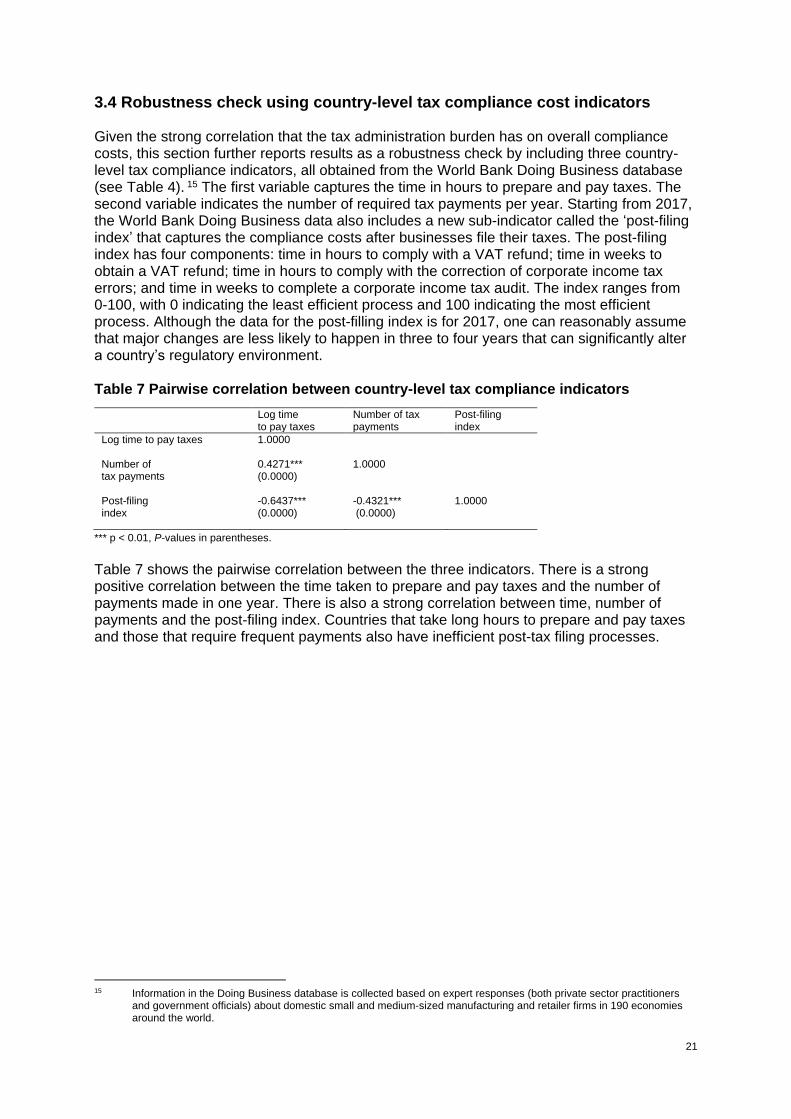
3.4 Robustness check using country-level tax compliance cost indicators Given the strong correlation that the tax administration burden has on overall compliance costs, this section further reports results as a robustness check by including three country-level tax compliance indicators, all obtained from the World Bank Doing Business database (see Table 4). 15 The first variable captures the time in hours to prepare and pay taxes. The second variable indicates the number of required tax payments per year. Starting from 2017, the World Bank Doing Business data also includes a new sub-indicator called the ‘post-filing index’ that captures the compliance costs after businesses file their taxes. The post-filing index has four components: time in hours to comply with a VAT refund; time in weeks to obtain a VAT refund; time in hours to comply with the correction of corporate income tax errors; and time in weeks to complete a corporate income tax audit. The index ranges from 0-100, with 0 indicating the least efficient process and 100 indicating the most efficient process. Although the data for the post-filling index is for 2017, one can reasonably assume that major changes are less likely to happen in three to four years that can significantly alter a country’s regulatory environment. Table 7 Pairwise correlation between country-level tax compliance indicators
*** p < 0.01, P-values in parentheses.
Table 7 shows the pairwise correlation between the three indicators. There is a strong positive correlation between the time taken to prepare and pay taxes and the number of payments made in one year. There is also a strong correlation between time, number of payments and the post-filing index. Countries that take long hours to prepare and pay taxes and those that require frequent payments also have inefficient post-tax filing processes.
15 Information in the Doing Business database is collected based on expert responses (both private sector practitioners
and government officials) about domestic small and medium-sized manufacturing and retailer firms in 190 economies around the world.
Log time to pay taxes
Number of tax payments
Post-filing index
Log time to pay taxes 1.0000
Number of tax payments
0.4271*** (0.0000)
1.0000
Post-filing index
-0.6437*** (0.0000)
-0.4321*** (0.0000)
1.0000

22
Table 8 Robustness check using country-level tax compliance cost indicators Dependent variable: Log percentage of management time spent in dealing with government regulations
I II III
Log age 0.02 0.01 -0.00 (0.06) (0.05) (0.05)
Small (dummy) 0.20 0.19 0.19 (0.14) (0.15) (0.15) Medium (dummy) 0.26* 0.25 0.25 (0.15) (0.15) (0.15) Log management experience -0.10 -0.09 -0.09 (0.10) (0.09) (0.09) Female (dummy) -0.06 -0.08 -0.09 (0.07) (0.07) (0.07) Public (dummy) 0.14 0.15 0.17 (0.12) (0.12) (0.12) Export (dummy) 0.27** 0.27** 0.26** (0.11) (0.11) (0.11) Tax administration (rank) 0.13*** 0.13*** 0.13*** (0.02) (0.02) (0.02) Labour regulation (rank) -0.07* -0.06 -0.06 (0.04) (0.04) (0.04) License permit (rank) 0.03* 0.04** 0.04** (0.02) (0.02) (0.02) Customs and trade (rank) 0.05 0.05 0.05 (0.06) (0.05) (0.05) Log GDP per capita (current/PPP) -0.24*** -0.09 -0.18* (0.05) (0.11) (0.09) Tax to GDP ratio -0.04** -0.03** -0.05** (0.02) (0.01) (0.02) Regulatory quality -0.57*** -0.41*** -0.49*** (0.09) (0.10) (0.11) Corruption 0.45** 0.27* 0.64** (0.17) (0.14) (0.24) Former British colony (dummy) 0.21 -0.03 0.14 (0.21) (0.30) (0.27)
Log time to pay tax 0.52*** 0.43*** 0.54*** (0.13) (0.08) (0.12)
Number of tax payments -0.02** -0.02** (0.01) (0.01)
Post-tax filing -0.01** (0.00)
Constant 0.48 0.61* 1.49*** 0.38 (0.33) (0.37)
R2 0.119 0.125 0.126 Number of firms 8194 8194 8194
Sector fixed effects, city population fixed effects and region fixed effects are included in all the regressions. Robust standard errors, clustered at industrial sectors, are in parentheses. Sampling weight is used in the regression. ∗ Significant at 10%, ∗∗ significant at 5%, ∗∗∗ significant at 1%.
Table 8 shows regression results that control for sector, city population and region fixed effects. Column I reports the results on time it takes to prepare and pay taxes. The results show that there is a strong and significant correlation between the time taken to pay taxes and compliance costs relating to government regulations. Firms that operate in countries that require more time to prepare and pay taxes are associated with higher compliance costs. Column II reports the results after controlling for number of tax payments per year. Although it is to be expected that frequent tax payment increases overall compliance costs on firms in terms of the opportunity cost of staff time, the results indicate that in fact it is the other way round. Firms that operate in countries that generally require more frequent tax payments per year are associated with lower compliance costs on government regulations. One possible explanation for such a result is that more frequent tax payments may force firms to come up with efficient ways of handling their tax filing and overall tax regulations, which in general can help lower the opportunity cost of their staff time. Column III reports the results after including the post-tax filling index. The result is negative and significant, which indicates that countries with more efficient post-tax filing procedures are associated with lower compliance costs. Results in Table 8 further reveal that the tax administration burden remains the main determinant of compliance costs compared to other regulatory burdens.

23
3.5 Compliance costs, inspection by tax officials and bribe payments Given that the regulatory burden from tax administration is the main contributor to overall compliance costs, in this section, the study further looks at how firms’ relationships with tax officials affect their compliance costs. One way that firms may have direct contact with tax officials is through a firm inspection or audit. Frequent tax inspections in developing countries are noted to increase tax compliance costs by disrupting a firms’ work schedule and increasing the opportunity cost of their time (Coolidge 2012). The Enterprise Surveys ask firms whether the business has been visited or inspected by tax officials in the past year. Conditional on them being visited or inspected by tax officials, firms were then asked the number of times that their business was inspected or visited by tax officials in the past year. Close to 68 per cent of firms responded that they were visited or inspected by tax officials. Firms in SSA have an average inspection rate of between two to four times per year, with DRC having by far the highest incidence of inspection by tax officials with a typical firm having up to 10 visits by tax officials in one year. This is followed by Ethiopia with close to five inspections per year. Figure 6 shows the country-level correlation between average number of visits by tax officials and average compliance costs. Since DRC is an outlier, the correlation graph is constructed without DRC. The figure confirms that countries where tax officials visit firms more frequently are also associated with high compliance costs. Frequent tax inspection and cumbersome tax filing procedures may further induce firms to pay bribes to tax officials. The effect of bribe payments by firms is sometimes considered as an additional tax to businesses, except that the payment does not end up in public revenue to provide public goods (Fisman and Svensson 2007). Some studies have even argued that corruption may be far more burdensome and detrimental to the growth of firms than taxes because of the high transaction cost and uncertainty involved in bribe payments (Shleifer and Vishny 1993). On the other hand, bribes to tax officials may be considered by firms as an efficient business mechanism to help facilitate the time otherwise taken on tax-filing procedures, especially in countries with weak institutional frameworks or unclear tax policies (Méon and Weill 2010). Figure 6 Cross-country correlation between compliance costs and frequency of inspection by tax officials

24
Before looking at how bribe payment affects overall compliance costs, the study first looks at the determinants of bribe payments in order to shed light on what kind of firms, which type of regulatory burdens and what kind of country-level conditions are likely to induce bribe payment. The study used an indicator for bribe payment based on firms’ responses regarding whether tax officials requested a gift or an informal payment during any of the visits they made to businesses over the last year.16 A dummy variable for bribe payment is then generated that has a value of 1 if firms responded that tax officials requested bribes during their visit and 0 otherwise. Because of the sensitivity of the question, a large proportion of firms in the sample refused to answer this question. This reduced the sample size to 6,202 firms, as indicated in Table 9. Close to 70 per cent of firms also stated that tax officials requested no payments or gifts. Given the large rate of non-responses and potentially inaccurate responses, the results on bribes in the subsequent tables are therefore likely to indicate the lower bound correlations. Moreover, as is usually the case in corruption literature, the question on bribe payment is formulated in the survey indirectly, asking firms if tax officials requested bribes rather than asking them directly if they have actually paid bribes. Because of this, one cannot tell for sure if bribes were actually paid to tax officials based on the firms’ responses. One should therefore keep this in mind when interpreting the results.
16 Note that this question is asked for those firms that responded that tax officials visited them in the past 12 months.

25
Table 9 Bribe payment, frequency of inspection and tax administration Estimation results using linear probability model. Dependent variable: dummy = 1 if bribe was requested by tax officials and 0 otherwise.
I II III IV V
Log age 0.05** 0.04*** 0.03 0.04** 0.03* (0.02) (0.01) (0.02) (0.02) (0.02) Small (dummy) 0.09 0.05 0.04 0.05 0.04 (0.07) (0.06) (0.06) (0.07) (0.07) Medium (dummy) -0.01 -0.02 -0.01 -0.02 -0.02 (0.04) (0.04) (0.04) (0.04) (0.04) Log management experience -0.08** -0.07*** 0.04*** -0.06*** -0.05*** (0.04) (0.02) (0.01) (0.02) (0.01) Female (dummy) 0.02 0.06 0.06** 0.08** 0.07*** (0.01) (0.04) (0.03) (0.03) (0.03) Public (dummy) 0.03 0.04 0.05 0.01 0.01 (0.03) (0.05) (0.06) (0.06) (0.06) Export (dummy) -0.02 -0.02 -0.02 -0.01 -0.02 (0.08) (0.06) (0.05) (0.05) (0.05) Frequency of inspection 0.01*** 0.01*** 0.01*** 0.01*** (0.00) (0.00) (0.00) (0.00) Tax administration (rank) 0.03*** 0.03*** 0.02*** 0.03*** (0.01) (0.01) (0.01) (0.01) Labour regulation (rank) -0.01 0.00 0.00 0.00 (0.01) (0.01) (0.01) (0.01) License permit (rank) 0.04 0.03 0.04 0.04 (0.02) (0.02) (0.02) (0.02) Customs and trade (rank) 0.01* 0.00 0.01 0.01* (0.00) (0.01) (0.01) (0.01) Log GDP per capita (current/PPP) -0.02 -0.06** (0.02) (0.02) Regulatory quality -0.07*** -0.04** (0.03) (0.02) Log time to pay tax 0.12*** (0.02) Number of tax payments -0.00 (0.00) Post-tax filing -0.00 (0.00) Former British colony (dummy) -0.01 0.02 (0.08) (0.09)
Country fixed effect -- -- Yes -- -- Constant 0.06 -0.03 -0.03 0.18 -0.06 (0.05) (0.08) (0.10) (0.20) (0.18) R2 0.081 0.090 0.141 0.115 0.125
Number of firms 6840 6208 6208 6208 6208
Sector fixed effects, city population fixed effects and region fixed effects are included in all the specifications. Robust standard errors, clustered at industrial sectors, are in parentheses.
Sampling weight is used in the regression. ∗ Significant at 10%, ∗∗ significant at 5%, ∗∗∗ significant at 1%.

26
Table 9 reports the results of the regression using linear probability mode,17 where the dependent variable is a dummy for whether tax officials have requested a bribe or not. Column I reports results after controlling for firm-specific factors. Column II includes frequency of inspection by tax officials and the different regulatory burdens faced by firms. Column III reports results after including country fixed effects. Column IV shows results using various country-level indictors. In addition, column V includes the various country-level tax compliance indicators as a robustness check. The results show that older firms are more likely to be requested to pay bribes by tax officials in all the specifications. An increase in a firm’s age by 1 percentage point increases the likelihood of a bribe request by about 3 per cent. On the other hand, an increase in a manager’s experience by 1 percentage point decreases the likelihood of a bribe request by about 4 per cent. The coefficient on female ownership becomes positive and significant once country fixed effects are controlled for in column III and the results still hold after accounting for various country-level indicators in columns IV and V. Female-owned businesses have a higher likelihood of being requested to pay bribes by tax officials by about 6 per cent more than male-owned businesses. As expected, firms that are frequently inspected by tax officials are more likely to be requested to pay bribes as indicated in columns II through V. For every 1 percentage point increase in inspection by tax officials, the likelihood of a bribe request increases by about 1 per cent. Of the different regulatory burdens, the one associated with tax administration has a higher likelihood of being linked to a bribe request by tax officials, with about 3 per cent increase in bribe requests for every 1 percentage point increase in the tax administration burden. The regulatory burden on customs and trade is also associated with bribe requests by tax officials in column II, but the effect is not significant once country fixed effect and various country-level indicators are controlled for in columns III through V. Firms operating in countries with higher income and better regulatory quality are associated with a lower likelihood of bribe requests. Results in column V show that for every 1 percentage point increase in the average time it takes to file tax, the likelihood that firms are requested to pay bribes by tax officials increases by about 12 per cent. The other indicators of tax compliance costs (number of tax payments, and post-tax filing index) do not have significant correlation with requests to pay bribes to tax officials. The general results in Table 9 indicate that the tax administration burden is associated with a higher probability of bribe requests by tax officials and that income and quality of institutions also matter for bribe requests. The study next looks at how bribe requests by tax officials affect firms’ overall compliance costs. Table 10 reports results using the ordinary least squares method where the dependent variable is a logarithm of the percentage of management time spent in dealing with various government regulations. Results in column I of Table 10 show that an increase in frequency of inspection by tax officials by one increases compliance costs by 4 per cent, confirming the correlation graph depicted in Figure 6. Column II and III show the correlation with bribe requests by tax officials. Firms that stated that tax officials requested bribes during their visits report lower compliance costs. Those firms that are requested to pay bribes to tax officials report a compliance cost that is almost 18 per cent lower than those that were not requested to pay bribes to tax officials, as indicated in column II. The result does not change much when using different specifications (country fixed effects in column II and controlling for various country-level variables in column III). This result can be interpreted in line with those obtained in the previous sections. Results in sections 4.2 through 4.5 show that of the different regulatory burdens that firms face, tax administration is the most important one in contributing to overall compliance costs. Results in Table 9 further show that the regulatory burden associated with tax administration is linked with bribe requests from officials, while the other regulatory burdens show no significant correlation. This suggest that regulatory
17 Non-linear probability models (logit or probit) yield qualitatively identical results. Results from a linear model are reported
because they are more straightforward in terms of both estimation procedure and interpretation. The linear model is also less sensitive to distributional assumptions concerning the error terms (Angrist and Pischke 2008), which is important given the study’s use of several dummy controls.

27
burdens associated with tax administration are relevant for compliance costs and firms may look to informal ways to reduce the burden by paying bribes to tax officials. However, one should note that such bribes may be initiated to reduce the amount of tax that firms pay and not just the compliance costs associated with regulatory burdens. In addition, the time it takes to negotiate on the amount of the bribe between firms and tax officials might be part of the ‘compliance costs’ and this may differ depending on the experience of firms in handling the negotiating. Unfortunately, the data does not distinguish between bribes that are likely to be paid in order to reduce tax rates and those that are meant to lower the compliance costs associated with the regulatory burden.
Table 10 Compliance costs, tax inspection and bribe payment Dependent variable: Log percentage of management time spent in dealing with government regulations
I II III
Frequency of tax inspection 0.04*** 0.02** 0.03*** (0.01) (0.01) (0.01)
Bribe to tax officials (dummy) -0.18** -0.17** (0.07) (0.07) Country fixed effect Yes Yes -- Country-level variables -- -- Yes
Constant 1.22*** 1.80** 1.40 (0.26) (0.82) (0.84)
R2 0.132 0.105 0.082 Number of firms 8242 6162 6162
Individual level characteristics as in column I of Table 9 are included in all specifications. Sector fixed effects and city population fixed effects are controlled for in all specifications. The country-level variables are similar to those included in Table 9. Sampling
weight is used in the regression. ∗ Significant at 10%, ∗∗ significant at 5%, ∗∗∗ significant at 1%.
4 Conclusion
There is a growing interest among policy makers in cutting the red tape which businesses face that is related to government regulations, to help improve their performance and create more jobs. However, most businesses still face challenges, especially in the area of taxation, which is consistently identified as the key area of concern from an administrative burden viewpoint (WDR 2004). This study examines the effect of the tax administration burden on firms’ compliance costs in Africa. The study uses a firm-level indicator of compliance costs related to various government regulations, measured as an opportunity cost of staff time, from 17 SSA countries. This data has been obtained from the World Banks’ Enterprise Surveys. The results show that regulatory burdens related to tax administration significantly increase compliance costs compared to burdens related to other kinds of government regulations. The study further looks at how firms’ relationships with tax officials affect their compliance costs. While firms that are frequently inspected by tax officials have higher compliance costs, firms that are requested to pay bribes by tax officials, on the other hand, have lower compliance costs. These results, that remain robust after accounting for other firm-, sector- and country-specific factors, highlight that regulatory burdens related to taxation play a bigger role in increasing compliance costs in SSA than other forms of regulatory burdens, and that firms may look to informal ways to reduce the burden by paying bribes to tax officials. The various firm- and country-level determinants of compliance costs further reveal the following results. Firms that export their products have high compliance costs. On the other hand, firms with experienced managers have lower compliance costs. Firms operating in countries with better institutional qualities, captured by countries’ regulatory quality, are also found to have lower compliance costs. The results of this study add to the growing literature on the impact of the tax administration burden in developing countries by providing evidence on its importance to firms’ overall compliance costs compared to other forms of government regulations. Policies that aim to help the growth of the private sector in Africa by improving the overall business environment

28
should take measures that also help ease regulatory burdens associated with tax administration. Furthermore, the finding of the study that reveals that frequent inspection by tax officials not only increases overall compliance costs but also raises the likelihood of bribe requests by tax officials, suggests that countries should invest in alternative mechanisms to increase tax compliance that can help minimise direct contact with tax officials.

29
Appendix
Figure 7 Cross-country correlation between compliance costs and regulatory quality excluding South Sudan and Sudan
BDI
ZARDJI
ETH
GHA
KEN
MDG
MWI
MRT
NAM
NGA
SEN
TZA
UGA
ZMB
Correlation: -0.300
.05
.1
.15
Avera
ge m
an
ag
em
en
t tim
e s
pe
nt to
dea
l with r
egu
lation
s
-1.5 -1 -.5 0Regulatory Quality
30
Table 11 Descriptive statistics Variable Number of
observations Mean Std. Dev. Min. Max.
Dependent variable % of management time spent on government regulations
8538 9.53 18.38 0 100
Firm-specific variables Age 8538 13 9.67 0 50 Female (dummy) 8538 0.29 0.45 0 1 Small (dummy) 8538 0.69 0.46 0 1 Medium (dummy) 8538 0.23 0.42 0 1 Public (dummy) 8538 0.04 0.20 0 1 Export (dummy) 8538 0.11 0.32 0 1 Management experience (years) 8538 14 9.58 0 60 Tax administration (rank) 8462 1.59 1.26 0 4 Labour regulation (rank) 8407 0.99 1.08 0 4 License permit (rank) 8373 1.19 1.16 0 4 Customs and trade (rank) 8194 1.38 1.29 0 4 Tax inspection (dummy) 8156 0.68 0.46 0 1 Frequency of tax inspection 7914 2.39 4.38 0 60 Bribe to tax officials (dummy) 5962 0.29 0.45 0 1
Sector fixed effects Garments 8538 0.002 0.04 0 1 Food processing 8538 0.08 0.27 0 1 Metals and machinery 8538 0.03 0.18 0 1 Electronics 8538 0.005 0.07 0 1 Chemicals and pharmaceuticals 8538 0.01 0.12 0 1 Wood and furniture 8538 0.02 0.14 0 1 Non-metallic and plastic materials 8538 0.02 0.15 0 1 Auto and auto components 8538 0.004 0.06 0 1 Other manufacturing 8538 0.01 0.09 0 1 Retail and wholesale trade 8538 0.39 0.48 0 1 Construction, transportation, etc. 8538 0.07 0.26 0 1 Hotels and restaurants 8538 0.15 0.35 0 1 Other services 8538 0.18 0.38 0 1
Country-specific variables GDP per capita (current/PPP) 17 3075.78 2250.59 696.97 9985.28 Non-resource tax to GDP ratio 17 13.41 6.46 1.68 30.67 Regulatory quality 17 -0.66 0.47 -1.63 0.069 Corruption 17 -0.78 0.53 -1.61 0.23 Former British colony (dummy) 17 0.59 0.49 0 1 Time to pay tax (hours) 17 323 233.02 82 956 Number of tax payments per year 17 35.78 8.12 23 59 Post-tax filing 17 53.71 24.68 17.19 94.04

31
References Aghion, P., Blundell, R., Griffith, R., Howitt, P. and Prandtl, S. (2009) ‘The Effects of Entry on
Incumbent Innovation and Productivity’, Review of Economics and Statistics 91: 20–32 Aidis, R., Welter, F., Smallbone D. and Isakova, N. (2007) ‘Female Entrepreneurship in
Transition Economies: The Case of Lithuania and Ukraine’, Feminist Economics 2:157-183
Amin, M. (2010) ‘Gender and Firm Size: Evidence from Africa’, Economics Bulletin 30.1 Angrist, J. and Pischke, J. (2008) Mostly Harmless Econometrics: An Empiricist’s
Companion, Princeton: Princeton University Press Barseghyan, L. (2008) ‘Entry Costs and Cross-country Differences in Productivity and
Output’, Journal of Economic Growth 13: 145-167
Berthold, H. and Teixeira, A. (2011) ‘Barrier to Entry and Development’, International
Economic Review 52: 573-602 Bird, R. (2015) ‘Improving Tax Administration in Developing Countries’, Journal of Tax
Administration 1: 23-45 Caballero, R. and Hammour, M. (1996) ‘On the Timing and Efficiency of Creative
Destruction’, Quarterly Journal of Economics 111: 805–52 Coleman, S. (2007) ‘The Role of Human and Financial Capital in the Profitability and Growth
of Women-Owned Small Firms’, Journal of Small Business Management 3: 303-319 Coolidge, J. (2012) ‘Findings of Tax Compliance Cost Surveys in Developing Countries’,
eJournal of Tax Research 10: 250-258 Coolidge, J. and Ilic, D. (2009) Tax Compliance Perception and Formalization of Small
Business in South Africa, World Bank Policy Research Working Paper 4992, Washington DC: World Bank
Dabla-Norris, E., Misch, F., Cleary, D., and Khwaja, M. (2017) Tax Administration and Firm
Performance: New Data and Evidence for Emerging Market and Developing Economies, IMF working paper 17/95, Washington DC: IMF
Djankov, S. and Murrell, P. (2002) ‘Enterprise Restructuring in Transition: A Quantitative
Survey’, Journal of Economic Literature 40: 739–792 Djankov, S., Ganster, T., McLiesh, C., Famalho, R. and Shleifer, A. (2008) The Effect of
Corporate Tax on Investment and Entrepreneurship, NBER Working Paper 13756, Cambridge, MA: National Bureau of Economic Research
Djankov, S., La Porta, R, Lepez-de-Silanes, F and Shleifer, A. (2002) ‘The Regulation of
Entry’, The Quarterly Journal of Economics 117: 1–37 Djankov, S., La Porta, R., Lepez-de-Silanes, F. and Shleifer, A. (2003) ‘Courts’, Quarterly
Journal of Economics 118: 453–517

32
Dutz, M., Kessides, I., O’Connell, S. and Willig, R. (2011) Competition and Innovation-Driven Inclusive Growth, Policy Research Working Paper 5852, Washington DC: World Bank
Eichfelder, S., and Vaillancourt, F. (2014) Tax Compliance Costs: A Review of Cost Burdens
and Cost Structures, arqus Discussion Papers in Quantitative Tax Research, No 178, Berlin: arqus
Evans, C. (2008) ‘Taxation Compliance and Administrative Costs: An Overview’, in Lang, M.,
Obermair, C., Schuch, J., Staringer, C. and Weninger, P. (eds), Tax Compliance Costs for Companies in an Enlarged European Community, London: Kluwer Law International and Vienna: Linde Verlag
Fisman, R. (2001) ‘Estimating the Value of Political Connections’, American Economic
Review 91: 1095–1102 Fisman, R. and Svensson, J. (2007) ‘Are Corruption and Taxation Harmful to Growth? Firm
Level Evidence’, Journal of Development Economics 83: 63–75 Freund, C. and Rocha, N. (2011) What Constrains Africa’s Exports? World Bank Policy
Research Working Paper 5184, Washington DC; World Bank Haufler, A., Norbäck, P. and Persson, L. (2014) ‘Entrepreneurial Innovations and Taxation’,
Journal of Public Economics 113: 13-31 Jalilian, H., Kirkpatrick, C. and Parket, D. (2007) ‘The Impact of Regulation on Economic
Growth in Developing Countries: A Cross-Country Analysis’, World Development 35: 87-103
Johannes, B., Clemens, F. and Nadin, R. (2012) ‘Corporate Tax Effects on the Quality and
Quantity of FDI’, European Economic Review 56: 1495-1511 Loayza, N., and Servén, L. (2010) Business Regulation and Economic Performance,
Washington DC: World Bank La Porta, R., Lopez-de-Silanes, F., Pop-Eleches, C. and Shleifer, A. (2004) ‘Judicial Checks
and Balances’, Journal of Political Economy 112: 445–70 La Porta, R., Lopez-de-Silanes, F. and Shleifer, A. (2008) ‘The Economic Consequences of
Legal Origins’, Journal of Economic Literature 46: 285–332 Méon, P.-G. and Weill, L. (2010) ‘Is Corruption an Efficient Grease?’ World Development 38:
244-259 Nam, W. and Radulescu, D. (2007) ‘Effects of Corporate Tax Reforms on SMEs’ Investment
Decisions under the Particular Consideration of Inflation’, Small Business Economics 29: 101-118
Portugal-Perez, A. and Wilson, J. (2012) ‘Export Performance and Trade Facilitation Reform:
Hard and Soft Infrastructure’, World Development 40: 1295-1307 Roper, S. and Love, J. (2002) ‘Innovation and Export Performance: Evidence from the UK
and German Manufacturing Plants’, Research Policy 31: 1087-1102

33
Sandford, C. (1995) ‘The Rise and Rise of Tax Compliance Costs’, in C. Sandford (ed), Tax Compliance Costs Measurement and Policy, Bath, U.K: Fiscal Publications in association with the Institute for Fiscal Studies
SBP (2008) Cutting the Costs of Red Tape for Business Growth in Rwanda, Johannesburg,
South Africa: SBP Shapiro, C. and Willig, R. D. (1990) ‘Economic Rationales for the Scope of Privatization’, in
E. N. Suleiman and J. Waterbury (eds), The Political Economy of Public Sector Reform and Privatization, Boulder, CO: Westview Press, also reprinted in D. Parker (ed) (2001) Privatisation and Corporate Performance, Cheltenham: Edward Elgar
Shleifer, A. and Vishny, R.W. (1993) ‘Corruption’, Quarterly Journal of Economics 108: 599–
617 Thiessen, U. (2003) ‘The Impact of Fiscal Policy and Deregulation on Shadow Economies in
Transition Countries: The Case of Ukraine’, Public Choice 114: 295–318 World Bank (2004) World Development Report (WDR) 2005: A Better Investment Climate for
Everyone, Washington DC: World Bank