WORKING PAPER 2016-03 - repec.umb.edurepec.umb.edu/RePEc/files/2016_03.pdf · Is Home Sharing...
36
Is Home Sharing Driving up Rents? Evidence from Airbnb in Boston Mark Merante and Keren Mertens Horn __________________________ WORKING PAPER 2016-03 ________________________________ DEPARTMENT OF ECONOMICS UNIVERSITY OF MASSACHUSETTS BOSTON ________________________________
Transcript of WORKING PAPER 2016-03 - repec.umb.edurepec.umb.edu/RePEc/files/2016_03.pdf · Is Home Sharing...

Is Home Sharing Driving up Rents? Evidence from Airbnb in Boston Mark Merante and Keren Mertens Horn __________________________WORKING PAPER 2016-03
________________________________
DEPARTMENT OF ECONOMICS
UNIVERSITY OF MASSACHUSETTS BOSTON ________________________________
1
Is Home Sharing Driving Up Rents?
Evidence from Airbnb in Boston
Mark Merante
UMass Boston, MA Economics 2016
Keren Mertens Horn
UMass Boston, Assistant Professor of Economics
Introduction
The growth of the sharing economy has received increasing attention from economists.
Some researchers have examined how these new business models shape market
mechanisms (Einav, Farronato and Levin, 2015) and, in the case of home sharing,
economists have begun to examine how the sharing economy affects the hotel industry
(Zervas, Proserpio and Byers, 2016). However, economists have not yet empirically
tested whether home sharing affects the housing market, despite the obvious overlap
between these two markets. As a result, policy makers grappling with the effects of the
rapid growth of home sharing have inadequate information on which to make reasoned
policy decisions. In this paper, we add to the small but growing body of knowledge on
how the sharing economy is shaping the housing market by focusing on how the growth
of Airbnb in Boston neighborhoods affects the rental market.1 We examine whether the
increasing presence of Airbnb raises asking rents and, then, examine whether the change
in rents may be driven by a decline in the supply of housing offered for rent.
1We distinguish the “rental housing market,” housing occupied by or offered for rent only for more than 30 consecutive days, from the “home sharing market,” housing offered for rent for as little as one day.

2
Supporters of Airbnb argue that home sharing allows residents to earn extra income,
enabling some to continue to live in rapidly appreciating housing markets and defray
other costs of living.2 Critics of Airbnb claim that in large cities where the majority of
residents are renters, home sharing is increasing rents for tenants.3 In a recent curated
debate on this issue hosted by the New York Times, Nicole Gelinas of the Manhattan
Institute argues that once landlords become aware that tenants use Airbnb to earn
additional income they can quickly ‘cut out the middleman’ and directly rent out units on
a short term basis.4 Both sides of the argument are lacking unbiased empirical evidence
on this new market phenomenon, a gap that we propose to fill.
This paper makes three primary contributions to the existing economic literature. First,
we provide the first rigorous empirical investigation of how Airbnb is affecting the rental
market, focusing on Boston, a city where rents have been growing recently at an average
of 5% annually and are among the highest in the nation.5 Second, we conduct this
investigation by combining two new sources of big data: weekly rental listings, available
only recently as a result of the shift of rental listings to the internet, and data on Airbnb
listings made available through web scraping technology. Third, we take advantage of
the frequency of the observations available from these large data sets to use a fixed
2https://www.airbnbaction.com/wp-content/uploads/2015/10/Middle-Class-Economic-Report-FINAL.pdf3 “San Francisco is ground zero for an Airbnb freakout,” Davey Alba, Wired.com, November 2, 2015 4http://www.nytimes.com/roomfordebate/2015/06/16/san-francisco-and-new-york-weigh-airbnbs-effect-on-rent/airbnb-is-a-problem-for-cities-like-new-york-and-san-francisco5http://www.bostonmagazine.com/property/article/2016/02/21/boston-expensive/
3
effects model to control for unobserved variables allowing for the calculation of precise
estimates of the impacts of Airbnb on rents.
The characteristics of Airbnb listings in Boston provide some evidence supporting both
sides of the Airbnb debate. For instance, our analysis shows that in Boston on October 5,
2015, 82% of hosts had only one simultaneous listing on Airbnb, suggesting that most
Airbnb hosts are occupants seeking extra income by occasionally renting out their own
homes. On the other hand, though only 18% of hosts had multiple properties listed
simultaneously, their properties represented almost half of those listed on Airbnb (46%),
suggesting that a large proportion of Airbnb’s properties in Boston are leased by
commercial operators listing properties that would, presumably, otherwise be occupied
by residents. Ultimately, our analysis supports the contention that home sharing is
increasing rents by decreasing the supply of units available to potential residents. Using
a hedonic estimation, we show that a one standard deviation increase in Airbnb listings
relative to the total number of housing units in a census tract, at the mean 12 Airbnb
listings per tract, is associated with an increase in asking rents of 0.4%. For those census
tracts in the highest decile of Airbnb listings relative to total housing units, this increase
in asking rents ranges from 1.3% to 3.1%, which equates at the citywide mean monthly
asking rent to an increase of as much as $93. If Airbnb’s growth rate in 2015, 24%,
continues for the next three years, assuming constant mean rents and total number of
housing units, Boston’s mean asking rents in January 2019 would be as much as
$178/month higher than in the absence of Airbnb activity. We further find evidence that
Airbnb is increasing asking rents through its suppression of the supply of rental units

4
offered for rent. Specifically, a one standard deviation increase in Airbnb listings relative
to total housing units is correlated with a 5.9% decrease in the number of rental units
offered for rent. At the mean number of rental units offered for rent in a given census
tract, 75.8, this equates to 4 fewer units offered for rent.
This paper proceeds as follows. The following section provides background on home
sharing and reviews the relevant economic literature on rental markets to provide a
theoretical basis for this paper’s model and method. We then discuss theoretical models
that illustrate home sharing’s potential effect on the rental housing supply and on asking
rents. Next we describe the method we use to estimate these effects on rental housing
supply and rents. In the following section we present the data on Airbnb in Boston and
provide descriptive statistics of our rental housing data. We then present results. Finally,
we conclude and provide thoughts on some of the policy implications of this research.
Background and Literature Review
The internet has enabled the creation of what has become known as the sharing economy,
a host of firms based on the peer-to-peer business model (Einav, Farronato and Levin,
2015). This model is one form of a two-sided market, a term coined to describe
businesses which provide a platform to connect market participants. Unlike some two-
sided markets, such as credit card companies, sharing economy platforms are intended for
nonprofessional users (Li, Moreno and Zhang, 2015). One of the most visible
components of the sharing economy in the popular press is home sharing, web-based
firms that provide a platform that charges both those seeking to lease and those seeking to
5
rent housing for periods as short as one night.
Founded in August 2008, Airbnb.com (“Airbnb”) is the largest home sharing enterprise
in the world, having hosted more than 60 million guests to date; it currently features over
2 million properties for rent in 191 countries.6 It is growing rapidly; in New York City,
for example, the number of Airbnb listings expanded tenfold from 2010 to 2014
(Schneiderman, 2014) and increased by 24% in Boston between January 2015 and
January 2016. Airbnb markets itself to potential tenants as a way for visitors to have a
more authentic travel experience by staying with local residents and to potential landlords
as a way for local residents to earn extra income by renting out some or all of their home
when they’re not using it.7 The speed with which this and similar “home sharing”
businesses have changed consumer behavior has left researchers—as well as competitors
in the traditional hospitality industry, government regulators,8 and courts—racing to
understand its effects.9
Researchers have modeled how the existence of a sharing platform for a good changes
both the demand for and the supply of that good (Muller, 2014; Horton and Zeckhauser,
6“About us”, Airbnb.com, http://www.airbnb.com/about/about-us, last visited April 20, 2016.7 “Airbnb Launches First Global Ad Campaign in Nine Markets,” Advertising Age, http://.adage.com/article/digital/airbnb-launches-global-ad-campaign-markets/293108/, last visited April 20, 2016. 8 Pending legislation to regulate home sharing in MA include H 2618, An Act Regulating Short-Term Residential Rentals. 9 Home sharing’s legality varies between jurisdictions and relevant contractual obligations vary between buildings, and even within buildings from unit to unit (Lazarow, 2015). In Boston, some condominium documents forbid leasing units for less than a certain term, often one month, and the Greater Boston Real Estate Board’s Standard Form Apartment Lease (Fixed Term) forbids subletting. Despite these legal hurdles, both owners and tenants engage in home sharing, as evidenced by the many websites that offer advice to owners and tenants seeking permission to list on Airbnb, including Airbnb’s own site: https://www.airbnb.com/help/article/806/how-should-i-talk-to-my-neighbors--homeowners-association--or-landlord-about-airbnb.
6
2016). This body of research posits that some utility maximizing consumers who
previously chose to own the good in the absence of the sharing marketplace, will choose
instead not to own the good, but simply to rent it as needed, when given that option. On
the other hand, some consumers that had chosen not to own the good will now buy it,
given the opportunity to rent out a portion of it through the sharing marketplace. The net
effect on demand is indeterminate and dependent on participants’ utility functions for
these goods. The demand in the newly created sharing market creates its own supply, as
existing goods, either previously unutilized or utilized for other purposes, are offered into
the newly created sharing marketplace. In the case of home sharing, to the extent that
some of the housing offered in the home sharing market would have been offered instead
in the housing market, the existence of the home sharing market will affect both the
demand for and the supply of housing. Therefore, while these models of the effect of the
sharing economy on the target market do not model the specific effects of home sharing
on the housing market, they inform how home sharing might affect the demand for and
supply of housing. A visitor looking for a room for a night or two in a city she’d like to
visit may choose a home share rather than a hotel, thereby impacting the visiting city’s
hotel market. In addition, that demand for a home share may cause some owners of
housing in that location to shift units from the housing market to the home sharing
market, thereby reducing the supply of housing.
There has been little empirical research on the effect of home sharing on the housing
market. A few researchers have attempted to test this effect indirectly. Partly relying on
Airbnb data that is uniquely available for New York City as a result of a New York
7
Attorney General’s investigation, researchers looked for simple correlations between
Airbnb use and neighborhood mean rents, finding that those neighborhoods with the
highest number of Airbnb listings were often those where rents were increasing fastest.10
Municipal officials in San Francisco estimated the number of housing units that they
believed had been shifted from the housing market to the home sharing market by
calculating which market offered the best return for each unit, disregarding the non-
monetary considerations homeowners face when choosing between the two markets, such
as personal convenience, risk of damage, legal risks, etc.11 This analysis found a rough
correlation between neighborhoods with high Airbnb use and those with tight housing
markets. We hope to contribute to the literature by directly estimating the effect of home
sharing listings on nearby rents.
Though there is little empirical research on the home sharing market, there is a broad
literature in real estate and urban economics examining determinants of housing price,
both purchase prices (Glaeser, Gyourko and Saks, 2005; Quigley, J. M., & Rosenthal, L.
A. (2005); Ihlanfeldt, 2007) and rents (Pagliari, Webb and Lieblich, 1996; Ambrose,
Coulson and Yoshida, 2015; Verbrugge, Dorfman, Johnson, Marsh, Poole and
Shoemaker, 2016). Researchers typically use hedonic regressions to compare the
predictive effect on rents of a variety of unit characteristics, from location to unit age.
They have found evidence that though the ownership and rental markets are connected
(Kashiwagi, 2014), home values adjust slowly to changes in market conditions (Riddel,
10 “Airbnb in NYC Housing Report, 2015,” New York Communities for Change. Real Affordability for All, nycommunities.org. 11PolicyAnalysisReport,BudgetandLegislativeAnalyst’sOffice,BoardofSupervisors,CityandCountyofSanFrancisco,May23,2015,http://www.sfbos.org/index.aspx?page=3703.
8
2004), while rental data provide a more timely estimate of the flow price of housing
(Ambrose, Coulson and Yoshida, 2015). High quality data on rents has historically been
difficult to obtain, but with new sources of big data on rental markets it is easier to learn
about this market segment. Researchers have further improved the timeliness of this
measure of the flow price of housing by surveying only newly signed lease contracts,
rather than the traditional surveys of all existing renters (Glaeser and Gyorko, 2007).
Ambrose, Coulson and Yoshida (2015) found that movements in the widely used Bureau
of Labor Statistics’ rent index, which is based on a survey of all renters, trailed a rent
index based solely on new leases with new tenants by about one year. We build on this
approach and use asking rents, which were available at weekly intervals and with precise
geographic coordinates.
Theory
Utility maximization theory dictates that if the utility of the owner of a residential
housing unit is greater as a result of listing the unit in the home sharing market than as a
result of renting in the long-term rental market or leaving the unit unrented, the owner
will rent the property in the home sharing market (Muller, 2014).12 If so, it can be
assumed that some portion of the housing stock listed on Airbnb would otherwise have
been occupied by tenants, thereby decreasing the supply and increasing the price of the
rental housing units listed for rent. Similarly, this theory suggests that owners’ or
tenants’ expectations of being able to earn income by subletting their unit through home
12Along with rent, relative market values of these two options would take into account transaction and operating costs such as cleaning the unit, depreciation from extra use, resolving disputes, etc., as well as the fee charged by a rental broker or by the marketplace, in this case, Airbnb. We call the residential real estate a housing unit, even though some spaces listed on Airbnb are rooms, not whole units.

9
sharing13 will increase the demand for long term rental housing.14 Some owners or
tenants will obtain housing in excess of the amount that would have maximized their
utility in the absence of the home sharing market and will value units based on the units’
perceived marketability in the home sharing market.
Our hypothesis is that the existence of the home sharing market operates either through
changes in the demand for or in the supply of housing, or likely both, to decrease the
supply of rental units listed for rent and, thereby, to increase the asking rents of available
units.15 In a partial equilibrium competitive model of rental housing, either the rightward
shift of the demand curve for rental housing caused by the potential to earn income from
listing a unit with a home sharing site or the leftward shift of the supply curve for rental
housing caused by owners’ removal of some units from the rental housing market for rent
in the home sharing market increases the price of housing, ceteris paribus.
Modeling the effect of home sharing on mean residential asking rents, therefore, requires
changing one of the assumptions commonly used by housing economists to study the
effects of demand variation on price: that housing supply changes so slowly that it can be
assumed to be static when studying short-term effects (Blank and Winnick, 1953). The
emergence of the home sharing market represents a significant new source of short-term
13In the case of tenants, they would be considering either listing a portion of the unit, or listing all of the unit when they are away.14 This potential demand effect is not trivial: in New York City, for instance, Airbnb estimates that a typical host’s annual earnings from using the service is equivalent to 21% of the rent due for the unit listed (Lazarow, 2015).15 An increase in the demand for rental housing may decrease the number of rental units offered for rent by decreasing or eliminating the period a unit remains on the market. Where, as here, the number of units offered for rent is measured weekly, a shorter time on the market reduces the total multi-week count of units offered for rent.

10
housing supply variation, at least in some local markets. In fact, the velocity of the
aggregate supply variation resulting from the decision of owners to list units for home
share rather than rent may exceed that of the standard housing demand variation that
results from changes in mean income, family size, etc. In this empirical study, we do not
create a model to separately quantify the demand and supply effects of home sharing on
the rental market. Instead, we briefly review vacancy rate and search-and-matching
models of the housing market to illustrate the assumptions upon which our research is
based and to suggest how the new market mechanisms represented by home sharing
might fit into existing scholarship.
Models of the effects of changes in excess rental housing demand on mean rents, first
developed by David Blank and Louis Winnick (1953) and refined by others (Rosen and
Smith, 1983; Gabriel and Nothaft, 2001; Hagen and Hansen, 2010), argue that the
mechanism for this effect is the movement of the actual vacancy rate of rental housing
relative to the equilibrium vacancy rate. This vacancy rate model relies on the
assumption of static supply to derive the actual vacancy rate, AVR, solely from the
housing demand function:
AVRt = 1 – (dt(R, U, Y, P, Z)) S
Where demand for rental housing is a function of the price of housing per unit, R; the
user cost of homeownership, U; real income per household, Y; the general price level, P;
and demographic variables, Z, all at time t, and S is the supply of rental housing, assumed
fixed.

11
We assume instead that both supply and demand are affected by home sharing:
AVRt = 1 – (dt(R, U, Y, P, Z + θAirbnb)) (St-1 + NCt – δAirbnbt)
where θ is a proportion of Airbnb listings, reflecting the demand effects in the rental
market of changes in demand in the home sharing market; δ is the proportion of Airbnb
units offered in the home sharing market that would have been offered instead in the
rental housing market; and Airbnb is the number of units listed with Airbnb at time t.
With the addition of short-term supply variation to the model, we also believe it is
necessary to account for changes in housing supply as a result of demolition or new
construction since time t-1, represented in the model as NC.
Modeling the effect of home sharing on mean residential asking rents also requires
accounting for market imperfections, so-called search frictions. The application of search
theory, first developed by, among others, Diamond (1982), Mortensen (1982) and
Pissarides (1985), to housing provided a theoretical basis for estimating the effect of
market changes on price, which some considered insufficiently specified in the vacancy
rate model (Wheaton, 1990). Researchers have used search theory to model the
sensitivity of housing prices and sales volume to demand and/or supply conditions given
imperfect information (Head, Lloyd-Ellis and Sun, 2014), as well as to account for the
role of brokers (Yavas, 1994). Researchers have also extended this model to rental
housing (McBreen, Goffette-Nagot and Jensen, 2009). Typically, this research suggests
that market tightness, the ratio of vacant homes offered for sale/rent to those seeking to

12
buy/rent, is one of the mechanisms through which demand or supply changes affect price
(Novy-Marx, 2009). A decrease in the number of homes offered for sale/rent, relative to
the number of individuals seeking to buy/rent, for example, increases the rate of matching
for sellers/landlords and decreases the rate of matching for buyers/renters. In this way, an
increase in market tightness puts upward pressure on price. Again, we believe home
sharing increases market tightness both by decreasing the number of homes offered for
rent, as units are shifted from the rental to the home sharing market, and by increasing the
housing demanded as a result of the income opportunity offered by home sharing.
Methodology
We are interested in estimating the impacts of Airbnb on both rents and the number of
rental units available for rent, to see whether if Airbnb affects rents, might it do so by
constraining the supply of available rental units. We create a measure of Airbnb
‘density’ for each census tract in Boston, by dividing the number of Airbnb listings in a
census tract by the total number of housing units in that census tract. This approach
follows that of Susin (2002) and Sinai and Waldfogel (2005) as they examine the impacts
of public rental housing subsidies on the private rental market. In this way we are
controlling for differences between tracts in both population and the rental housing
market.
Researchers examining both housing supply and price changes have utilized many
different geographies. While some researchers looking at the effect of vacancy rates on
rents between cities rely on citywide data, those examining intracity effects often

13
compare neighborhoods, and define ‘neighborhoods’ to match available demographic,
price, vacancy or other data (Dow, 2011; Fujii, Hozumi, Iida and Tsutsumi, 2012).
Though some have argued that neighborhoods, as measured by census tracts, maybe be
too small a geography at which to measure the full market response to a supply constraint
(Glaeser and Ward, 2009; Sinai and Waldfogel, 2005) we choose to focus on the census
tract to better identify the immediate impacts of Airbnb, understanding that it may not
capture the full impact. In addition, recent researchers have found price impacts of
housing demand or supply changes at relatively small geographies such as census tracts
and have ascribed this to the now widespread use of the internet for home search
(Piazzesi, Schneider and Stroebel, 2015). They believe internet home search allows
buyers or renters to more narrowly tailor searches to desired geographies.
Research examining the effect of changes in the demand for or supply of housing on
residential rents had traditionally used a one year lag between demand/supply changes
and changes in rent (Rosen and Smith, 1983; Saiz, 2007). More recently, researchers
have examined shorter time frames, given the increased availability of rental data. For
instance, Edelstein and Tsang (2007) used quarterly data, while Hagen and Hansen
(2010) examined the effect of changes in vacancy rates on rents with a six-month lag. In
the years since that research, however, the widespread adoption of the internet by
landlords to advertise vacant apartments and by potential tenants to search for homes to
lease16 has increased match efficiency, leading to shorter times on the market (Carillo,
2008), and may have shortened the time necessary for rents to adjust to changes in
16 Piazzesi, Schneider and Stroebel (2015) cite the National Association of Realtors in stating that 90% of homebuyers reported using the internet in 2013, a figure that seems likely to hold for renters as well and has likely continued to increase since that time.

14
housing supply. For example, Kashiwagi’s (2014) recent model of U.S. housing market
dynamics assumes rents adjust substantially in the month following a change in housing
supply. With potential landlords widely determining market prices from on-line sites
which continuously add new rental listings, we will test the effect of Airbnb use on the
asking rents of units listed for rent since our last Airbnb measurement, one month on
average.
To estimate the effect of home sharing on mean asking rents we use a hedonic estimation.
Further, we include fixed effects at the census tract level to control for unobserved
neighborhood effects, such as location and demographic characteristics. We estimate the
following regression:
LnRit+1c = b1Airbnbtc + b1Bedit+1c + b2Bathi+1tc + b3Sqftit+1c + b4NCtc + b5Monthitc + uitc (1)
Where i indexes each unit, t represents the period between Airbnb measurements and c
the census tract. LnRit+1c represents the natural log of the asking rent of the unit, in the
period after the observed Airbnb listing. Airbnbtc is the Airbnb density, calculated as the
number of units listed on Airbnb divided by the total number of housing units in the
given census tract. Bedit+1c, is the listing’s number of bedrooms and Bathit+1c is the
listing’s number of bathrooms. NCitc is the number of newly constructed rental units
which received their certificate of occupancy from the City of Boston in the same time
period in which Airbnb units are measured. Monthitc represents dummy variables for
each of the time periods between Airbnb measurements.
15
To estimate whether increases in rents were driven by constraints in the supply of rental
housing, we test for a correlation between the mean weekly number of units listed for rent
in a given Airbnb measurement period and the Airbnb density measured at the end of that
period. The term of residential lease agreements in Boston generally end on the last day
of the month and, therefore, require landlords to advertise their units weeks before the
day the landlord desires to start a new tenancy. But the term of Airbnb rentals is daily,
allowing owners to list their units much closer to the day the landlords’ desire an Airbnb
customer to occupy the unit. As a result, we anticipate that a landlord’s decision to list
her unit on Airbnb rather than in the rental market will likely affect the number of units
listed for rent in the weeks leading up to listing the unit on Airbnb, not afterward.
Therefore, to estimate the effect of home sharing on the quantity of rental housing offered
for rent, we employ the following tract level fixed effects model:
LnCountRtc = b1 Airbnbtc+ b2NCtc + b5Monthtc + utc (2)
where LnCountRt-1c represents the mean weekly number of units in a census tract offered
for rent in the same time period in which we observe Airbnb listings, and all other
variables are as described above.
Our fixed effects model removes the effect of static rent differentials between census
tracts. In addition, our use of asking rents from the period immediately following each
measure of Airbnb density minimizes the risk of reverse causation that could result from
simultaneity of Airbnb listings and rents. While relative changes across census tracts in

16
the net revenue differentials between renting and Airbnb listing are assumed to affect
owners’ decisions whether to rent or list on Airbnb, and thereby affect Airbnb density,
this effect should appear in the subsequent Airbnb measure rather than the preceding
Airbnb measure.
Data
We obtained rental data from Rainmaker Insights, Inc., a service that aggregates listings
of housing for rent. These data include a weekly count of each housing unit offered for
rent in Boston from September 2015 through January 2016. The dataset includes asking
price, square footage, number of bedrooms and bathrooms, location and, in some cases,
additional unit characteristics and is obtained from over 5,000 sources including websites
that list homes for rent in the U.S. The total number of listings over the period was
265,241 (Table 1). Given the importance of including square footage in our regression,
we have limited our sample to those observations where this information was available,
which total 114,527 listings.17
To more accurately measure changes in housing supply we use data on new construction,
specifically the number of new housing units, which we obtained from the Boston
Redevelopment Authority (“BRA”). The BRA data records the date that the City of
Boston issued a certificate of occupancy18 for a new housing unit or that an existing
housing unit was deemed no longer available for occupancy as a result of construction.
17 The regression results remain substantively unchanged when run without this control variable. 18 Required prior to occupancy by Section 111.1 of the Massachusetts Building Code.

17
We use the 2010-2014 American Community Survey (ACS) to obtain the total number of
housing units per census tract.19
We obtained data on Airbnb listings in Boston from September 2014 to January 2016
using web scrapes of Airbnb.com, some that we conducted ourselves and some conducted
by InsideAirbnb.com and its researchers, who obtain and provide data to the public for
research purposes and who provided the data for the San Francisco Board of Supervisors’
2015 report. These web scrapes provided the following data: the price and the type of
real estate listed (either a room or an entire apartment/home), locational data, in the form
of longitude and latitude coordinates, and the Airbnb-assigned identification code for the
property and for the lessor. The October 2015 web scrape also provides additional details
about listings and hosts. We have limited our regressions to the web scrapes conducted
on July 7, August 22, September 25, October 3, November 31 and December 14, 2015
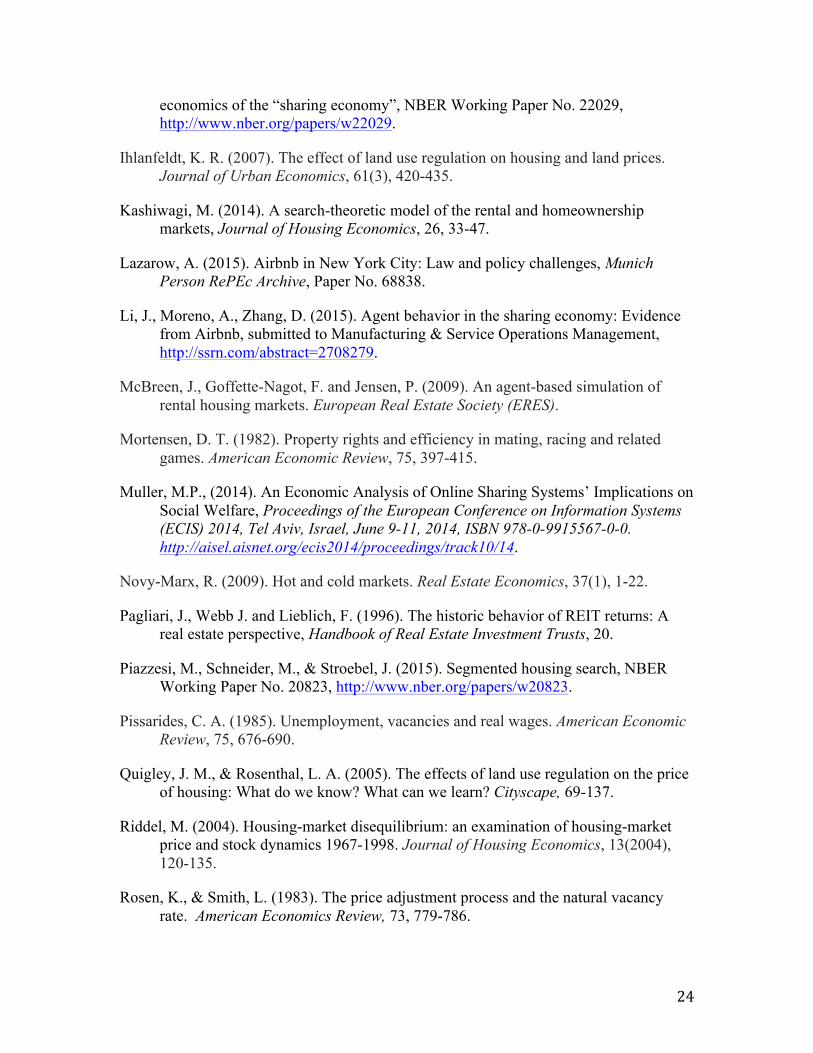
and January 21, 2016. Table 2 summarizes these data by census tract. We see that the
average tract in our sample has 1,600 housing units, 74 rental units and 12 Airbnb
listings, with an average daily asking price of $161.
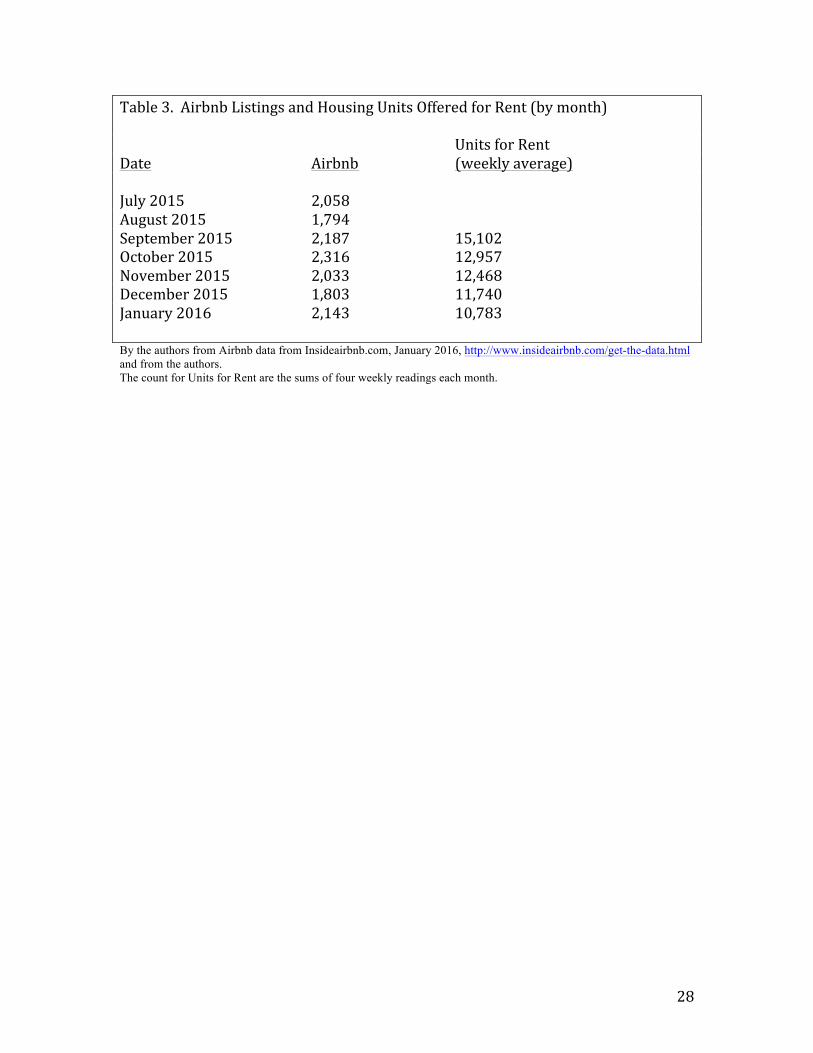
Airbnb entered the Boston market in 200920 and by the second half of 2015 it averaged
over 2,000 listings. Table 3 provides monthly totals for Airbnb listings, measured on a
single day each month, and the weekly averages of each month’s housing units offered
19 We exclude from our analysis those census tracts within the 9800 code range, which the Census Bureau uses to designate areas with little or no residential population, mostly parks or open water. U.S. Census Bureau, 2010 Census Redistricting Data (Public Law 94-171) Summary File, http://www2.census.gov/geo/pdfs/reference/GTC_10.pdf. 20 Airbnb.com. http://blog.airbnb.com/airbnbs-positive-impact-boston/?_ga=1.15, accessed on 11/9/2015.
18
for rent.21 As of January 2016, Airbnb listings were growing in Boston by 24%, year on
year. Figure 1 shows that with the exception of outer neighborhoods, such as West
Roxbury, listings were common across the city.
Airbnb listings, however, are unevenly distributed across census tracts, both in absolute
terms and as measured in relation to total rental units.22 To illustrate this point, we
present Airbnb density by decile in Table 4. We measure Airbnb density by dividing the
number of Airbnb units listed by the total number of housing units in the tract. Across
Boston, Airbnb listings by census tract ranged from zero listings to a maximum of 5% of
all housing units.
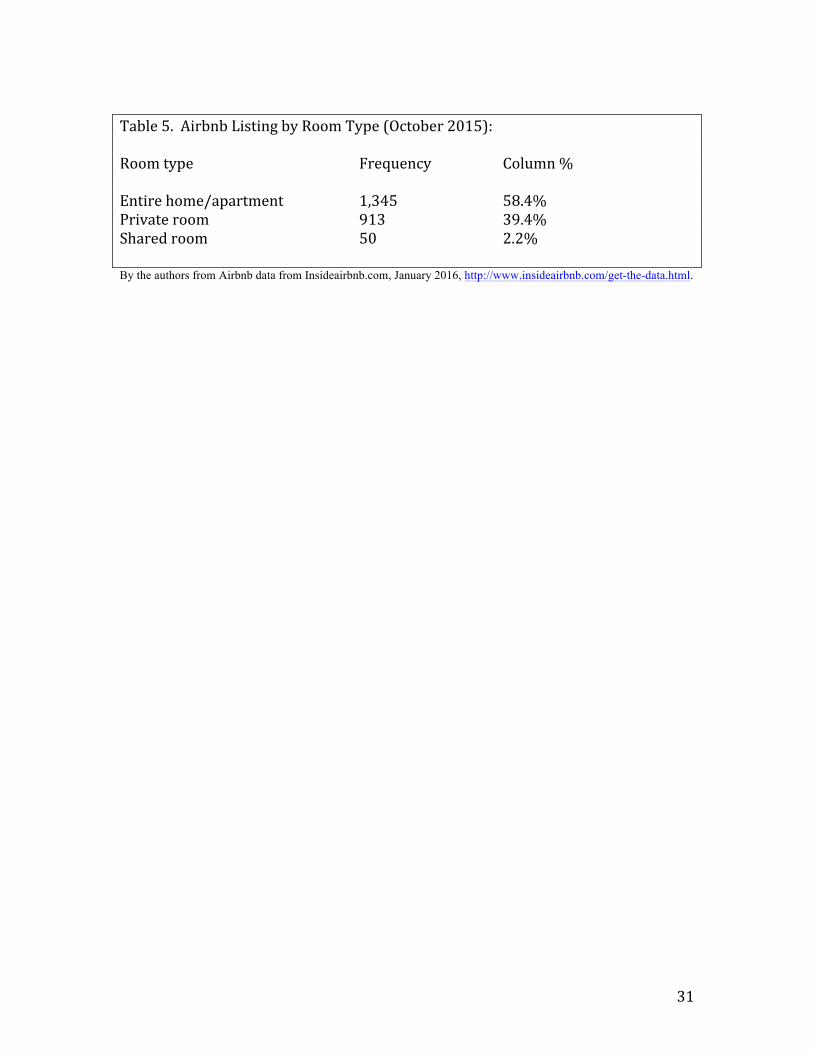
Using the more detailed October 2015 data, Tables 5-7 describe the units and hosts for
Airbnb listings in Boston, averaged across neighborhoods. Table 5 shows that most
(58%) of the units listed on Airbnb in Boston that month offered the entire home for rent,
either free standing house, apartment or condominium, while 39% offered a private room
in a home and a mere 2% offered shared space, such as sleeping on a fold out couch in a
living room. Even partial unit listings have some potential to impact the City’s rental
market, as a fraction of a unit might have been occupied by a tenant (an additional
roommate) had it not been switched to the home sharing market.
21 We present weekly averages as November includes 5 weeks, whereas all other months include only 4 weeks. 22 Because the number of total rental units is surveyed between 2010 and 2014, a period of some renewed growth of residential housing in Boston after the 2008 recession, these ratios may be slightly overstated.
19
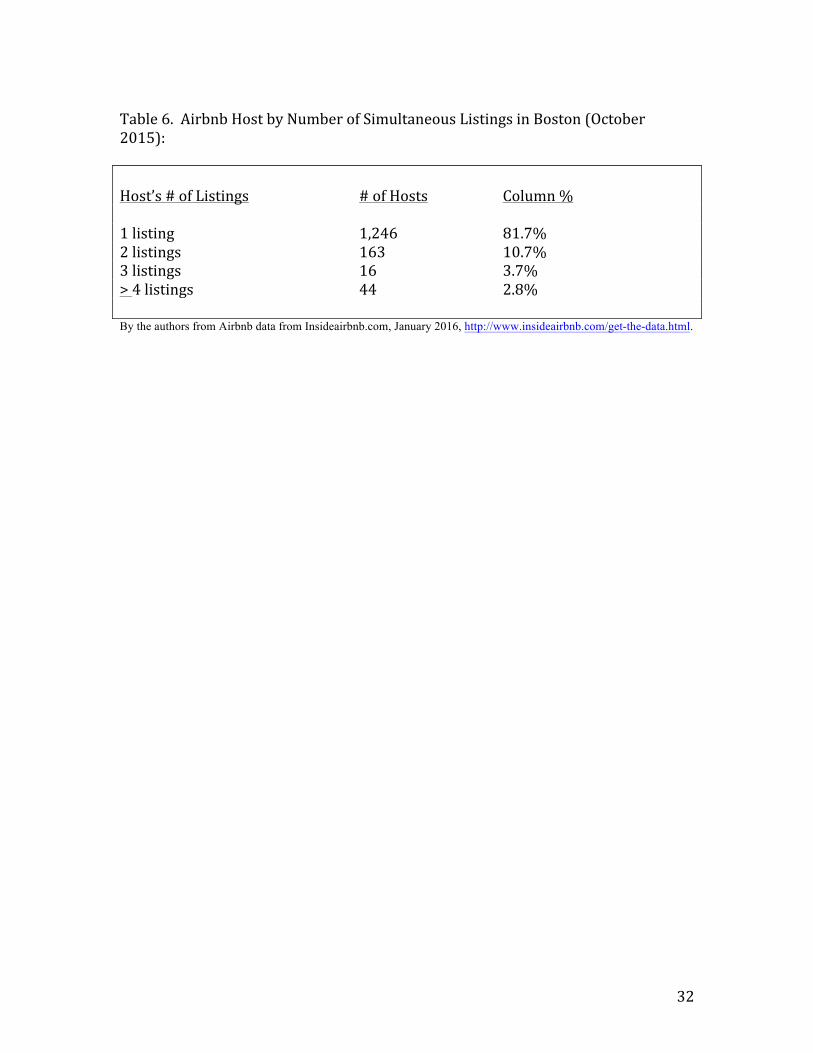
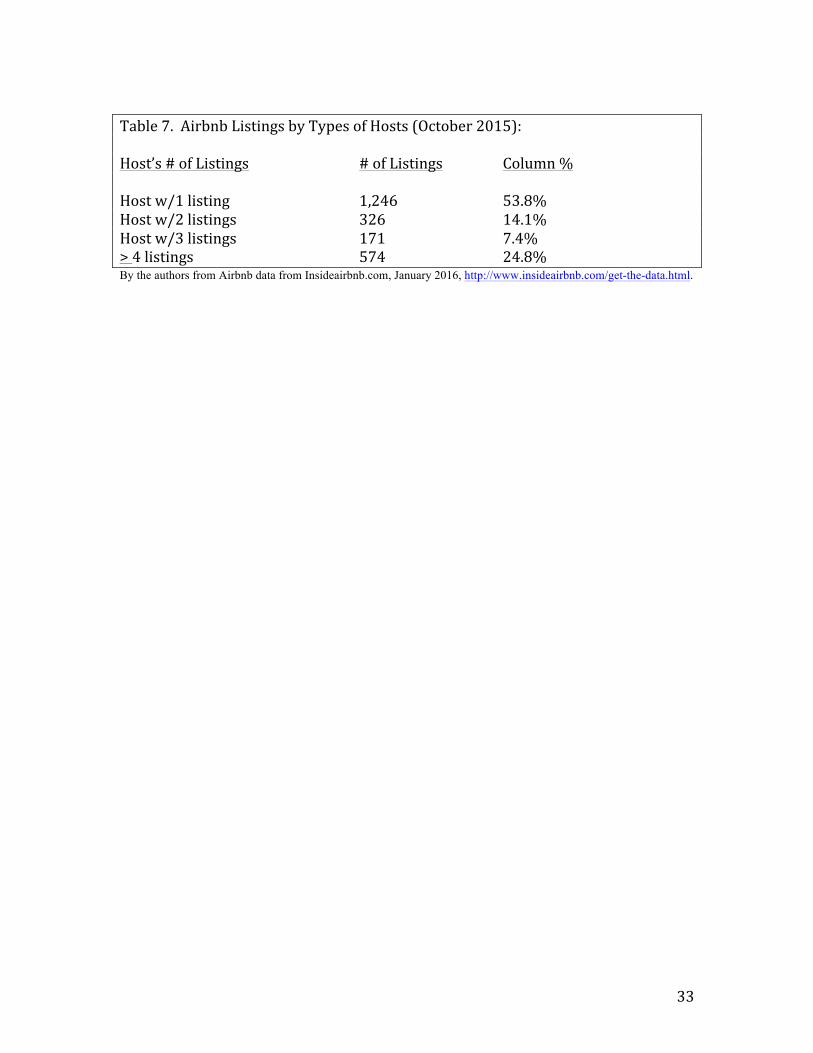
One of the most contentious points in the debate over home sharing’s effect on housing
has been whether these companies merely offer residents a chance to earn extra income
by renting out all or a portion of their home that they would not otherwise rent to
residential tenants or whether they offer residents a chance to earn more money than they
would by leasing to residential tenants, thereby reducing the supply of rental housing.
Table 6 shows that in Boston in October 2015, almost 82% of Airbnb hosts had only a
single listing and a mere 3% of hosts had four or more listings. On the other hand, Table
7 shows that non-resident owners, some would call them commercial hosts, though they
comprise a small share of all hosts listed nearly half, 46%, of all the units listed for rent
on Airbnb. While the data cannot prove the point, it seems likely that a host with two
homes for rent on Airbnb in the same city is listing at least some space which would
otherwise be rented to residential tenants.
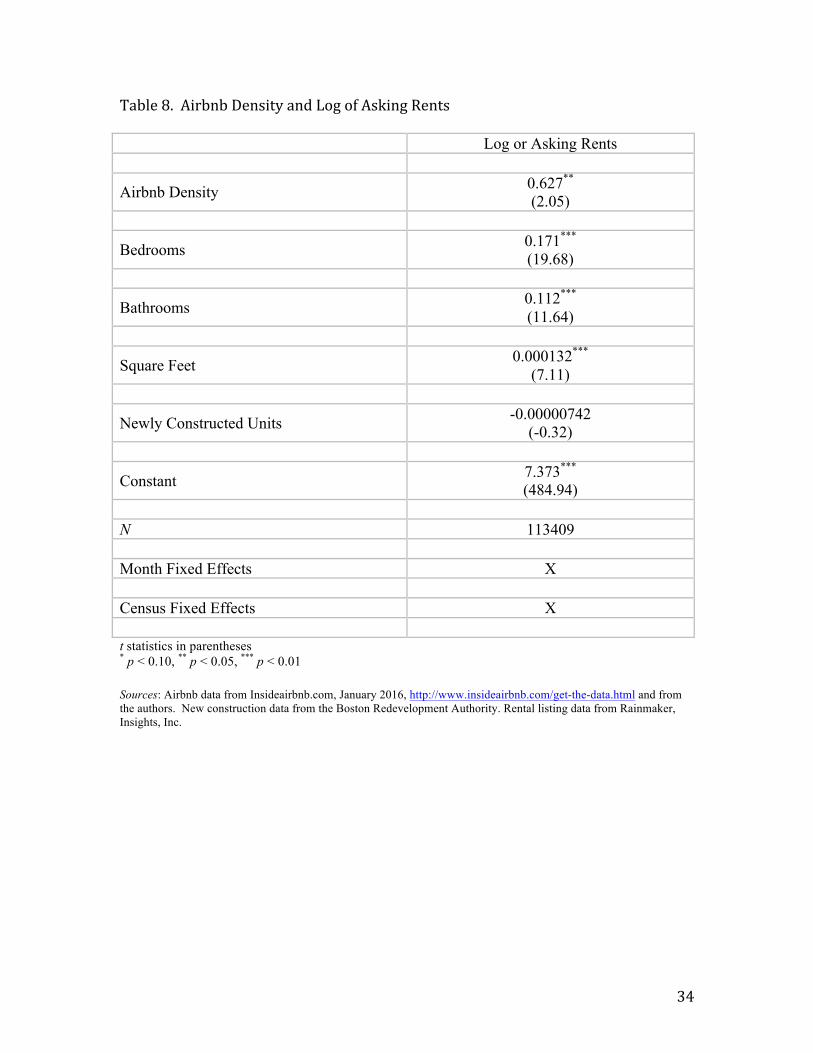
Results
We begin by presenting results for equation (1), estimating the impacts of Airbnb density
on asking rents, in Table 8. Using the natural log of rental prices, we find that a one
standard deviation increase in Airbnb density in a given census tract is correlated with a
0.4% increase in asking rents. For those census tracts in the highest decile of Airbnb
listings relative to total housing units, this increase in asking rents ranges from 1.3% to
3.1%, which equates at the citywide mean monthly asking rent of $2,972 to an increase of
as much as $93 in mean monthly asking rent. As expected, unit characteristics have large
effects on asking rents, with each additional bedroom increasing asking rents by 17% and
each additional bathroom increasing asking rents by 11%. We include both time and
20
tract fixed effects, in order to control for any time trends or tract level unobservable
characteristics.
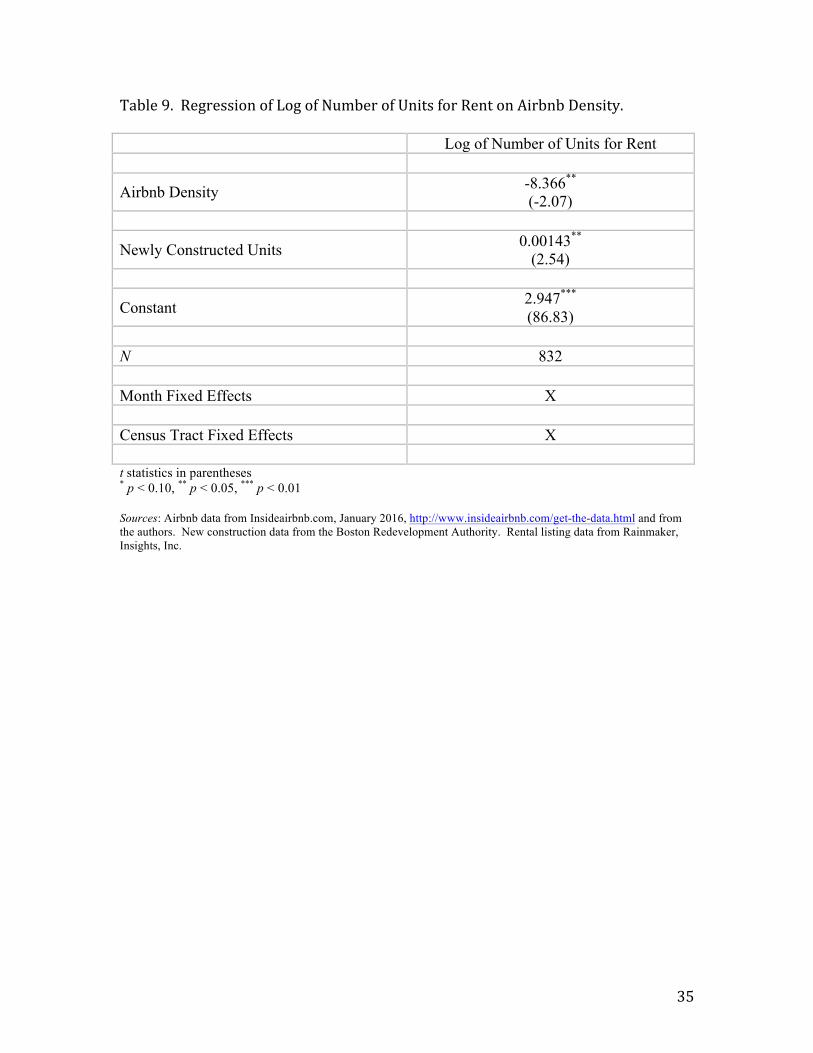
Next, we test the hypothesis that this direct correlation between Airbnb listings and
asking rents is the result of a correlation between Airbnb listings and the supply of rental
housing offered for rent. We regress Airbnb density on the natural log of the total
number of rental units offered for rent in the period since the previous Airbnb
measurement, again incorporating both time and tract fixed effects. We present results in
Table 9. We find that a one standard deviation increase in Airbnb density is correlated
with a 5.9% decrease in the number of rental units offered for rent. At the mean weekly
number of units offered for rent per census tract, this represents a reduction of 4.3 units.
This matches the reduction in rental units caused by Airbnb use that our breakdown of
Airbnb units predicts. There, we found that 46.3% of the units on Airbnb are listed by
owners with more than one unit listed for rent on Airbnb in Boston at the same time. If
every one of those units would have been offered for rent in the absence of Airbnb, this
would predict a mean reduction of 5.4 units.
These results confirm the correlations between Airbnb use and long-term housing supply
suggested by the New York23 and San Francisco24 reports. They also show a correlation
between Airbnb use and asking rents and, for the first time, quantify this price effect. In
general, Airbnb use in Boston is smaller than that in New York and San Francisco, in
23“Airbnb in NYC Housing Report, 2015,” New York Communities for Change. Real Affordability for All, nycommunities.org.24 Policy Analysis Report, Budget and Legislative Analyst’s Office, Board of Supervisors, City and County of San Francisco, May 23, 2015.
21
both absolute terms and relative to each city’s total housing supply. For example, in New
York City, researchers found that the number of Airbnb listings in four of that city’s zip
codes exceeded 20% of the total number of housing units. In Boston, no census tract had
Airbnb listings greater than 5% of that tract’s total housing units. Given the more limited
use of Airbnb in Boston, therefore, our results likely present a lower bound on the
impacts of Airbnb on local rental markets for cities like San Francisco and New York
where Airbnb use is greater as a share of total housing supply.
Conclusions
This paper makes three contributions to the existing literature. First, it provides one of
the first rigorous empirical explorations of an interesting new feature of the housing
market, home sharing. Second, it relies on a novel use of two forms of big data to
examine the impacts of home sharing on the rental housing market, weekly rental listings
and Airbnb listings. Third, it relies on the short time frames that are possible when using
new sources of big data to use a fixed effect model to identify casual links between
Airbnb use and the rental housing market.
We have found that almost half of the units listed on Airbnb in Boston are offered by
those with more than one simultaneous listing in the city. In addition, we have a direct
correlation between Airbnb density and the price of such housing. If Airbnb growth
persists at current growth rates, use will double in Boston in a little more than three years.
In a city where the demand for rental housing is outpacing supply and pushing up rents
22
quickly, home sharing is contributing to this dynamic and deserves both further research
and policy attention.
As policy makers consider whether and how to respond to the rapid rise of home sharing,
these findings provide evidence that home sharing is both a personal and a commercial
enterprise and should be regulated and taxed as such. Several jurisdictions have recently
adopted or considered legislation that seeks to differentiate between these categories of
home sharing customers in order to regulate and/or tax commercial users. For cities
particularly concerned about the availability and/or price of residential housing, these
results will strengthen the arguments for using such regulation and/or taxation, or
alternative methods, to limit home sharing activity in certain neighborhoods. On the
other hand, these results emphasize the need for both further theoretical and empirical
analysis of the social welfare implications of home sharing, such as whether Airbnb
enables middle income families to remain in their homes in rapidly appreciating housing
markets.
23
References
Ambrose, B. W., Coulson, N. E., & Yoshida, J. (2015). The repeat rent index. Review of Economics and Statistics, 97(5), 939-950.
Blank, D. M. and Winnick, L. (1953). The structure of the housing market, The Quarterly Journal of Economics, 67(2), 181-208.
Carillo, P. E. (2008). Information and real estate transactions: the effects of pictures and virtual tours on home sales. George Washington University Working Paper.
Diamond, P. A. (1982). Wage determination and efficiency in search equilibria. Review of Economic Studies, 49, 217-227.
Dow Jr, J. P. (2011). Neighborhood factors affecting apartment vacancy rates in Los Angeles. Southwestern Economic Review, 32, 35-44.
Edelstein, R. H., & Tsang, D. (2007). Dynamic residential housing cycles analysis. Journal of Real Estate Finance and Economics, 35(3), 295-313.
Einav, L., Farronato, C. & Levin, J. (2015). Peer-to-peer markets, NBER Working Paper No. 21496, http://www.nber.org/papers/w21496.
Fujii, K., Hozumi, Y., Iida, T., & Tsutsumi, M. (2012). Analysis by “Madori” of Tokyo’s 23 wards rental apartment market. In AsRES & AREUEA Joint International Conference.
Glaeser, E. L. and Gyourko, J. (2007). Arbitrage in housing markets, NBER Working Paper No. 13704, http://www.nber.org/papers/w13704.
Glaeser, E. L., Gyourko, J., & Saks, R. (2005). Why have housing prices gone up? NBER Working Paper No. 11129, http://www.nber.org/papers/w11129.
Gabriel, S. A., & Nothaft, F. E. (2001). Rental housing markets, the incidence and duration of vacancy, and the natural vacancy rate. Journal of Urban Economics, 49, 121-49.
Glaeser, E. L., & Ward, B. A. (2009). The causes and consequences of land use regulation: Evidence from greater Boston. Journal of Urban Economics, 65(3), 265-278.
Hagen, D. A., & Hansen, J. L. (2010). Rental housing and the natural vacancy rate. Journal of Real Estate Research, 32(4), 413-433.
Head, A., Lloyd-Ellis and Sun, H. (2014). Search, liquidity and the dynamics of house prices and construction. The American Economic Review, 104(4), 1172-1210.
Horton, J. and Zeckhauser, R. J. (2016). Owning, using and renting: Some simple
24
economics of the “sharing economy”, NBER Working Paper No. 22029, http://www.nber.org/papers/w22029.
Ihlanfeldt, K. R. (2007). The effect of land use regulation on housing and land prices. Journal of Urban Economics, 61(3), 420-435.
Kashiwagi, M. (2014). A search-theoretic model of the rental and homeownership markets, Journal of Housing Economics, 26, 33-47.
Lazarow, A. (2015). Airbnb in New York City: Law and policy challenges, Munich Person RePEc Archive, Paper No. 68838.
Li, J., Moreno, A., Zhang, D. (2015). Agent behavior in the sharing economy: Evidence from Airbnb, submitted to Manufacturing & Service Operations Management, http://ssrn.com/abstract=2708279.
McBreen, J., Goffette-Nagot, F. and Jensen, P. (2009). An agent-based simulation of rental housing markets. European Real Estate Society (ERES).
Mortensen, D. T. (1982). Property rights and efficiency in mating, racing and related games. American Economic Review, 75, 397-415.
Muller, M.P., (2014). An Economic Analysis of Online Sharing Systems’ Implications on Social Welfare, Proceedings of the European Conference on Information Systems (ECIS) 2014, Tel Aviv, Israel, June 9-11, 2014, ISBN 978-0-9915567-0-0. http://aisel.aisnet.org/ecis2014/proceedings/track10/14.
Novy-Marx, R. (2009). Hot and cold markets. Real Estate Economics, 37(1), 1-22.
Pagliari, J., Webb J. and Lieblich, F. (1996). The historic behavior of REIT returns: A real estate perspective, Handbook of Real Estate Investment Trusts, 20.
Piazzesi, M., Schneider, M., & Stroebel, J. (2015). Segmented housing search, NBER Working Paper No. 20823, http://www.nber.org/papers/w20823.
Pissarides, C. A. (1985). Unemployment, vacancies and real wages. American Economic Review, 75, 676-690.
Quigley, J. M., & Rosenthal, L. A. (2005). The effects of land use regulation on the price of housing: What do we know? What can we learn? Cityscape, 69-137.
Riddel, M. (2004). Housing-market disequilibrium: an examination of housing-market price and stock dynamics 1967-1998. Journal of Housing Economics, 13(2004), 120-135.
Rosen, K., & Smith, L. (1983). The price adjustment process and the natural vacancy rate. American Economics Review, 73, 779-786.

25
Saiz, A. (2007). Immigration and housing rents in American cities. Journal of Urban Economics, 61(2), 345-371.
Schneiderman, E. (2014). Airbnb in the city. New York State Office of the Attorney General, Oct, 14.
Sinai, T., & Waldfogel, J. (2005). Do low-income housing subsidies increase the occupied housing stock? Journal of Public Economics, 89(11-12), 2137-2164.
Susin, S. (2002). Rent vouchers and the price of low-income housing. Journal of Public Economics, 83(1), 109-152.
Verbrugge, R., Dorfman, A., Johnson, W., Marsh III, F., Poole, R., & Shoemaker, O. (2016). Determinants of rent changes: Mean reversion versus the usual suspects. Real Estate Economics. Doi: 10.1111/1540-6229.12145.
Wheaton, W. C. (1990). Vacancy, search and prices in a housing market matching model. Journal of Political Economy, 98, 1270-1292.
Yarvas, A. (1994). Middlemen in bilateral search markets. Journal of Labor Economics, 406-429.
Zervas, G., Proserpio, D., & Byers, J. (2014). The rise of the sharing economy: Estimating the impact of Airbnb on the hotel industry. Boston University School of Management Research Paper, (2013-16).

26
Table1.DescriptiveStatisticsonRentalUnits Mean Standard Deviation Count Price $2,972 $1,130 113,409 Bedrooms 1.7 1.0 113,409 Bathrooms 1.2 0.4 113,409 Square Feet 1,005 471 113,409 Source: Data from Rainmaker Insights, Inc., February 2016.
27
Table2.DescriptiveStatisticsonAirbnbandRentalUnitsbyCensusTract Mean Standard Deviation Count Total Housing Units 1,638 618 832 # of Airbnb Listings 11.7 13.5 832 Newly Constructed Units 1.4 16.4 832
# of Rental Units Listed for Rent (weekly)
75.8 100.5 832
Airbnb Density 0.007 0.007 832 Airbnb Density = # of Airbnb listings by census tract/# of housing units in that census tract. By the authors from Airbnb data from Insideairbnb.com, January 2016, http://www.insideairbnb.com/get-the-data.html and original data and from housing unit data from the United States Census Bureau/American FactFinder. B25001: Housing Units.” 2010-2014 American Community Survey. U.S. Census Bureau’s American Community Survey Office, 2015. Web. 31 January 2016. http://factfinder2.census.gov.
28
Table3.AirbnbListingsandHousingUnitsOfferedforRent(bymonth) UnitsforRentDate Airbnb (weeklyaverage) July2015 2,058 August2015 1,794 September2015 2,187 15,102October2015 2,316 12,957November2015 2,033 12,468December2015 1,803 11,740January2016 2,143 10,783 By the authors from Airbnb data from Insideairbnb.com, January 2016, http://www.insideairbnb.com/get-the-data.html and from the authors. The count for Units for Rent are the sums of four weekly readings each month.

29
Figure 1. Map of Airbnb Listings by Census Tract.
0 1.5 30.75 Miles
Ü
Airbnb Listings
by Mark Merante(9/14, 1/15, 7/15, 8/15, 9/15, 10/16, 11/15, 12/15, 1/16)
LegendAirbnb Listings
0 - 31
32 - 78
79 - 150
151 - 236
237 - 381
382 - 634Listings data from Insideairbnb.com, January2016 <http://insideairbnb.com/get-the-data.html>
City of Boston

30
Table4.AirbnbDensity(bydecile):Decile AirbnbDensity1st .0032nd .0053rd .0074th .0095th .011 6th .0147th .0168th .0189th .02110th .050Airbnb Density = # of Airbnb listings by census tract/# of housing units in that census tract. By the authors from Airbnb data from Insideairbnb.com, January 2016, http://www.insideairbnb.com/get-the-data.html and original data and from housing unit data from the United States Census Bureau/American FactFinder. B25001: Housing Units.” 2010-2014 American Community Survey. U.S. Census Bureau’s American Community Survey Office, 2015. Web. 31 January 2016. http://factfinder2.census.gov.
31
Table5.AirbnbListingbyRoomType(October2015):Roomtype Frequency Column%Entirehome/apartment 1,345 58.4%Privateroom 913 39.4%Sharedroom 50 2.2%By the authors from Airbnb data from Insideairbnb.com, January 2016, http://www.insideairbnb.com/get-the-data.html.
32
Table6.AirbnbHostbyNumberofSimultaneousListingsinBoston(October2015):Host’s#ofListings #ofHosts Column%1listing 1,246 81.7%2listings 163 10.7%3listings 16 3.7%>4listings 44 2.8%By the authors from Airbnb data from Insideairbnb.com, January 2016, http://www.insideairbnb.com/get-the-data.html.
33
Table7.AirbnbListingsbyTypesofHosts(October2015):Host’s#ofListings #ofListings Column%Hostw/1listing 1,246 53.8%Hostw/2listings 326 14.1%Hostw/3listings 171 7.4%>4listings 574 24.8%By the authors from Airbnb data from Insideairbnb.com, January 2016, http://www.insideairbnb.com/get-the-data.html.
34
Table8.AirbnbDensityandLogofAskingRents Log or Asking Rents
Airbnb Density 0.627** (2.05)
Bedrooms 0.171*** (19.68)
Bathrooms 0.112*** (11.64)
Square Feet 0.000132*** (7.11)
Newly Constructed Units -0.00000742 (-0.32)
Constant 7.373*** (484.94)
N 113409 Month Fixed Effects X Census Fixed Effects X t statistics in parentheses * p < 0.10, ** p < 0.05, *** p < 0.01 Sources: Airbnb data from Insideairbnb.com, January 2016, http://www.insideairbnb.com/get-the-data.html and from the authors. New construction data from the Boston Redevelopment Authority. Rental listing data from Rainmaker, Insights, Inc.
35
Table9.RegressionofLogofNumberofUnitsforRentonAirbnbDensity. Log of Number of Units for Rent
Airbnb Density -8.366** (-2.07)
Newly Constructed Units 0.00143** (2.54)
Constant 2.947*** (86.83)
N 832 Month Fixed Effects X Census Tract Fixed Effects X t statistics in parentheses * p < 0.10, ** p < 0.05, *** p < 0.01 Sources: Airbnb data from Insideairbnb.com, January 2016, http://www.insideairbnb.com/get-the-data.html and from the authors. New construction data from the Boston Redevelopment Authority. Rental listing data from Rainmaker, Insights, Inc.


![Jerome Mertens, hoofd der school te Grathem en Kelpen20100512] Jerome Mertens te Grathem.pdf · 2019-09-29 · Naspeuringen van Paul Theelen: Jerome Mertens [Grathem] andere kinderen](https://static.fdocuments.net/doc/165x107/5e35ecfd9953af16de4fd821/jerome-mertens-hoofd-der-school-te-grathem-en-20100512-jerome-mertens-te-grathempdf.jpg)