
WORKING FOR THE FEW - Oxfam International OXFAM BRIEFING PAPER 20 JANUARY 2014 Housing for the...
32
178 OXFAM BRIEFING PAPER 20 JANUARY 2014 www.oxfam.org Housing for the wealthier middle classes rises above the insecure housing of a slum community in Lucknow, India. Photo: Tom Pietrasik/Oxfam WORKING FOR THE FEW Political capture and economic inequality Economic inequality is rapidly increasing in the majority of countries. The wealth of the world is divided in two: almost half going to the richest one percent; the other half to the remaining 99 percent. The World Economic Forum has identified this as a major risk to human progress. Extreme economic inequality and political capture are too often interdependent. Left unchecked, political institutions become undermined and governments overwhelmingly serve the interests of economic elites to the detriment of ordinary people. Extreme inequality is not inevitable, and it can and must be reversed quickly.
Transcript of WORKING FOR THE FEW - Oxfam International OXFAM BRIEFING PAPER 20 JANUARY 2014 Housing for the...

178 OXFAM BRIEFING PAPER 20 JANUARY 2014
www.oxfam.org
Housing for the wealthier middle classes rises above the insecure housing of a slum community in Lucknow, India. Photo: Tom
Pietrasik/Oxfam
WORKING FOR THE FEW Political capture and economic inequality
Economic inequality is rapidly increasing in the majority of
countries. The wealth of the world is divided in two: almost half
going to the richest one percent; the other half to the remaining 99
percent. The World Economic Forum has identified this as a major
risk to human progress. Extreme economic inequality and political
capture are too often interdependent. Left unchecked, political
institutions become undermined and governments overwhelmingly
serve the interests of economic elites to the detriment of ordinary
people. Extreme inequality is not inevitable, and it can and must be
reversed quickly.

2
SUMMARY
In November 2013, the World Economic Forum released its ‘Outlook on
the Global Agenda 2014’, in which it ranked widening income disparities
as the second greatest worldwide risk in the coming 12 to 18 months.
Based on those surveyed, inequality is ‘impacting social stability within
countries and threatening security on a global scale.’ Oxfam shares its
analysis, and wants to see the 2014 World Economic Forum make the
commitments needed to counter the growing tide of inequality.
Some economic inequality is essential to drive growth and progress,
rewarding those with talent, hard earned skills, and the ambition to
innovate and take entrepreneurial risks. However, the extreme levels of
wealth concentration occurring today threaten to exclude hundreds of
millions of people from realizing the benefits of their talents and hard
work.
Extreme economic inequality is damaging and worrying for many
reasons: it is morally questionable; it can have negative impacts on
economic growth and poverty reduction; and it can multiply social
problems. It compounds other inequalities, such as those between
women and men. In many countries, extreme economic inequality is
worrying because of the pernicious impact that wealth concentrations can
have on equal political representation. When wealth captures
government policymaking, the rules bend to favor the rich, often to the
detriment of everyone else. The consequences include the erosion of
democratic governance, the pulling apart of social cohesion, and the
vanishing of equal opportunities for all. Unless bold political solutions are
instituted to curb the influence of wealth on politics, governments will
work for the interests of the rich, while economic and political inequalities
continue to rise. As US Supreme Court Justice Louis Brandeis famously
said, ‘We may have democracy, or we may have wealth concentrated in
the hands of the few, but we cannot have both.’
Oxfam is concerned that, left unchecked, the effects are potentially
immutable, and will lead to ‘opportunity capture’ – in which the lowest tax
rates, the best education, and the best healthcare are claimed by the
children of the rich. This creates dynamic and mutually reinforcing cycles
of advantage that are transmitted across generations.
Given the scale of rising wealth concentrations, opportunity capture and
unequal political representation are a serious and worrying trend. For
instance:
• Almost half of the world’s wealth is now owned by just one percent of
the population.
• The wealth of the one percent richest people in the world amounts to
$110 trillion. That’s 65 times the total wealth of the bottom half of the
world’s population.
• The bottom half of the world’s population owns the same as the
richest 85 people in the world.
3
• Seven out of ten people live in countries where economic inequality
has increased in the last 30 years.
• The richest one percent increased their share of income in 24 out of
26 countries for which we have data between 1980 and 2012.
• In the US, the wealthiest one percent captured 95 percent of post-
financial crisis growth since 2009, while the bottom 90 percent
became poorer.
This massive concentration of economic resources in the hands of fewer
people presents a significant threat to inclusive political and economic
systems. Instead of moving forward together, people are increasingly
separated by economic and political power, inevitably heightening social
tensions and increasing the risk of societal breakdown.
Oxfam’s polling from across the world captures the belief of many that
laws and regulations are now designed to benefit the rich. A survey in six
countries (Spain, Brazil, India, South Africa, the UK and the US) showed
that a majority of people believe that laws are skewed in favor of the rich
– in Spain eight out of 10 people agreed with this statement. Another
recent Oxfam poll of low-wage earners in the US reveals that 65 percent
believe that Congress passes laws that predominantly benefit the
wealthy.
The impact of political capture is striking. Rich and poor countries alike
are affected. Financial deregulation, skewed tax systems and rules
facilitating evasion, austerity economics, policies that disproportionately
harm women, and captured oil and mineral revenues are all examples
given in this paper. The short cases included are each intended to offer a
sense of how political capture produces ill-gotten wealth, which
perpetuates economic inequality.
This dangerous trend can be reversed. The good news is that there are
clear examples of success, both historical and current. The US and
Europe in the three decades after World War II reduced inequality while
growing prosperous. Latin America has significantly reduced inequality in
the last decade – through more progressive taxation, public services,
social protection and decent work. Central to this progress has been
popular politics that represent the majority, instead of being captured by
a tiny minority. This has benefited all, both rich and poor.
RECOMMENDATIONS
Those gathered at Davos for the World Economic Forum have the power
to turn around the rapid increase in inequality. Oxfam is calling on them
to pledge that they will:
• Not dodge taxes in their own countries or in countries where they
invest and operate, by using tax havens;
• Not use their economic wealth to seek political favors that undermine
the democratic will of their fellow citizens;
• Make public all the investments in companies and trusts for which

4
they are the ultimate beneficial owners;
• Support progressive taxation on wealth and income;
• Challenge governments to use their tax revenue to provide universal
healthcare, education and social protection for citizens;
• Demand a living wage in all the companies they own or control;
• Challenge other economic elites to join them in these pledges.
Oxfam has recommended policies in multiple contexts to strengthen the
political representation of the poor and middle classes to achieve greater
equity. These policies include:
• A global goal to end extreme economic inequality in every country.
This should be a major element of the post-2015 framework, including
consistent monitoring in every country of the share of wealth going to
the richest one percent.
• Stronger regulation of markets to promote sustainable and equitable
growth; and
• Curbing the power of the rich to influence political processes and
policies that best suit their interests.
The particular combination of policies required to reverse rising economic
inequalities should be tailored to each national context. But developing
and developed countries that have successfully reduced economic
inequality provide some suggested starting points, notably:
• Cracking down on financial secrecy and tax dodging;
• Redistributive transfers; and strengthening of social protection
schemes;
• Investment in universal access to healthcare and education;
• Progressive taxation;
• Strengthening wage floors and worker rights;
• Removing the barriers to equal rights and opportunities for women.

5
1 THE GROWING CONCENTRATION OF INCOME AND WEALTH IN A FEW HANDS
The past quarter of a century has seen wealth become ever more
concentrated in the hands of fewer people. This global phenomenon has
led to a situation where one percent of the world’s families own almost
half (46 percent) of the world’s wealth. The bottom half of the world’s
population owns less than the richest 85 people in the world.1
In the past year, 210 people have become billionaires, joining a select
group of 1,426 individuals with a combined net worth of $5.4 trillion.2
Corporate profits, chief executive officer (CEO) salaries, and stock
exchanges are breaking new records daily, with no signs of slowing
down. At the time of writing, the Dow Jones industrial average reached
the highest mark in its 117-year history.3 The wealth of the one percent
richest people in the world amounts to $110 trillion. That’s 65 times the
total wealth of the bottom half.4
This trend may seem surprising in light of the recent global financial
crisis. Yet, while the crisis caused a momentary dip in the share of global
wealth held by the rich, they have already gained it back, and more. In
the US, the wealthiest one percent captured 95 percent of post-financial
crisis growth between 2009 and 2012, while the bottom 90 percent
became poorer.5 The Great Recession did not change the trend in
concentration of income: the share of US national income going to the
top decile stands at 50.4 percent – its highest since World War I.6 Had
the share of income going to the richest one percent stayed the same as
in 1980, the rest of America would have an additional $6,000 dollars at
their disposal in 2012.7
Global elites are increasingly becoming richer. Yet the vast majority of
people around the world have been excluded from this prosperity. For
instance, while stocks and corporate profits soar to new heights, wages
as a percentage of gross domestic product (GDP) have stagnated. To
give an indication of the scale of wealth concentration, the combined
wealth of Europe’s 10 richest people exceeds the total cost of stimulus
measures implemented across the European Union (EU) between 2008
and 2010 (€217bn compared with €200bn).8 Furthermore, post-recovery
austerity policies are hitting poor people hard, while making the rich even
richer. Austerity is also having an unprecedented impact on the middle
classes.
Rich people are pulling further away from everyone else in terms of
wealth in many countries. The World Top Incomes Database covers 26
countries, with information on the share of pre-tax income going to the
richest one percent since the 1980s (see Figure 1).9 In all but two
countries (Colombia and the Netherlands), the share of income of the
richest percentile increased – and in Colombia, it stayed at around 20
percent.10 The richest one percent of people in China, Portugal, and the
Franklin Delano Roosevelt
Adam Smith

6
US have more than doubled their share of national income since 1980,
and the situation is getting worse.11 Even in more egalitarian countries
such as Sweden and Norway, the share of income going to the richest
one percent has increased by more than 50 percent (see Figure 1).
It is likely that the full concentration of wealth is in fact even worse, as a
significant amount of wealth among those at the top of the scale is
hidden away in tax havens. It is estimated that $18.5 trillion is held
unrecorded and offshore.12
Figure 1: The rich get richer
The percentage increase in share of income of the richest one percent,
1980–2012
The share of national income going to the richest one percent
Source: F. Alvaredo, A. B. Atkinson, T. Piketty and E. Saez, (2013) ‘The World Top Incomes
Database’, http://topincomes.g-mond.parisschoolofeconomics.eu/ Only includes countries with data
in 1980 and later than 2008.
0 50 100 150
Mauritius
France
Spain
Denmark
Singapore
New Zealand
Japan
Italy
Ireland
Norway
Sweden
Australia
United States
0 10 20 30
Denmark
Sweden
Mauritius
New Zealand
Norway
France
Spain
Australia
Italy
Japan
Ireland
Singapore
United States
2008-2012
1980

7
Data on the share of national income going to the richest people are
scarcely available for developing countries. However, other measures
support the argument that countries are becoming more unequal. For
instance, between 1988 and 2008, the Gini coefficient increased in 58
countries for which data are available.13 Seven out of every 10 people in
the world live in countries where inequality has increased.14
Rising levels of inequality are also an important feature of populous
middle-income countries. These countries matter because they are
where most of the world’s poor now live. Prior to globalization, these
were low-income countries with significantly lower levels of inequality.
Economic growth, however, has graduated them into middle-income
status and has driven a wedge between the haves and have-nots.
RISING LEVELS OF INEQUALITY IN FIVE MIDDLE-INCOME COUNTRIES
Figure 2 shows the extent to which inequalities are increasing. They
show that in Indonesia, China, India, Pakistan and Nigeria – all lower
middle-income countries except for China, which is now classed as upper
middle-income – the richest 10 percent of the population have acquired a
much greater share of national income than the poorest 40 percent over
the past 30 years, with the trend set to continue.
Figure 2: Increasing inequality in selected middle-income countries
10
15
20
25
30
35
40
1981 1987 1993 1999 2005 2010
Indonesia
Income share held by highest 10%
Income share held by lowest 40%
10
15
20
25
30
35
40
1981 1987 1993 1999 2005 2011
China
Income share held by highest 10%
Income share held by lowest 40%

8
Source: World Bank (2013) Poverty and Inequality Database
10
15
20
25
30
35
40
1981 1994 2005 2010 2011
India
Income share held by highest 10%
Income share held by lowest 40%
10
15
20
25
30
35
40
1981 2002 2005 2006 2011
Pakistan
Income share held by highest 10%
Income share held by lowest 40%
10
15
20
25
30
35
40
1981 2004 2010 2011
Nigeria
Income share held by highest 10%
Income share held by lowest 40%

9
We also now have credible estimates of the distribution of wealth (as
opposed to income) within countries. According to Credit Suisse, 10
percent of the global population holds 86 percent of all the assets in the
world,15 while the poorest 70 percent (more than 3 billion adults) hold just
3 percent. By some measure, the riches of billionaires are now
unparalleled in history. The Mexican Carlos Slim, owner of large
monopolies in Mexico and elsewhere, could pay the yearly wages of
440,000 Mexicans with income derived from his wealth.16
Table 1: The concentration of global wealth
Wealth (USD)
Percentage of
the world's
population
Number of
adults
(millions)
Percentage of
world's wealth
Total wealth
(trillions of
dollars)
<10,000 68.7 3,207 3.0 7
10,000–100,000 22.9 1,066 13.7 33
100,000–1 million 7.7 361 42.3 102
> 1 million 0.7 32 41.0 99
Source: ‘Global Wealth Report 2013’. Zurich: Credit Suisse
Some countries are managing to buck this global trend though. In Latin
America, countries have achieved declining inequality during the past
decade. However, these improvements must be tempered, as they are
taking place in some of the most unequal countries in the world.The rate
and depth at which inequality is declining also varies, and it is too soon to
suggest a real trend.
Among the G20 countries, emerging economies were usually those with
higher levels of inequality (including South Africa, Brazil, Mexico, Russia,
Argentina, China, and Turkey) whereas developed countries tended to
have lower levels of inequality (France, Germany, Canada, Italy, and
Australia). Yet even this is changing, and now high-income G20
countries (except South Korea) are experiencing rising inequality, while
Brazil, Mexico, and Argentina are seeing levels of inequality decline.
PEOPLE ARE CONCERNED ABOUT INEQUALITY
Discussions around inequality and the concentration of income and
wealth are now at the center of global policy debates. But this was not
always the case. Only a few years ago, Anne Krueger, then First Deputy
Managing Director of the International Monetary Fund (IMF), said,17 ‘Poor
people are desperate to improve their material conditions in absolute
terms rather than to march up the income distribution. Hence it seems far
better to focus on impoverishment than on inequality.’
That view is no longer in fashion, so what changed the debate? The facts
described in the previous section are partly responsible. They run
counter to the consensus that shared prosperity and inclusive growth
should be a high order goal. Instead, economic growth looks more like a
winner-takes-all system. Recent findings also suggest that chronic
10
inequality stunts long-term economic growth,18 and makes it more difficult
to reduce poverty.19
New research substantiating the rise of inequality is affecting global
public opinion. Global polling by the Pew Research Center Global
Attitudes Project suggests that people in all regions of the world are
concerned about rising inequality.20 In November, the World Economic
Forum released its ‘Outlook on the Global Agenda 2014’ report, in which
1,592 global elites ranked widening income disparities as the second
greatest worldwide risk in the coming 12 to 18 months. 21
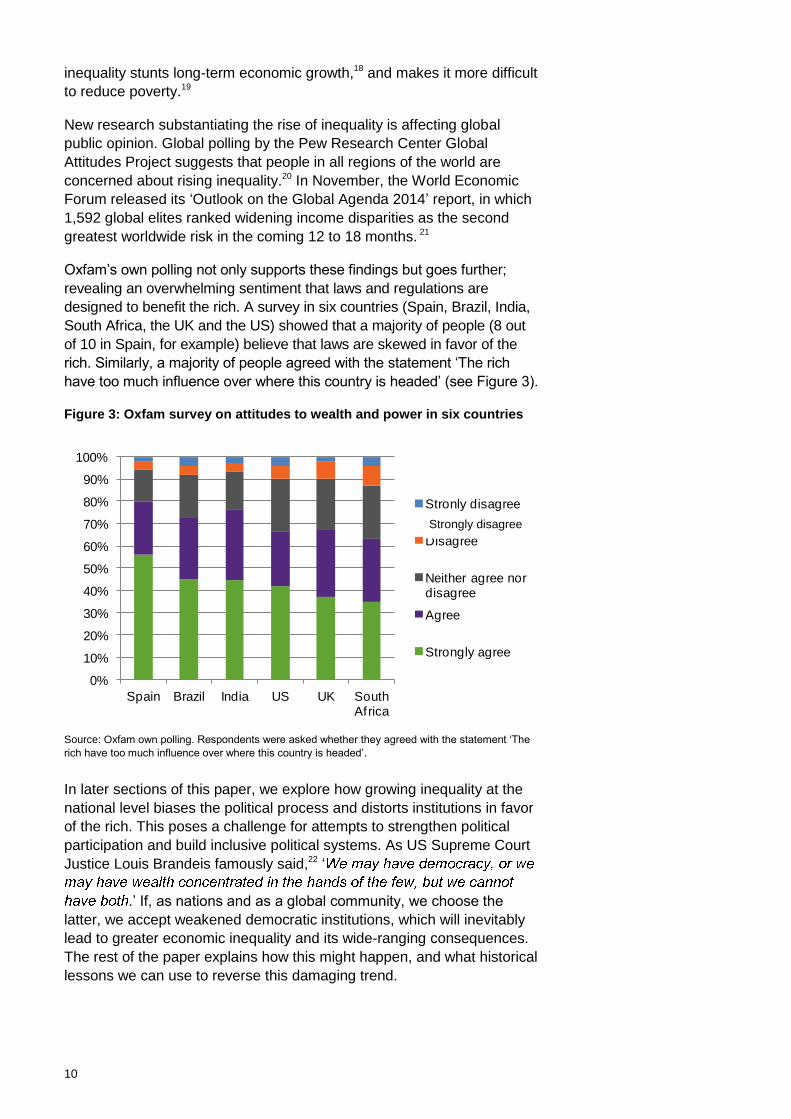
Oxfam’s own polling not only supports these findings but goes further;
revealing an overwhelming sentiment that laws and regulations are
designed to benefit the rich. A survey in six countries (Spain, Brazil, India,
South Africa, the UK and the US) showed that a majority of people (8 out
of 10 in Spain, for example) believe that laws are skewed in favor of the
rich. Similarly, a majority of people agreed with the statement ‘The rich
have too much influence over where this country is headed’ (see Figure 3).
Figure 3: Oxfam survey on attitudes to wealth and power in six countries
Source: Oxfam own polling. Respondents were asked whether they agreed with the statement ‘The
rich have too much influence over where this country is headed’.
In later sections of this paper, we explore how growing inequality at the
national level biases the political process and distorts institutions in favor
of the rich. This poses a challenge for attempts to strengthen political
participation and build inclusive political systems. As US Supreme Court
Justice Louis Brandeis famously said,22 ‘
.’ If, as nations and as a global community, we choose the
latter, we accept weakened democratic institutions, which will inevitably
lead to greater economic inequality and its wide-ranging consequences.
The rest of the paper explains how this might happen, and what historical
lessons we can use to reverse this damaging trend.
0%
10%
20%
30%
40%
50%
60%
70%
80%
90%
100%
Spain Brazil India US UK South Africa
Stronly disagree
Disagree
Neither agree nor disagree
Agree
Strongly agree
Strongly disagree

11
2 RIGGING THE SYSTEM IN FAVOR OF THE FEW
Markets are not autonomous, spontaneous phenomena operating
according to their own natural laws. In reality, markets are social
constructions whose rules are set by institutions and regulated by
governments that should be accountable to the participants and citizens.
When there is growth and diminishing inequality, the rules governing
markets are working of the middle classes and the poorest
sections of society. However, when only the rich are gaining, the rules
start bending towards their interests exclusively.
Oxfam has spent 70 years working to fight poverty and injustice in more
than 90 countries. Oxfam has fought against unsustainable debt and
against tax havens. Through these experiences, Oxfam has witnessed
first-hand how the wealthiest individuals and groups capture political
institutions for their aggrandizement at the expense of the rest of society.
Today’s unprecedented levels of economic inequality tell us that left
unchecked, representative institutions will decay further, and the power
disparity between the haves and have-nots may become entrenched and
immutable.
Strong quantitative data support Oxfam’s concerns regarding rising
wealth concentration and unequal political representation. A recent study
presents compelling statistical evidence that the preferences of wealthy
Americans are represented in their government,
compared with those of the middle classes. By contrast, the preferences
of the poorest people demonstrate statistical impact on the voting
patterns of their elected officials. If this trend continues, public policies
will most likely reproduce the conditions that are worsening economic
inequality and political marginalization.23
How do the rules governing national economies become subservient to
elite interests? This is a problem inherent to the nature of politics. As we
have seen, the influence of wealthy groups leads to imbalanced political
rights and representation. The outcomes include the capture of legislative
and regulatory decision-making functions by those powerful groups.24
The short examples that follow demonstrate how our argument applies in
different contexts.
HOW ECONOMIC INEQUALITY AND RIGGED POLITICAL RULES INTERACT
Concentration of wealth in the hands of the few leads to undue political
influence, which ultimately robs citizens of natural resource revenues,
produces unfair tax policies and encourages corrupt practices, and
challenges the regulatory powers of governments. Taken together, all of

12
these consequences serve to worsen accountability and social inclusion.
The following case studies are from very different country contexts
across the world.
Buying policy: how money skews political representation and drives inequality in the US
Since the late 1970s, weak regulation of the role of money in politics has
permitted wealthy individuals and corporations to exert undue influence
over government policy making. A pernicious result is the skewing of
public policy to favor elite interests, which has coincided with the greatest
concentration of wealth among the richest one percent since the eve of
the Great Depression.
As policies favoring corporations gained ascendancy, the bargaining
power of labor unions plummeted and the real value of the minimum wage
and other protections eroded. It is now harder for unions to organize, and
easier for big businesses to suppress wages and erode workers’ benefits.
Wealthy interest groups have also used their financial might to influence
legislators and the general public to keep downward pressure on top
income tax rates and capital gains, and to create corporate tax loopholes.
Because capital is taxed at lower rates than income, millions of average
working Americans pay higher tax rates than the rich.
From the 1980s onwards, the financial and banking sectors pumped
millions of dollars into undoing regulations put in place after the stock
market crash and Great Depression of the 1930s. Deregulation has had
two major ramifications: corporate executives associated with the
banking and financial sectors have become exceptionally wealthy, and
global markets have become much more risky, culminating in the global
economic crisis that began in 2008. As Figure 4 demonstrates, there is a
direct correlation between financial deregulation and economic inequality
in the US.
Figure 4: The relationship between financial deregulation and inequality
in the US
Source data: Financial Deregulation, http://www.nber.org/papers/w14644.pdf; Income share: Piketty
and Saez (2003, 2012).
0
5
10
15
20
25
30
-3.5
-3
-2.5
-2
-1.5
-1
-0.5
0
0.5
1
1.5
1910 1930 1950 1970 1990 2010
Inco
me s
hare
top
1%
Fin
an
cia
l d
ere
gu
lati
on
Deregulation
Top 1%

13
In 2010, President Obama signed into law the Wall Street Reform and
Consumer Protection Act (known as the Dodd-Frank Bill). The objective
of this legislation is to regulate financial markets to protect the economy
from a second major crash. However, the financial industry has spent
more than $1bn on hundreds of lobbyists to weaken and delay the Act’s
full implementation. In fact, in 2012 the top five consumer protection
groups sent 20 lobbyists to defend Dodd-Frank, while the top five finance
industry groups sent 406 to defeat it. Even though Dodd-Frank was
signed into law more than three years ago, only 148 of its 398 rules have
been finalized, and the financial system remains just as vulnerable to
crash as it was in 2008.25
The impact of austerity in Europe: boosting the inequality gap
Even before the financial crisis, a number of European countries were
seeing increased levels of income inequality despite high levels of
growth.26 Portugal and the UK already ranked among the most unequal
countries in the Organisation for Economic Co-operation and
Development (OECD).27 This raises serious questions as to how
equitable any growth will be when those countries fully emerge from
recession.
Under huge pressure from financial markets, austerity programs have
been implemented across Europe in the face of large-scale public
protests. Based on regressive taxes and deep spending cuts –
particularly to public services such as education, healthcare and social
security – these moves have started to dismantle the mechanisms that
reduce inequality and enable equitable growth. They have also sought to
erode labor rights. The poorest sections of society have been hit hardest,
as the burden of responsibility for the excesses of past decades is
passed to those who are most vulnerable and least to blame. Although it
has come too late, leading proponents of austerity such as the IMF are
beginning to recognize that harsh austerity measures have not delivered
the expected results in terms of growth and recovery, and have in fact
harmed the prospects for growth and equality.28
All the while, the richest 10 percent have seen their share of total income
grow. The combined wealth of Europe’s 10 richest people exceeds the
total cost of stimulus measures implemented across the EU between
2008 and 2010 (€217bn compared with €200bn).29
The building of India’s billionaires
India has seen its number of billionaires increase from less than 6 to 61
in the past decade, concentrating approximately $250bn among a few
dozen people in a country of 1.2 billion. What is striking is the share of
the country’s wealth held by this elite minority, which has skyrocketed
from 1.8 percent in 2003 to 26 percent in 2008, though it declined in the
aftermath of the global financial crisis.30
By some estimates, half of India’s billionaires acquired their wealth in
‘rent thick’ sectors.31 This means sectors where profits are dependent on
14
access to scarce resources, made available exclusively through
government permissions and therefore susceptible to corruption by
powerful actors – as opposed to creation of wealth. Such sectors include
real estate, construction, mining, and telecommunications. In fact, it is
common knowledge that property development is India’s most opaque
business, where enormous sums of illegal money exchange hands and
little tax is collected.32 Wealth accrued from rents is made possible by the
coaction of government and powerful groups, whereby the economic
rules of the game are rigged in favor of elites.
Despite incredible economic gains by a few dozen people in India,
poverty and inequality remain rampant. While the number of billionaires
has multiplied by ten, government spending on the needs of the poorest
and most vulnerable groups in society remains remarkably low. For
example, India’s public spending on healthcare is just one percent of
GDP.33 The Asian Development Bank’s recently released
(assessing country expenditure on poor and
economically vulnerable groups) ranked India 23 out of 35 countries in
the region. Even among the 19 low- to middle-income countries, India
ranked in the bottom half, in twelfth place.34
Corruption and loopholes mean that tax revenues necessary to address
inequality are either too low or misappropriated. The fortunes amassed
by India’s new billionaires are often hidden through shell companies
established in foreign countries, making it easy to evade taxes.35 A recent
working paper by Oxfam India demonstrates that ending the inheritance
tax (in 1985) and limiting the wealth tax (in 1993) to non-productive
assets (thereby excluding financial assets) has driven a low tax-to-GDP
ratio and is permitting the much greater concentration of wealth. The tax
structure in India is also highly regressive, with only 37.7 percent of total
taxes coming from direct taxation such as income, profits, and capital
gains.36
Tax avoidance & regressive tax systems: rigged rules in Pakistan
The nexus of wealth concentration, capture of resources and government
power by elites, and worsening inequality is especially apparent in
Pakistan. The Parliament is comprised of the nation’s wealthiest elites,
who create economic rules specifically aimed toward advancing their
narrow interests, while doing little to build the capacity of the state or
enhance the economic power of the millions of citizens it is supposed to
represent.
This is nowhere clearer than Pakistan’s problem with income and asset
tax avoidance. Of the 10 million people who qualify, only 2.5 million are
actually registered to pay tax, making Pakistan’s revenues from taxation
among the lowest in the world, even beating Sierra Leone in having the
lowest ratio of tax to GDP in the world.37
Despite an average worth of $900,000 (with the richest member worth
$37m), only a few Parliamentarians pay tax. In 2010, a review of
Parliament and provincial assemblies revealed that 61 percent of

15
lawmakers paid no income tax during the year they contested elections.
This includes Yousaf Raza Gillani, then Prime Minister, his 25 members
of cabinet, and Finance Minister Abdul Hafeez Sheikh.38
Parliamentarians create the rules that allow for these loopholes, making
their tax exemptions legal. For instance, a 1990s law makes it impossible
for authorities to ask questions on money transferred from abroad.
Unable to ascertain even the legality of how money is earned, this law
enables billions of rupees to move from Dubai back to Pakistan without
scrutiny. The rich landowners who dominate Parliament also avoid tax by
exempting agriculture – which is particularly galling for middle-class
Pakistanis, as nearly half the population work in agriculture and its profits
drive the divide between the haves and have-nots.
Many of the poorest people and even middle class Pakistanis do not earn
enough to qualify to pay income tax. Yet they are required to pay sales
tax – a much more burdensome levy for them than for the rich, and one
that feeds an unjust system. Reflecting on Pakistan’s unfair tax system,
Riyaz Hussain Naqvi, a retired tax administrator said, ‘This is a system of
the elite, by the elite and for the elite... It is a skewed system in which the
poor man subsidizes the rich man.’39
The absence of any real tax base means the state must be propped up
by international aid and loans. More importantly, the lack of domestic tax
revenues limits government investment in basic services such as
education, healthcare, and infrastructure, preventing the growth of a
vibrant and strong middle class, and perpetuating Pakistan’s widening
economic and political inequality.
Anti-competition and regulatory failure: the richest man in the world
Weak regulatory environments are ideal settings for anti-competitive
business practices. Without competition, firms are free to charge
exorbitant prices, which cause consumers to lose out and ultimately
increase economic inequality. When elites exploit weak or incompetent
anti-trust authorities, price gauging follows as a form of government
to big business. By not acting when dominant firms crowd out
competition, government tacitly permits big business to capture unearned
profits, thereby transferring income from the less well-off sections of
society to the rich. Consumer goods become more expensive, and if
incomes do not rise, inequality worsens.40
Mexico’s privatization of its telecommunications sector 20 years ago
provides a clear example of the nexus between monopolistic behavior,
weak and insufficient regulatory and legal institutions, and resulting
economic inequality.
Mexico’s Carlos Slim moves in and out of the world’s richest person spot,
possessing a net worth estimated at $73bn. The enormity of his wealth
derives from establishing an almost complete monopoly over fixed line,
mobile, and broadband communications services in Mexico. Slim is the
CEO and Chairman of América Móvil, which controls nearly 80 percent of
16
fixed line services and 70 percent of mobile services in the country. A
recent OECD review on telecommunications policy and regulation in
Mexico concluded that the monopoly over the sector has had a
significant negative effect on the economy, and a sustained welfare cost
to citizens who have had to pay inflated prices for telecommunications.41
As the OECD report argues, América Móvil’s ‘incessant’ monopolistic
behavior is facilitated by a ‘dysfunctional legal system’, which has
replaced the elected government’s right and responsibility to
develop economic policy and execute regulation of markets. This system
has stunted the emergence of a dynamic and competitive
telecommunications market. In fact, many of the regulatory instruments
present in most OECD countries are absent in Mexico.42
The costs of government failure to curb such monopolistic behavior are
large. Mexico has a high level of inequality and has the lowest GDP of all
OECD countries. As other OECD countries demonstrate, a more efficient
telecommunications (especially broadband) sector can play an important
role in driving economic growth and reducing poverty, especially among
a large rural population, as in Mexico’s case. The OECD calculates that
the market dysfunctions stemming from the telecommunications sector
have generated a welfare loss of $129.2bn between 2005 and 2009, or
1.8 percent of GDP per year.
Illicit outflows and corruption: inequality in resource-rich Africa
New natural resource discoveries are driving an explosion of economic
growth in sub-Saharan Africa. GDP in oil-rich countries like Equatorial
Guinea and Angola has grown at average annual rates of more than 10
percent since 2000. Exports of oil, natural gas, metals, and minerals are
also behind strong growth in Tanzania, Zambia, the Democratic Republic
of Congo, Mali, and Namibia.43 However, though several African
countries are among the faster growing economies in the world,
inequality remains rampant, hindering the rate of poverty reduction.44 In
fact, there is a positive correlation between the level of resources African
countries export and their levels of inequality (as measured by the Gini
coefficient).45
In countries with weak regulatory institutions, some companies
undervalue the assets on which they pay royalties and taxes. As the
individuals and companies involved in these extractive corporations and
their political allies become rich, less and less attention is paid to efforts
to reduce poverty and inequality.
Tax avoidance and inequality
Global extractives corporations use their influence to secure generous
subsidies and tax avoidance schemes from resource-rich countries. A
recent investigation by Oxfam France showed that uranium extraction in
Niger contributes only four to six percent to the public budget, despite
being the most important export product. A large energy multinational,
Winnie Byanyima Executive Director of Oxfam International

17
AREVA, has been engaged in mining in Niger. Oxfam found that
AREVA’s two subsidiaries, Somaïr and Cominak, benefit from
exemptions from duties, VAT and even fuel taxes; and a ‘provision for the
reconstruction of mines’ allows them to minimize their corporate taxes by
setting aside 20 percent of their profits.46
Tax and public expenditure
Another mechanism through which privilege cascades down is changes
in fiscal policies that benefit elites. Since the late 1970s, 29 out of 30
countries for which data are available report a lower marginal tax rate for
the richest sections of society.
Figure 5: Top marginal tax rates (selected countries)
Source: ‘Top Marginal Personal Income Tax Rates, 1975–2008’, Tax Policy Center,
http://www.taxpolicycenter.org/taxfacts/Content/PDF/oecd_historical_toprate.pdf. Shows
data for France, United Kingdom, United States, Mexico, Sweden and Germany.
In several countries, this drop in top tax rates comes with a sharp
increase in the pre-tax share of income to the top one percent. As top tax
rates began declining, certain sectors began to benefit from changes in
laws that grew incomes in those sectors. ‘
.’47
Therefore, the richest members of society not only received a larger
share of the economic pie but they also paid less tax on it.
Public expenditure decisions are also affected by the concentration of
income. Probably the most notorious, and nefarious, case is the bailout
to the financial industry in the wake of the 2008 global financial crisis.
The financial sector in several countries has held whole economies to
0
10
20
30
40
50
60
70
80
90
100
Marg
inal
tax r
ate
fo
r ri
ch
est
France United Kingdom United States
Mexico Sweden Germany

18
ransom as the threat of ‘too big to fail’ has diverted millions of dollars to
the sector in subsidies and has unduly influenced the US government – a
process that Simon Johnson, former Chief Economist at the IMF, has
dubbed a ‘Quiet Coup’.48
Moreover, wealthy interest groups often challenge efforts to create good
quality public services or universal health coverage. Such policies are
considered threats to maintaining high concentrations of wealth and
income levels. Recent evidence from Latin America (discussed in the
following section) shows that the provision of public services decreases
income inequality quite substantially; but this is unlikely to happen if
those with massive wealth have undue influence over the political
decision-making process.
Hidden from view – a global network of financial secrecy
In the last 30 years, a global network of tax havens has evolved that has
far-reaching implications for increased economic inequality. Large
amounts of wealth are hidden from view, and are largely untaxed,
denying national treasuries vital resources that could be used to benefit
society. Oxfam has conservatively estimated the amount held offshore at
$18.5 trillion.49 By comparison, the GDP of the US, the richest country on
earth, is $15.8 trillion.50 At the same time, the ‘race to the bottom’ effect
of these very low tax jurisdictions has further contributed to lower and
lower corporate and personal tax rates for the richest individuals and
corporations.51 In 2011, Zambia’s copper exports generated $10bn, while
government revenues from copper were only $240m52– in a country
where 69 percent of people live on less than $1.25 a day.53 This network
of secrecy and low tax rates facilitates the illicit flows of large amounts of
capital from the poorest countries. It is estimated that between 2008 and
2010, sub-Saharan Africa lost on average $63.4bn dollars this way each
year, or more than twice what it received in aid.54

19
3 CASCADING PRIVILEGE: MAKING THE GAPS BETWEEN THE HAVES AND THE HAVE-NOTS PERMANENT
Wealth begets wealth, and once the political and institutional system is
rigged in favor of an elite, the consolidation of their privileges cascades
down through different mechanisms. This ‘privilege cascade’ affects
elements that otherwise should be conducive to fair opportunities and
protection for all members of society. What, by some measure, looks and
sounds meritocratic is a result of rules that are biased in favor of the elite.
Good quality education and other public services overwhelmingly benefit
the few, providing them with more opportunities for development.
Equality of opportunity is a central tenet of inclusive modern societies. It
implies that a person’s achievements or outcomes should not be
determined by their race, gender, family, or any other immutable
characteristic. There are strong arguments to defend a certain level of
income inequality in any society as it may result from entrepreneurship,
effort and merit, as explained earlier; but very few people would oppose
equality of opportunity for everyone. Recent evidence shows that income
inequality and inequality of opportunity are highly correlated: children’s
life chances are strongly determined by their parents’ socio-economic
status.55
In a truly fair society, social mobility would be high, but this is not the
case where there are high levels of economic inequality. Academic Miles
Corak plotted the Gini coefficient against the extent to which a person’s
income is determined by their parents’ income (see Figure 6). In
Denmark, for instance, a country with a low Gini score, only 15 percent of
a young adult’s income today is determined by their parents’ income; in
Peru, which has a Gini score that is among the highest in the world, two-
thirds of what a person earns today is related to what their parents
earned in the past. This relationship is known as ‘the Great Gatsby
curve’. As F. Scott Fitzgerald said, the rich ‘…are different from you and
me’. And so their offspring are too.

20
Figure 6: The extent to which parents’ earnings determine the income of
their offspring
Source: M Corak (2012) ’Inequality from Generation to Generation: The United States in
Comparison’.
This evidence highlights an aspect of ‘opportunity hoarding’ – or the
process through which disparities become permanent.56 This occurs
when certain defined groups take control of valuable resources and
assets for their benefit and to ‘seek to secure rewards from sequestered
resources’.57 And this might be different types of resources such as
public expenditure, access to quality education, or profitable jobs. Even
in countries with strong social mobility such as Canada and Denmark,
sons and daughters of rich parents are more likely to work for the same
employer, which suggests that strong family connections rather than
merit help young people get well-paid jobs.58
Access to education and well-paid jobs
Education is one of the most effective ways to increase a person’s
prospects in life. The premium for college education is a powerful force in
wage inequality – which is not bad in itself, assuming that all children
have the same access to begin with. It becomes problematic when
access to good quality college education is determined by socio-
economic preconditions that limit the life chances of poor people and
benefit the rich – either through access to financial aid, poor quality
secondary education, discrimination, or stunted aspirations.
The college premium is represented in differences in wages between
those with college degrees and the rest of the population. This wage gap
might be a result of technological change that primarily benefits skilled
workers. But at the same time, there is a change in power relations
between labor and capital. A report from the International Labour
Organization (ILO) shows that between 1989 and 2005, union density (a
measure of the membership of trade unions which represents union
membership in relation to the total labor force) mostly declined in 51
Argentina
Australia
Brazil
Canada
Chile
ChinaDenmark
Finland
France
Germany
Italy
Japan New Zealand
Norway
Pakistan
Peru
Singapore
Spain
Sweden
Switzerland
United Kingdom
United States
0
0.1
0.2
0.3
0.4
0.5
0.6
0.7
0.8
20 25 30 35 40 45 50 55 60 65
Inte
rgen
era
tio
nal
earn
ing
s e
lasti
cit
y
Gini

21
countries for which data are available,59 and that union density is
negatively correlated with income inequality. Power relations between
owners of capital and workers have changed dramatically in the past
three decades in many countries, mostly as economies have moved from
manufacturing to services, and as globalization has allowed for
outsourcing of jobs. This is reflected in the decreasing share of income
going to labor: over the past three decades, wages, salaries and benefits
represent a smaller share of national income in nearly all ILO member
countries.60
Women and income inequality
The impacts of rapidly rising income inequality in any society are not felt
in isolation, but instead interact with other existing inequalities based on
gender, area of residence (e.g., rural and urban households), ethnicity
and other factors. These inequalities are themselves not exclusively
caused by economic inequality. Gender inequality also has strong
cultural causes, for example. But these inequalities are often made much
worse in very economically unequal societies.
Very often, in rich and poor countries alike, gender inequality results in
women being paid less than men for similar work. In Pakistan, for
example, only two-thirds of children attend primary school when they are
supposed to. However, the national average hides other inequalities:
disaggregated data reveal that 87 percent of boys in the richest 20
percent of the population attend primary school, whereas just 32 percent
of girls in the poorest group do. Income inequality also reinforces
negative outcomes for women in other areas of life. For example, the
maternal mortality ratio for rural women in Pakistan is almost double that
for women in urban areas.61
Inequality within a family is closely associated with the employment
status of its members. A recent paper shows that increasing female
employment (and closing the employment gap between women and
men) would reduce household income inequality.62
Although combating income inequality will not on its own solve gender
inequalities, there is a strong link between more economically equal
societies and more balanced power relations among citizens. In such
societies, a positive feedback loop can be created, with more women in
positions of power who can then ensure that institutions and rules act to
further progress gender equality.

22
4 ACCOUNTABILITY AND CITIZEN PARTICIPATION: THE ANTIDOTE TO ELITES CAPTURING GOVERNMENT
The good news is that political capture and economic inequality are not
inevitable. In fact, there are abundant examples of good governance
policies tempering the influence of wealthy elites and allowing society’s
resources to be shared more equitably. Here, we explore three such
cases, focusing on post-war America, Ghana, and Latin America.
POST-WAR AMERICA
Writing in in 1952, Frederick Lewis Allen appraised the US’s
experience of the first half of the 20th century with the following words:
‘At the turn of the century America seemed in danger of becoming a land
in which the millionaires had more and more and the rest had less and
less, and where a few financiers had a stranglehold, not only on the
country’s economic apparatus, but on its political apparatus, too.
‘...Through a combination of... revisions of the systems – tax laws,
minimum wage laws, subsidies and guarantees and regulations of
various sorts... we repealed the Iron Law of Wages. We had brought
about virtual automatic redistribution of income from the well-to-do to the
less well-to-do... that, it seems to me, is the essence of the Great
American Discovery.’
In a film released in 2013, called ‘Inequality For All’ former US Labor
Secretary Robert Reich responds to a question about which country the
US economy should emulate, given its high level of inequality (400 of the
richest Americans have more wealth than the 150 million citizens who
comprise the poorest half of the population). His surprising answer is: the
US of some decades ago. Reich then points to the three decades of
strong growth and diminishing inequality after World War II.
During this time, the US created the largest middle class the world has
ever seen. Reich calls this era ‘the Great Prosperity’. It was made
possible through a tacit agreement reflecting the interdependence
between labor, big business, and the federal government, known as the
Treaty of Detroit.63 Owing to the economic power of middle-class
consumers, big business recognized the utility of paying good wages,
with cost-of-living increases (as well as health insurance and pensions,
which had been primarily management perks until the 1950s).
Importantly, big business agreed to productivity-based wage increases
too, aligning the interests of labor and management together to ensure
rising productivity and growing profits.

23
The government’s role was to maintain the balance between labor and
big business. For instance, fearing that a tax cut on investment and
income would spur inflation, President John F. Kennedy’s Council of
Economic Advisers printed ‘guideposts’ to link wages and prices, which
unions and big corporations largely adhered to. Walter Heller, the
Chairman of Kennedy’s Council of Economic Advisers, reflected with
satisfaction years later that industry came to realize that linking wages to
productivity increases still brought significant rewards for capital, as
corporate after-tax profits doubled between 1961 and 1966.64
The era of ‘Great Prosperity’ fostered by the Treaty of Detroit came to an
end as big business increasingly concentrated its economic power to
lobby policy makers in Washington DC throughout the 1970s and 1980s,
eventually edging out labor, and fighting otherwise popular policies
impacting working families, like increasing the minimum wage. As laws
making it more difficult for unions to organize increased, average wages
stagnated, auguring in the trend of rising inequality that has been evident
for the past 30 years.65
Sources: Bureau of Labor Statistics (2013) ‘Union affiliation data from the Current Population’; Saez
& Piketty (2003) ‘Income Inequality in the United States, 1913–1998’, Quarterly Journal of
Economics, 118(1), 1–39 (Tables and Figures Updated to 2012, September 2013).
REVENUE MANAGEMENT IN GHANA
Ghana’s recent Petroleum Revenue Management Bill provides a good
example of how targeted regulation can promote shared prosperity and
mitigate elite capture. Despite Africa’s vast mineral and oil resources,
extractive industries have served to make very few people extremely
wealthy while the majority have become much poorer. Ghana’s
experience of more than 100 years of gold mining exemplifies how
revenue mismanagement makes it easy for elites to become wealthier,
while the majority are robbed of their rightful resources for development
and improved wellbeing.
After becoming Africa’s newest oil producer in 2009, civil society
advocates worked to ensure that revenues would be accounted for and
properly invested back into Ghanaian society. The new law establishes

24
mechanisms for collecting and distributing revenues, with mandates
regarding how much will fund the annual budget, how much is invested
for future generations, and how much is invested for a rainy day. It also
requires the government to publish information on receipts from oil
companies, and the Minister of Finance to reconcile receipts and
expenditures for public review every quarter. In 2011, petroleum
revenues contributed to four percent of national government spending,
most of which went to road infrastructure, building capacity for the oil and
gas sectors, repaying loans, and supporting fertilizer subsidies.
The law also mandated the creation of a Public Interest and
Accountability Committee, which serves as a vehicle for public debate
concerning how revenues are spent. The Committee is also charged with
monitoring and evaluating compliance by government and related
institutions, and providing an independent assessment of revenue
receipts. Of course, there are challenges in terms of developing civil
society capacity to effectively monitor oil production in order to determine
how much the government is rightly owed.66 But if spent equitably, these
revenues could help pay for universal healthcare in Ghana, and fund
further investment in agriculture and food production.67
FISCAL POLICY AND SOCIAL SPENDING IN LATIN AMERICA
The case of Latin America gives us hope that the global trend of rising
inequality can be reversed. Despite historically being the most unequal
region in the world, it is the only region that has managed to reduce
inequality during the past decade. In countries where inequality has
declined, governments are increasing tax revenues and spending more
on social protection and poverty reduction policies. This trend is
associated with a transition from military coups and dictatorships during
the Cold War era to stronger democratic practices around the region.
However, despite these improvements, tax regimes in Latin America
remain regressive and fail to collect enough tax as a share of GDP. They
also continue to permit unacceptable levels of tax evasion. Combatting
these inadequacies is necessary to continue addressing the region’s long
history of inequality.
The region has a long way to go to achieve its revenue potential. Yet,
recent growth of tax revenues in Latin America has been the fastest in
the world, and this growth has translated to higher spending to reduce
inequality.68 For instance, between 2002 and 2011, income inequality
dropped in 14 of the 17 countries where there is comparable data.69
During this period, approximately 50 million people moved into the middle
class, meaning that for the first time ever, more people in the region
belong to the middle class than are living in poverty.70
The reduction of inequality is the result of the right mix of government
policies that focus on poor people by increasing social public
expenditures. This mix of policies includes:
• in some cases, such as Brazil, the use of progressive taxation such as

25
direct or income taxes, although progressive taxation has not yet been
used enough by countries in the region as a redistribution tool as well
as a revenue raiser;
• increased spending on health and education (particularly primary and
secondary): as a result of which many of the poorest in society have
been able to access free social services without having to become
indebted in order to pay for them;
• large-scale conditional cash transfer programs: providing direct
income, under certain conditions, to millions of families facing poverty
and deprivation;
• increases in the minimum wage and employment opportunities: which
have created secure livelihoods for millions of people.
By some estimates, social spending as a percentage of GDP across
Latin American countries increased by 66 percent over the past twenty
years.71 The impact is noticeable, given that not long ago the region had
among the lowest public spending levels in the world. Increased
spending on health and education has had the greatest impact on
inequality reduction.72
Brazil has had significant success in reducing inequality since the new
century started: the Gini declined approximately 10 percent between
2001 and 201173 – partly because of an increase in public social
spending, an emphasis on spending on public health and education, a
wide-scale conditional cash transfer program ( ), and a
surge in the minimum wage that has risen by more than 50 percent in
real terms since 2003.
The increase in public expenditure and the reduction in inequality are
closely associated with more accountable and representative
governments. Many countries in the region have increased democratic
practices. Political parties more regularly compete for the electorate,74
through efforts to reduce the wage gap, for instance. Democracy is
fragile and inequality is still very high in the region, but the trend shows
that the once intractable problem of enormous income disparities can
actually be tackled with policy interventions.
26
5 CONCLUSION AND RECOMMENDATIONS
The large and rising concentrations of income and wealth in many
countries represent a global threat to stable, inclusive societies for one
simple reason: the unbalanced distribution of wealth skews institutions
and erodes the social contract between citizens and the state. The
checks and balances in place to ensure that the majority of the
population are heard tend to weaken. Concentration of income and
wealth actually hampers the realization of equal rights and opportunities
because it makes political representation harder for disadvantaged
groups, to the benefit of affluent groups. It has happened in the past and
unless we pay close attention to the worrying trends outlined here, it can
happen again.
Some of those who are among the richest one percent recognize the
need to reduce these inequalities, including Bill Gross, founder of PIMCO
(a global investment management firm), who said recently that those in
the one percent ‘should be willing to support higher taxes on carried
interest, and certainly capital gains readjusted to existing marginal
income tax rates.’ 75 and Warren Buffett (a US business magnate), who
has said he should never pay a lower tax rate than the office cleaner.76
The time to act on inequality is now. Rising inequality, a trend that has
grown apace over the past 30 years, must be reversed.
RECOMMENDATIONS
Those gathered at Davos for the World Economic Forum have the power
to turn around the rapid increase in inequality. Oxfam is calling on them
to pledge that they will
• Not dodge taxes in their own countries or in countries where they
invest and operate, by using tax havens;
• Not use their economic wealth to seek political favors that undermine
the democratic will of their fellow citizens;
• Make public all the investments for which they are the beneficial
owners;
• Support progressive taxation on wealth and income;
• Challenge governments to use their tax revenue to provide universal
healthcare, education and social protection for citizens;
• Demand a living wage in all the companies they own or control;
• Challenge other economic elites to join them in these pledges.

27
As a major element of the post-2015 development goals, Oxfam is calling
for
• A global goal to end extreme economic inequality in every country.
This must include consistent monitoring in every country of the share
of wealth going to the richest one percent.
Oxfam has also recommended policies to strengthen the political
representation of the poor and middle classes to reduce economic
inequality. These policies include
• Stronger regulation of markets;
• Curbing the power of the rich to influence political processes and
policies that best suit their interests.
The particular combination of policies required to reverse rising economic
inequalities should be tailored to each national context. But developing
and developed countries that have successfully reduced economic
inequality provide some suggested starting points, notably:
• Cracking down on financial secrecy and tax dodging;
• Redistributive transfers; and strengthening of social protection
schemes;
• Investment in universal access to free healthcare and education;
• Progressive taxation;
• Strengthening wage floors and worker rights;
• Removing the barriers to equal rights and opportunities for women.

28
NOTES
All web links given here were accessed December 2013 unless otherwise stated.
1 (2013) ‘Global Wealth Report 2013’, Zurich: Credit Suisse. https://publications.credit-suisse.com/tasks/render/file/?fileID=BCDB1364-A105-0560-1332EC9100FF5C83 And Forbes’ The World’s Billionaires (accessed on December 16, 2013) http://www.forbes.com/billionaires/list/
2 (2013) ‘Inside the 2013 Billionaires List: Facts and Figures’, , 4 March.http://www.forbes.com/sites/luisakroll/2013/03/04/inside-the-2013-billionaires-list-facts-and-figures/
3 (2013) ‘Dow tops 16,000, but investors get acrophobic’, 18 November.
http://www.usatoday.com/story/money/markets/2013/11/18/stocks-monday/3624335/
4 Calculated based on information from Credit Suisse, op. cit. Total wealth amounts to $240.8 trillion. Share of wealth for the bottom half of the population is 0.71 percent. That for the richest one percent is 46 percent (amounting to $110 trillion).
5 (2013) ‘Striking it Richer: The Evolution of Top Incomes in the United States (updated with 2012 preliminary estimates)’, Berkeley: University of California, Department of Economics. http://elsa.berkeley.edu/~saez/saez-UStopincomes-2012.pdf and The World Top Incomes Database. http://topincomes.g-mond.parisschoolofeconomics.eu/
6 (2013) Ibid.
7 Calculated using share of income of the top one percent, excluding capital gains of The World Top Incomes Database, http://topincomes.g-mond.parisschoolofeconomics.eu/
8 Total $283.2bn, equivalent to €217.3bn (as at July 2013). EU stimulus measures over 2008–10 totalled €200bn, as per Note 5. ‘Today’s ranking of the world’s richest people’, (2013) , 12 July, http://www.bloomberg.com/billionaires/2013-07-12/aaa
9 The World Top Incomes Database. op. cit.
10 In some cases starting from a very low base. Countries with an increase of less than 10 percent are Mauritius and France.
11 ,
12 Oxfam calculation, see http://www.oxfam.org/en/eu/pressroom/pressrelease/2013-05-22/tax-havens-private-billions-could-end-extreme-poverty-twice-over
13 Calculated based on (2013) ‘All the Ginis Dataset” Update June 2013, http://econ.worldbank.org/WBSITE/EXTERNAL/EXTDEC/EXTRESEARCH/0,,contentMDK:22301380~pagePK:64214825~piPK:64214943~theSitePK:469382,00.html
14 Ibid.
15 ,
16 (2012) , New York: Basic Books.
17 (2002) ‘Supporting Globalization: Remarks at the 2002 Eisenhower National Security Conference on National Security for the 21st Century – Anticipating Challenges, Seizing Opportunities, Building Capabilities', http://www.imf.org/external/np/speeches/2002/092602a.htm
18 (2011) ‘Inequality and Unsustainable Growth: Two Sides of the Same Coin?’ Washington, D.C.: IMF Staff Discussion Note. See http://www.imf.org/external/pubs/ft/sdn/2011/sdn1108.pdf
19 (2005) ‘Inequality is Bad For the Poor’, World Bank Policy Research Working Paper 3677, Washington, D.C.: Development Research Group, World Bank, http://www-wds.worldbank.org/servlet/WDSContentServer/WDSP/IB/2005/08/04/000016406_20050804140846/Rendered/PDF/wps3677.pdf
20 (2013) 'The Global Consensus: Inequality is a major problem’, , 15 November, http://www.pewresearch.org/fact-tank/2013/11/15/the-global-consensus-inequality-is-a-major-problem/
21 (2013) ‘Outlook on the Global Agenda 2014’, Geneva: World Economic Forum, http://www3.weforum.org/docs/WEF_GAC_GlobalAgendaOutlook_2014.pdf
https://publications.credit-suisse.com/tasks/render/file/?fileID=BCDB1364-A105-0560-1332EC9100FF5C83

29
22 See http://www.brandeis.edu/legacyfund/bio.html
23 (2005) 'Economic Inequality and Political Representation’, Working Paper, August 2005, http://www.princeton.edu/~bartels/economic.pdf
24 See also different examples in (2012) Why Nations Fail: The Origins of Power, Prosperity, and Poverty, New York: Crown Business.
25 (2013) ‘How Wall Street Defanged Dodd-Frank’ 30 April, http://www.thenation.com/article/174113/how-wall-street-defanged-dodd-frank#
26 (2012) ‘Income Inequality in the European Union’, OECD Economics Department Working Papers, No. 952, p.11. http://dx.doi.org/10.1787/5k9bdt47q5zt-en
27 (2013) ‘Crisis squeezes income and puts pressure on inequality and poverty’, Paris: OECD, http://www.oecd.org/els/soc/OECD2013-Inequality-and-Poverty-8p.pdf The UK and Portugal are only exceeded in net income inequality by Israel, US, Turkey, Mexico and Chile.
28 (2013) ‘The Distributional Effects of Fiscal Consolidation’, IMF working paper 13/151, Washington, D.C.: IMF, http://www.imf.org/external/pubs/cat/longres.aspx?sk=40699
29 Total $283.2bn, equivalent to €217.3bn (as at July 2013). EU stimulus measures over 2008–10 totalled €200bn, as per Note 5. ‘Today’s ranking of the world’s richest people’, (2013) Bloomberg, 12 July, http://www.bloomberg.com/billionaires/2013-07-12/aaa
30 (2012) ‘Where Do India’s Billionaires Get Their Wealth?’, , Vol xlviI no 40, 6 October,
http://www.michaelwalton.info/wp-content/uploads/2012/10/Where-Do-Indias-Billionaires-Get-Their-Wealth-Aditi-Walton.pdf
31 (2012) ‘India’s billionaires club ‘, 16 November, http://www.ft.com/intl/cms/s/2/be255dd2-2eb6-11e2-9b98-00144feabdc0.html#axzz2n6dz3E3o
32 Ibid.
33 World Bank (2013) ‘World Development Indicators: Health systems’, http://wdi.worldbank.org/table/2.15
34 (2013) ‘The Social Protection Index: Assessing Results for Asia and the Pacific’, Philippines: Asian Development Bank, http://www.adb.org/publications/social-protection-index-assessing-results-asia-and-pacific
35 (2013) ‘India Says It Will Investigate Offshore Leaks Revelations’, , 12 April,
http://www.icij.org/offshore/india-says-it-will-investigate-offshore-leaks-revelations
36 (2013) ‘Property Taxes Across G20 Countries: Can India Get it Right?’, Oxfam India Working Paper, India: Oxfam India, http://www.oxfamindia.org/sites/default/files/Working%20paper%2015.pdf
37 (2012) ‘Representation without Taxation! An analysis of MPs’ income tax returns for 2011’, Islamabad: Centre for Peace and Development Initiatives / Centre for Investigative Reporting in Pakistan, http://www.cirp.pk/Electronic%20Copy.pdf and http://tribune.com.pk/story/478812/report-unmasks-tax-evasion-among-pakistan-leaders/
38 Ibid.
39 (2010) ‘Pakistan’s Elite Pay Few Taxes, Widening Gap’, , 18 July,
http://www.nytimes.com/2010/07/19/world/asia/19taxes.html?pagewanted=all&_r=0
40 (2012) : , New York: W.W. Norton.
41 (2012) ‘OECD Review of Telecommunication Policy and Regulation in Mexico’, OECD Publishing, http://dx.doi.org/10.1787/9789264060111-en
42 Ibid. p.114.
43 (2013) ‘Africa Progress Report 2013 – Equity in Extractives: Stewarding Africa’s Natural Resources for All’, Geneva: Africa Progress Panel, http://www.africaprogresspanel.org/wp-content/uploads/2013/08/2013_APR_Equity_in_Extractives_25062013_ENG_HR.pdf
44 (2013) ‘Africa’s Pulse’, Office of the Chief Economist for the Africa Region, Vol. 8, October, http://www.worldbank.org/content/dam/Worldbank/document/Africa/Report/Africas-
30
Pulse-brochure_Vol8.pdf
45 Using data for South Africa, Tanzania , Zambia, Zimbabwe, Angola, Democratic Republic of Congo, Lesotho, Malawi, Mozambique, Namibia, Seychelles, Swaziland.
46 Oxfam (2013) ‘Niger: A Qui Profite l’Uranium? L’enjeu de la renégociation de contrats miniers d’AREVA’, http://www.oxfam.org/sites/www.oxfam.org/files/niger_renegociations_areva_note_oxfam-rotab.pdf
47 (2013) ‘The Top 1 Percent in International and Historical Perspective’, 27(3): 3–20, http://elsa.berkeley.edu/~saez/alvaredo-atkinson-piketty-saezJEP13top1percent.pdf
48 (2009) ‘The Quiet Coup’, , 1 May, http://www.theatlantic.com/magazine/archive/2009/05/the-quiet-coup/307364/
49 Oxfam calculation, see http://www.oxfam.org/en/eu/pressroom/pressrelease/2013-05-22/tax-havens-private-billions-could-end-extreme-poverty-twice-over
50 ‘World Development Indicators’, http://wdi.worldbank.org/table/1.1
51 N. , o
52 o
53 UNICEF, http://www.unicef.org/infobycountry/zambia_statistics.html
54 , o , p. 66.
55 (2011) , New York: Russell
Sage Foundation.
56 Corak says, ‘Opportunity hoarding, which operates when members of a categorically bounded network acquire access to a resource that is valuable, renewable, subject to monopoly, supportive of network activities and enhanced by the network’s modus operandi, network members regularly hoard their access to the resource, creating beliefs and practices that sustain their control’, in C. Tilly (1999) Durable Inequality, Berkeley: University of California Press.
57 Ibid.
58 P Bingley, M Corak and N Westergard-Nielsen (2011) ‘The Intergenerational Transmission of Employers in Canada and Denmark’, http://ftp.iza.org/dp5593.pdf
59 (2008) ‘World of Work Report 2008 : income inequalities in the age of financial globalization’, Geneva: ILO, http://www.ilo.org/wcmsp5/groups/public/---dgreports/---dcomm/---publ/documents/publication/wcms_100354.pdf
60 (2012) ‘Employment Outlook’, http://www.oecd.org/els/emp/oecdemploymentoutlook.htm
61 (2008) ‘Pakistan Demographic and Health Survey 2006–2007’, Islamabad, Pakistan & Calverton, Maryland US: National Institute of Population Studies (Pakistan) & Macro International Inc. (US), http://www.measuredhs.com/pubs/pdf/FR200/FR200.pdf
62 (2012) ‘The Contribution of Women’s Employment and Earnings to Household Income Inequality: A Cross-Country Analysis’.
63 (2012) , New York: Bloomsbury Press.
64 Ibid.
65 Ibid., p. 128.
66 (2013) ‘Ghana’s ‘new path’ for handling oil revenue’, , January, http://www.un.org/africarenewal/magazine/january-2013/ghana’s-‘new-path’-handling-oil-revenue
67 (2011) ‘Achieving a Shared Goal: Free Universal Health Care in Ghana’, Oxford: Oxfam, http://www.oxfam.org/sites/www.oxfam.org/files/rr-achieving-shared-goal-healthcare-ghana-090311-en.pdf
68 (2013) New York: Palgrave Macmillan,
http://idbdocs.iadb.org/wsdocs/getdocument.aspx?docnum=37768292

31
69 (2013) ‘Deconstructing the Decline of Inequality in Latin America’, Tulane University working paper series WP 1314, http://econ.tulane.edu/RePEc/pdf/tul1314.pdf
70 (2012) ‘Shifting gears to accelerate prosperity in Latin America and the Caribbean’, Washington, D.C.: World Bank, http://www.worldbank.org/content/dam/Worldbank/document/LAC/PLB%20Shared%20Prosperity%20FINAL.pdf
71 (2012) ‘Social Panorama of Latin America’, Santiago: United Nations Publications, http://www.cepal.org/publicaciones/xml/8/49398/2012-960-PSI_WEB.pdf
72 (2013) ‘The impact of taxes and social spending on inequality and poverty in Argentina, Bolivia, Brazil, Mexico, Peru and Uruguay: An overview’, Tulane University, http://econ.tulane.edu/RePEc/pdf/tul1313.pdf
73 (2012) ‘Shifting gears to accelerate prosperity in Latin America and the Caribbean’, op. cit.
74 (2012) , Chicago: University Of Chicago Press.
75 (2013) ‘ PIMCO’s Gross urges ‘privileged 1%’ to pay more tax’, 31 October, http://www.reuters.com/article/2013/10/31/us-funds-investing-pimco-idUSBRE99U0LM20131031
76 ‘Buffett decries his tax rate as less than cleaning ladies’, (2010) , 7 October, http://www.theaustralian.com.au/business/buffett-decries-his-tax-rate-as-less-than-cleaning-ladys/story-e6frg8zx-1225935122225
32
© Oxfam International January 2014
This paper was written by Ricardo Fuentes-Nieva and Nick Galasso. Oxfam
acknowledges the assistance of Natalia Alonso, Ana Arendar, Teresa Cavero,
Anna Coryndon, Kimberly Pfeifer and Max Lawson in its production. It is part of
a series of papers written to inform public debate on development and
humanitarian policy issues.
For further information on the issues raised in this paper please e-mail
This publication is copyright but the text may be used free of charge for the
purposes of advocacy, campaigning, education, and research, provided that the
source is acknowledged in full. The copyright holder requests that all such use
be registered with them for impact assessment purposes. For copying in any
other circumstances, or for re-use in other publications, or for translation or
adaptation, permission must be secured and a fee may be charged. E-mail
The information in this publication is correct at the time of going to press.
Published by Oxfam GB for Oxfam International under ISBN 978-1-78077-539-5
in January 2014.
Oxfam GB, Oxfam House, John Smith Drive, Cowley, Oxford, OX4 2JY, UK.
OXFAM
Oxfam is an international confederation of 17 organizations networked together
in more than 90 countries, as part of a global movement for change, to build a
future free from the injustice of poverty:
Oxfam America (www.oxfamamerica.org)
Oxfam Australia (www.oxfam.org.au)
Oxfam-in-Belgium (www.oxfamsol.be)
Oxfam Canada (www.oxfam.ca)
Oxfam France (www.oxfamfrance.org)
Oxfam Germany (www.oxfam.de)
Oxfam GB (www.oxfam.org.uk)
Oxfam Hong Kong (www.oxfam.org.hk)
Oxfam India (www.oxfamindia.org)
Oxfam Intermón (Spain) (www.oxfamintermon.org)
Oxfam Ireland (www.oxfamireland.org)
Oxfam Italy (www.oxfamitalia.org)
Oxfam Japan (www.oxfam.jp)
Oxfam Mexico (www.oxfammexico.org)
Oxfam New Zealand (www.oxfam.org.nz)
Oxfam Novib (Netherlands) (www.oxfamnovib.nl)
Oxfam Québec (www.oxfam.qc.ca)
Please write to any of the agencies for further information, or visit
www.oxfam.org.
www.oxfam.org


![Whiter and Wealthier: “Local Control” Hinders Desegregation by …jlsp.law.columbia.edu/wp-content/uploads/sites/8/2018/11/... · 2018. 11. 9. · 2018] Whiter and Wealthier 41](https://static.fdocuments.net/doc/165x107/6038ee77123e9372e266473d/whiter-and-wealthier-aoelocal-controla-hinders-desegregation-by-jlsplaw-2018.jpg)


