Workforce Skills Evidence Base - Final -...
80
i The Kent and Medway Workforce Skills Evidence Base Dr Jonathan Pratt and Steve Matthews Emergent Research and Consulting September 2015
Transcript of Workforce Skills Evidence Base - Final -...
i
The Kent and Medway Workforce Skills Evidence Base
Dr Jonathan Pratt and Steve Matthews Emergent Research and Consulting
September 2015
ii
Executive Summary This Workforce Skills Evidence Base provides an overview of current and future skills demand in Kent and Medway, taking into account economic trends, local sector strengths and demand from neighbouring local communities. It also considers “supply side” and social factors that shape the skills and employability of the area’s working population. The purpose of this analysis is to provide useful intelligence to providers, planners and funders of services, and inform the future plans and strategies of key public sector bodies. The document is primarily based on existing secondary data sources (building on work done earlier for SELEP), enhanced with qualitative data gathered through workshops and interviews with representatives of key sectors recruited by Kent County Council from previous sector strategy work.
Businesses and Employment Kent and Medway is home to 57,000 businesses, employing over 630,000 people. A further 170,000 people are estimated to be self‐employed in the area. In line with the national picture, the vast majority of firms are micro‐businesses employing fewer than 10 staff, but medium‐sized and large firms account for 45% of all employment. “Job density” data (the number of jobs for every working age adult) suggests that there are fewer jobs than might be expected if Kent and Medway reflected the pattern for Great Britain as a whole. This is probably due to the area’s proximity to London, given that 20% of working residents commute out of Kent and Medway to work, and 16% to London. Commuting figures are especially high for Dartford and Sevenoaks, where 49% of residents travel out of the area for work. The earnings potential of London commuters may explain part of this trend: average wages for people who live in Kent & Medway are significantly higher than those who work in Kent & Medway. This provides a competitive challenge for some Kent & Medway businesses.
The bulk of demand for skilled labour relates to the replacement of staff in jobs that already exist (as people retire, for example, or move into a different role), rather than from new jobs created. The sector profile of current employment in Kent and Medway is very similar to that for the SELEP region as a whole. Both have a relatively high concentration of employment in construction, motor trades, retail, transport & distribution, and education when compared with Great Britain as a whole. The occupational profile of the Kent & Medway workforce is also similar to that of the SELEP region and Great Britain. Changes in employment by sector and occupation are also an important component of skills demand. The overall level of employment stayed relatively static for the period 2009 – 2013, growing by only 1%. However, this overall trend masks significant differences between sectors though, with many jobs lost in sectors like manufacturing, construction, health and public administration and gained in sectors like business administration, accommodation & food and education. Comparison with national data suggests that recent change in the sector profile of employment in Kent and Medway largely reflects national economic and sector employment trends, although the fall in professional, scientific and technical services sector employment was more pronounced, perhaps due to the closure of some Pfizer operations at Sandwich. Over the next few years, employment forecasts produced for the UK Commission for Employment and Skills (UKCES) suggest that employment will rise across the South East by around 6% (for the period 2013 – 2022). If this regional trend were reflected in Kent and Medway some 41,000 new jobs would be added to the area’s labour market. The forecasts suggest that growth in employment will be significant in most sectors, except primary industries, manufacturing, public administration and education. They also suggest that there will be growth
Workforce Skills Evidence Base Labour Market Intelligence for Kent & Medway
ii
in employment in most occupations, especially corporate managers and directors (+12,000), caring personal service occupations (+12,000), business and public associate professionals (+9,000), science, engineering and technology professionals (+9,000) and business media and public professionals (+7,000). An analysis of the qualifications held by people in different occupations – now and as forecast by 2022 – also suggests that there will be a growing need for Level 4+ qualifications (equivalent to Foundation Degree or above), which are expected to be required by more than half the workforce in 2022.
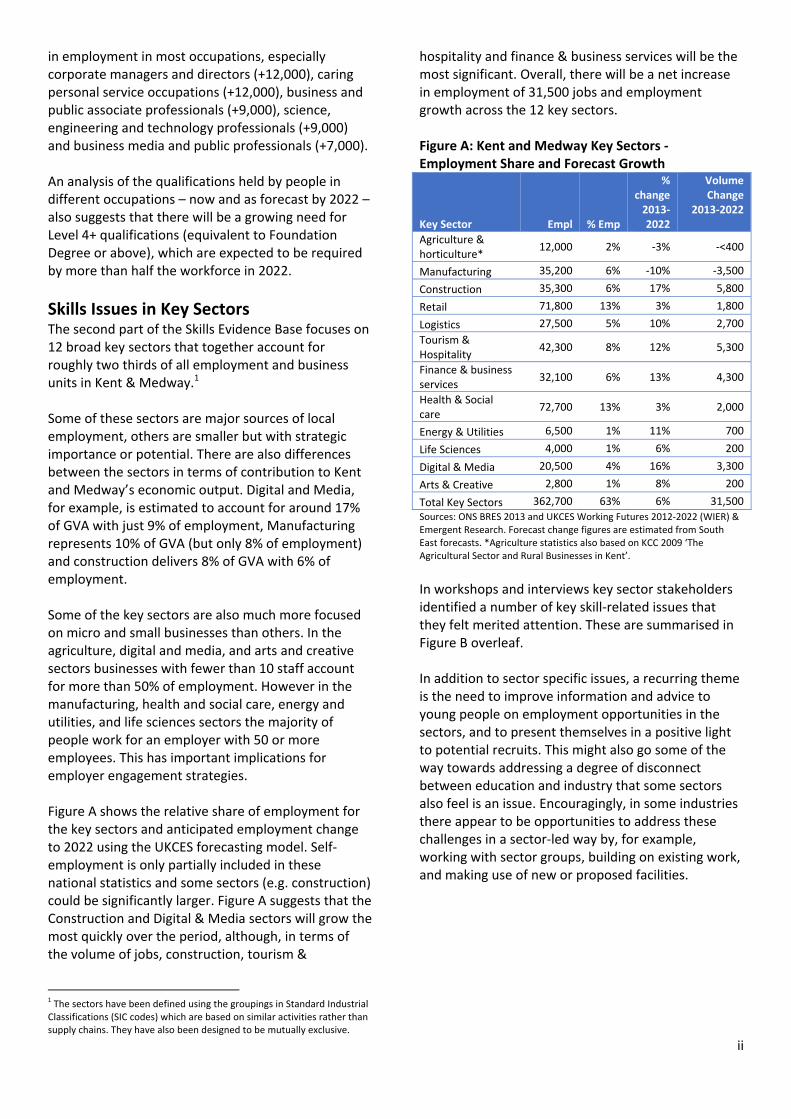
Skills Issues in Key Sectors The second part of the Skills Evidence Base focuses on 12 broad key sectors that together account for roughly two thirds of all employment and business units in Kent & Medway.1 Some of these sectors are major sources of local employment, others are smaller but with strategic importance or potential. There are also differences between the sectors in terms of contribution to Kent and Medway’s economic output. Digital and Media, for example, is estimated to account for around 17% of GVA with just 9% of employment, Manufacturing represents 10% of GVA (but only 8% of employment) and construction delivers 8% of GVA with 6% of employment. Some of the key sectors are also much more focused on micro and small businesses than others. In the agriculture, digital and media, and arts and creative sectors businesses with fewer than 10 staff account for more than 50% of employment. However in the manufacturing, health and social care, energy and utilities, and life sciences sectors the majority of people work for an employer with 50 or more employees. This has important implications for employer engagement strategies. Figure A shows the relative share of employment for the key sectors and anticipated employment change to 2022 using the UKCES forecasting model. Self‐employment is only partially included in these national statistics and some sectors (e.g. construction) could be significantly larger. Figure A suggests that the Construction and Digital & Media sectors will grow the most quickly over the period, although, in terms of the volume of jobs, construction, tourism &
1 The sectors have been defined using the groupings in Standard Industrial Classifications (SIC codes) which are based on similar activities rather than supply chains. They have also been designed to be mutually exclusive.
hospitality and finance & business services will be the most significant. Overall, there will be a net increase in employment of 31,500 jobs and employment growth across the 12 key sectors. Figure A: Kent and Medway Key Sectors ‐ Employment Share and Forecast Growth
Key Sector Empl % Emp
% change 2013‐2022
Volume Change
2013‐2022
Agriculture & horticulture*
12,000 2% ‐3% ‐<400
Manufacturing 35,200 6% ‐10% ‐3,500
Construction 35,300 6% 17% 5,800
Retail 71,800 13% 3% 1,800
Logistics 27,500 5% 10% 2,700
Tourism & Hospitality
42,300 8% 12% 5,300
Finance & business services
32,100 6% 13% 4,300
Health & Social care
72,700 13% 3% 2,000
Energy & Utilities 6,500 1% 11% 700
Life Sciences 4,000 1% 6% 200
Digital & Media 20,500 4% 16% 3,300
Arts & Creative 2,800 1% 8% 200
Total Key Sectors 362,700 63% 6% 31,500
Sources: ONS BRES 2013 and UKCES Working Futures 2012‐2022 (WIER) & Emergent Research. Forecast change figures are estimated from South East forecasts. *Agriculture statistics also based on KCC 2009 ‘The Agricultural Sector and Rural Businesses in Kent’.
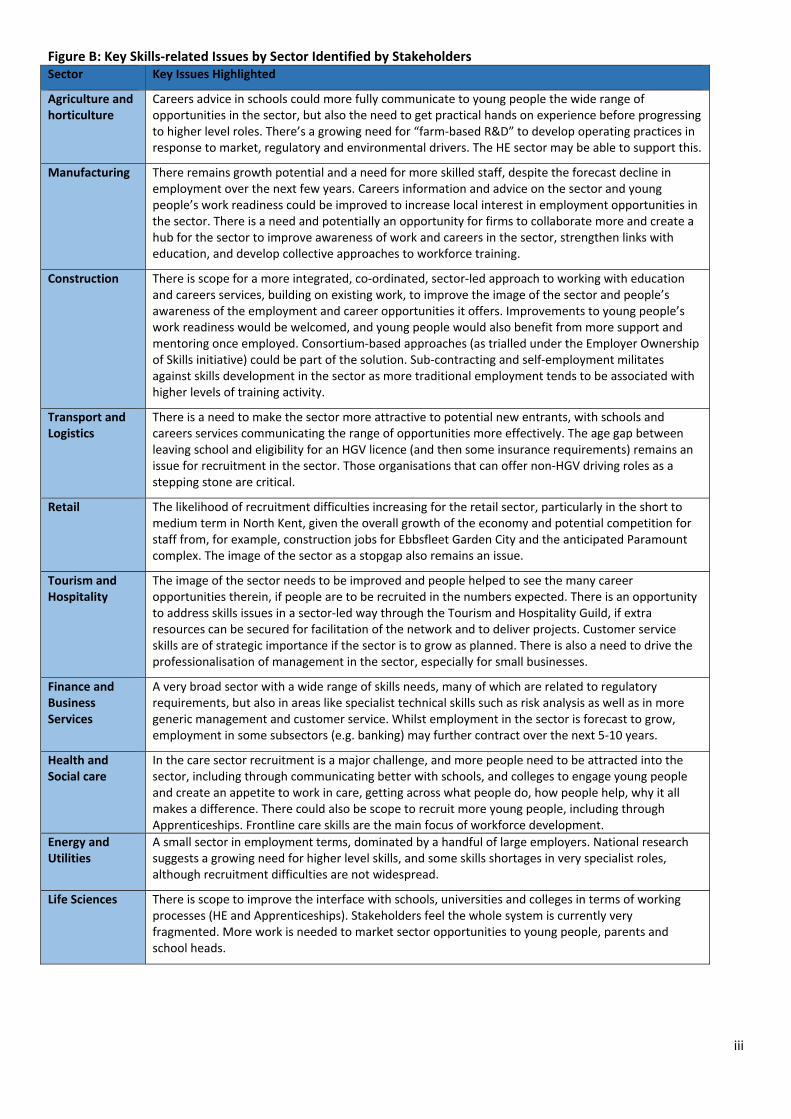
In workshops and interviews key sector stakeholders identified a number of key skill‐related issues that they felt merited attention. These are summarised in Figure B overleaf. In addition to sector specific issues, a recurring theme is the need to improve information and advice to young people on employment opportunities in the sectors, and to present themselves in a positive light to potential recruits. This might also go some of the way towards addressing a degree of disconnect between education and industry that some sectors also feel is an issue. Encouragingly, in some industries there appear to be opportunities to address these challenges in a sector‐led way by, for example, working with sector groups, building on existing work, and making use of new or proposed facilities.
iii
Figure B: Key Skills‐related Issues by Sector Identified by Stakeholders Sector Key Issues Highlighted
Agriculture and horticulture
Careers advice in schools could more fully communicate to young people the wide range of opportunities in the sector, but also the need to get practical hands on experience before progressing to higher level roles. There’s a growing need for “farm‐based R&D” to develop operating practices in response to market, regulatory and environmental drivers. The HE sector may be able to support this.
Manufacturing There remains growth potential and a need for more skilled staff, despite the forecast decline in employment over the next few years. Careers information and advice on the sector and young people’s work readiness could be improved to increase local interest in employment opportunities in the sector. There is a need and potentially an opportunity for firms to collaborate more and create a hub for the sector to improve awareness of work and careers in the sector, strengthen links with education, and develop collective approaches to workforce training.
Construction There is scope for a more integrated, co‐ordinated, sector‐led approach to working with education and careers services, building on existing work, to improve the image of the sector and people’s awareness of the employment and career opportunities it offers. Improvements to young people’s work readiness would be welcomed, and young people would also benefit from more support and mentoring once employed. Consortium‐based approaches (as trialled under the Employer Ownership of Skills initiative) could be part of the solution. Sub‐contracting and self‐employment militates against skills development in the sector as more traditional employment tends to be associated with higher levels of training activity.
Transport and Logistics
There is a need to make the sector more attractive to potential new entrants, with schools and careers services communicating the range of opportunities more effectively. The age gap between leaving school and eligibility for an HGV licence (and then some insurance requirements) remains an issue for recruitment in the sector. Those organisations that can offer non‐HGV driving roles as a stepping stone are critical.
Retail The likelihood of recruitment difficulties increasing for the retail sector, particularly in the short to medium term in North Kent, given the overall growth of the economy and potential competition for staff from, for example, construction jobs for Ebbsfleet Garden City and the anticipated Paramount complex. The image of the sector as a stopgap also remains an issue.
Tourism and Hospitality
The image of the sector needs to be improved and people helped to see the many career opportunities therein, if people are to be recruited in the numbers expected. There is an opportunity to address skills issues in a sector‐led way through the Tourism and Hospitality Guild, if extra resources can be secured for facilitation of the network and to deliver projects. Customer service skills are of strategic importance if the sector is to grow as planned. There is also a need to drive the professionalisation of management in the sector, especially for small businesses.
Finance and Business Services
A very broad sector with a wide range of skills needs, many of which are related to regulatory requirements, but also in areas like specialist technical skills such as risk analysis as well as in more generic management and customer service. Whilst employment in the sector is forecast to grow, employment in some subsectors (e.g. banking) may further contract over the next 5‐10 years.
Health and Social care
In the care sector recruitment is a major challenge, and more people need to be attracted into the sector, including through communicating better with schools, and colleges to engage young people and create an appetite to work in care, getting across what people do, how people help, why it all makes a difference. There could also be scope to recruit more young people, including through Apprenticeships. Frontline care skills are the main focus of workforce development.
Energy and Utilities
A small sector in employment terms, dominated by a handful of large employers. National research suggests a growing need for higher level skills, and some skills shortages in very specialist roles, although recruitment difficulties are not widespread.
Life Sciences There is scope to improve the interface with schools, universities and colleges in terms of working processes (HE and Apprenticeships). Stakeholders feel the whole system is currently very fragmented. More work is needed to market sector opportunities to young people, parents and school heads.
iv
Digital and Media
There is likely to be significant growth potential in this sector, but more support is needed to help small firms “take the next step” through business support and the development of commercial skills. Design Technology curricula should be updated to reflect the latest industry practice, and people with practical skills also need business skills to turn activities into businesses. There is potential for a closer relationship between the sector and Higher Education, if issues like licensing and IP can be addressed.
Arts and Creative
People who have worked as interns need “next step” opportunities to enable their career progression. So an initiative to raise awareness of and strengthen the profile of the sector, and the different organisations that make it up would be helpful. Sector capacity would be improved if there were better access to funding and development skills, market data analysis, business plan development and work planning.
Source: Emergent Research, based on stakeholder workshops and interviews conducted July – August 2015.
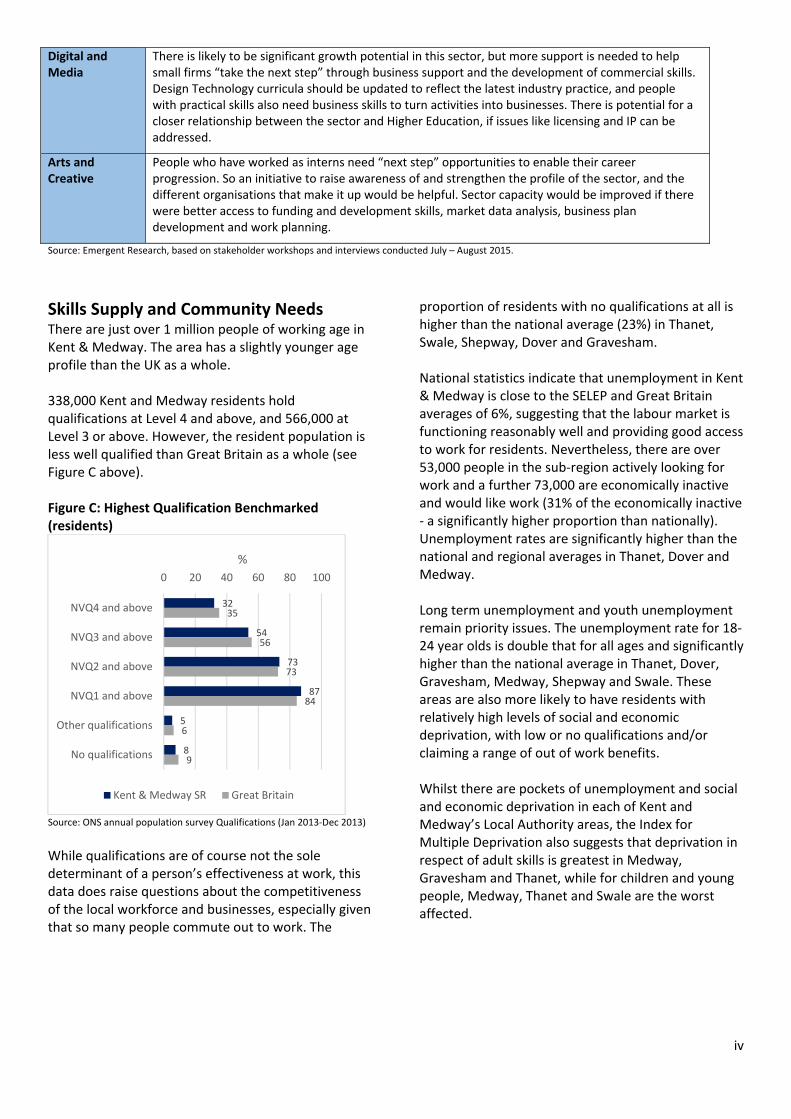
Skills Supply and Community Needs There are just over 1 million people of working age in Kent & Medway. The area has a slightly younger age profile than the UK as a whole. 338,000 Kent and Medway residents hold qualifications at Level 4 and above, and 566,000 at Level 3 or above. However, the resident population is less well qualified than Great Britain as a whole (see Figure C above). Figure C: Highest Qualification Benchmarked (residents)
Source: ONS annual population survey Qualifications (Jan 2013‐Dec 2013)
While qualifications are of course not the sole determinant of a person’s effectiveness at work, this data does raise questions about the competitiveness of the local workforce and businesses, especially given that so many people commute out to work. The
proportion of residents with no qualifications at all is higher than the national average (23%) in Thanet, Swale, Shepway, Dover and Gravesham. National statistics indicate that unemployment in Kent & Medway is close to the SELEP and Great Britain averages of 6%, suggesting that the labour market is functioning reasonably well and providing good access to work for residents. Nevertheless, there are over 53,000 people in the sub‐region actively looking for work and a further 73,000 are economically inactive and would like work (31% of the economically inactive ‐ a significantly higher proportion than nationally). Unemployment rates are significantly higher than the national and regional averages in Thanet, Dover and Medway. Long term unemployment and youth unemployment remain priority issues. The unemployment rate for 18‐24 year olds is double that for all ages and significantly higher than the national average in Thanet, Dover, Gravesham, Medway, Shepway and Swale. These areas are also more likely to have residents with relatively high levels of social and economic deprivation, with low or no qualifications and/or claiming a range of out of work benefits. Whilst there are pockets of unemployment and social and economic deprivation in each of Kent and Medway’s Local Authority areas, the Index for Multiple Deprivation also suggests that deprivation in respect of adult skills is greatest in Medway, Gravesham and Thanet, while for children and young people, Medway, Thanet and Swale are the worst affected.
32
54
73
87
5
8
35
56
73
84
6
9
0 20 40 60 80 100
NVQ4 and above
NVQ3 and above
NVQ2 and above
NVQ1 and above
Other qualifications
No qualifications
%
Kent & Medway SR Great Britain
Workforce Skills Evidence Base
Table of Contents
1. Introduction 1
2. Businesses & Employment
2.1 Kent & Medway Business Profile 2.2 Employment in Neighbouring Areas 2.3 Employment by Sector & Occupation 2.4 Employment Trends
1
1 2 3 4
3. Skills Needs in Key Sectors
3.1 Key Sectors – Introduction 3.2 Skills Issues in Key Sector
6
6 8
4. Skills Supply and Community Needs 15
4.1 Kent & Medway Community Profile 4.2 Unemployment and Economic Inactivity 4.3 Social Needs 4.4 Skills and Qualifications
Annexes (i) Workshop and Interview Participants (ii) Local Sector Employment Strengths – Summary (iii) Detailed Sector Skills Annexes
Agriculture & Horticulture Manufacturing Construction Retail Transport & Logistics Tourism & Hospitality Finance & Business Services Health & Social Care Energy & Utilities Lifesciences Digital & Media Arts & Creative Industries
15 15 17 18
21
22 23 23 27 32 36 40 44 48 52 56 60 64 68
Workforce Skills Evidence Base
Emergent Research & Consulting Ltd 1
This document summarises the first draft of the Kent & Medway Workforce Skills Evidence Base (WSEB). The WSEB is intended to: a) Provide an overview of current and future skills
demand in Kent and Medway, taking into account economic trends, local sector strengths and demand from neighbouring local economies.
b) Provide an overview of social needs and workforce skills supply, taking into account current workforce skills levels, provision and employer views.
c) Identify areas in which there are, or are likely to be, supply and demand imbalances which could impact economic growth and employment and household income levels in Kent and Medway over the medium to long term.
It is anticipated that the WSEB will be useful to skills providers in planning for future provision and to local economic partnerships in identifying priorities for additional provision and initiatives. The Evidence Base is based primarily on secondary data and builds on a summary of labour market intelligence prepared for East Kent College and the South East Local Economic Partnership (SELEP). However, it also draws on a series of employer workshops held with businesses in key Kent & Medway sectors during the summer of 2015.
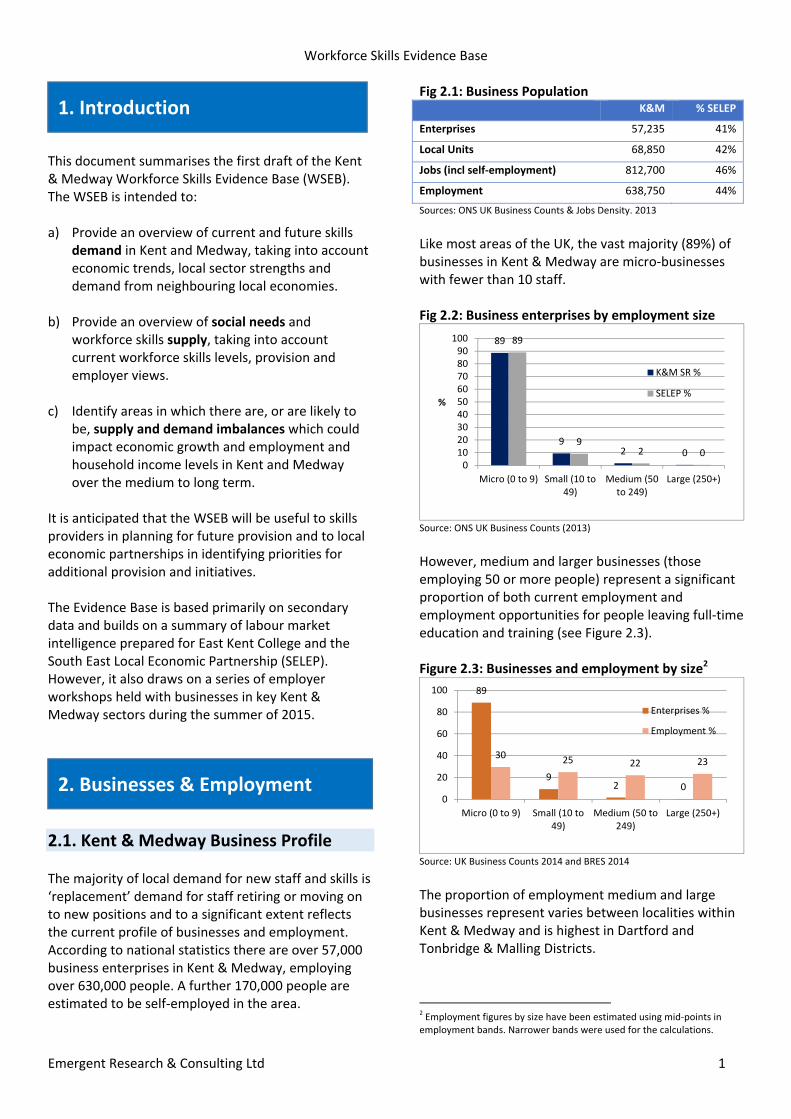
2.1. Kent & Medway Business Profile The majority of local demand for new staff and skills is ‘replacement’ demand for staff retiring or moving on to new positions and to a significant extent reflects the current profile of businesses and employment. According to national statistics there are over 57,000 business enterprises in Kent & Medway, employing over 630,000 people. A further 170,000 people are estimated to be self‐employed in the area.
Fig 2.1: Business Population K&M % SELEP
Enterprises 57,235 41%
Local Units 68,850 42%
Jobs (incl self‐employment) 812,700 46%
Employment 638,750 44%
Sources: ONS UK Business Counts & Jobs Density. 2013
Like most areas of the UK, the vast majority (89%) of businesses in Kent & Medway are micro‐businesses with fewer than 10 staff. Fig 2.2: Business enterprises by employment size
Source: ONS UK Business Counts (2013)
However, medium and larger businesses (those employing 50 or more people) represent a significant proportion of both current employment and employment opportunities for people leaving full‐time education and training (see Figure 2.3). Figure 2.3: Businesses and employment by size2
Source: UK Business Counts 2014 and BRES 2014
The proportion of employment medium and large businesses represent varies between localities within Kent & Medway and is highest in Dartford and Tonbridge & Malling Districts.
2 Employment figures by size have been estimated using mid‐points in employment bands. Narrower bands were used for the calculations.
89
92 0
89
92 0
0102030405060708090
100
Micro (0 to 9) Small (10 to49)
Medium (50to 249)
Large (250+)
%
K&M SR %
SELEP %
89
92 0
30 25 22 23
0
20
40
60
80
100
Micro (0 to 9) Small (10 to49)
Medium (50 to249)
Large (250+)
Enterprises %
Employment %
1. Introduction
2. Businesses & Employment
Workforce Skills Evidence Base
Emergent Research & Consulting Ltd 2
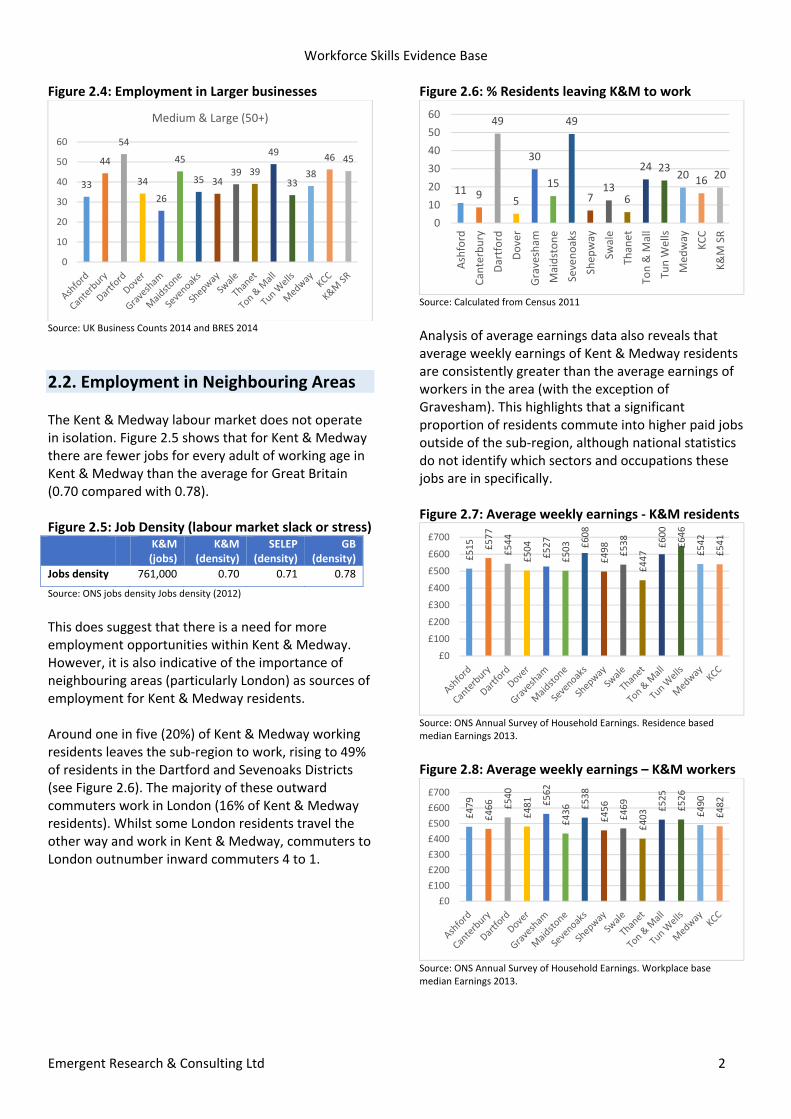
Figure 2.4: Employment in Larger businesses
Source: UK Business Counts 2014 and BRES 2014
2.2. Employment in Neighbouring Areas The Kent & Medway labour market does not operate in isolation. Figure 2.5 shows that for Kent & Medway there are fewer jobs for every adult of working age in Kent & Medway than the average for Great Britain (0.70 compared with 0.78). Figure 2.5: Job Density (labour market slack or stress) K&M
(jobs) K&M
(density) SELEP
(density) GB
(density)
Jobs density 761,000 0.70 0.71 0.78
Source: ONS jobs density Jobs density (2012)
This does suggest that there is a need for more employment opportunities within Kent & Medway. However, it is also indicative of the importance of neighbouring areas (particularly London) as sources of employment for Kent & Medway residents. Around one in five (20%) of Kent & Medway working residents leaves the sub‐region to work, rising to 49% of residents in the Dartford and Sevenoaks Districts (see Figure 2.6). The majority of these outward commuters work in London (16% of Kent & Medway residents). Whilst some London residents travel the other way and work in Kent & Medway, commuters to London outnumber inward commuters 4 to 1.
Figure 2.6: % Residents leaving K&M to work
Source: Calculated from Census 2011
Analysis of average earnings data also reveals that average weekly earnings of Kent & Medway residents are consistently greater than the average earnings of workers in the area (with the exception of Gravesham). This highlights that a significant proportion of residents commute into higher paid jobs outside of the sub‐region, although national statistics do not identify which sectors and occupations these jobs are in specifically. Figure 2.7: Average weekly earnings ‐ K&M residents
Source: ONS Annual Survey of Household Earnings. Residence based median Earnings 2013.
Figure 2.8: Average weekly earnings – K&M workers
Source: ONS Annual Survey of Household Earnings. Workplace base median Earnings 2013.
33
44
54
34
26
45
35 3439 39
49
3338
46 45
0
10
20
30
40
50
60
Medium & Large (50+)
11 9
49
5
30
15
49
713
6
24 2320 16 20
0
10
20
30
40
50
60
Ashford
Canterbury
Dartford
Dover
Gravesham
Maidstone
Sevenoaks
Shep
way
Swale
Thanet
Ton & M
all
Tun W
ells
Med
way
KCC
K&M SR
£515
£577
£544
£504
£527
£503 £608
£498
£538
£447
£600
£646
£542
£541
£0
£100
£200
£300
£400
£500
£600
£700
£479
£466 £540
£481 £562
£436 £538
£456
£469
£403 £525
£526
£490
£482
£0
£100
£200
£300
£400
£500
£600
£700
Workforce Skills Evidence Base
Emergent Research & Consulting Ltd 3
On the one hand this highlights the competitive pressure that businesses in Kent & Medway will experience when it comes to salaries. On the other it suggests there may be a need for more high quality jobs in the sub‐region. Local analysis of these figures also needs to consider the sector profile of the area and the ease with which businesses can draw staff from other areas.
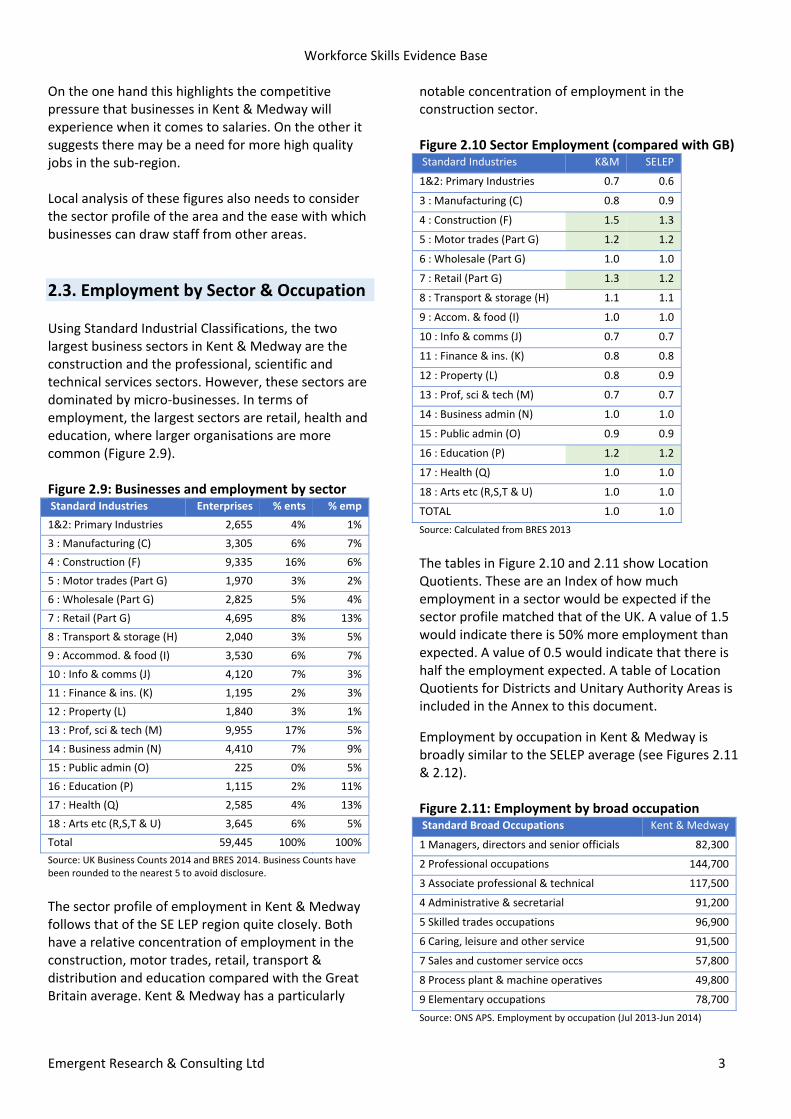
2.3. Employment by Sector & Occupation Using Standard Industrial Classifications, the two largest business sectors in Kent & Medway are the construction and the professional, scientific and technical services sectors. However, these sectors are dominated by micro‐businesses. In terms of employment, the largest sectors are retail, health and education, where larger organisations are more common (Figure 2.9). Figure 2.9: Businesses and employment by sector Standard Industries Enterprises % ents % emp
1&2: Primary Industries 2,655 4% 1%
3 : Manufacturing (C) 3,305 6% 7%
4 : Construction (F) 9,335 16% 6%
5 : Motor trades (Part G) 1,970 3% 2%
6 : Wholesale (Part G) 2,825 5% 4%
7 : Retail (Part G) 4,695 8% 13%
8 : Transport & storage (H) 2,040 3% 5%
9 : Accommod. & food (I) 3,530 6% 7%
10 : Info & comms (J) 4,120 7% 3%
11 : Finance & ins. (K) 1,195 2% 3%
12 : Property (L) 1,840 3% 1%
13 : Prof, sci & tech (M) 9,955 17% 5%
14 : Business admin (N) 4,410 7% 9%
15 : Public admin (O) 225 0% 5%
16 : Education (P) 1,115 2% 11%
17 : Health (Q) 2,585 4% 13%
18 : Arts etc (R,S,T & U) 3,645 6% 5%
Total 59,445 100% 100%
Source: UK Business Counts 2014 and BRES 2014. Business Counts have been rounded to the nearest 5 to avoid disclosure.
The sector profile of employment in Kent & Medway follows that of the SE LEP region quite closely. Both have a relative concentration of employment in the construction, motor trades, retail, transport & distribution and education compared with the Great Britain average. Kent & Medway has a particularly
notable concentration of employment in the construction sector. Figure 2.10 Sector Employment (compared with GB) Standard Industries K&M SELEP
1&2: Primary Industries 0.7 0.6
3 : Manufacturing (C) 0.8 0.9
4 : Construction (F) 1.5 1.3
5 : Motor trades (Part G) 1.2 1.2
6 : Wholesale (Part G) 1.0 1.0
7 : Retail (Part G) 1.3 1.2
8 : Transport & storage (H) 1.1 1.1
9 : Accom. & food (I) 1.0 1.0
10 : Info & comms (J) 0.7 0.7
11 : Finance & ins. (K) 0.8 0.8
12 : Property (L) 0.8 0.9
13 : Prof, sci & tech (M) 0.7 0.7
14 : Business admin (N) 1.0 1.0
15 : Public admin (O) 0.9 0.9
16 : Education (P) 1.2 1.2
17 : Health (Q) 1.0 1.0
18 : Arts etc (R,S,T & U) 1.0 1.0
TOTAL 1.0 1.0
Source: Calculated from BRES 2013
The tables in Figure 2.10 and 2.11 show Location Quotients. These are an Index of how much employment in a sector would be expected if the sector profile matched that of the UK. A value of 1.5 would indicate there is 50% more employment than expected. A value of 0.5 would indicate that there is half the employment expected. A table of Location Quotients for Districts and Unitary Authority Areas is included in the Annex to this document.
Employment by occupation in Kent & Medway is broadly similar to the SELEP average (see Figures 2.11 & 2.12). Figure 2.11: Employment by broad occupation Standard Broad Occupations Kent & Medway
1 Managers, directors and senior officials 82,300
2 Professional occupations 144,700
3 Associate professional & technical 117,500
4 Administrative & secretarial 91,200
5 Skilled trades occupations 96,900
6 Caring, leisure and other service 91,500
7 Sales and customer service occs 57,800
8 Process plant & machine operatives 49,800
9 Elementary occupations 78,700
Source: ONS APS. Employment by occupation (Jul 2013‐Jun 2014)
Workforce Skills Evidence Base
Emergent Research & Consulting Ltd 4
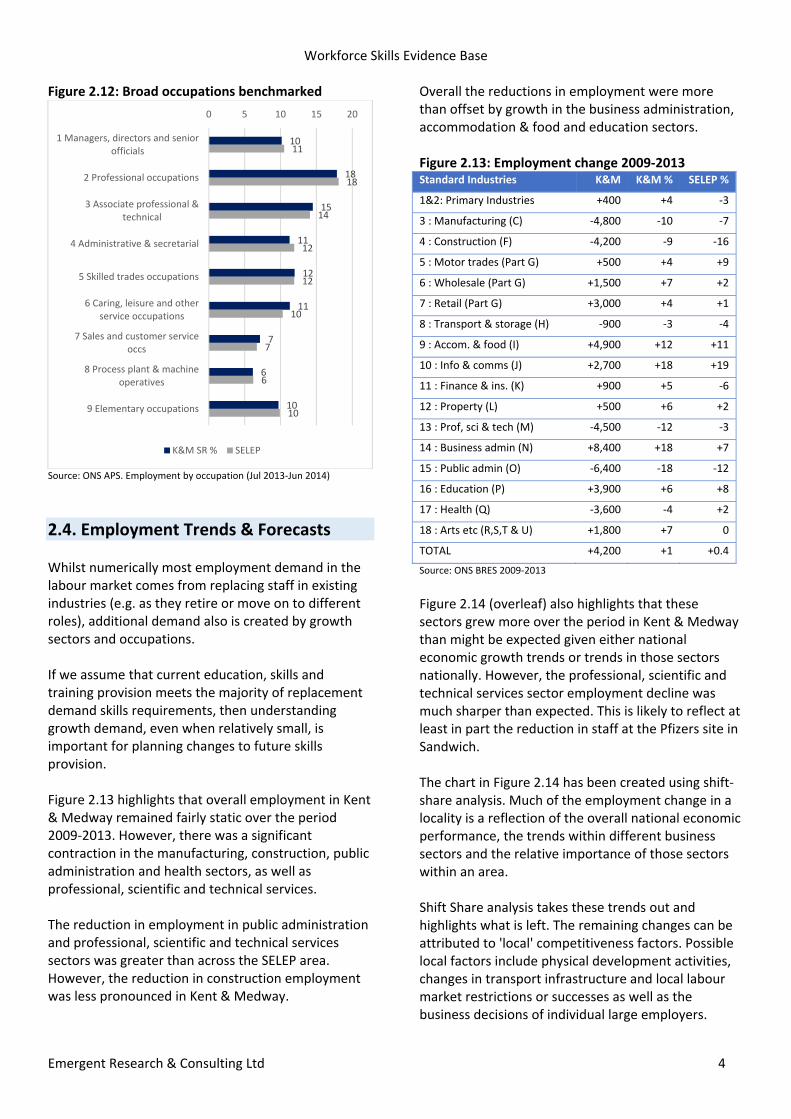
Figure 2.12: Broad occupations benchmarked
Source: ONS APS. Employment by occupation (Jul 2013‐Jun 2014)
2.4. Employment Trends & Forecasts Whilst numerically most employment demand in the labour market comes from replacing staff in existing industries (e.g. as they retire or move on to different roles), additional demand also is created by growth sectors and occupations. If we assume that current education, skills and training provision meets the majority of replacement demand skills requirements, then understanding growth demand, even when relatively small, is important for planning changes to future skills provision. Figure 2.13 highlights that overall employment in Kent & Medway remained fairly static over the period 2009‐2013. However, there was a significant contraction in the manufacturing, construction, public administration and health sectors, as well as professional, scientific and technical services. The reduction in employment in public administration and professional, scientific and technical services sectors was greater than across the SELEP area. However, the reduction in construction employment was less pronounced in Kent & Medway.
Overall the reductions in employment were more than offset by growth in the business administration, accommodation & food and education sectors. Figure 2.13: Employment change 2009‐2013 Standard Industries K&M K&M % SELEP %
1&2: Primary Industries +400 +4 ‐3
3 : Manufacturing (C) ‐4,800 ‐10 ‐7
4 : Construction (F) ‐4,200 ‐9 ‐16
5 : Motor trades (Part G) +500 +4 +9
6 : Wholesale (Part G) +1,500 +7 +2
7 : Retail (Part G) +3,000 +4 +1
8 : Transport & storage (H) ‐900 ‐3 ‐4
9 : Accom. & food (I) +4,900 +12 +11
10 : Info & comms (J) +2,700 +18 +19
11 : Finance & ins. (K) +900 +5 ‐6
12 : Property (L) +500 +6 +2
13 : Prof, sci & tech (M) ‐4,500 ‐12 ‐3
14 : Business admin (N) +8,400 +18 +7
15 : Public admin (O) ‐6,400 ‐18 ‐12
16 : Education (P) +3,900 +6 +8
17 : Health (Q) ‐3,600 ‐4 +2
18 : Arts etc (R,S,T & U) +1,800 +7 0
TOTAL +4,200 +1 +0.4
Source: ONS BRES 2009‐2013 Figure 2.14 (overleaf) also highlights that these sectors grew more over the period in Kent & Medway than might be expected given either national economic growth trends or trends in those sectors nationally. However, the professional, scientific and technical services sector employment decline was much sharper than expected. This is likely to reflect at least in part the reduction in staff at the Pfizers site in Sandwich. The chart in Figure 2.14 has been created using shift‐share analysis. Much of the employment change in a locality is a reflection of the overall national economic performance, the trends within different business sectors and the relative importance of those sectors within an area. Shift Share analysis takes these trends out and highlights what is left. The remaining changes can be attributed to 'local' competitiveness factors. Possible local factors include physical development activities, changes in transport infrastructure and local labour market restrictions or successes as well as the business decisions of individual large employers.
10
18
15
11
12
11
7
6
10
11
18
14
12
12
10
7
6
10
0 5 10 15 20
1 Managers, directors and seniorofficials
2 Professional occupations
3 Associate professional &technical
4 Administrative & secretarial
5 Skilled trades occupations
6 Caring, leisure and otherservice occupations
7 Sales and customer serviceoccs
8 Process plant & machineoperatives
9 Elementary occupations
K&M SR % SELEP
Workforce Skills Evidence Base
Emergent Research & Consulting Ltd 5
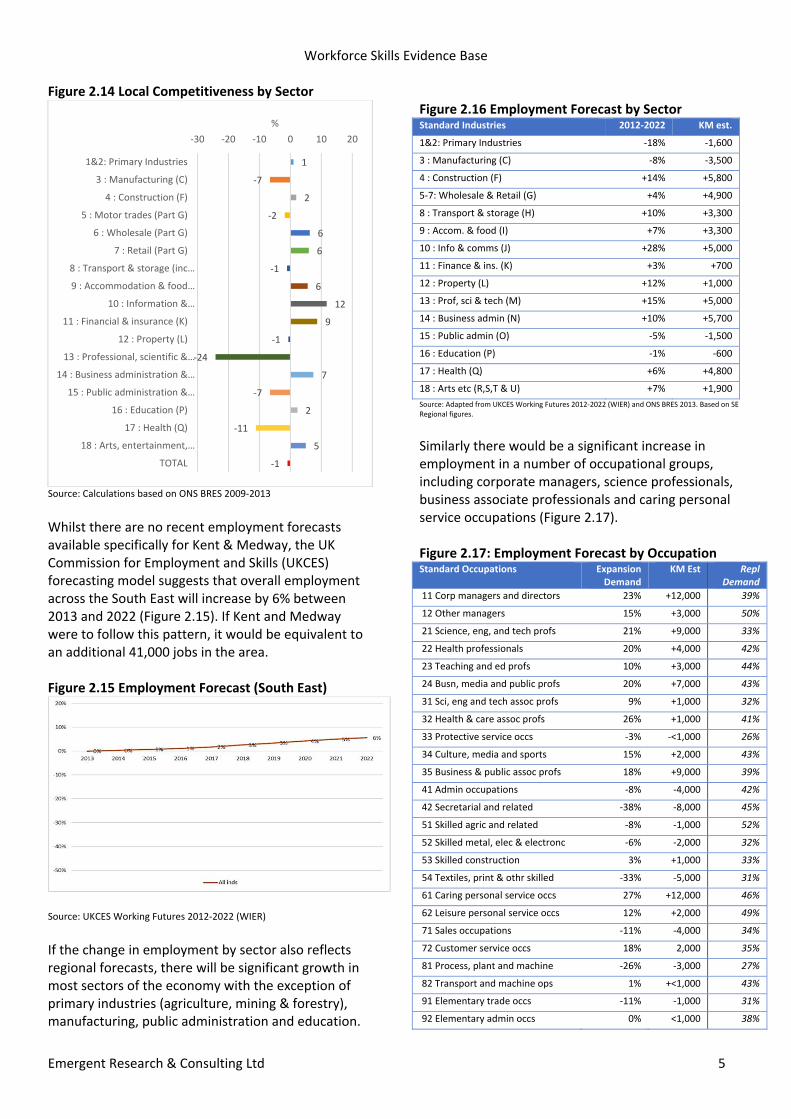
Figure 2.14 Local Competitiveness by Sector
Source: Calculations based on ONS BRES 2009‐2013
Whilst there are no recent employment forecasts available specifically for Kent & Medway, the UK Commission for Employment and Skills (UKCES) forecasting model suggests that overall employment across the South East will increase by 6% between 2013 and 2022 (Figure 2.15). If Kent and Medway were to follow this pattern, it would be equivalent to an additional 41,000 jobs in the area. Figure 2.15 Employment Forecast (South East)
Source: UKCES Working Futures 2012‐2022 (WIER)
If the change in employment by sector also reflects regional forecasts, there will be significant growth in most sectors of the economy with the exception of primary industries (agriculture, mining & forestry), manufacturing, public administration and education.
Figure 2.16 Employment Forecast by Sector Standard Industries 2012‐2022 KM est.
1&2: Primary Industries ‐18% ‐1,600
3 : Manufacturing (C) ‐8% ‐3,500
4 : Construction (F) +14% +5,800
5‐7: Wholesale & Retail (G) +4% +4,900
8 : Transport & storage (H) +10% +3,300
9 : Accom. & food (I) +7% +3,300
10 : Info & comms (J) +28% +5,000
11 : Finance & ins. (K) +3% +700
12 : Property (L) +12% +1,000
13 : Prof, sci & tech (M) +15% +5,000
14 : Business admin (N) +10% +5,700
15 : Public admin (O) ‐5% ‐1,500
16 : Education (P) ‐1% ‐600
17 : Health (Q) +6% +4,800
18 : Arts etc (R,S,T & U) +7% +1,900
Source: Adapted from UKCES Working Futures 2012‐2022 (WIER) and ONS BRES 2013. Based on SE Regional figures.
Similarly there would be a significant increase in employment in a number of occupational groups, including corporate managers, science professionals, business associate professionals and caring personal service occupations (Figure 2.17). Figure 2.17: Employment Forecast by Occupation Standard Occupations Expansion
Demand KM Est Repl
Demand
11 Corp managers and directors 23% +12,000 39%
12 Other managers 15% +3,000 50%
21 Science, eng, and tech profs 21% +9,000 33%
22 Health professionals 20% +4,000 42%
23 Teaching and ed profs 10% +3,000 44%
24 Busn, media and public profs 20% +7,000 43%
31 Sci, eng and tech assoc profs 9% +1,000 32%
32 Health & care assoc profs 26% +1,000 41%
33 Protective service occs ‐3% ‐<1,000 26%
34 Culture, media and sports 15% +2,000 43%
35 Business & public assoc profs 18% +9,000 39%
41 Admin occupations ‐8% ‐4,000 42%
42 Secretarial and related ‐38% ‐8,000 45%
51 Skilled agric and related ‐8% ‐1,000 52%
52 Skilled metal, elec & electronc ‐6% ‐2,000 32%
53 Skilled construction 3% +1,000 33%
54 Textiles, print & othr skilled ‐33% ‐5,000 31%
61 Caring personal service occs 27% +12,000 46%
62 Leisure personal service occs 12% +2,000 49%
71 Sales occupations ‐11% ‐4,000 34%
72 Customer service occs 18% 2,000 35%
81 Process, plant and machine ‐26% ‐3,000 27%
82 Transport and machine ops 1% +<1,000 43%
91 Elementary trade occs ‐11% ‐1,000 31%
92 Elementary admin occs 0% <1,000 38%
1
‐7
2
‐2
6
6
‐1
6
12
9
‐1
‐24
7
‐7
2
‐11
5
‐1
‐30 ‐20 ‐10 0 10 20
1&2: Primary Industries
3 : Manufacturing (C)
4 : Construction (F)
5 : Motor trades (Part G)
6 : Wholesale (Part G)
7 : Retail (Part G)
8 : Transport & storage (inc…
9 : Accommodation & food…
10 : Information &…
11 : Financial & insurance (K)
12 : Property (L)
13 : Professional, scientific &…
14 : Business administration &…
15 : Public administration &…
16 : Education (P)
17 : Health (Q)
18 : Arts, entertainment,…
TOTAL
%
Workforce Skills Evidence Base
Emergent Research & Consulting Ltd 6
Source: Adapted from UKCES Working Futures 2012‐2022 (WIER) and ONS BRES 2013. Based on SE Regional figures.
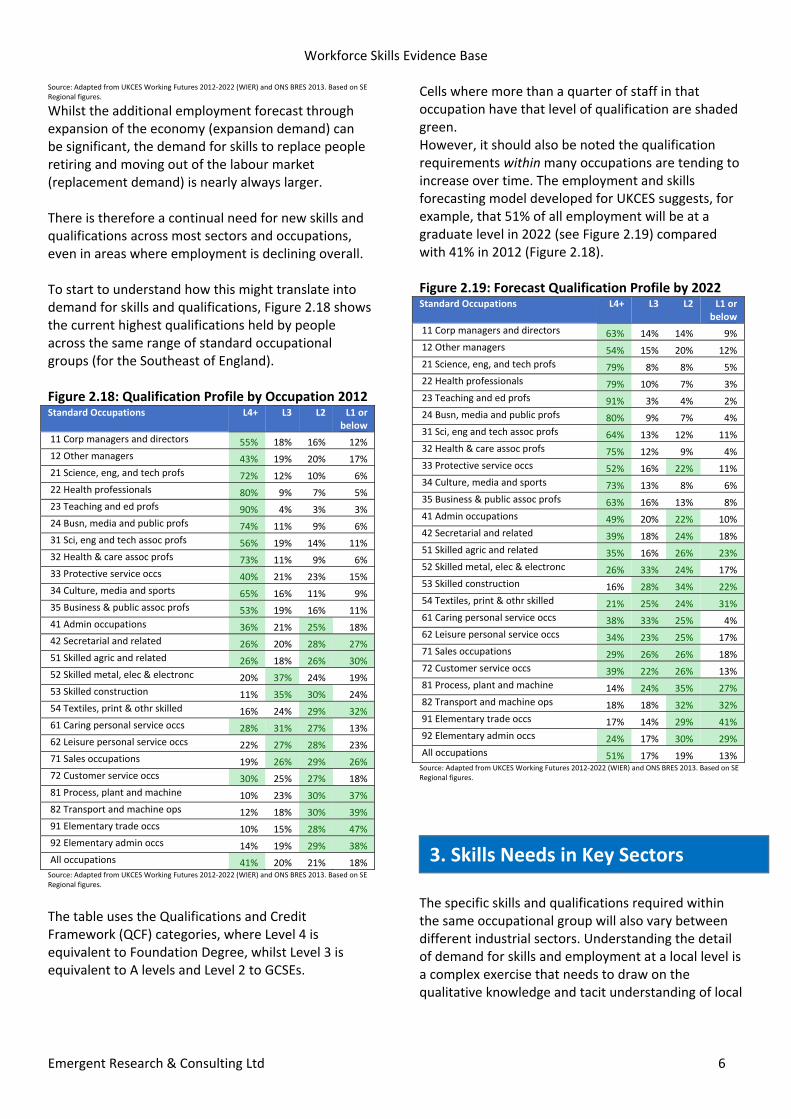
Whilst the additional employment forecast through expansion of the economy (expansion demand) can be significant, the demand for skills to replace people retiring and moving out of the labour market (replacement demand) is nearly always larger. There is therefore a continual need for new skills and qualifications across most sectors and occupations, even in areas where employment is declining overall. To start to understand how this might translate into demand for skills and qualifications, Figure 2.18 shows the current highest qualifications held by people across the same range of standard occupational groups (for the Southeast of England). Figure 2.18: Qualification Profile by Occupation 2012 Standard Occupations L4+ L3 L2 L1 or
below
11 Corp managers and directors 55% 18% 16% 12%
12 Other managers 43% 19% 20% 17%
21 Science, eng, and tech profs 72% 12% 10% 6%
22 Health professionals 80% 9% 7% 5%
23 Teaching and ed profs 90% 4% 3% 3%
24 Busn, media and public profs 74% 11% 9% 6%
31 Sci, eng and tech assoc profs 56% 19% 14% 11%
32 Health & care assoc profs 73% 11% 9% 6%
33 Protective service occs 40% 21% 23% 15%
34 Culture, media and sports 65% 16% 11% 9%
35 Business & public assoc profs 53% 19% 16% 11%
41 Admin occupations 36% 21% 25% 18%
42 Secretarial and related 26% 20% 28% 27%
51 Skilled agric and related 26% 18% 26% 30%
52 Skilled metal, elec & electronc 20% 37% 24% 19%
53 Skilled construction 11% 35% 30% 24%
54 Textiles, print & othr skilled 16% 24% 29% 32%
61 Caring personal service occs 28% 31% 27% 13%
62 Leisure personal service occs 22% 27% 28% 23%
71 Sales occupations 19% 26% 29% 26%
72 Customer service occs 30% 25% 27% 18%
81 Process, plant and machine 10% 23% 30% 37%
82 Transport and machine ops 12% 18% 30% 39%
91 Elementary trade occs 10% 15% 28% 47%
92 Elementary admin occs 14% 19% 29% 38%
All occupations 41% 20% 21% 18% Source: Adapted from UKCES Working Futures 2012‐2022 (WIER) and ONS BRES 2013. Based on SE Regional figures.
The table uses the Qualifications and Credit Framework (QCF) categories, where Level 4 is equivalent to Foundation Degree, whilst Level 3 is equivalent to A levels and Level 2 to GCSEs.
Cells where more than a quarter of staff in that occupation have that level of qualification are shaded green. However, it should also be noted the qualification requirements within many occupations are tending to increase over time. The employment and skills forecasting model developed for UKCES suggests, for example, that 51% of all employment will be at a graduate level in 2022 (see Figure 2.19) compared with 41% in 2012 (Figure 2.18). Figure 2.19: Forecast Qualification Profile by 2022 Standard Occupations L4+ L3 L2 L1 or
below
11 Corp managers and directors 63% 14% 14% 9%
12 Other managers 54% 15% 20% 12%
21 Science, eng, and tech profs 79% 8% 8% 5%
22 Health professionals 79% 10% 7% 3%
23 Teaching and ed profs 91% 3% 4% 2%
24 Busn, media and public profs 80% 9% 7% 4%
31 Sci, eng and tech assoc profs 64% 13% 12% 11%
32 Health & care assoc profs 75% 12% 9% 4%
33 Protective service occs 52% 16% 22% 11%
34 Culture, media and sports 73% 13% 8% 6%
35 Business & public assoc profs 63% 16% 13% 8%
41 Admin occupations 49% 20% 22% 10%
42 Secretarial and related 39% 18% 24% 18%
51 Skilled agric and related 35% 16% 26% 23%
52 Skilled metal, elec & electronc 26% 33% 24% 17%
53 Skilled construction 16% 28% 34% 22%
54 Textiles, print & othr skilled 21% 25% 24% 31%
61 Caring personal service occs 38% 33% 25% 4%
62 Leisure personal service occs 34% 23% 25% 17%
71 Sales occupations 29% 26% 26% 18%
72 Customer service occs 39% 22% 26% 13%
81 Process, plant and machine 14% 24% 35% 27%
82 Transport and machine ops 18% 18% 32% 32%
91 Elementary trade occs 17% 14% 29% 41%
92 Elementary admin occs 24% 17% 30% 29%
All occupations 51% 17% 19% 13% Source: Adapted from UKCES Working Futures 2012‐2022 (WIER) and ONS BRES 2013. Based on SE Regional figures.
The specific skills and qualifications required within the same occupational group will also vary between different industrial sectors. Understanding the detail of demand for skills and employment at a local level is a complex exercise that needs to draw on the qualitative knowledge and tacit understanding of local
3. Skills Needs in Key Sectors
Workforce Skills Evidence Base
Emergent Research & Consulting Ltd 7
businesses and people as well as statistical labour market intelligence. To this end preparation work for the Kent and Medway Workforce Skills Evidence Base included discussions with representatives from a number of potential key sectors in Kent & Medway. Twelve sectors were identified:
Agriculture & horticulture
Engineering & Manufacturing
Construction
Retail
Transport & Logistics
Tourism & Hospitality
Finance & business services
Health & Social care
Energy & Utilities
Life Sciences
Digital & Media
Arts & Creative For each sector a summary of labour market statistics and skills issues identified nationally was prepared (see Annexes 2‐13) and discussed with sector representatives and stakeholders. The conclusions of the discussions are outlined below in Section 3.2.
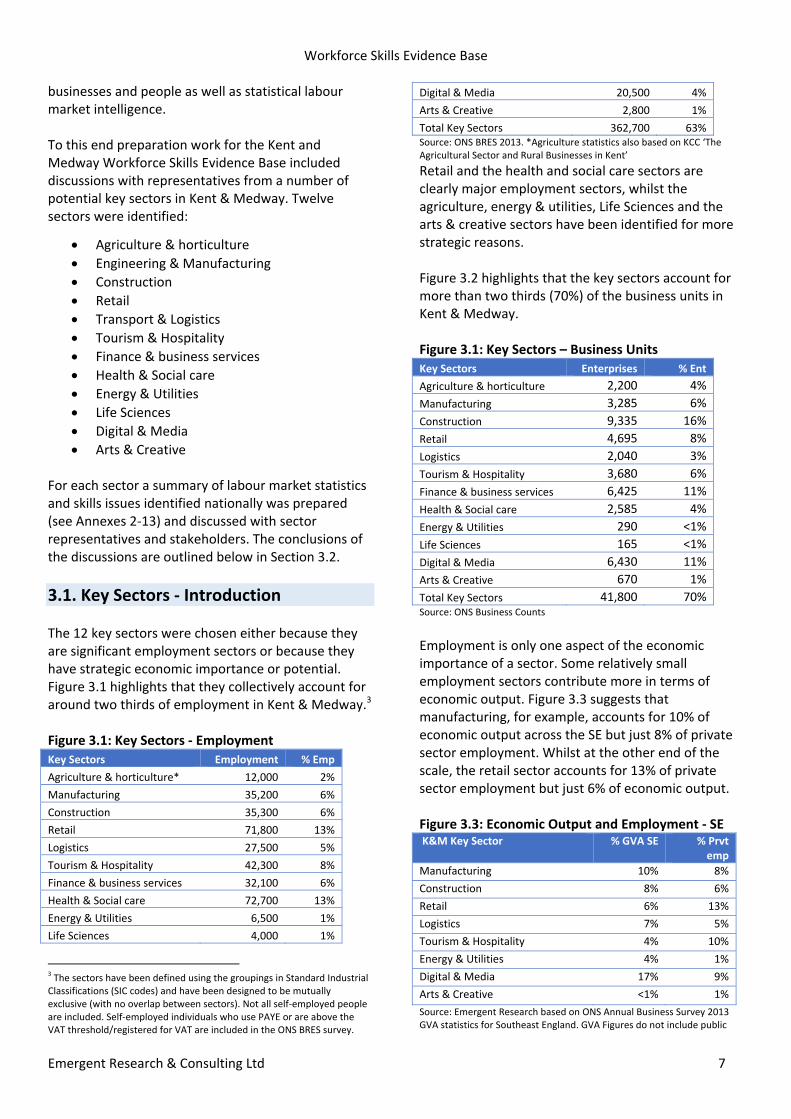
3.1. Key Sectors ‐ Introduction The 12 key sectors were chosen either because they are significant employment sectors or because they have strategic economic importance or potential. Figure 3.1 highlights that they collectively account for around two thirds of employment in Kent & Medway.3 Figure 3.1: Key Sectors ‐ Employment
Key Sectors Employment % Emp
Agriculture & horticulture* 12,000 2%
Manufacturing 35,200 6%
Construction 35,300 6%
Retail 71,800 13%
Logistics 27,500 5%
Tourism & Hospitality 42,300 8%
Finance & business services 32,100 6%
Health & Social care 72,700 13%
Energy & Utilities 6,500 1%
Life Sciences 4,000 1%
3 The sectors have been defined using the groupings in Standard Industrial Classifications (SIC codes) and have been designed to be mutually exclusive (with no overlap between sectors). Not all self‐employed people are included. Self‐employed individuals who use PAYE or are above the VAT threshold/registered for VAT are included in the ONS BRES survey.
Digital & Media 20,500 4%
Arts & Creative 2,800 1%
Total Key Sectors 362,700 63% Source: ONS BRES 2013. *Agriculture statistics also based on KCC ‘The Agricultural Sector and Rural Businesses in Kent’
Retail and the health and social care sectors are clearly major employment sectors, whilst the agriculture, energy & utilities, Life Sciences and the arts & creative sectors have been identified for more strategic reasons. Figure 3.2 highlights that the key sectors account for more than two thirds (70%) of the business units in Kent & Medway. Figure 3.1: Key Sectors – Business Units
Key Sectors Enterprises % Ent
Agriculture & horticulture 2,200 4%
Manufacturing 3,285 6%
Construction 9,335 16%
Retail 4,695 8%
Logistics 2,040 3%
Tourism & Hospitality 3,680 6%
Finance & business services 6,425 11%
Health & Social care 2,585 4%
Energy & Utilities 290 <1%
Life Sciences 165 <1%
Digital & Media 6,430 11%
Arts & Creative 670 1%
Total Key Sectors 41,800 70% Source: ONS Business Counts
Employment is only one aspect of the economic importance of a sector. Some relatively small employment sectors contribute more in terms of economic output. Figure 3.3 suggests that manufacturing, for example, accounts for 10% of economic output across the SE but just 8% of private sector employment. Whilst at the other end of the scale, the retail sector accounts for 13% of private sector employment but just 6% of economic output. Figure 3.3: Economic Output and Employment ‐ SE K&M Key Sector % GVA SE % Prvt
emp
Manufacturing 10% 8%
Construction 8% 6%
Retail 6% 13%
Logistics 7% 5%
Tourism & Hospitality 4% 10%
Energy & Utilities 4% 1%
Digital & Media 17% 9%
Arts & Creative <1% 1%
Source: Emergent Research based on ONS Annual Business Survey 2013 GVA statistics for Southeast England. GVA Figures do not include public
Workforce Skills Evidence Base
Emergent Research & Consulting Ltd 8
sector organisations or financial services. Figures also not currently available for Lifesciences or agriculture sectors.
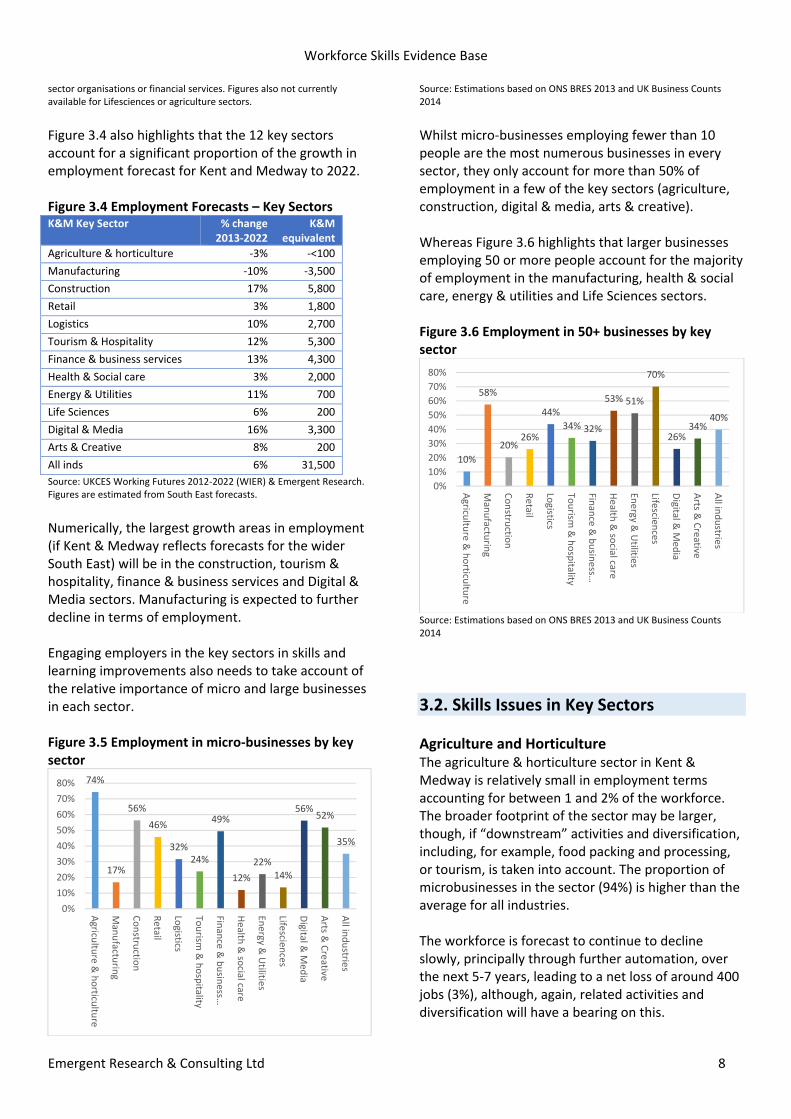
Figure 3.4 also highlights that the 12 key sectors account for a significant proportion of the growth in employment forecast for Kent and Medway to 2022. Figure 3.4 Employment Forecasts – Key Sectors K&M Key Sector % change
2013‐2022 K&M
equivalent
Agriculture & horticulture ‐3% ‐<100
Manufacturing ‐10% ‐3,500
Construction 17% 5,800
Retail 3% 1,800
Logistics 10% 2,700
Tourism & Hospitality 12% 5,300
Finance & business services 13% 4,300
Health & Social care 3% 2,000
Energy & Utilities 11% 700
Life Sciences 6% 200
Digital & Media 16% 3,300
Arts & Creative 8% 200
All inds 6% 31,500
Source: UKCES Working Futures 2012‐2022 (WIER) & Emergent Research. Figures are estimated from South East forecasts.
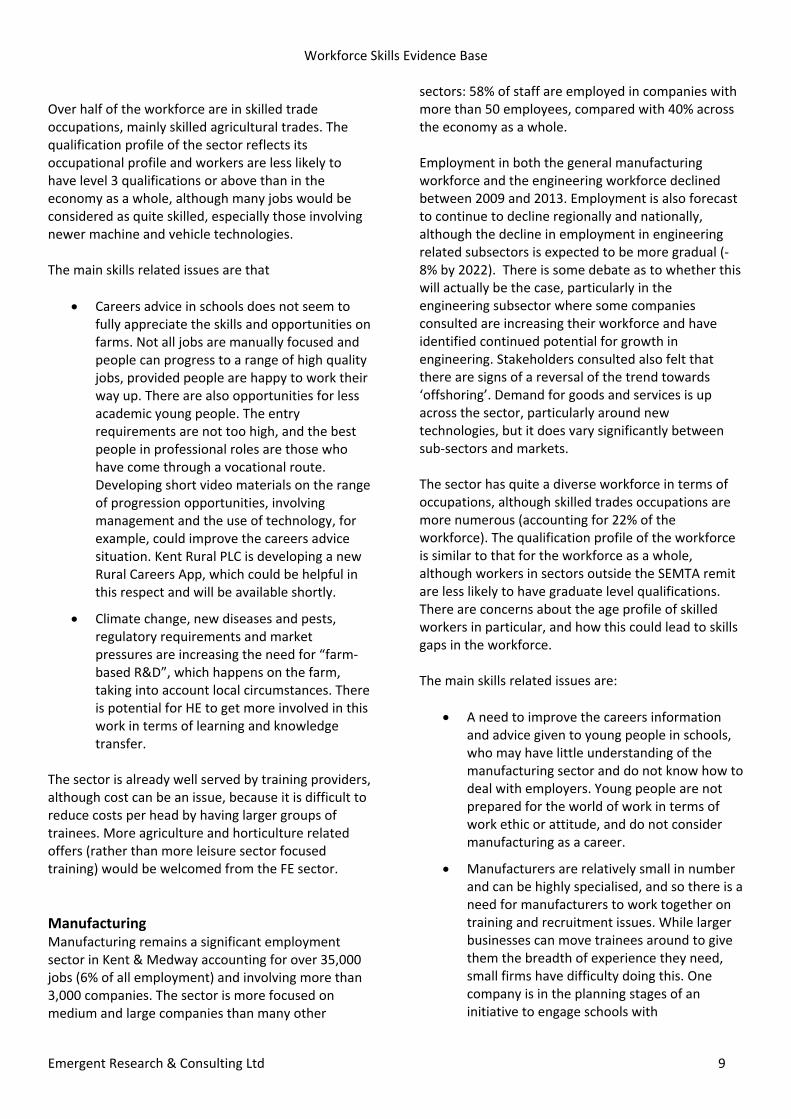
Numerically, the largest growth areas in employment (if Kent & Medway reflects forecasts for the wider South East) will be in the construction, tourism & hospitality, finance & business services and Digital & Media sectors. Manufacturing is expected to further decline in terms of employment. Engaging employers in the key sectors in skills and learning improvements also needs to take account of the relative importance of micro and large businesses in each sector. Figure 3.5 Employment in micro‐businesses by key sector
Source: Estimations based on ONS BRES 2013 and UK Business Counts 2014
Whilst micro‐businesses employing fewer than 10 people are the most numerous businesses in every sector, they only account for more than 50% of employment in a few of the key sectors (agriculture, construction, digital & media, arts & creative). Whereas Figure 3.6 highlights that larger businesses employing 50 or more people account for the majority of employment in the manufacturing, health & social care, energy & utilities and Life Sciences sectors. Figure 3.6 Employment in 50+ businesses by key sector
Source: Estimations based on ONS BRES 2013 and UK Business Counts 2014
3.2. Skills Issues in Key Sectors
Agriculture and Horticulture The agriculture & horticulture sector in Kent & Medway is relatively small in employment terms accounting for between 1 and 2% of the workforce. The broader footprint of the sector may be larger, though, if “downstream” activities and diversification, including, for example, food packing and processing, or tourism, is taken into account. The proportion of microbusinesses in the sector (94%) is higher than the average for all industries. The workforce is forecast to continue to decline slowly, principally through further automation, over the next 5‐7 years, leading to a net loss of around 400 jobs (3%), although, again, related activities and diversification will have a bearing on this.
74%
17%
56%
46%
32%24%
49%
12%
22%
14%
56%52%
35%
0%
10%
20%
30%
40%
50%
60%
70%
80%
Agricu
lture & horticu
lture
Manufactu
ring
Constru
ction
Retail
Logistics
Tourism
& hospitality
Finance & busin
ess…
Health
& so
cial care
Energy &
Utilities
Lifescien
ces
Digital &
Media
Arts &
Creative
All in
dustrie
s
10%
58%
20%26%
44%
34% 32%
53% 51%
70%
26%34%
40%
0%
10%
20%
30%
40%
50%
60%
70%
80%
Agricu
lture & horticu
lture
Manufactu
ring
Constru
ction
Retail
Logistics
Tourism
& hospitality
Finance & busin
ess…
Health
& so
cial care
Energy &
Utilities
Lifescien
ces
Digital &
Media
Arts &
Creative
All in
dustrie
s
Workforce Skills Evidence Base
Emergent Research & Consulting Ltd 9
Over half of the workforce are in skilled trade occupations, mainly skilled agricultural trades. The qualification profile of the sector reflects its occupational profile and workers are less likely to have level 3 qualifications or above than in the economy as a whole, although many jobs would be considered as quite skilled, especially those involving newer machine and vehicle technologies. The main skills related issues are that
Careers advice in schools does not seem to fully appreciate the skills and opportunities on farms. Not all jobs are manually focused and people can progress to a range of high quality jobs, provided people are happy to work their way up. There are also opportunities for less academic young people. The entry requirements are not too high, and the best people in professional roles are those who have come through a vocational route. Developing short video materials on the range of progression opportunities, involving management and the use of technology, for example, could improve the careers advice situation. Kent Rural PLC is developing a new Rural Careers App, which could be helpful in this respect and will be available shortly.
Climate change, new diseases and pests, regulatory requirements and market pressures are increasing the need for “farm‐based R&D”, which happens on the farm, taking into account local circumstances. There is potential for HE to get more involved in this work in terms of learning and knowledge transfer.
The sector is already well served by training providers, although cost can be an issue, because it is difficult to reduce costs per head by having larger groups of trainees. More agriculture and horticulture related offers (rather than more leisure sector focused training) would be welcomed from the FE sector.
Manufacturing Manufacturing remains a significant employment sector in Kent & Medway accounting for over 35,000 jobs (6% of all employment) and involving more than 3,000 companies. The sector is more focused on medium and large companies than many other
sectors: 58% of staff are employed in companies with more than 50 employees, compared with 40% across the economy as a whole. Employment in both the general manufacturing workforce and the engineering workforce declined between 2009 and 2013. Employment is also forecast to continue to decline regionally and nationally, although the decline in employment in engineering related subsectors is expected to be more gradual (‐8% by 2022). There is some debate as to whether this will actually be the case, particularly in the engineering subsector where some companies consulted are increasing their workforce and have identified continued potential for growth in engineering. Stakeholders consulted also felt that there are signs of a reversal of the trend towards ‘offshoring’. Demand for goods and services is up across the sector, particularly around new technologies, but it does vary significantly between sub‐sectors and markets. The sector has quite a diverse workforce in terms of occupations, although skilled trades occupations are more numerous (accounting for 22% of the workforce). The qualification profile of the workforce is similar to that for the workforce as a whole, although workers in sectors outside the SEMTA remit are less likely to have graduate level qualifications. There are concerns about the age profile of skilled workers in particular, and how this could lead to skills gaps in the workforce. The main skills related issues are:
A need to improve the careers information and advice given to young people in schools, who may have little understanding of the manufacturing sector and do not know how to deal with employers. Young people are not prepared for the world of work in terms of work ethic or attitude, and do not consider manufacturing as a career.
Manufacturers are relatively small in number and can be highly specialised, and so there is a need for manufacturers to work together on training and recruitment issues. While larger businesses can move trainees around to give them the breadth of experience they need, small firms have difficulty doing this. One company is in the planning stages of an initiative to engage schools with
Workforce Skills Evidence Base
Emergent Research & Consulting Ltd 10
manufacturing which might involve using a building they have in East Kent. Such an initiative could provide a focus for collaboration and involve other firms, with the potential to become a hub for schools and companies, involved in visits, placements, and lower‐cost sector‐focused training. There is a lot of goodwill and support in the sector for working together, perhaps through a new Manufacturing Partnership, to overcome some of the skills issues faced but resource is needed for co‐ordination.
There are a range of workforce development needs, including change management and to support the introduction of process and quality management standards like Six Sigma that are being pushed down the supply chain. There are also very specific requirements in areas like welding, where the FE sector has been quite responsive.
Construction Construction employs over 35,000 people in Kent and Medway, accounting for around 6% of the workforce. Although employment in the sector fell by around 3,200 between 2008 and 2013, it is expected to grow up to 2022. National and regional forecasts suggest that this expansion could create around 6,000 new jobs, but some industry sources put this number much higher. The construction workforce is more volatile than that of the economy as a whole: more jobs are lost in times of recession, but more jobs are added when growth returns. This means that the economic recovery is likely to especially ramp up demand for construction workers, with the workforce forecast to grow by 17% from 2013 to 2022 (for the economy as a whole the figure is only 6%). Skilled trades occupations account for around 50% of the construction workforce, compared with 10% for the economy as a whole, and people employed in the sector are generally less well qualified than the overall workforce in terms of qualification levels. This is especially the case for Higher Level qualifications (QCF Level 4+), although there are significant numbers of
people with such qualifications in activities like architecture.4 Figures from the Construction Skills Network suggest that across the South East of England, architects, plant mechanics and fitters and steel erectors/structural fabrication workers are in particularly short supply at the moment.5 The main skills‐related issues that the sector faces according to the stakeholders consulted are:
There is scope for a more integrated and coordinated, sector‐led approach to working with education and careers services, building on existing work, but also potentially involving the CITB, the Construction Guild and recruitment companies. This kind of sector‐led approach has been taken with STEM and proved to be successful. In particular, more could be done to improve the image of the sector, with more emphasis on information to young people about higher level roles and vocational routes into these.
It is essential that young people have general work readiness skills in areas like communication and basic time keeping, and then get the support and mentoring they need once they are in a firm. This is usually possible in 50+ firms, but is much more of a challenge in smaller companies. Supply chain based consortium approaches can be very helpful in this respect (as was trialled under the Employer Ownership of Skills initiative).
The local Constructing Excellence Group would welcome more engagement from HE and FE on Building Information Modelling (BIM). It is especially relevant to new engineers and architects, who can lack basic industry standard practical skills like AutoCAD, and need more awareness of BIM. This issue is also of broader relevance to the teaching of subjects like IT and Design Technology.
Sub‐contracting and self‐employment militates against skills development in the sector as more traditional employment tends to be associated with higher levels of training
4 Architecture is not included in the construction statistics in this paper as only the broad architecture and engineering services category is available, the majority of which is not construction related. 5 Construction Skills Network data provided by CITB 07/08/15
Workforce Skills Evidence Base
Emergent Research & Consulting Ltd 11
activity. Similarly, the way in which supply chains are managed can play an important role in company behaviour on training and skills. Companies in a supply chain usually have the craft or technical skills, but may lack more generic skills like project management, people management and organisation. Increasingly, contractors may not have tradespeople on the payroll, but perform mainly a contract management function working with sub‐contractors.
There are challenges with Apprenticeships: low wages are an important issue (and can make it not viable for someone to undertake an Apprenticeship) and employers need the right support to deal with some of the operational aspects of delivering Apprenticeship frameworks, and so need the right kind of support.
Retail The retail sector is a very significant employment sector in Kent & Medway accounting for 13% of the workforce and is well represented across the area as a whole. Many Districts have higher than national proportions of employment in the sector and there is a particularly large concentration of retail employment in Dartford in particular (which includes the Bluewater development). Although some retail employers are very large, microbusinesses with fewer than 10 staff employ a larger proportion of the workforce than they do across the economy as a whole (46% compared with 35%). Employment in the sector within Kent & Medway grew by 5% between 2009 and 2013, but forecasts suggest that the sector is not expected to grow as fast as overall employment over the next 5‐7 years. Nevertheless, the size of the sector means that modest growth (3%) could translate to an additional requirement of 2‐3,000 staff by 2022. Local intelligence, however, suggests that employment growth may be more likely to track employment growth in the economy as a whole, as it always has done historically. Nearly half (45%) of all employment in the sector is focused in sales and customer services occupations. The qualification profile of the workforce is comparatively focused on lower level qualifications. Only 46% of the workforce have a level 3 qualification
(compared with 61% of all workers). However, this should not be taken to mean that retail workers are necessarily unskilled. Soft skills are not easily tested, which can make retail qualifications less relevant. The main skills related issues are:
The likelihood of recruitment difficulties increasing for the retail sector, particularly in the short to medium term in North Kent, given the overall growth of the economy and potential competition for staff from, for example, construction jobs for Ebbsfleet Garden City and the anticipated Paramount complex. There are already signs that the retail labour market is tighter than just a year ago. In addition, because unemployment has fallen, it is more challenging to prepare unemployed candidates for work, given that they now tend to be people who are further away from the labour market.
The image of the sector as a stopgap also remains an issue. The role the sector has in developing soft skills like customer service that young people then take into other sectors is not widely recognised and giving the size of retail is a major benefit for the UK economy. But it is nevertheless true that more young people could actively seek a career through retail rather than seeing it as a failure or just a way of getting some money. The potential to develop a career from retail, including using retail as an entry route to related careers in HR, administration, visual merchandising, logistics etc is not sold to young people.
A key part of the success of the Learning Shop at Bluewater is that it is not really perceived as an FE / Jobcentre Plus initiative, and is also down to pre‐screening and support for unemployed job candidates, and by acting as a single point of contact through which all job applications flow.
Transport and Logistics Logistics is a significant employment sector in Kent & Medway accounting for 5% of the workforce. Employment in the sector is particularly concentrated in areas well served by motorways near London and the port towns, with higher than average employment concentrations in Dartford, Gravesham and Tonbridge

Workforce Skills Evidence Base
Emergent Research & Consulting Ltd 12
& Malling and in Dover, Shepway and Swale. Although the majority of logistics businesses are microbusinesses employing fewer than 10 staff, employment is slightly more likely to be concentrated in medium and large businesses (44% in businesses with 50+ staff) than the average for all industries. There are also factors which are particular to certain activities and to the area. For example, around 50% of all drivers are aged 50 or over, while only 15% of drivers are under 25 and only 1% are women. The Kent and Medway is influenced by the “pull” of London and ease of access to it, as well as existing and new employment hotspots around the South East. Parts of Kent can be less attractive as a place to work than some other locations in the wider region. Employment trends in the period between 2009 and 2013 were somewhat erratic but the sector is forecast to grow regionally in terms of employment at a faster rate than the economy overall. This could translate into a need for an additional 2‐3,000 workers in the sector in Kent & Medway by 2022.
Around a third of the workforce are transport and mobile machine operatives (drivers) and the qualification profile of the sector is more focused on low level qualifications than the all industry average. Some 57% of logistics workers do not have a level 3 qualification (compared with 39% across all industries). Key skills related issues are:
The need to make the sector more attractive to new entrants by highlighting, for example, how much technology is used now. But there are wider barriers than skills: the lack of driver facilities makes the sector very unattractive, especially to women. And in Kent, especially, logistics is associated with “horror stories”, such as those associated with Operation Stack. It seems that schools tend to push university, rather than more vocational subjects and careers. But there are good career and progression opportunities in logistics, with a wide range of roles. The challenge is for schools and careers services to communicate these opportunities better and change perceptions: about a third of jobs are in driving, but the other two thirds are in areas like planning, management, distribution and logistics.
Regulation is an important issue, and there is gap between people leaving school to the time when they can drive an HGV. This situation is now becoming more challenging because the Government will soon stop funding Apprenticeships because they are not 12 months long. Organisations like the Freight Transport Association are also working with insurers to encourage them to be more positive about drivers under the age of 25. The cost of HGV licences is high, and access to vocational learning loans would be helpful to address the potential risk of driver shortages.
On workforce development, the needs vary a lot by the type of organisation, but some are very particular and difficult to address, such as quite specialised welding, electrical and mechanical engineering skills. CPC (Certificate of Professional Competence) qualifications (for drivers and transport managers) are a common requirement in respect of driver based activities, and larger companies will often do this internally or with recourse to an external provider.
Tourism and Hospitality Tourism and hospitality is a major sector in terms of employment, accounting for 8% of the workforce, although the Cambridge Economic Impact Model6 used by Visit Kent suggests the figure is more like 12%.7 The sector has a higher proportion of small businesses with 10‐49 staff than most other sectors accounting for 42% of employment (compared with 25% across the economy as a whole). Nearly half (47%) of the workforce in tourism & hospitality are in elementary service occupations and the qualification profile of the workforce is significantly lower than the average for all industries with 55% of workers qualified to Level 2 or below. Sector stakeholders argue that this should not be seen as a “weakness” of the sector relative to others. The qualification profile reflects the nature of the sector, and its contribution to the economy in providing many entry‐level jobs in high volumes to young people and
6 COOL Programme Partners, Feb 2015. ‘Economic Impact Research ‐ The
Economic Impact of the Kent Visitor Economy in 2013’. The South West Research Company Ltd. 7 The Model estimates employment as a result of tourism across a range
of standard industrial sectors, including retail and transport & distribution as well as accommodation, food and catering.
Workforce Skills Evidence Base
Emergent Research & Consulting Ltd 13
others, including those with lower levels of qualifications and older people. Stakeholders feel that, for those with the right employability and soft skills, it is possible to enter the sector and progress into more senior roles. The new National Living Wage will be a challenge for employers, but could also help to address the issue of negative perceptions of work in the sector. Employment in the sector is forecast regionally to grow at twice the rate of the overall economy which could mean demand for an extra 5‐6,000 workers in Kent & Medway by 2022. Visit Kent’s forecast suggest this figure could be higher, given new visitor infrastructure and local strategies to increase visitor numbers. In addition, London Paramount Park, if it goes ahead, could create between 20,000 and 25,000. Key skills related issues are:
The image of the sector needs to be improved and people helped to see the many career opportunities therein, if people are to be recruited in the numbers expected.
There is an opportunity to address skills issues in a sector‐led way through the KCC‐supported Tourism and Hospitality Guild, if extra resources can be secured for facilitation of the network and to deliver projects, including, for example, its idea for a work experience “Kent Passport” and collaborative activity to increase the take up of Apprenticeships.
A specific challenge if that skilled people often look to London for career progression, when there are good opportunities in Kent.
Customer service skills are of strategic importance if the sector is to grow as planned.
A need to drive the professionalisation of management in the sector, especially for small businesses. This requires both skills training and business support to help companies take the “next step”.
Financial and Business Services Finance & Business Services is a very broad and significant employment sector nationally and in Kent & Medway accounts for 6% of overall employment. For the most part local employment in the sector is
less prominent than in the UK as a whole. However, the District of Tunbridge Wells is an exception and contains nearly a fifth of Kent & Medway’s employment in the sector. The sector has a large number of microbusinesses and these account for 49% of all employment in the sector (compared with 35% across the economy as a whole). Employment in the sector in Kent & Medway was fairly static over the period 2009 to 2013 but is forecast regionally and nationally to grow more strongly than the overall economy over the next 5‐7 years. If Kent & Medway were to reflect these forecasts, this would suggest the need for an additional 4‐5,000 workers by 2022. However, some caution is needed with these figures. Local intelligence suggests that, the banking sector, for example, is continuing to centralise administration functions, but to lower cost locations, suggesting that there is likely to be contraction in the local workforce. The Finance & Business Services workforce has a much more highly qualified workforce profile than the ‘all industry’ average, with nearly half (49%) of all workers qualified to at least degree level. More than half of the workforce are in professional or associate professional occupations. This very broad sector has a range of skills needs. This includes an ongoing need for Professional and Associate Professional staff to continually develop their specialist and technical skills. There is also a need for IT skills and training in the use of new technologies. Management and leadership skills are likely to be in continual demand for the sector to be responsive to new market opportunities, changes in regulation and to compete in an increasingly globalised economy. Customer service skills are an ongoing requirement among customer‐facing staff to maintain high levels of service. Risk management and regulatory compliance is deemed a high priority among all occupational groups in Financial, insurance and other professional services. A key general requirement is general work readiness, communication skills and personal presentation, as well as basic maths and English.
Health and Social Care The Health & Social Care Sector is a major employment sector in Kent & Medway accounting for 13% of the employment (over 72,000 people).
Workforce Skills Evidence Base
Emergent Research & Consulting Ltd 14
Employment in the sector is more focused in medium and large organisations (50+ employees) than the average for all industries (53% compared with 40%). Employment in the sector has a dual structure with a significant proportion of highly qualified professionals (29%) and a large number of people employed in personal service occupations with intermediate level qualifications. Employment is forecast to grow by 2‐3,000 workers in the sector by 2022, but the new National Living Wage could have a significant effect on the employment in the sector and reduce the likelihood of such growth. Key issues identified by stakeholders for the care sector are:
In workforce development continued need to focus on frontline care skills, as driven by the CQC.
Recruitment is a challenge and more people need to be attracted into the sector, including through communicating better with schools, and colleges to engage young people and make the sector more attractive to them. The key thing is to create an appetite in young people to work in care by communicating better what happens in the sector – what people do, how people help, why it all makes a difference. There could also be scope to recruit more young people, including through Apprenticeships.
Energy and Utilities The Energy & Utilities sector is a relatively small employment sector within Kent & Medway accounting for just 1% of employment. Employment in the sector is relatively concentrated in medium and large employers (50+ employees), who employ 51% of the workforce (compared with 40% across all industries). There is also a large number of people working in contracted out services in activities like power generation, but these people are also very mobile and might work across the country, rather than be local. The sector is forecast to grow regionally at a faster rate than the overall economy. This could mean a demand for an additional 5‐700 workers in Kent & Medway by 2022. The sector has quite a diverse workforce with many different occupations and the qualification profile of the workforce is similar to the all industry average.
However workers are slightly less likely to have graduate level qualifications (29% compared with 35% across all industries). In energy generation graduate level qualifications are more in demand now than in the past, and the market is moving more towards requiring qualifications generally. This is driven in part by compliance requirements. Large companies face few recruitment problems, except for very specialist roles. Smaller renewables companies may find that they have lots of Apprenticeship applicants, but there are fewer people with specialist experience in technologies like biomass. So they tend to get people with a more general skills set and train them up.
Life Sciences Life Sciences employs 4,000 people and has 165 companies (although research by Locate in Kent puts the employment figure at 7,000) in a range of activities, including a burgeoning Med Tech sub‐sector, which in itself includes medical devices and diagnostics. Larger businesses account for most employment, but much of the growth and innovation is in smaller companies, which are creating new jobs and attracting inward investment. Employment overall, though, has fallen significantly since the ending of many Pfizer operations at Sandwich. National and regional forecasts suggest that the sector will grow by about 6% by 2022, in line with the economy as a whole. However, local circumstances suggest that the growth opportunity could be greater in Kent, given the strategic commitment of KCC to the knowledge economy and innovation; the facilities, support (including Biogateway and the advocacy of Locate in Kent) and employment space at Discovery Park; the area’s excellent connections to mainland Europe; and the knowledge and skills legacy of Pfizer. The workforce is predominantly professional and highly qualified with the most skilled professionals operating in a national and international labour market. Companies tend to have very varied and specific skills needs, although having soft skills and the right “mind set” is important, especially in smaller, more entrepreneurial companies. The key skills related issues that merit further attention are:

Workforce Skills Evidence Base
Emergent Research & Consulting Ltd 15
The interface with schools, colleges and HE could be improved in terms of the processes involved in, for example, Apprenticeships and working with HE, which are too complex. The whole system seems very fragmented.
There is a need to market better the opportunities in the sector to parents, young people and school Heads in order to build understanding of actual jobs, careers, choices and qualifications (including Apprenticeships).
Biogateway, which has held events at Discovery Park and Kent Science Park, is working to address this knowledge gap through, for example, its work with EBP and others on the “Young Biogateway” project (which creates a 9‐month programme for Year 10 students). Practice like this could provide the basis for a more coordinated approach to the sector in terms of improving the interface with the education system and helping local people connect better the work and career options that are available.
Digital and Media The sector employs over 20,000 people in Kent and Medway and makes up 4% of the employed workforce. Micro‐businesses (with up to 9 staff) account for 95% of firms in the sector (88% for the economy as a whole). Freelancers play a significant role in the sector, and can grow into businesses that employ more people. Kent and Medway benefits from being a relatively low‐cost location (compared to say Brighton or London), and there are many innovative people. This is growing sector, with employment having increased by 6% between 2008 and 2013, and forecast, based on national trends, to increase by 16% (3,300 jobs) between 2013 and 2022. It has been suggested that this growth forecast may be over‐ambitious, unless supporting sector‐led strategies, perhaps focused on the development of clusters, and business support are in place to enable this. In such a dynamic sector it is important to accept that there will be business failures, as well as successes. If this business growth does not happen, Kent and Medway runs the risk of becoming the “workshop” of London‐based media companies, doing low‐cost contract work. The qualifications profile of the sector workforce is higher in terms of level than the overall Kent and Medway employed workforce, and there are few low‐
skilled roles. 40% of the workforce are in professional occupations, double the percentage for the employed workforce as a whole. The main skills needs are in technical / “hands on” subjects and more general business management, although employers often find that potential new recruits can lack work readiness, soft skills and sometimes life skills The key skills related issues that require attention are:
Supporting firms to take “the next step” and grow. This involves things like business support and the availability of suitable premises, but also has a skills dimension, with commercial skills being especially important.
Design Tech and Business Studies curricula need updating to reflect modern sector realties and the learning curve that people face when wanting to convert their activities into businesses. Much of this would be relevant and transferable to other sectors. FE seems to be more in touch with this need in terms of its offer.
There is scope to develop a more productive two‐way relationship between the academic world and sector businesses. Academia can feed business, and vice versa in joint research, for example, in work which is often at the edge of people’s knowledge and understanding. Such collaboration could be quite creative and generative, but is currently held back by things like software licensing and IP issues. Good practice in this area has been developed by HE in Guildford.
There is a wide range of workforce development needs, including software training in subjects like animation and special effects, as well as and CPD, all of which can be very expensive. Business development skills are also needed, especially if these help with a move into more B2B services and skills like budgeting, the use of spreadsheet and pitching.
Arts and Creative The Arts and Creative sector is small in employment terms, accounting for only 1% of all employment in Kent and Medway. Micro‐businesses predominate, making up 95% of companies (compared with only 88% for the economy as a whole). There is also a lot of self‐employment, which may not be apparent from national statistics. The numbers of people employed
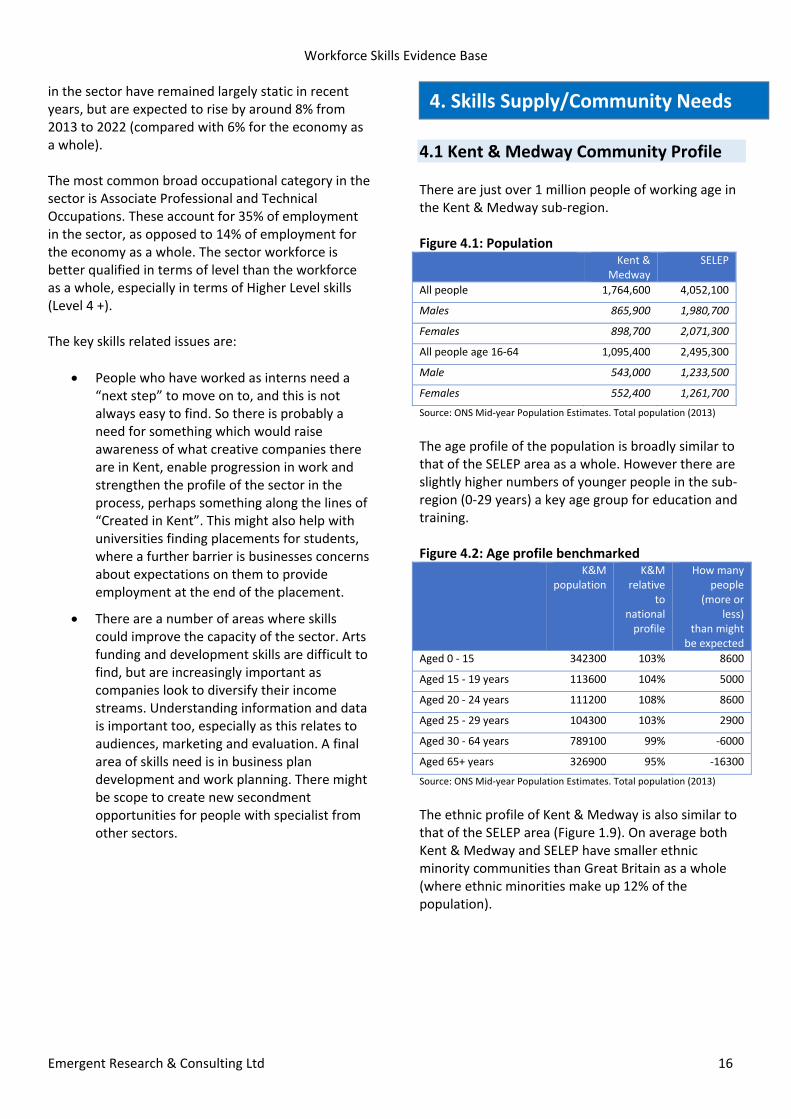
Workforce Skills Evidence Base
Emergent Research & Consulting Ltd 16
in the sector have remained largely static in recent years, but are expected to rise by around 8% from 2013 to 2022 (compared with 6% for the economy as a whole). The most common broad occupational category in the sector is Associate Professional and Technical Occupations. These account for 35% of employment in the sector, as opposed to 14% of employment for the economy as a whole. The sector workforce is better qualified in terms of level than the workforce as a whole, especially in terms of Higher Level skills (Level 4 +). The key skills related issues are:
People who have worked as interns need a “next step” to move on to, and this is not always easy to find. So there is probably a need for something which would raise awareness of what creative companies there are in Kent, enable progression in work and strengthen the profile of the sector in the process, perhaps something along the lines of “Created in Kent”. This might also help with universities finding placements for students, where a further barrier is businesses concerns about expectations on them to provide employment at the end of the placement.
There are a number of areas where skills could improve the capacity of the sector. Arts funding and development skills are difficult to find, but are increasingly important as companies look to diversify their income streams. Understanding information and data is important too, especially as this relates to audiences, marketing and evaluation. A final area of skills need is in business plan development and work planning. There might be scope to create new secondment opportunities for people with specialist from other sectors.
4.1 Kent & Medway Community Profile There are just over 1 million people of working age in the Kent & Medway sub‐region. Figure 4.1: Population Kent &
Medway SELEP
All people 1,764,600 4,052,100
Males 865,900 1,980,700
Females 898,700 2,071,300
All people age 16‐64 1,095,400 2,495,300
Male 543,000 1,233,500
Females 552,400 1,261,700
Source: ONS Mid‐year Population Estimates. Total population (2013)
The age profile of the population is broadly similar to that of the SELEP area as a whole. However there are slightly higher numbers of younger people in the sub‐region (0‐29 years) a key age group for education and training. Figure 4.2: Age profile benchmarked K&M
population K&M
relative to
national profile
How many people
(more or less)
than might be expected
Aged 0 ‐ 15 342300 103% 8600
Aged 15 ‐ 19 years 113600 104% 5000
Aged 20 ‐ 24 years 111200 108% 8600
Aged 25 ‐ 29 years 104300 103% 2900
Aged 30 ‐ 64 years 789100 99% ‐6000
Aged 65+ years 326900 95% ‐16300
Source: ONS Mid‐year Population Estimates. Total population (2013)
The ethnic profile of Kent & Medway is also similar to that of the SELEP area (Figure 1.9). On average both Kent & Medway and SELEP have smaller ethnic minority communities than Great Britain as a whole (where ethnic minorities make up 12% of the population).
4. Skills Supply/Community Needs
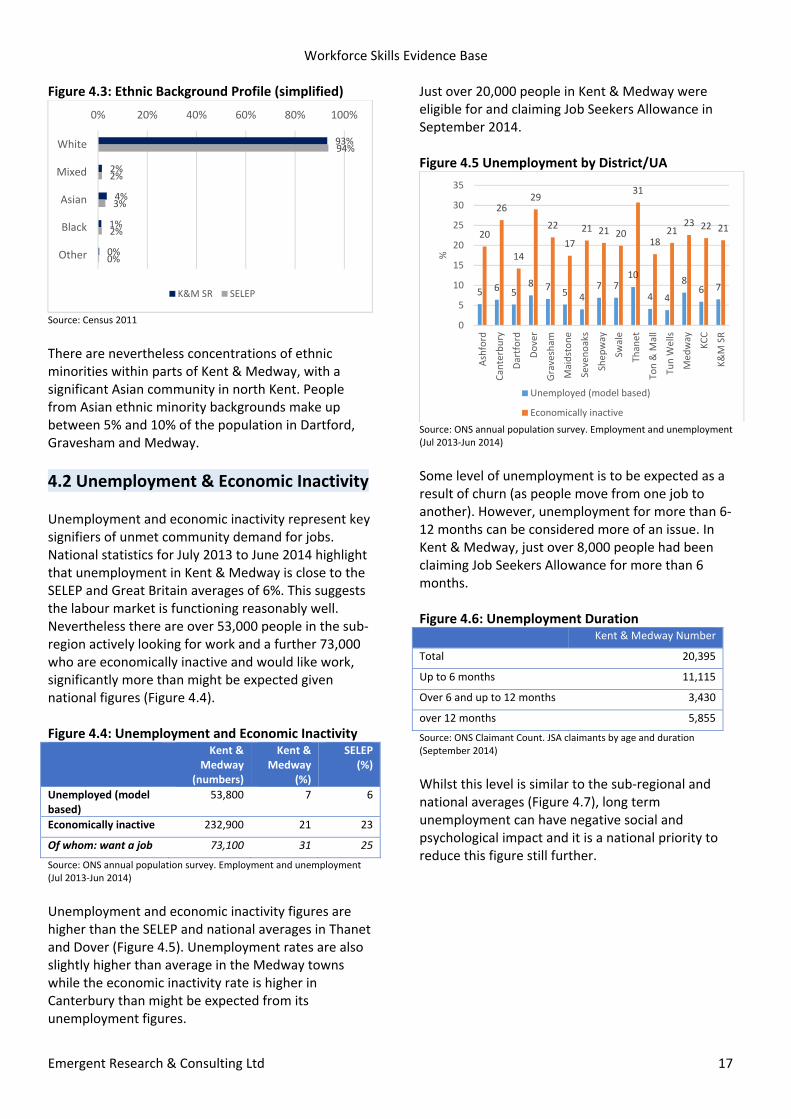
Workforce Skills Evidence Base
Emergent Research & Consulting Ltd 17
Figure 4.3: Ethnic Background Profile (simplified)
Source: Census 2011
There are nevertheless concentrations of ethnic minorities within parts of Kent & Medway, with a significant Asian community in north Kent. People from Asian ethnic minority backgrounds make up between 5% and 10% of the population in Dartford, Gravesham and Medway.
4.2 Unemployment & Economic Inactivity Unemployment and economic inactivity represent key signifiers of unmet community demand for jobs. National statistics for July 2013 to June 2014 highlight that unemployment in Kent & Medway is close to the SELEP and Great Britain averages of 6%. This suggests the labour market is functioning reasonably well. Nevertheless there are over 53,000 people in the sub‐region actively looking for work and a further 73,000 who are economically inactive and would like work, significantly more than might be expected given national figures (Figure 4.4). Figure 4.4: Unemployment and Economic Inactivity Kent &
Medway (numbers)
Kent & Medway
(%)
SELEP (%)
Unemployed (model based)
53,800 7 6
Economically inactive 232,900 21 23
Of whom: want a job 73,100 31 25
Source: ONS annual population survey. Employment and unemployment (Jul 2013‐Jun 2014)
Unemployment and economic inactivity figures are higher than the SELEP and national averages in Thanet and Dover (Figure 4.5). Unemployment rates are also slightly higher than average in the Medway towns while the economic inactivity rate is higher in Canterbury than might be expected from its unemployment figures.
Just over 20,000 people in Kent & Medway were eligible for and claiming Job Seekers Allowance in September 2014. Figure 4.5 Unemployment by District/UA
Source: ONS annual population survey. Employment and unemployment (Jul 2013‐Jun 2014)
Some level of unemployment is to be expected as a result of churn (as people move from one job to another). However, unemployment for more than 6‐12 months can be considered more of an issue. In Kent & Medway, just over 8,000 people had been claiming Job Seekers Allowance for more than 6 months. Figure 4.6: Unemployment Duration Kent & Medway Number
Total 20,395
Up to 6 months 11,115
Over 6 and up to 12 months 3,430
over 12 months 5,855
Source: ONS Claimant Count. JSA claimants by age and duration (September 2014)
Whilst this level is similar to the sub‐regional and national averages (Figure 4.7), long term unemployment can have negative social and psychological impact and it is a national priority to reduce this figure still further.
93%
2%
4%
1%
0%
94%
2%
3%
2%
0%
0% 20% 40% 60% 80% 100%
White
Mixed
Asian
Black
Other
K&M SR SELEP 5 6 58 7
5 47 7
10
4 4
86 7
20
26
14
29
22
17
21 21 20
31
1821
23 22 21
0
5
10
15
20
25
30
35
Ashford
Canterbury
Dartford
Dover
Gravesham
Maidstone
Sevenoaks
Shepway
Swale
Thanet
Ton & M
all
Tun W
ells
Medway
KCC
K&M SR
%
Unemployed (model based)
Economically inactive
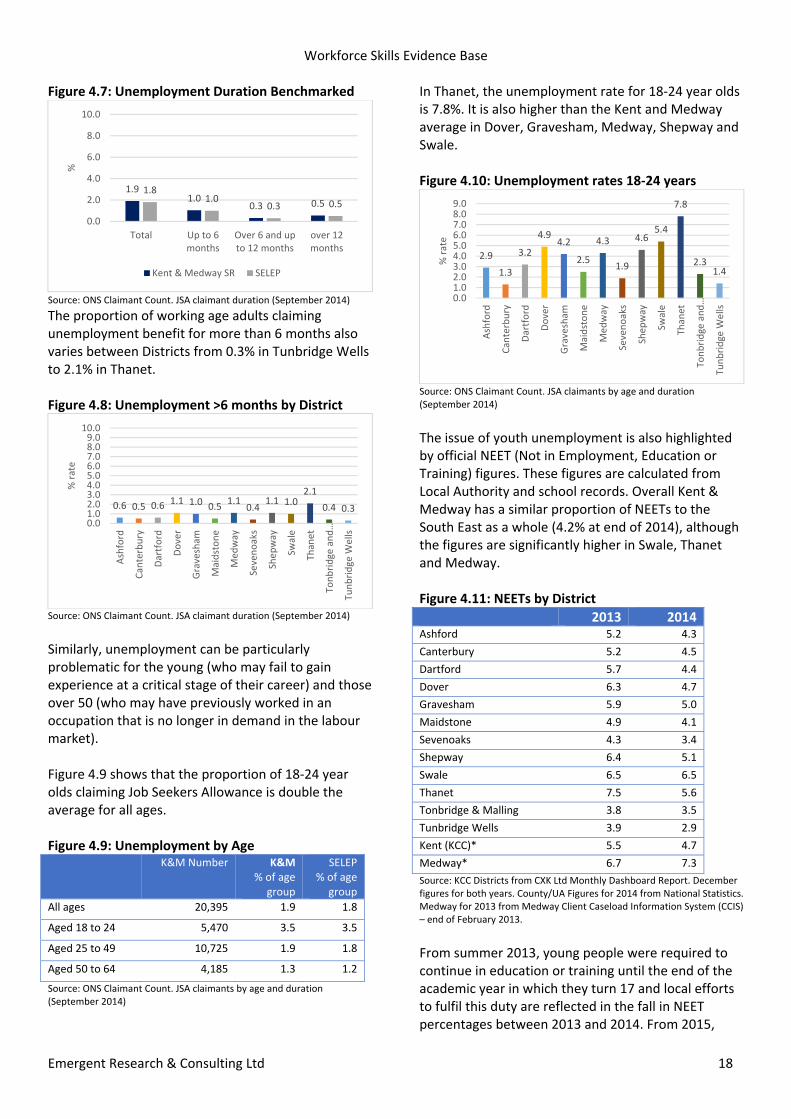
Workforce Skills Evidence Base
Emergent Research & Consulting Ltd 18
Figure 4.7: Unemployment Duration Benchmarked
Source: ONS Claimant Count. JSA claimant duration (September 2014)
The proportion of working age adults claiming unemployment benefit for more than 6 months also varies between Districts from 0.3% in Tunbridge Wells to 2.1% in Thanet. Figure 4.8: Unemployment >6 months by District
Source: ONS Claimant Count. JSA claimant duration (September 2014)
Similarly, unemployment can be particularly problematic for the young (who may fail to gain experience at a critical stage of their career) and those over 50 (who may have previously worked in an occupation that is no longer in demand in the labour market). Figure 4.9 shows that the proportion of 18‐24 year olds claiming Job Seekers Allowance is double the average for all ages. Figure 4.9: Unemployment by Age K&M Number K&M
% of age group
SELEP% of age
group
All ages 20,395 1.9 1.8
Aged 18 to 24 5,470 3.5 3.5
Aged 25 to 49 10,725 1.9 1.8
Aged 50 to 64 4,185 1.3 1.2
Source: ONS Claimant Count. JSA claimants by age and duration (September 2014)
In Thanet, the unemployment rate for 18‐24 year olds is 7.8%. It is also higher than the Kent and Medway average in Dover, Gravesham, Medway, Shepway and Swale. Figure 4.10: Unemployment rates 18‐24 years
Source: ONS Claimant Count. JSA claimants by age and duration (September 2014)
The issue of youth unemployment is also highlighted by official NEET (Not in Employment, Education or Training) figures. These figures are calculated from Local Authority and school records. Overall Kent & Medway has a similar proportion of NEETs to the South East as a whole (4.2% at end of 2014), although the figures are significantly higher in Swale, Thanet and Medway. Figure 4.11: NEETs by District
2013 2014Ashford 5.2 4.3
Canterbury 5.2 4.5
Dartford 5.7 4.4
Dover 6.3 4.7
Gravesham 5.9 5.0
Maidstone 4.9 4.1
Sevenoaks 4.3 3.4
Shepway 6.4 5.1
Swale 6.5 6.5
Thanet 7.5 5.6
Tonbridge & Malling 3.8 3.5
Tunbridge Wells 3.9 2.9
Kent (KCC)* 5.5 4.7
Medway* 6.7 7.3
Source: KCC Districts from CXK Ltd Monthly Dashboard Report. December figures for both years. County/UA Figures for 2014 from National Statistics. Medway for 2013 from Medway Client Caseload Information System (CCIS) – end of February 2013.
From summer 2013, young people were required to continue in education or training until the end of the academic year in which they turn 17 and local efforts to fulfil this duty are reflected in the fall in NEET percentages between 2013 and 2014. From 2015,
1.91.0
0.3 0.5
1.81.0
0.3 0.5
0.0
2.0
4.0
6.0
8.0
10.0
Total Up to 6months
Over 6 and upto 12 months
over 12months
%
Kent & Medway SR SELEP
0.6 0.5 0.6 1.1 1.0 0.51.1
0.41.1 1.0
2.1
0.4 0.3
0.01.02.03.04.05.06.07.08.09.0
10.0
Ashford
Canterbury
Dartford
Dover
Gravesham
Maidstone
Medway
Sevenoaks
Shepway
Swale
Thanet
Tonbridge and…
Tunbridge
Wells
% rate
2.9
1.3
3.2
4.94.2
2.5
4.3
1.9
4.65.4
7.8
2.31.4
0.01.02.03.04.05.06.07.08.09.0
Ashford
Canterbury
Dartford
Dover
Gravesham
Maidstone
Medway
Sevenoaks
Shepway
Swale
Thanet
Tonbridge and…
Tunbridge
Wells
% rate
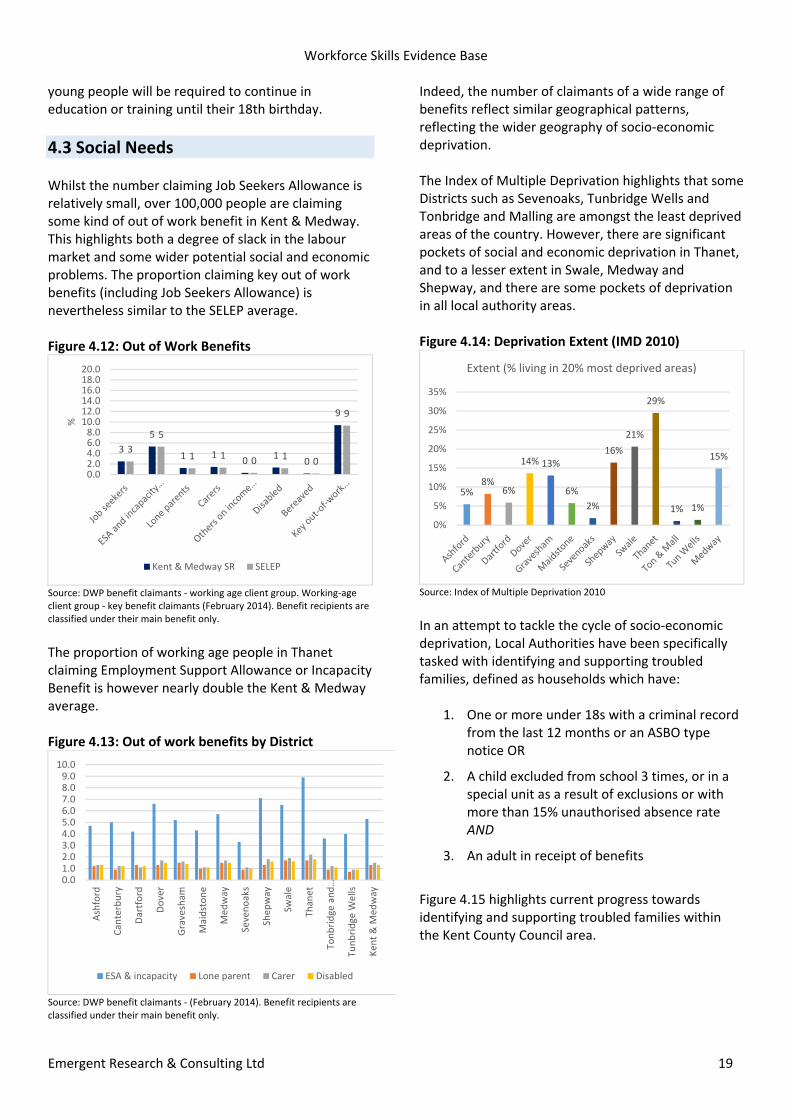
Workforce Skills Evidence Base
Emergent Research & Consulting Ltd 19
young people will be required to continue in education or training until their 18th birthday.
4.3 Social Needs Whilst the number claiming Job Seekers Allowance is relatively small, over 100,000 people are claiming some kind of out of work benefit in Kent & Medway. This highlights both a degree of slack in the labour market and some wider potential social and economic problems. The proportion claiming key out of work benefits (including Job Seekers Allowance) is nevertheless similar to the SELEP average. Figure 4.12: Out of Work Benefits
Source: DWP benefit claimants ‐ working age client group. Working‐age client group ‐ key benefit claimants (February 2014). Benefit recipients are classified under their main benefit only.
The proportion of working age people in Thanet claiming Employment Support Allowance or Incapacity Benefit is however nearly double the Kent & Medway average. Figure 4.13: Out of work benefits by District
Source: DWP benefit claimants ‐ (February 2014). Benefit recipients are classified under their main benefit only.
Indeed, the number of claimants of a wide range of benefits reflect similar geographical patterns, reflecting the wider geography of socio‐economic deprivation. The Index of Multiple Deprivation highlights that some Districts such as Sevenoaks, Tunbridge Wells and Tonbridge and Malling are amongst the least deprived areas of the country. However, there are significant pockets of social and economic deprivation in Thanet, and to a lesser extent in Swale, Medway and Shepway, and there are some pockets of deprivation in all local authority areas. Figure 4.14: Deprivation Extent (IMD 2010)
Source: Index of Multiple Deprivation 2010
In an attempt to tackle the cycle of socio‐economic deprivation, Local Authorities have been specifically tasked with identifying and supporting troubled families, defined as households which have:
1. One or more under 18s with a criminal record from the last 12 months or an ASBO type notice OR
2. A child excluded from school 3 times, or in a special unit as a result of exclusions or with more than 15% unauthorised absence rate AND
3. An adult in receipt of benefits
Figure 4.15 highlights current progress towards identifying and supporting troubled families within the Kent County Council area.
3
5
1 10
10
9
3
5
1 1 0 1 0
9
0.02.04.06.08.0
10.012.014.016.018.020.0
%
Kent & Medway SR SELEP
0.01.02.03.04.05.06.07.08.09.0
10.0
Ashford
Canterbury
Dartford
Dover
Gravesham
Maidstone
Medway
Sevenoaks
Shepway
Swale
Thanet
Tonbridge and…
Tunbridge
Wells
Kent & M
edway
ESA & incapacity Lone parent Carer Disabled
5%8%
6%
14% 13%
6%
2%
16%
21%
29%
1% 1%
15%
0%
5%
10%
15%
20%
25%
30%
35%
Extent (% living in 20% most deprived areas)
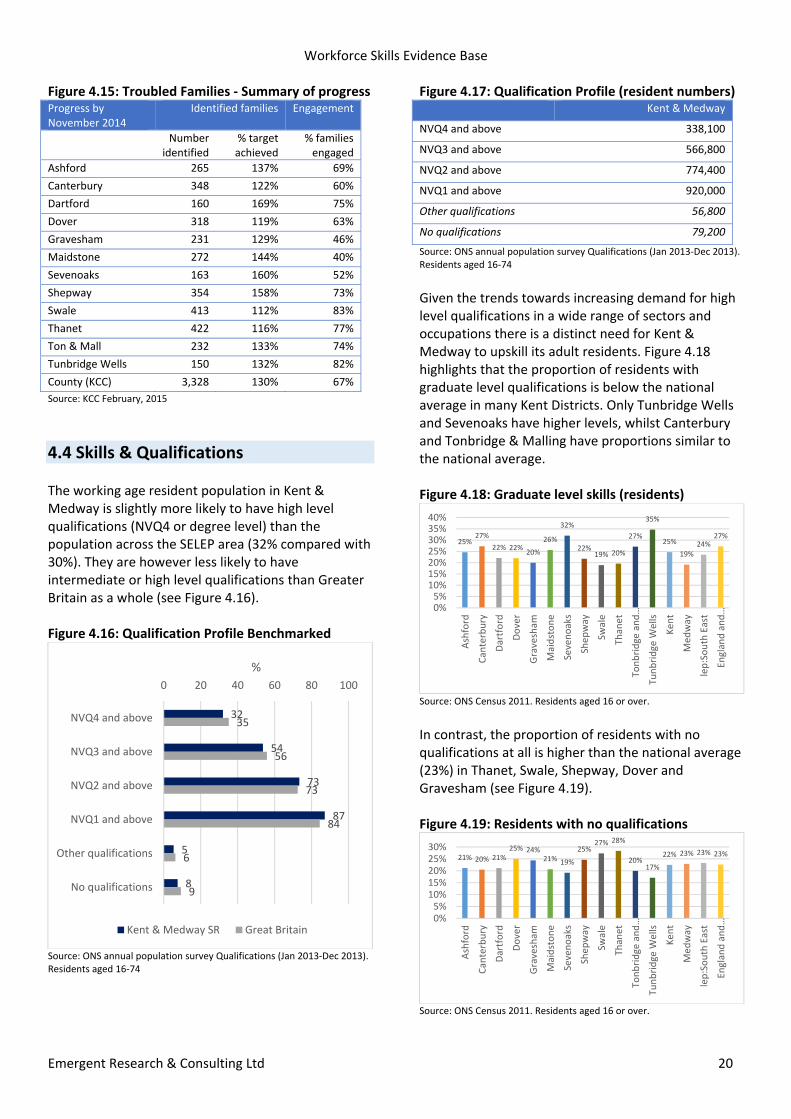
Workforce Skills Evidence Base
Emergent Research & Consulting Ltd 20
Figure 4.15: Troubled Families ‐ Summary of progress Progress by November 2014
Identified families Engagement
Number identified
% target achieved
% families engaged
Ashford 265 137% 69%
Canterbury 348 122% 60%
Dartford 160 169% 75%
Dover 318 119% 63%
Gravesham 231 129% 46%
Maidstone 272 144% 40%
Sevenoaks 163 160% 52%
Shepway 354 158% 73%
Swale 413 112% 83%
Thanet 422 116% 77%
Ton & Mall 232 133% 74%
Tunbridge Wells 150 132% 82%
County (KCC) 3,328 130% 67%
Source: KCC February, 2015
4.4 Skills & Qualifications The working age resident population in Kent & Medway is slightly more likely to have high level qualifications (NVQ4 or degree level) than the population across the SELEP area (32% compared with 30%). They are however less likely to have intermediate or high level qualifications than Greater Britain as a whole (see Figure 4.16). Figure 4.16: Qualification Profile Benchmarked
Source: ONS annual population survey Qualifications (Jan 2013‐Dec 2013). Residents aged 16‐74
Figure 4.17: Qualification Profile (resident numbers) Kent & Medway
NVQ4 and above 338,100
NVQ3 and above 566,800
NVQ2 and above 774,400
NVQ1 and above 920,000
Other qualifications 56,800
No qualifications 79,200
Source: ONS annual population survey Qualifications (Jan 2013‐Dec 2013). Residents aged 16‐74
Given the trends towards increasing demand for high level qualifications in a wide range of sectors and occupations there is a distinct need for Kent & Medway to upskill its adult residents. Figure 4.18 highlights that the proportion of residents with graduate level qualifications is below the national average in many Kent Districts. Only Tunbridge Wells and Sevenoaks have higher levels, whilst Canterbury and Tonbridge & Malling have proportions similar to the national average. Figure 4.18: Graduate level skills (residents)
Source: ONS Census 2011. Residents aged 16 or over.
In contrast, the proportion of residents with no qualifications at all is higher than the national average (23%) in Thanet, Swale, Shepway, Dover and Gravesham (see Figure 4.19). Figure 4.19: Residents with no qualifications
Source: ONS Census 2011. Residents aged 16 or over.
32
54
73
87
5
8
35
56
73
84
6
9
0 20 40 60 80 100
NVQ4 and above
NVQ3 and above
NVQ2 and above
NVQ1 and above
Other qualifications
No qualifications
%
Kent & Medway SR Great Britain
25%27%
22% 22%20%
26%
32%
22%19% 20%
27%
35%
25%
19%24%
27%
0%5%
10%15%20%25%30%35%40%
Ashford
Canterbury
Dartford
Dover
Gravesham
Maidstone
Sevenoaks
Shepway
Swale
Thanet
Tonbridge and…
Tunbridge
Wells
Kent
Medway
lep:South East
England and…
21% 20% 21%25% 24%
21% 19%
25%27% 28%
20%17%
22% 23% 23% 23%
0%5%
10%15%20%25%30%
Ashford
Canterbury
Dartford
Dover
Gravesham
Maidstone
Sevenoaks
Shepway
Swale
Thanet
Tonbridge and…
Tunbridge
Wells
Kent
Medway
lep:South East
England and…
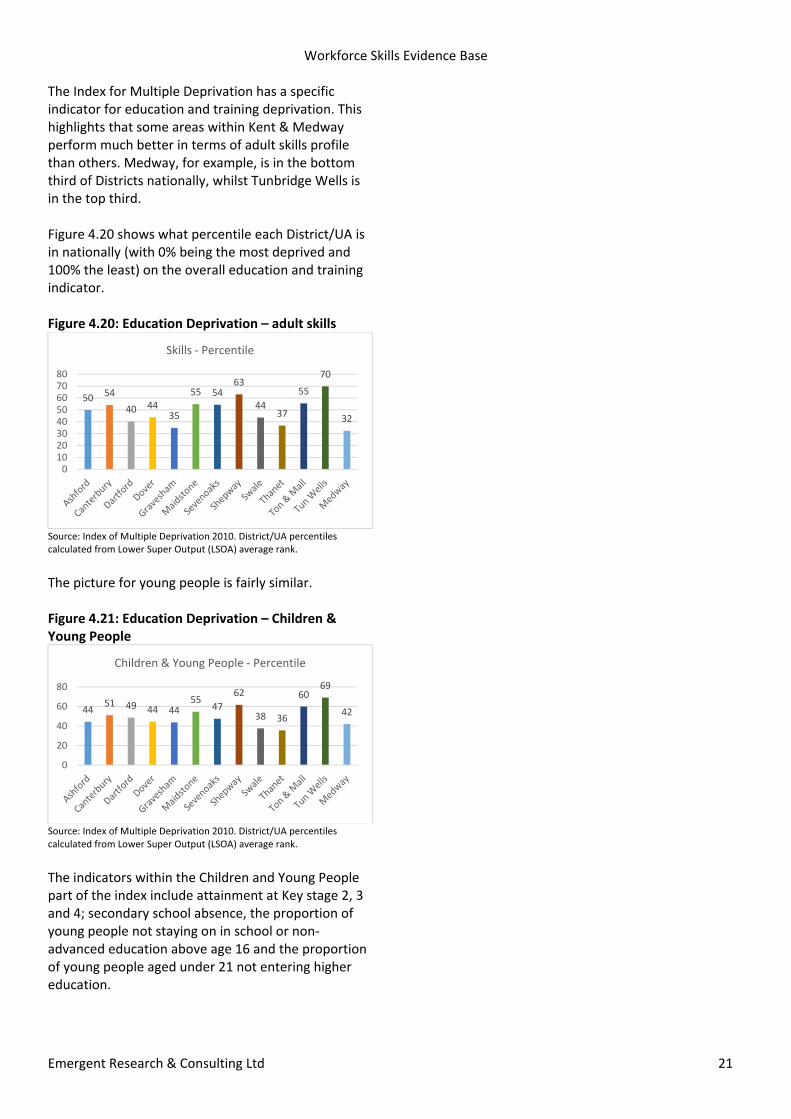
Workforce Skills Evidence Base
Emergent Research & Consulting Ltd 21
The Index for Multiple Deprivation has a specific indicator for education and training deprivation. This highlights that some areas within Kent & Medway perform much better in terms of adult skills profile than others. Medway, for example, is in the bottom third of Districts nationally, whilst Tunbridge Wells is in the top third. Figure 4.20 shows what percentile each District/UA is in nationally (with 0% being the most deprived and 100% the least) on the overall education and training indicator. Figure 4.20: Education Deprivation – adult skills
Source: Index of Multiple Deprivation 2010. District/UA percentiles calculated from Lower Super Output (LSOA) average rank.
The picture for young people is fairly similar. Figure 4.21: Education Deprivation – Children & Young People
Source: Index of Multiple Deprivation 2010. District/UA percentiles calculated from Lower Super Output (LSOA) average rank.
The indicators within the Children and Young People part of the index include attainment at Key stage 2, 3 and 4; secondary school absence, the proportion of young people not staying on in school or non‐advanced education above age 16 and the proportion of young people aged under 21 not entering higher education.
50 54
40 4435
55 5463
4437
55
70
32
01020304050607080
Skills ‐ Percentile
4451 49 44 44
5547
62
38 36
6069
42
0
20
40
60
80
Children & Young People ‐ Percentile
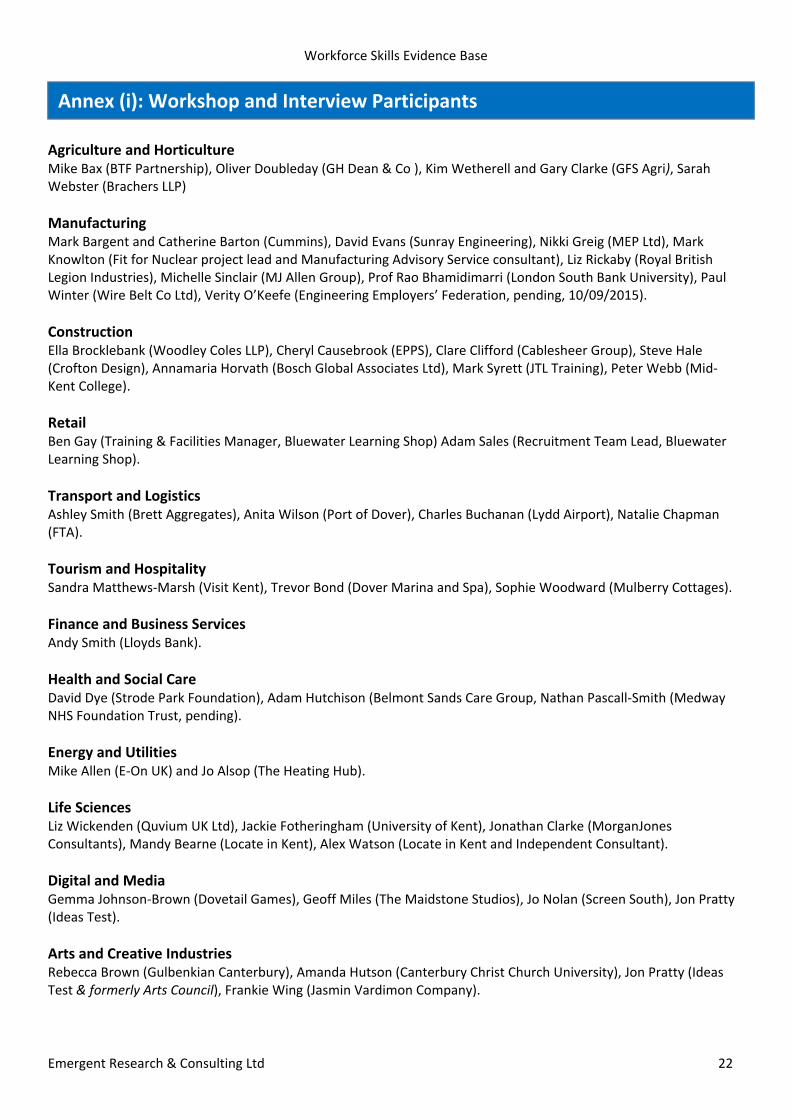
Workforce Skills Evidence Base
Emergent Research & Consulting Ltd 22
Agriculture and Horticulture Mike Bax (BTF Partnership), Oliver Doubleday (GH Dean & Co ), Kim Wetherell and Gary Clarke (GFS Agri), Sarah Webster (Brachers LLP)
Manufacturing Mark Bargent and Catherine Barton (Cummins), David Evans (Sunray Engineering), Nikki Greig (MEP Ltd), Mark Knowlton (Fit for Nuclear project lead and Manufacturing Advisory Service consultant), Liz Rickaby (Royal British Legion Industries), Michelle Sinclair (MJ Allen Group), Prof Rao Bhamidimarri (London South Bank University), Paul Winter (Wire Belt Co Ltd), Verity O’Keefe (Engineering Employers’ Federation, pending, 10/09/2015).
Construction Ella Brocklebank (Woodley Coles LLP), Cheryl Causebrook (EPPS), Clare Clifford (Cablesheer Group), Steve Hale (Crofton Design), Annamaria Horvath (Bosch Global Associates Ltd), Mark Syrett (JTL Training), Peter Webb (Mid‐Kent College).
Retail Ben Gay (Training & Facilities Manager, Bluewater Learning Shop) Adam Sales (Recruitment Team Lead, Bluewater Learning Shop).
Transport and Logistics Ashley Smith (Brett Aggregates), Anita Wilson (Port of Dover), Charles Buchanan (Lydd Airport), Natalie Chapman (FTA).
Tourism and Hospitality Sandra Matthews‐Marsh (Visit Kent), Trevor Bond (Dover Marina and Spa), Sophie Woodward (Mulberry Cottages).
Finance and Business Services Andy Smith (Lloyds Bank).
Health and Social Care David Dye (Strode Park Foundation), Adam Hutchison (Belmont Sands Care Group, Nathan Pascall‐Smith (Medway NHS Foundation Trust, pending).
Energy and Utilities Mike Allen (E‐On UK) and Jo Alsop (The Heating Hub).
Life Sciences Liz Wickenden (Quvium UK Ltd), Jackie Fotheringham (University of Kent), Jonathan Clarke (MorganJones Consultants), Mandy Bearne (Locate in Kent), Alex Watson (Locate in Kent and Independent Consultant).
Digital and Media Gemma Johnson‐Brown (Dovetail Games), Geoff Miles (The Maidstone Studios), Jo Nolan (Screen South), Jon Pratty (Ideas Test).
Arts and Creative Industries Rebecca Brown (Gulbenkian Canterbury), Amanda Hutson (Canterbury Christ Church University), Jon Pratty (Ideas Test & formerly Arts Council), Frankie Wing (Jasmin Vardimon Company).
Annex (i): Workshop and Interview Participants
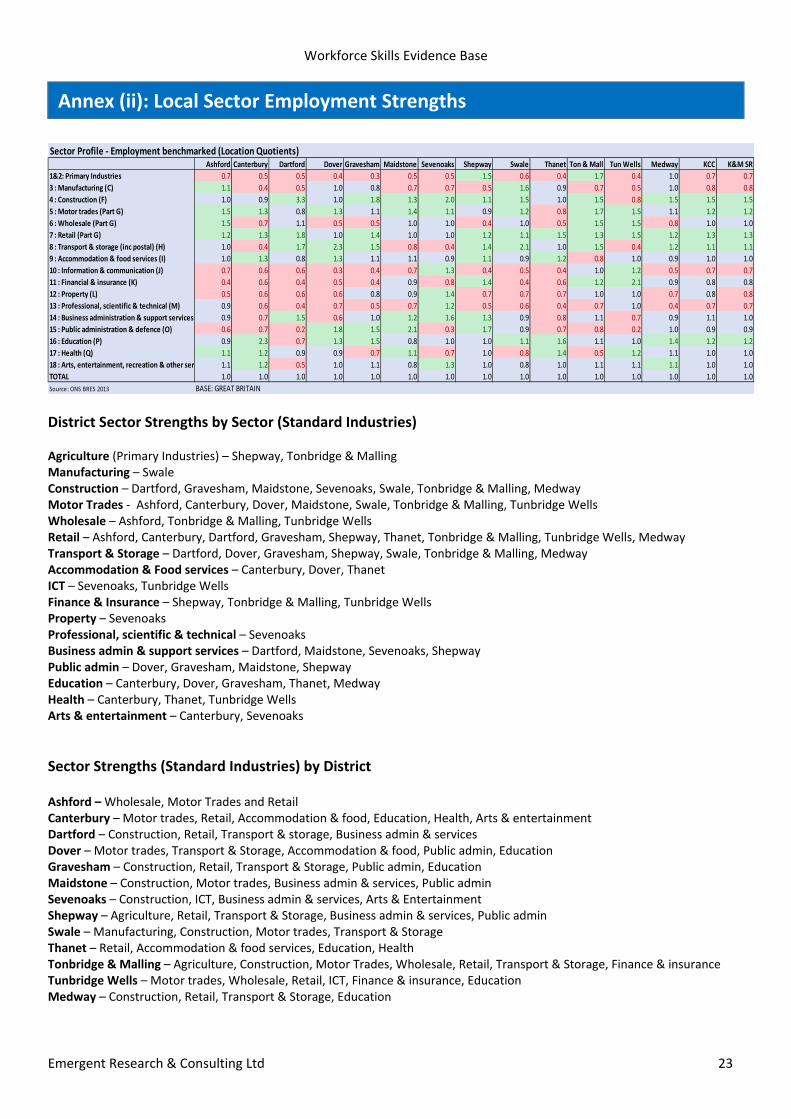
Workforce Skills Evidence Base
Emergent Research & Consulting Ltd 23
District Sector Strengths by Sector (Standard Industries) Agriculture (Primary Industries) – Shepway, Tonbridge & Malling Manufacturing – Swale Construction – Dartford, Gravesham, Maidstone, Sevenoaks, Swale, Tonbridge & Malling, Medway Motor Trades ‐ Ashford, Canterbury, Dover, Maidstone, Swale, Tonbridge & Malling, Tunbridge Wells Wholesale – Ashford, Tonbridge & Malling, Tunbridge Wells Retail – Ashford, Canterbury, Dartford, Gravesham, Shepway, Thanet, Tonbridge & Malling, Tunbridge Wells, Medway Transport & Storage – Dartford, Dover, Gravesham, Shepway, Swale, Tonbridge & Malling, Medway Accommodation & Food services – Canterbury, Dover, Thanet ICT – Sevenoaks, Tunbridge Wells Finance & Insurance – Shepway, Tonbridge & Malling, Tunbridge Wells Property – Sevenoaks Professional, scientific & technical – Sevenoaks Business admin & support services – Dartford, Maidstone, Sevenoaks, Shepway Public admin – Dover, Gravesham, Maidstone, Shepway Education – Canterbury, Dover, Gravesham, Thanet, Medway Health – Canterbury, Thanet, Tunbridge Wells Arts & entertainment – Canterbury, Sevenoaks
Sector Strengths (Standard Industries) by District Ashford – Wholesale, Motor Trades and Retail Canterbury – Motor trades, Retail, Accommodation & food, Education, Health, Arts & entertainment Dartford – Construction, Retail, Transport & storage, Business admin & services Dover – Motor trades, Transport & Storage, Accommodation & food, Public admin, Education Gravesham – Construction, Retail, Transport & Storage, Public admin, Education Maidstone – Construction, Motor trades, Business admin & services, Public admin Sevenoaks – Construction, ICT, Business admin & services, Arts & Entertainment Shepway – Agriculture, Retail, Transport & Storage, Business admin & services, Public admin Swale – Manufacturing, Construction, Motor trades, Transport & Storage Thanet – Retail, Accommodation & food services, Education, Health Tonbridge & Malling – Agriculture, Construction, Motor Trades, Wholesale, Retail, Transport & Storage, Finance & insurance Tunbridge Wells – Motor trades, Wholesale, Retail, ICT, Finance & insurance, Education Medway – Construction, Retail, Transport & Storage, Education
Sector Profile ‐ Employment benchmarked (Location Quotients)Ashford Canterbury Dartford Dover Gravesham Maidstone Sevenoaks Shepway Swale Thanet Ton & Mall Tun Wells Medway KCC K&M SR
1&2: Primary Industries 0.7 0.5 0.5 0.4 0.3 0.5 0.5 1.5 0.6 0.4 1.7 0.4 1.0 0.7 0.7
3 : Manufacturing (C) 1.1 0.4 0.5 1.0 0.8 0.7 0.7 0.5 1.6 0.9 0.7 0.5 1.0 0.8 0.8
4 : Construction (F) 1.0 0.9 3.3 1.0 1.8 1.3 2.0 1.1 1.5 1.0 1.5 0.8 1.5 1.5 1.5
5 : Motor trades (Part G) 1.5 1.3 0.8 1.3 1.1 1.4 1.1 0.9 1.2 0.8 1.7 1.5 1.1 1.2 1.2
6 : Wholesale (Part G) 1.5 0.7 1.1 0.5 0.5 1.0 1.0 0.4 1.0 0.5 1.5 1.5 0.8 1.0 1.0
7 : Retail (Part G) 1.2 1.3 1.8 1.0 1.4 1.0 1.0 1.2 1.1 1.5 1.3 1.5 1.2 1.3 1.3
8 : Transport & storage (inc postal) (H) 1.0 0.4 1.7 2.3 1.5 0.8 0.4 1.4 2.1 1.0 1.5 0.4 1.2 1.1 1.1
9 : Accommodation & food services (I) 1.0 1.3 0.8 1.3 1.1 1.1 0.9 1.1 0.9 1.2 0.8 1.0 0.9 1.0 1.0
10 : Information & communication (J) 0.7 0.6 0.6 0.3 0.4 0.7 1.3 0.4 0.5 0.4 1.0 1.2 0.5 0.7 0.7
11 : Financial & insurance (K) 0.4 0.6 0.4 0.5 0.4 0.9 0.8 1.4 0.4 0.6 1.2 2.1 0.9 0.8 0.8
12 : Property (L) 0.5 0.6 0.6 0.6 0.8 0.9 1.4 0.7 0.7 0.7 1.0 1.0 0.7 0.8 0.8
13 : Professional, scientific & technical (M) 0.9 0.6 0.4 0.7 0.5 0.7 1.2 0.5 0.6 0.4 0.7 1.0 0.4 0.7 0.7
14 : Business administration & support services 0.9 0.7 1.5 0.6 1.0 1.2 1.6 1.3 0.9 0.8 1.1 0.7 0.9 1.1 1.0
15 : Public administration & defence (O) 0.6 0.7 0.2 1.8 1.5 2.1 0.3 1.7 0.9 0.7 0.8 0.2 1.0 0.9 0.9
16 : Education (P) 0.9 2.3 0.7 1.3 1.5 0.8 1.0 1.0 1.1 1.6 1.1 1.0 1.4 1.2 1.2
17 : Health (Q) 1.1 1.2 0.9 0.9 0.7 1.1 0.7 1.0 0.8 1.4 0.5 1.2 1.1 1.0 1.0
18 : Arts, entertainment, recreation & other ser 1.1 1.2 0.5 1.0 1.1 0.8 1.3 1.0 0.8 1.0 1.1 1.1 1.1 1.0 1.0
TOTAL 1.0 1.0 1.0 1.0 1.0 1.0 1.0 1.0 1.0 1.0 1.0 1.0 1.0 1.0 1.0
Source: ONS BRES 2013 BASE: GREAT BRITAIN
Annex (ii): Local Sector Employment Strengths
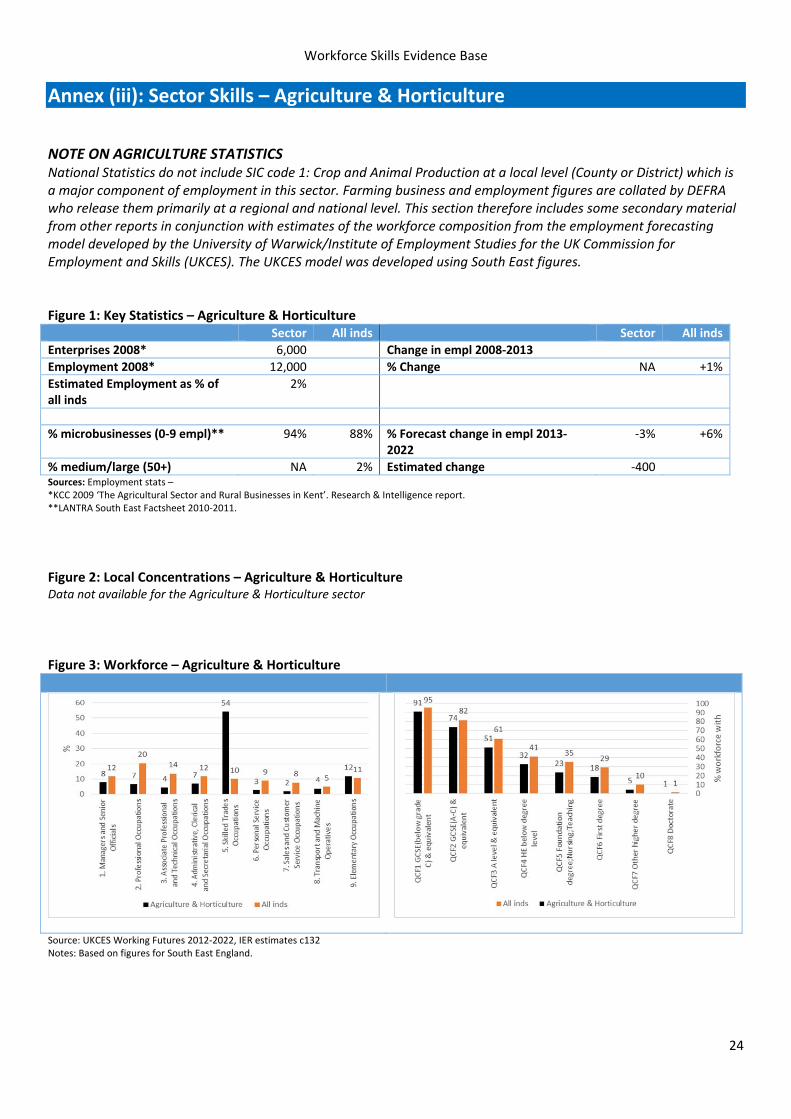
Workforce Skills Evidence Base
24
Annex (iii): Sector Skills – Agriculture & Horticulture
NOTE ON AGRICULTURE STATISTICS National Statistics do not include SIC code 1: Crop and Animal Production at a local level (County or District) which is a major component of employment in this sector. Farming business and employment figures are collated by DEFRA who release them primarily at a regional and national level. This section therefore includes some secondary material from other reports in conjunction with estimates of the workforce composition from the employment forecasting model developed by the University of Warwick/Institute of Employment Studies for the UK Commission for Employment and Skills (UKCES). The UKCES model was developed using South East figures. Figure 1: Key Statistics – Agriculture & Horticulture Sector All inds Sector All inds
Enterprises 2008* 6,000 Change in empl 2008‐2013
Employment 2008* 12,000 % Change NA +1%
Estimated Employment as % of all inds
2%
% microbusinesses (0‐9 empl)** 94% 88% % Forecast change in empl 2013‐2022
‐3% +6%
% medium/large (50+) NA 2% Estimated change ‐400Sources: Employment stats – *KCC 2009 ‘The Agricultural Sector and Rural Businesses in Kent’. Research & Intelligence report. **LANTRA South East Factsheet 2010‐2011.
Figure 2: Local Concentrations – Agriculture & Horticulture Data not available for the Agriculture & Horticulture sector
Figure 3: Workforce – Agriculture & Horticulture
Source: UKCES Working Futures 2012‐2022, IER estimates c132 Notes: Based on figures for South East England.
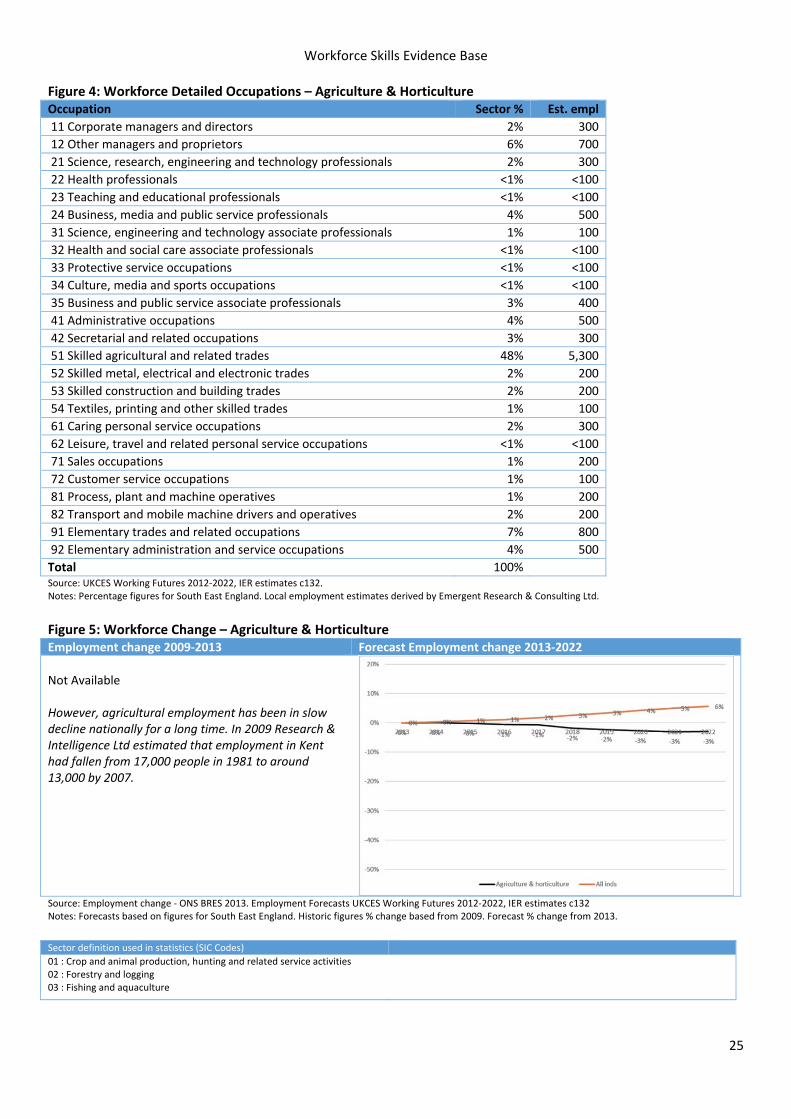
Workforce Skills Evidence Base
25
Figure 4: Workforce Detailed Occupations – Agriculture & Horticulture Occupation Sector % Est. empl
11 Corporate managers and directors 2% 300
12 Other managers and proprietors 6% 700
21 Science, research, engineering and technology professionals 2% 300
22 Health professionals <1% <100
23 Teaching and educational professionals <1% <100
24 Business, media and public service professionals 4% 500
31 Science, engineering and technology associate professionals 1% 100
32 Health and social care associate professionals <1% <100
33 Protective service occupations <1% <100
34 Culture, media and sports occupations <1% <100
35 Business and public service associate professionals 3% 400
41 Administrative occupations 4% 500
42 Secretarial and related occupations 3% 300
51 Skilled agricultural and related trades 48% 5,300
52 Skilled metal, electrical and electronic trades 2% 200
53 Skilled construction and building trades 2% 200
54 Textiles, printing and other skilled trades 1% 100
61 Caring personal service occupations 2% 300
62 Leisure, travel and related personal service occupations <1% <100
71 Sales occupations 1% 200
72 Customer service occupations 1% 100
81 Process, plant and machine operatives 1% 200
82 Transport and mobile machine drivers and operatives 2% 200
91 Elementary trades and related occupations 7% 800
92 Elementary administration and service occupations 4% 500
Total 100% Source: UKCES Working Futures 2012‐2022, IER estimates c132. Notes: Percentage figures for South East England. Local employment estimates derived by Emergent Research & Consulting Ltd.
Figure 5: Workforce Change – Agriculture & Horticulture Employment change 2009‐2013 Forecast Employment change 2013‐2022
Not Available However, agricultural employment has been in slow decline nationally for a long time. In 2009 Research & Intelligence Ltd estimated that employment in Kent had fallen from 17,000 people in 1981 to around 13,000 by 2007.
Source: Employment change ‐ ONS BRES 2013. Employment Forecasts UKCES Working Futures 2012‐2022, IER estimates c132 Notes: Forecasts based on figures for South East England. Historic figures % change based from 2009. Forecast % change from 2013.
Sector definition used in statistics (SIC Codes)
01 : Crop and animal production, hunting and related service activities02 : Forestry and logging 03 : Fishing and aquaculture
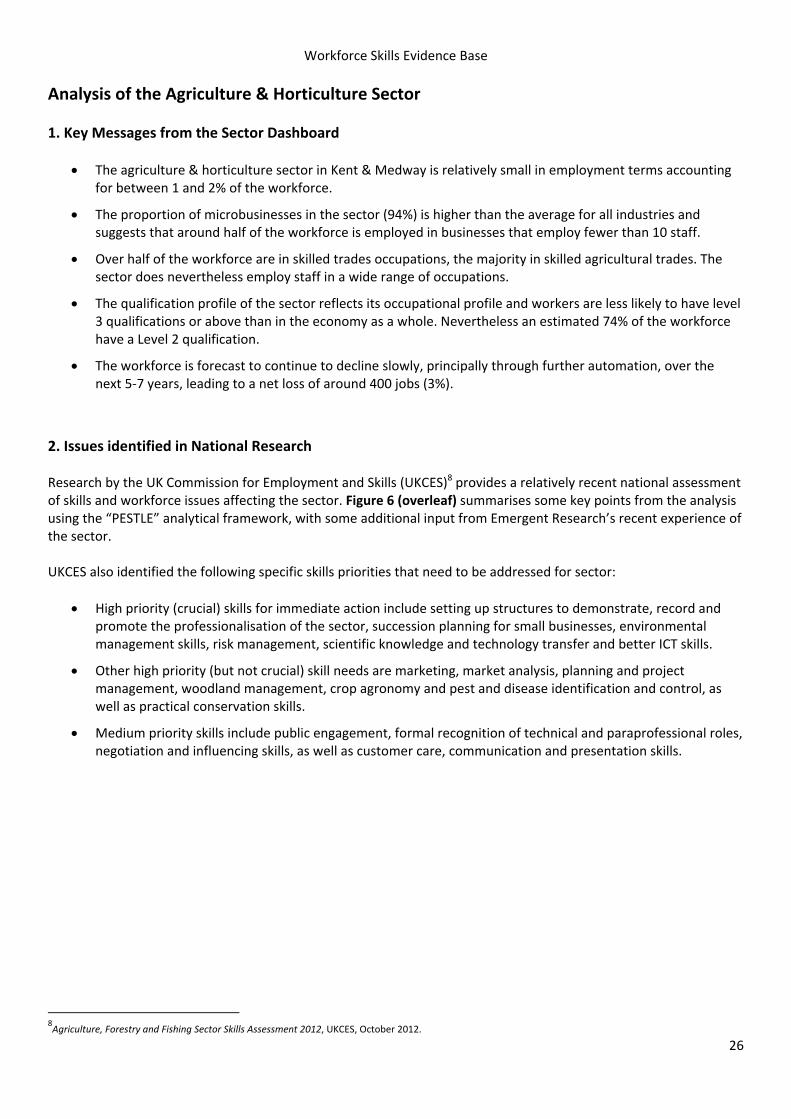
Workforce Skills Evidence Base
26
Analysis of the Agriculture & Horticulture Sector
1. Key Messages from the Sector Dashboard
The agriculture & horticulture sector in Kent & Medway is relatively small in employment terms accounting for between 1 and 2% of the workforce.
The proportion of microbusinesses in the sector (94%) is higher than the average for all industries and suggests that around half of the workforce is employed in businesses that employ fewer than 10 staff.
Over half of the workforce are in skilled trades occupations, the majority in skilled agricultural trades. The sector does nevertheless employ staff in a wide range of occupations.
The qualification profile of the sector reflects its occupational profile and workers are less likely to have level 3 qualifications or above than in the economy as a whole. Nevertheless an estimated 74% of the workforce have a Level 2 qualification.
The workforce is forecast to continue to decline slowly, principally through further automation, over the next 5‐7 years, leading to a net loss of around 400 jobs (3%).
2. Issues identified in National Research Research by the UK Commission for Employment and Skills (UKCES)8 provides a relatively recent national assessment of skills and workforce issues affecting the sector. Figure 6 (overleaf) summarises some key points from the analysis using the “PESTLE” analytical framework, with some additional input from Emergent Research’s recent experience of the sector. UKCES also identified the following specific skills priorities that need to be addressed for sector:
High priority (crucial) skills for immediate action include setting up structures to demonstrate, record and promote the professionalisation of the sector, succession planning for small businesses, environmental management skills, risk management, scientific knowledge and technology transfer and better ICT skills.
Other high priority (but not crucial) skill needs are marketing, market analysis, planning and project management, woodland management, crop agronomy and pest and disease identification and control, as well as practical conservation skills.
Medium priority skills include public engagement, formal recognition of technical and paraprofessional roles, negotiation and influencing skills, as well as customer care, communication and presentation skills.
8Agriculture, Forestry and Fishing Sector Skills Assessment 2012, UKCES, October 2012.
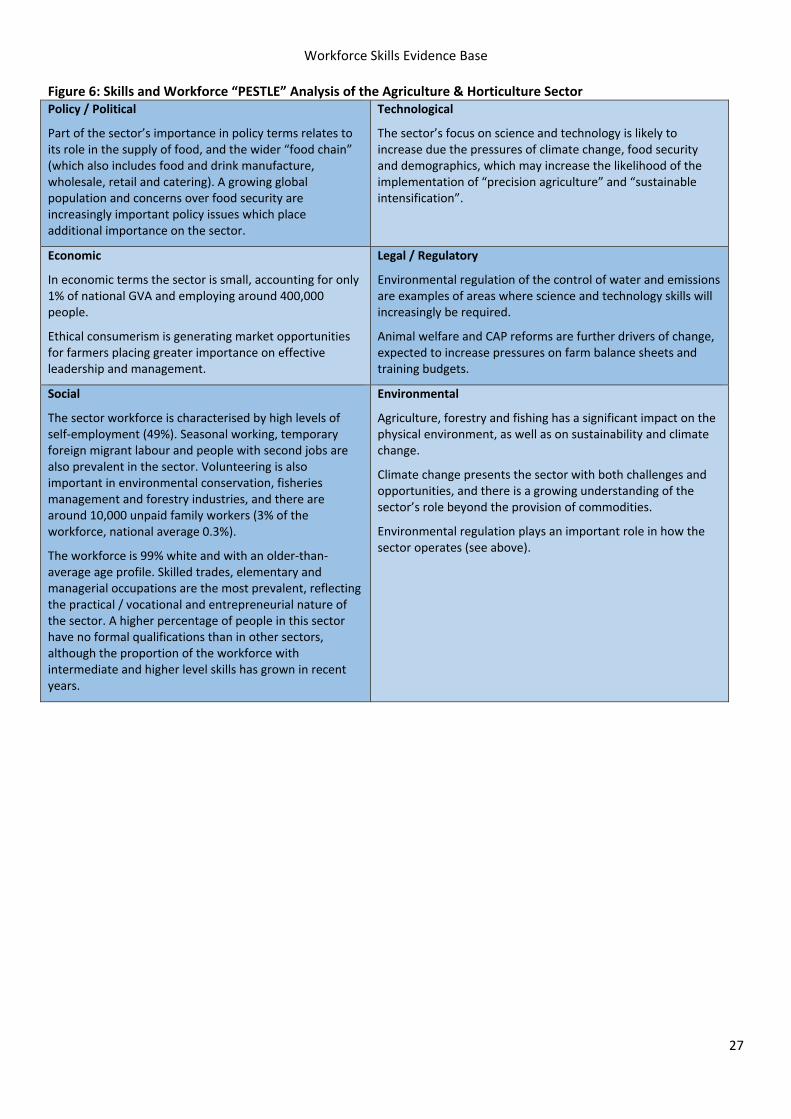
Workforce Skills Evidence Base
27
Figure 6: Skills and Workforce “PESTLE” Analysis of the Agriculture & Horticulture Sector Policy / Political
Part of the sector’s importance in policy terms relates to its role in the supply of food, and the wider “food chain” (which also includes food and drink manufacture, wholesale, retail and catering). A growing global population and concerns over food security are increasingly important policy issues which place additional importance on the sector.
Technological
The sector’s focus on science and technology is likely to increase due the pressures of climate change, food security and demographics, which may increase the likelihood of the implementation of “precision agriculture” and “sustainable intensification”.
Economic
In economic terms the sector is small, accounting for only 1% of national GVA and employing around 400,000 people.
Ethical consumerism is generating market opportunities for farmers placing greater importance on effective leadership and management.
Legal / Regulatory
Environmental regulation of the control of water and emissions are examples of areas where science and technology skills will increasingly be required.
Animal welfare and CAP reforms are further drivers of change, expected to increase pressures on farm balance sheets and training budgets.
Social
The sector workforce is characterised by high levels of self‐employment (49%). Seasonal working, temporary foreign migrant labour and people with second jobs are also prevalent in the sector. Volunteering is also important in environmental conservation, fisheries management and forestry industries, and there are around 10,000 unpaid family workers (3% of the workforce, national average 0.3%).
The workforce is 99% white and with an older‐than‐average age profile. Skilled trades, elementary and managerial occupations are the most prevalent, reflecting the practical / vocational and entrepreneurial nature of the sector. A higher percentage of people in this sector have no formal qualifications than in other sectors, although the proportion of the workforce with intermediate and higher level skills has grown in recent years.
Environmental
Agriculture, forestry and fishing has a significant impact on the physical environment, as well as on sustainability and climate change.
Climate change presents the sector with both challenges and opportunities, and there is a growing understanding of the sector’s role beyond the provision of commodities.
Environmental regulation plays an important role in how the sector operates (see above).
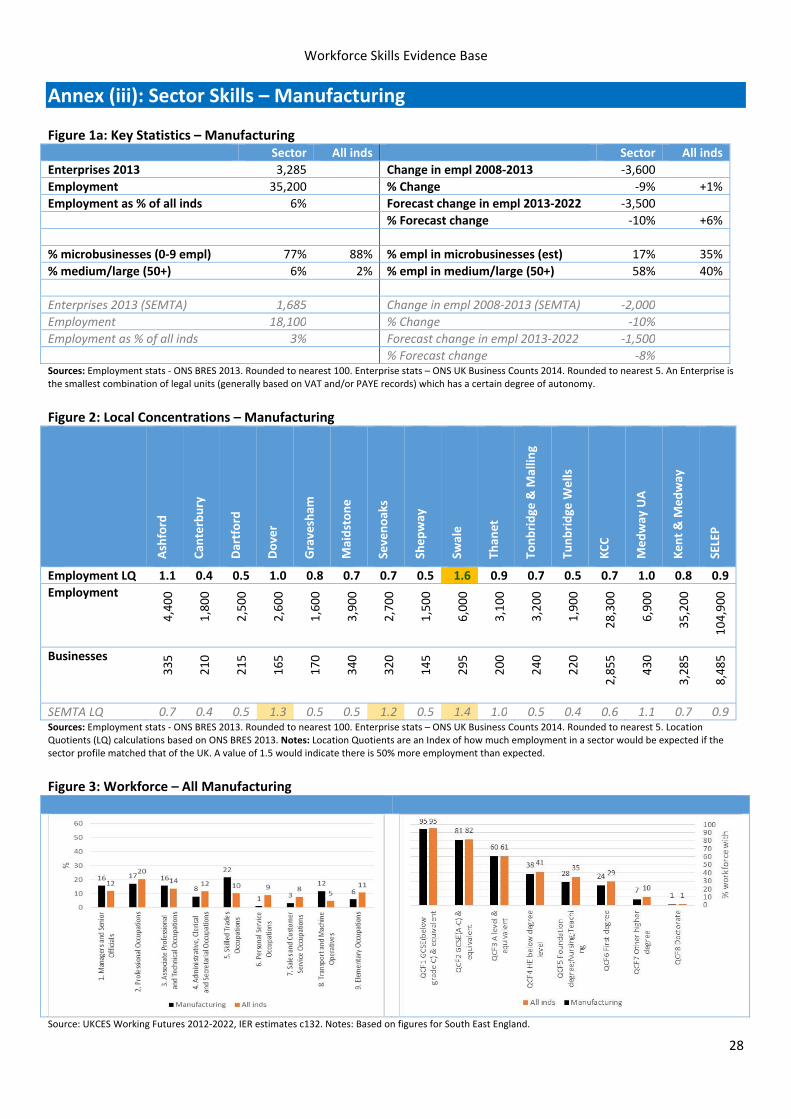
Workforce Skills Evidence Base
28
Annex (iii): Sector Skills – Manufacturing Figure 1a: Key Statistics – Manufacturing Sector All inds Sector All inds
Enterprises 2013 3,285 Change in empl 2008‐2013 ‐3,600
Employment 35,200 % Change ‐9% +1%
Employment as % of all inds 6% Forecast change in empl 2013‐2022 ‐3,500
% Forecast change ‐10% +6%
% microbusinesses (0‐9 empl) 77% 88% % empl in microbusinesses (est) 17% 35%
% medium/large (50+) 6% 2% % empl in medium/large (50+) 58% 40%
Enterprises 2013 (SEMTA) 1,685 Change in empl 2008‐2013 (SEMTA) ‐2,000
Employment 18,100 % Change ‐10%
Employment as % of all inds 3% Forecast change in empl 2013‐2022 ‐1,500
% Forecast change ‐8%Sources: Employment stats ‐ ONS BRES 2013. Rounded to nearest 100. Enterprise stats – ONS UK Business Counts 2014. Rounded to nearest 5. An Enterprise is the smallest combination of legal units (generally based on VAT and/or PAYE records) which has a certain degree of autonomy.
Figure 2: Local Concentrations – Manufacturing
Ashford
Can
terbury
Dartford
Dover
Gravesham
Maidstone
Sevenoaks
Shepway
Swale
Than
et
Tonbridge & M
allin
g
Tunbridge
Wells
KCC
Medway UA
Kent & M
edway
SELEP
Employment LQ 1.1 0.4 0.5 1.0 0.8 0.7 0.7 0.5 1.6 0.9 0.7 0.5 0.7 1.0 0.8 0.9
Employment
4,400
1,800
2,500
2,600
1,600
3,900
2,700
1,500
6,000
3,100
3,200
1,900
28,300
6,900
35,200
104,900
Businesses
335
210
215
165
170
340
320
145
295
200
240
220
2,855
430
3,285
8,485
SEMTA LQ 0.7 0.4 0.5 1.3 0.5 0.5 1.2 0.5 1.4 1.0 0.5 0.4 0.6 1.1 0.7 0.9Sources: Employment stats ‐ ONS BRES 2013. Rounded to nearest 100. Enterprise stats – ONS UK Business Counts 2014. Rounded to nearest 5. Location Quotients (LQ) calculations based on ONS BRES 2013. Notes: Location Quotients are an Index of how much employment in a sector would be expected if the sector profile matched that of the UK. A value of 1.5 would indicate there is 50% more employment than expected.
Figure 3: Workforce – All Manufacturing
Source: UKCES Working Futures 2012‐2022, IER estimates c132. Notes: Based on figures for South East England.
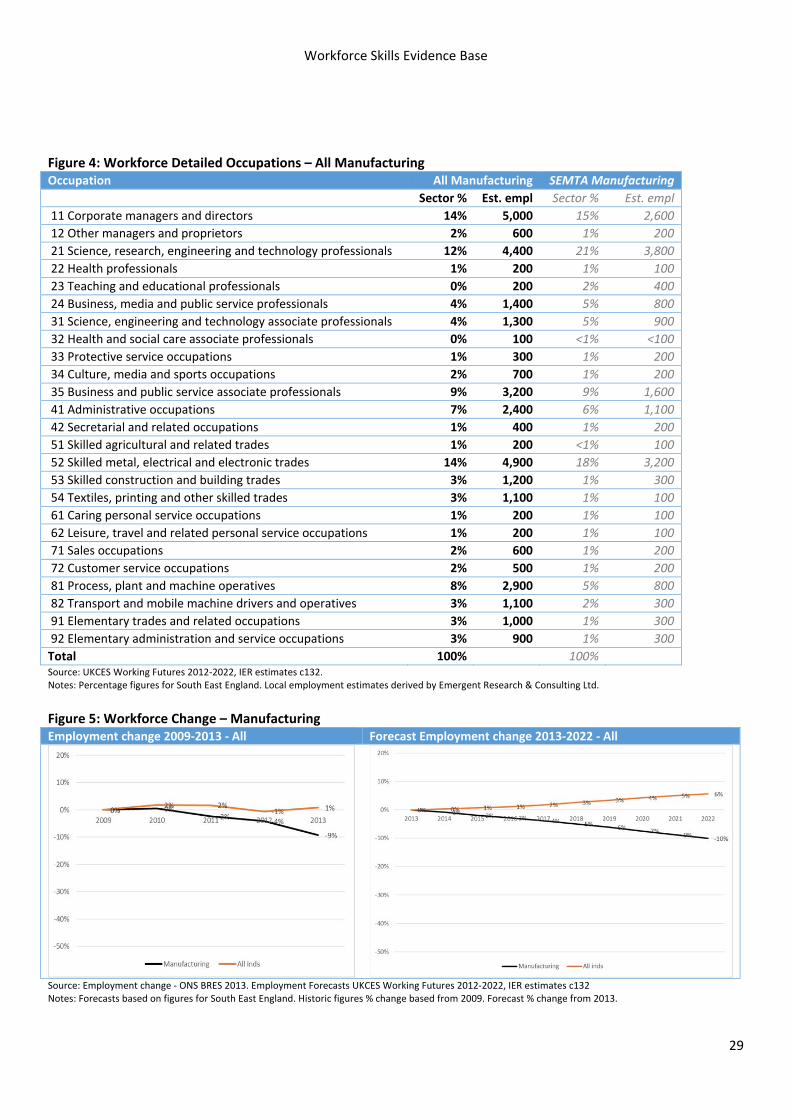
Workforce Skills Evidence Base
29
Figure 4: Workforce Detailed Occupations – All Manufacturing Occupation All Manufacturing SEMTA Manufacturing
Sector % Est. empl Sector % Est. empl
11 Corporate managers and directors 14% 5,000 15% 2,600
12 Other managers and proprietors 2% 600 1% 200
21 Science, research, engineering and technology professionals 12% 4,400 21% 3,800
22 Health professionals 1% 200 1% 100
23 Teaching and educational professionals 0% 200 2% 400
24 Business, media and public service professionals 4% 1,400 5% 800
31 Science, engineering and technology associate professionals 4% 1,300 5% 900
32 Health and social care associate professionals 0% 100 <1% <100
33 Protective service occupations 1% 300 1% 200
34 Culture, media and sports occupations 2% 700 1% 200
35 Business and public service associate professionals 9% 3,200 9% 1,600
41 Administrative occupations 7% 2,400 6% 1,100
42 Secretarial and related occupations 1% 400 1% 200
51 Skilled agricultural and related trades 1% 200 <1% 100
52 Skilled metal, electrical and electronic trades 14% 4,900 18% 3,200
53 Skilled construction and building trades 3% 1,200 1% 300
54 Textiles, printing and other skilled trades 3% 1,100 1% 100
61 Caring personal service occupations 1% 200 1% 100
62 Leisure, travel and related personal service occupations 1% 200 1% 100
71 Sales occupations 2% 600 1% 200
72 Customer service occupations 2% 500 1% 200
81 Process, plant and machine operatives 8% 2,900 5% 800
82 Transport and mobile machine drivers and operatives 3% 1,100 2% 300
91 Elementary trades and related occupations 3% 1,000 1% 300
92 Elementary administration and service occupations 3% 900 1% 300
Total 100% 100% Source: UKCES Working Futures 2012‐2022, IER estimates c132. Notes: Percentage figures for South East England. Local employment estimates derived by Emergent Research & Consulting Ltd.
Figure 5: Workforce Change – Manufacturing Employment change 2009‐2013 ‐ All Forecast Employment change 2013‐2022 ‐ All
Source: Employment change ‐ ONS BRES 2013. Employment Forecasts UKCES Working Futures 2012‐2022, IER estimates c132 Notes: Forecasts based on figures for South East England. Historic figures % change based from 2009. Forecast % change from 2013.
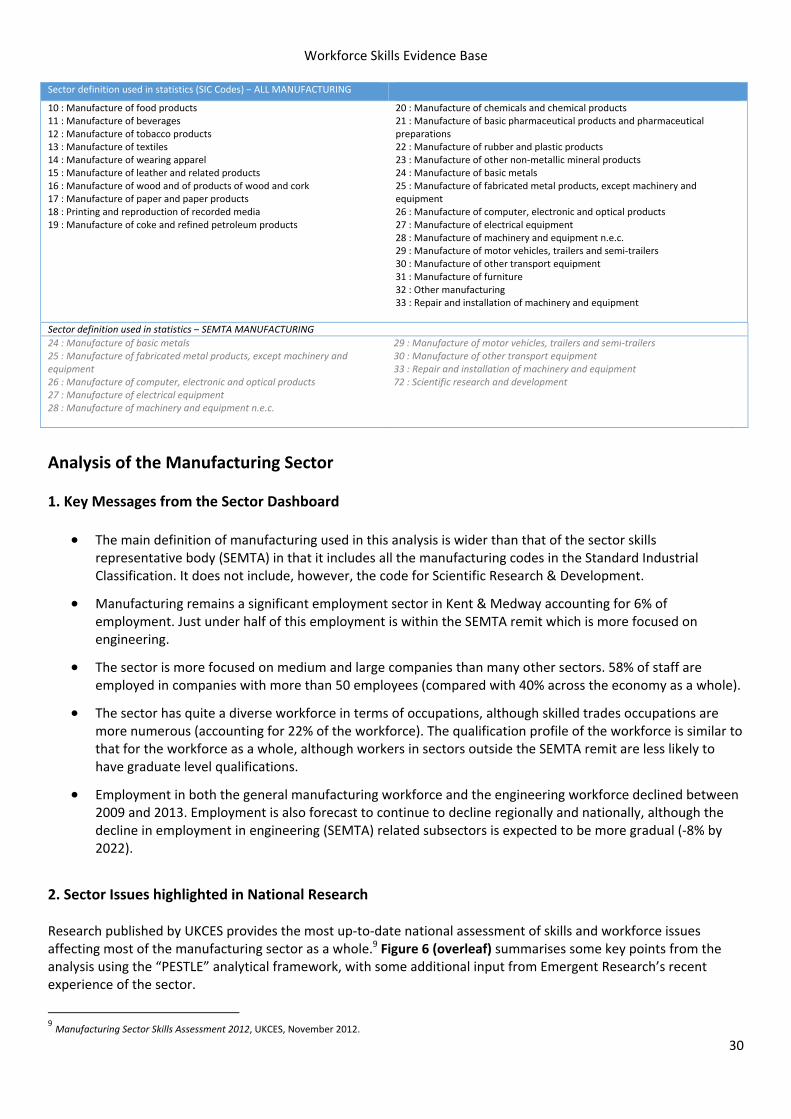
Workforce Skills Evidence Base
30
Sector definition used in statistics (SIC Codes) – ALL MANUFACTURING 10 : Manufacture of food products 11 : Manufacture of beverages 12 : Manufacture of tobacco products 13 : Manufacture of textiles 14 : Manufacture of wearing apparel 15 : Manufacture of leather and related products 16 : Manufacture of wood and of products of wood and cork 17 : Manufacture of paper and paper products 18 : Printing and reproduction of recorded media 19 : Manufacture of coke and refined petroleum products
20 : Manufacture of chemicals and chemical products 21 : Manufacture of basic pharmaceutical products and pharmaceutical preparations 22 : Manufacture of rubber and plastic products 23 : Manufacture of other non‐metallic mineral products 24 : Manufacture of basic metals 25 : Manufacture of fabricated metal products, except machinery and equipment 26 : Manufacture of computer, electronic and optical products 27 : Manufacture of electrical equipment 28 : Manufacture of machinery and equipment n.e.c. 29 : Manufacture of motor vehicles, trailers and semi‐trailers 30 : Manufacture of other transport equipment 31 : Manufacture of furniture 32 : Other manufacturing 33 : Repair and installation of machinery and equipment
Sector definition used in statistics – SEMTA MANUFACTURING
24 : Manufacture of basic metals 25 : Manufacture of fabricated metal products, except machinery and equipment 26 : Manufacture of computer, electronic and optical products 27 : Manufacture of electrical equipment 28 : Manufacture of machinery and equipment n.e.c.
29 : Manufacture of motor vehicles, trailers and semi‐trailers30 : Manufacture of other transport equipment 33 : Repair and installation of machinery and equipment 72 : Scientific research and development
Analysis of the Manufacturing Sector
1. Key Messages from the Sector Dashboard
The main definition of manufacturing used in this analysis is wider than that of the sector skills representative body (SEMTA) in that it includes all the manufacturing codes in the Standard Industrial Classification. It does not include, however, the code for Scientific Research & Development.
Manufacturing remains a significant employment sector in Kent & Medway accounting for 6% of employment. Just under half of this employment is within the SEMTA remit which is more focused on engineering.
The sector is more focused on medium and large companies than many other sectors. 58% of staff are employed in companies with more than 50 employees (compared with 40% across the economy as a whole).
The sector has quite a diverse workforce in terms of occupations, although skilled trades occupations are more numerous (accounting for 22% of the workforce). The qualification profile of the workforce is similar to that for the workforce as a whole, although workers in sectors outside the SEMTA remit are less likely to have graduate level qualifications.
Employment in both the general manufacturing workforce and the engineering workforce declined between 2009 and 2013. Employment is also forecast to continue to decline regionally and nationally, although the decline in employment in engineering (SEMTA) related subsectors is expected to be more gradual (‐8% by 2022).
2. Sector Issues highlighted in National Research Research published by UKCES provides the most up‐to‐date national assessment of skills and workforce issues affecting most of the manufacturing sector as a whole.9 Figure 6 (overleaf) summarises some key points from the analysis using the “PESTLE” analytical framework, with some additional input from Emergent Research’s recent experience of the sector.
9 Manufacturing Sector Skills Assessment 2012, UKCES, November 2012.
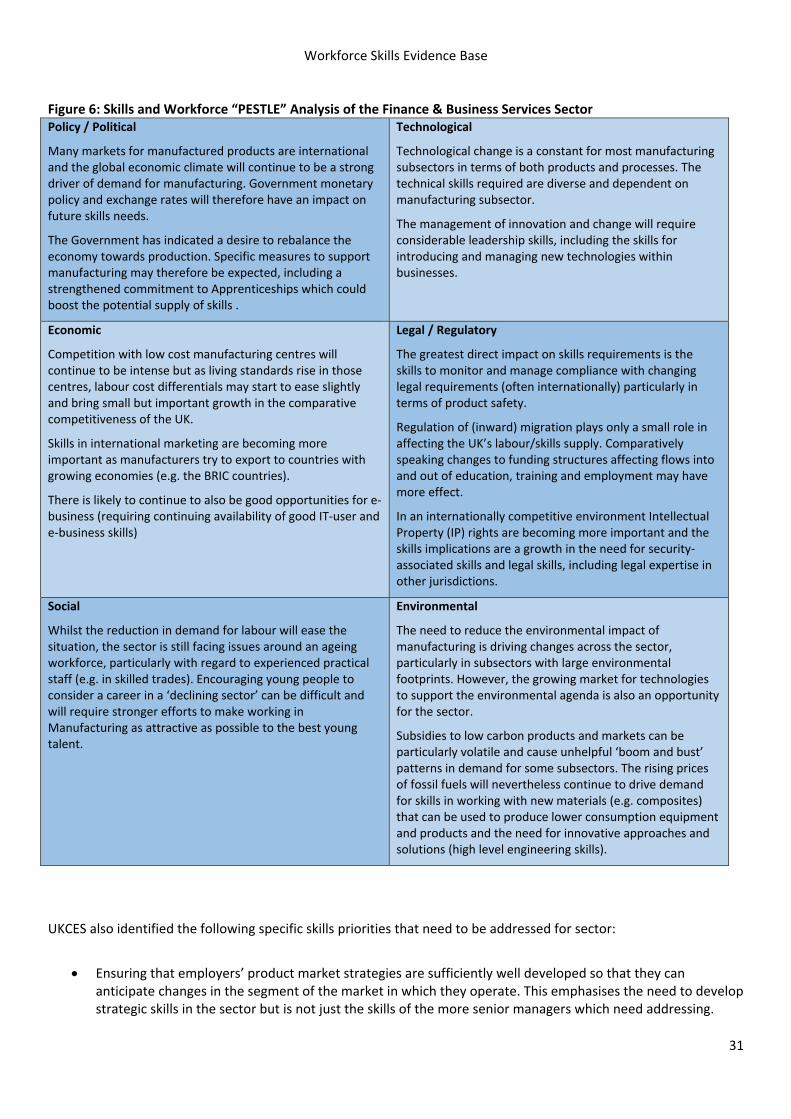
Workforce Skills Evidence Base
31
Figure 6: Skills and Workforce “PESTLE” Analysis of the Finance & Business Services Sector Policy / Political
Many markets for manufactured products are international and the global economic climate will continue to be a strong driver of demand for manufacturing. Government monetary policy and exchange rates will therefore have an impact on future skills needs.
The Government has indicated a desire to rebalance the economy towards production. Specific measures to support manufacturing may therefore be expected, including a strengthened commitment to Apprenticeships which could boost the potential supply of skills .
Technological
Technological change is a constant for most manufacturing subsectors in terms of both products and processes. The technical skills required are diverse and dependent on manufacturing subsector.
The management of innovation and change will require considerable leadership skills, including the skills for introducing and managing new technologies within businesses.
Economic
Competition with low cost manufacturing centres will continue to be intense but as living standards rise in those centres, labour cost differentials may start to ease slightly and bring small but important growth in the comparative competitiveness of the UK.
Skills in international marketing are becoming more important as manufacturers try to export to countries with growing economies (e.g. the BRIC countries).
There is likely to continue to also be good opportunities for e‐business (requiring continuing availability of good IT‐user and e‐business skills)
Legal / Regulatory
The greatest direct impact on skills requirements is the skills to monitor and manage compliance with changing legal requirements (often internationally) particularly in terms of product safety.
Regulation of (inward) migration plays only a small role in affecting the UK’s labour/skills supply. Comparatively speaking changes to funding structures affecting flows into and out of education, training and employment may have more effect.
In an internationally competitive environment Intellectual Property (IP) rights are becoming more important and the skills implications are a growth in the need for security‐associated skills and legal skills, including legal expertise in other jurisdictions.
Social
Whilst the reduction in demand for labour will ease the situation, the sector is still facing issues around an ageing workforce, particularly with regard to experienced practical staff (e.g. in skilled trades). Encouraging young people to consider a career in a ‘declining sector’ can be difficult and will require stronger efforts to make working in Manufacturing as attractive as possible to the best young talent.
Environmental
The need to reduce the environmental impact of manufacturing is driving changes across the sector, particularly in subsectors with large environmental footprints. However, the growing market for technologies to support the environmental agenda is also an opportunity for the sector.
Subsidies to low carbon products and markets can be particularly volatile and cause unhelpful ‘boom and bust’ patterns in demand for some subsectors. The rising prices of fossil fuels will nevertheless continue to drive demand for skills in working with new materials (e.g. composites) that can be used to produce lower consumption equipment and products and the need for innovative approaches and solutions (high level engineering skills).
UKCES also identified the following specific skills priorities that need to be addressed for sector:
Ensuring that employers’ product market strategies are sufficiently well developed so that they can anticipate changes in the segment of the market in which they operate. This emphasises the need to develop strategic skills in the sector but is not just the skills of the more senior managers which need addressing.

Workforce Skills Evidence Base
32
Ensuring that the skills of new recruits and existing employees are also developed, especially since there is evidence that training levels might be relatively low training needs to be embedded within the wider set of practices associated with high performance working including work‐life balance practices which might contribute to a more diverse workforce as well as a more productive one.
That the investment in training the existing workforce alongside the adoption of high performance practices likely to make the sector more attractive to would‐be recruits takes place.
A range of specialist skills within subsectors will need to be provided over the medium‐term, including those related to supply‐chain management.
The sector will increasingly compete with other sectors to recruit the people with the skills it needs. The pressing issue, therefore, is to convince people of the relative merits of choosing a career in manufacturing. Many of the UK’s leading manufacturers have succeeded in achieving this. It is important the practices associated with achieving this goal are adopted more widely.
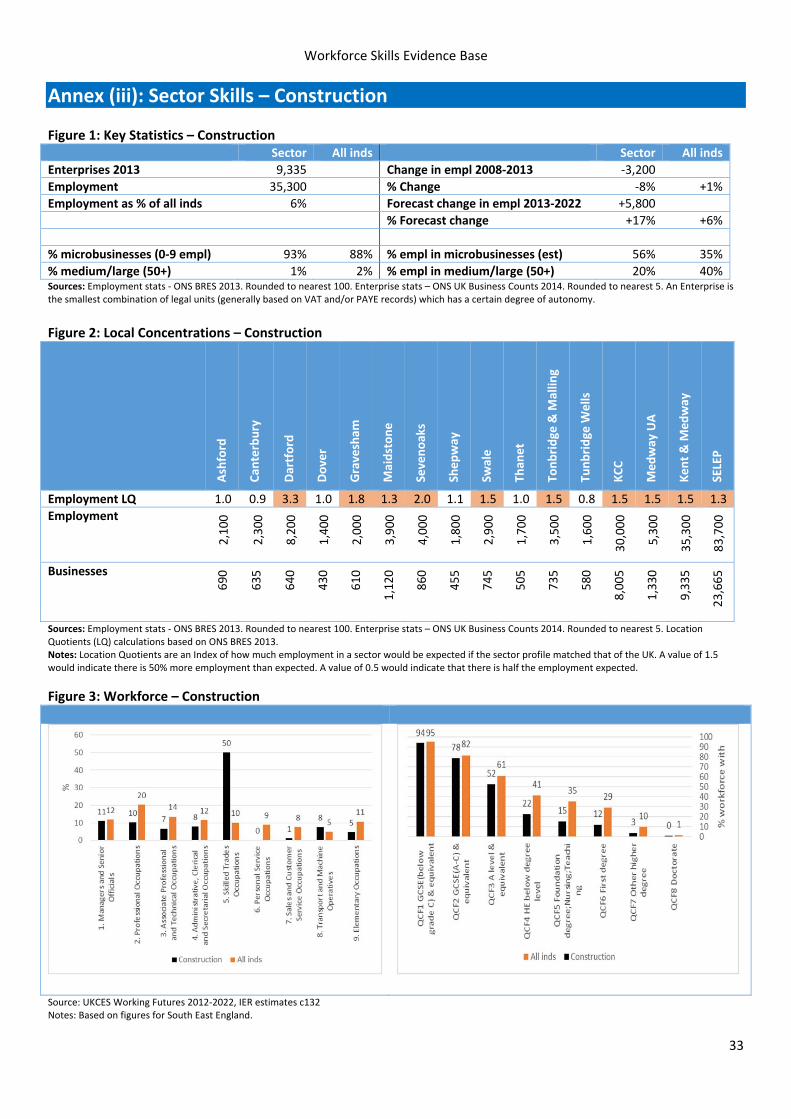
Workforce Skills Evidence Base
33
Annex (iii): Sector Skills – Construction Figure 1: Key Statistics – Construction Sector All inds Sector All inds
Enterprises 2013 9,335 Change in empl 2008‐2013 ‐3,200
Employment 35,300 % Change ‐8% +1%
Employment as % of all inds 6% Forecast change in empl 2013‐2022 +5,800
% Forecast change +17% +6%
% microbusinesses (0‐9 empl) 93% 88% % empl in microbusinesses (est) 56% 35%
% medium/large (50+) 1% 2% % empl in medium/large (50+) 20% 40%Sources: Employment stats ‐ ONS BRES 2013. Rounded to nearest 100. Enterprise stats – ONS UK Business Counts 2014. Rounded to nearest 5. An Enterprise is the smallest combination of legal units (generally based on VAT and/or PAYE records) which has a certain degree of autonomy.
Figure 2: Local Concentrations – Construction
Ashford
Can
terbury
Dartford
Dover
Gravesham
Maidstone
Sevenoaks
Shepway
Swale
Than
et
Tonbridge & M
allin
g
Tunbridge
Wells
KCC
Medway UA
Kent & M
edway
SELEP
Employment LQ 1.0 0.9 3.3 1.0 1.8 1.3 2.0 1.1 1.5 1.0 1.5 0.8 1.5 1.5 1.5 1.3
Employment
2,100
2,300
8,200
1,400
2,000
3,900
4,000
1,800
2,900
1,700
3,500
1,600
30,000
5,300
35,300
83,700
Businesses
690
635
640
430
610
1,120
860
455
745
505
735
580
8,005
1,330
9,335
23,665
Sources: Employment stats ‐ ONS BRES 2013. Rounded to nearest 100. Enterprise stats – ONS UK Business Counts 2014. Rounded to nearest 5. Location Quotients (LQ) calculations based on ONS BRES 2013. Notes: Location Quotients are an Index of how much employment in a sector would be expected if the sector profile matched that of the UK. A value of 1.5 would indicate there is 50% more employment than expected. A value of 0.5 would indicate that there is half the employment expected.
Figure 3: Workforce – Construction
Source: UKCES Working Futures 2012‐2022, IER estimates c132 Notes: Based on figures for South East England.

Workforce Skills Evidence Base
34
Figure 4: Workforce Detailed Occupations – Construction Occupation Sector % Est. empl
11 Corporate managers and directors 10% 4,100
12 Other managers and proprietors 1% 500
21 Science, research, engineering and technology professionals 7% 2,800
22 Health professionals 0% 100
23 Teaching and educational professionals 0% 100
24 Business, media and public service professionals 3% 1,400
31 Science, engineering and technology associate professionals 2% 800
32 Health and social care associate professionals 0% 0
33 Protective service occupations 0% 100
34 Culture, media and sports occupations 0% 100
35 Business and public service associate professionals 4% 1,800
41 Administrative occupations 5% 2,200
42 Secretarial and related occupations 2% 1,000
51 Skilled agricultural and related trades 0% 100
52 Skilled metal, electrical and electronic trades 12% 5,000
53 Skilled construction and building trades 36% 14,600
54 Textiles, printing and other skilled trades 1% 300
61 Caring personal service occupations 0% 0
62 Leisure, travel and related personal service occupations 0% 100
71 Sales occupations 0% 200
72 Customer service occupations 1% 400
81 Process, plant and machine operatives 5% 1,900
82 Transport and mobile machine drivers and operatives 3% 1,200
91 Elementary trades and related occupations 3% 1,000
92 Elementary administration and service occupations 2% 800
Total 100% Source: UKCES Working Futures 2012‐2022, IER estimates c132. Notes: Percentage figures for South East England. Local estimates derived by Emergent Research & Consulting Ltd.
Figure 5: Workforce Change – Construction Employment change 2009‐2013 Forecast Employment change 2013‐2022
Source: Employment change ‐ ONS BRES 2013. Employment Forecasts UKCES Working Futures 2012‐2022, IER estimates c132 Notes: Forecasts based on figures for South East England. Historic figures % change based from 2009. Forecast % change from 2013.
Sector definition used in statistics
SIC 41 : Construction of buildings SIC 42 : Civil engineering SIC 43 : Specialised construction activities
Workforce Skills Evidence Base
35
Analysis of the Construction Sector
1. Key Messages from the Sector Dashboard
The sector is especially dominated by micro‐businesses (with up to 9 employees) when compared with the business population as a whole, and, although employment in the sector fell by 3,200 between 2008 and 2013, it is expected to grow by nearly 6,000 jobs in the coming years.
The northern parts of Kent and Medway have the highest concentrations of employment in the sector, perhaps reflecting their proximity to the London market. Employment is especially concentrated in Dartford, which accounts for 23% of sector employment in Kent and Medway.
As regards workforce characteristics, the stand‐out feature is the dominance of skilled trades occupations. These account for 50% of the construction sector workforce, but only 10% of the workforce for all sectors. The sector workforce skills profile shows that people employed in the sector are generally less well qualified than the overall workforce in terms of qualification levels. This is especially the case for Higher Level qualifications (QCF Level 4+).
The construction workforce is more volatile than that of the economy as a whole: more jobs are lost in times of recession, but more jobs are added when growth returns. This means that the economic recovery is likely to especially ramp up demand for construction workers, with the workforce forecast to grow by 17% from 2013 to 2022 (for the workforce as a whole the figure is only 6%).
2. Sector Issues Identified in National Research Research by the UK Commission for Employment and Skills (UKCES)10 provides a relatively recent national assessment of skills and workforce issues affecting the sector. Figure 6 (overleaf) summarises some key points from the analysis using the “PESTLE” analytical framework, with some additional input from Emergent Research’s recent experience of the sector. The UKCES Sector Skills Assessment also identified the following specific skills priorities that need to be addressed:
New skills to meet the high specification and low energy requirements of future buildings and infrastructure
(BIM and offsite manufacturing).
Changes in management and professional skills, with increasing demand for higher level skills. Required to
operate a business profitably in a very competitive environment, make the best use of the skills of the
current workforce, and to handle new management requirements like carbon accounting.
A need for site supervisors and site labour to have an understanding of modern terminology, the ability to
read, understand and follow instructions on new materials and components.
For professional services, in addition to understanding how new components will operate over the lifetime
of a building, off‐site manufacture of components will require increased need for CAD / CAM trained building
technicians to work on off‐sire design and application in factory conditions.
Increased multi‐skilling, given that new ways of working will not always require new skills or create new
jobs, but will often be in addition to or an amalgam of existing workers’ skill sets.
10 Construction, Building Services Engineering and Planning Sector Skills Assessment 2012, Breuer, Z, UKCES, October 2012.
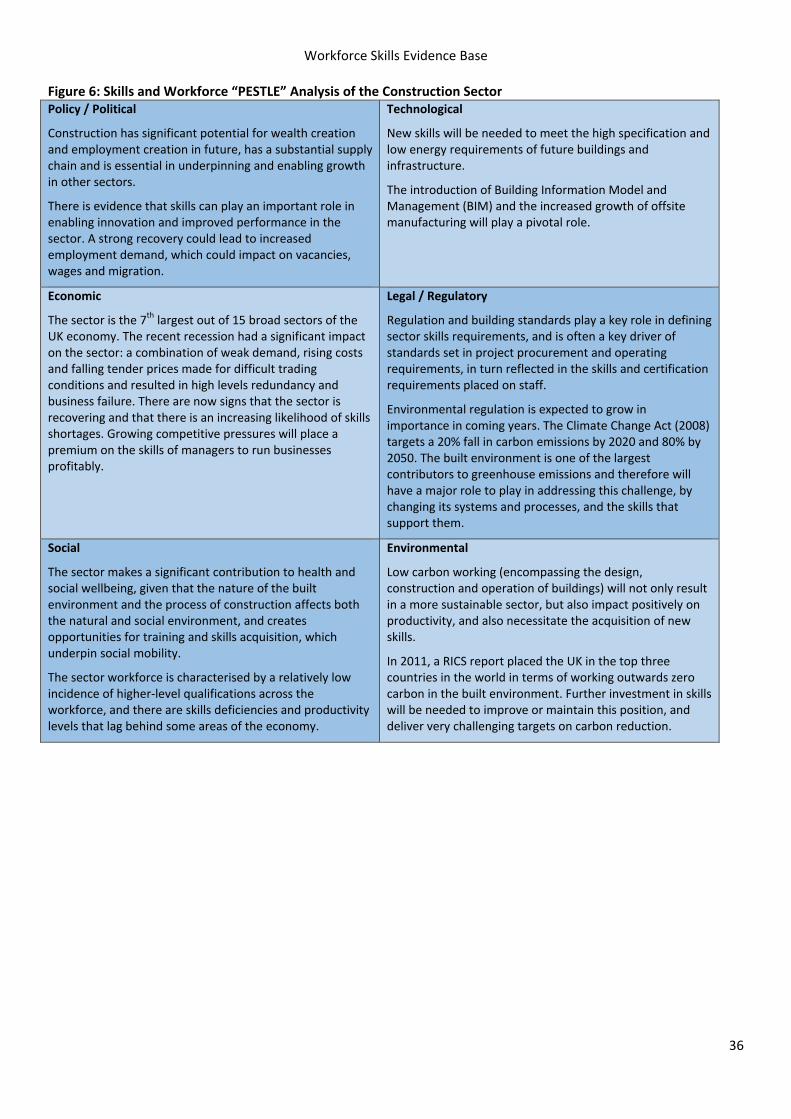
Workforce Skills Evidence Base
36
Figure 6: Skills and Workforce “PESTLE” Analysis of the Construction Sector Policy / Political
Construction has significant potential for wealth creation and employment creation in future, has a substantial supply chain and is essential in underpinning and enabling growth in other sectors.
There is evidence that skills can play an important role in enabling innovation and improved performance in the sector. A strong recovery could lead to increased employment demand, which could impact on vacancies, wages and migration.
Technological
New skills will be needed to meet the high specification and low energy requirements of future buildings and infrastructure.
The introduction of Building Information Model and Management (BIM) and the increased growth of offsite manufacturing will play a pivotal role.
Economic
The sector is the 7th largest out of 15 broad sectors of the UK economy. The recent recession had a significant impact on the sector: a combination of weak demand, rising costs and falling tender prices made for difficult trading conditions and resulted in high levels redundancy and business failure. There are now signs that the sector is recovering and that there is an increasing likelihood of skills shortages. Growing competitive pressures will place a premium on the skills of managers to run businesses profitably.
Legal / Regulatory
Regulation and building standards play a key role in defining sector skills requirements, and is often a key driver of standards set in project procurement and operating requirements, in turn reflected in the skills and certification requirements placed on staff.
Environmental regulation is expected to grow in importance in coming years. The Climate Change Act (2008) targets a 20% fall in carbon emissions by 2020 and 80% by 2050. The built environment is one of the largest contributors to greenhouse emissions and therefore will have a major role to play in addressing this challenge, by changing its systems and processes, and the skills that support them.
Social
The sector makes a significant contribution to health and social wellbeing, given that the nature of the built environment and the process of construction affects both the natural and social environment, and creates opportunities for training and skills acquisition, which underpin social mobility.
The sector workforce is characterised by a relatively low incidence of higher‐level qualifications across the workforce, and there are skills deficiencies and productivity levels that lag behind some areas of the economy.
Environmental
Low carbon working (encompassing the design, construction and operation of buildings) will not only result in a more sustainable sector, but also impact positively on productivity, and also necessitate the acquisition of new skills.
In 2011, a RICS report placed the UK in the top three countries in the world in terms of working outwards zero carbon in the built environment. Further investment in skills will be needed to improve or maintain this position, and deliver very challenging targets on carbon reduction.

Workforce Skills Evidence Base
37
Annex (iii): Sector Skills – Retail Figure 1: Key Statistics – Retail Sector Sector All inds Sector All inds
Enterprises 2013 4,695 Change in empl 2008‐2013 +3,300
Employment 71,800 % Change +5% +1%
Employment as % of all inds 13% Forecast change in empl 2013‐2022 1,800
% Forecast change +3% +6%
% microbusinesses (0‐9 empl) 91% 88% % empl in microbusinesses (est) 46% 35%
% medium/large (50+) 1% 2% % empl in medium/large (50+) 26% 40%Sources: Employment stats ‐ ONS BRES 2013. Rounded to nearest 100. Enterprise stats – ONS UK Business Counts 2014. Rounded to nearest 5. An Enterprise is the smallest combination of legal units (generally based on VAT and/or PAYE records) which has a certain degree of autonomy.
Figure 2: Local Concentrations – Retail Sector
Ashford
Can
terbury
Dartford
Dover
Gravesham
Maidstone
Sevenoaks
Shepway
Swale
Than
et
Tonbridge & M
allin
g
Tunbridge
Wells
KCC
Medway UA
Kent & M
edway
SELEP
Employment LQ 1.2 1.3 1.8 1.0 1.4 1.0 1.0 1.2 1.1 1.5 1.3 1.5 1.3 1.2 1.3 1.2
Employment
6,200
8,000
10,300
3,200
3,700
6,600
4,600
4,100
4,900
6,000
7,400
6,800
62,100
9,700
71,800
181,700
Businesses
345
455
255
280
255
415
370
295
320
350
285
465
4,085
610
4,695
11,525
Sources: Employment stats ‐ ONS BRES 2013. Rounded to nearest 100. Enterprise stats – ONS UK Business Counts 2014. Rounded to nearest 5. Location Quotients (LQ) calculations based on ONS BRES 2013. Notes: Location Quotients are an Index of how much employment in a sector would be expected if the sector profile matched that of the UK. A value of 1.5 would indicate there is 50% more employment than expected. A value of 0.5 would indicate that there is half the employment expected.
Figure 3: Workforce – Retail Sector
Source: UKCES Working Futures 2012‐2022, IER estimates c132 Notes: Based on figures for South East England.
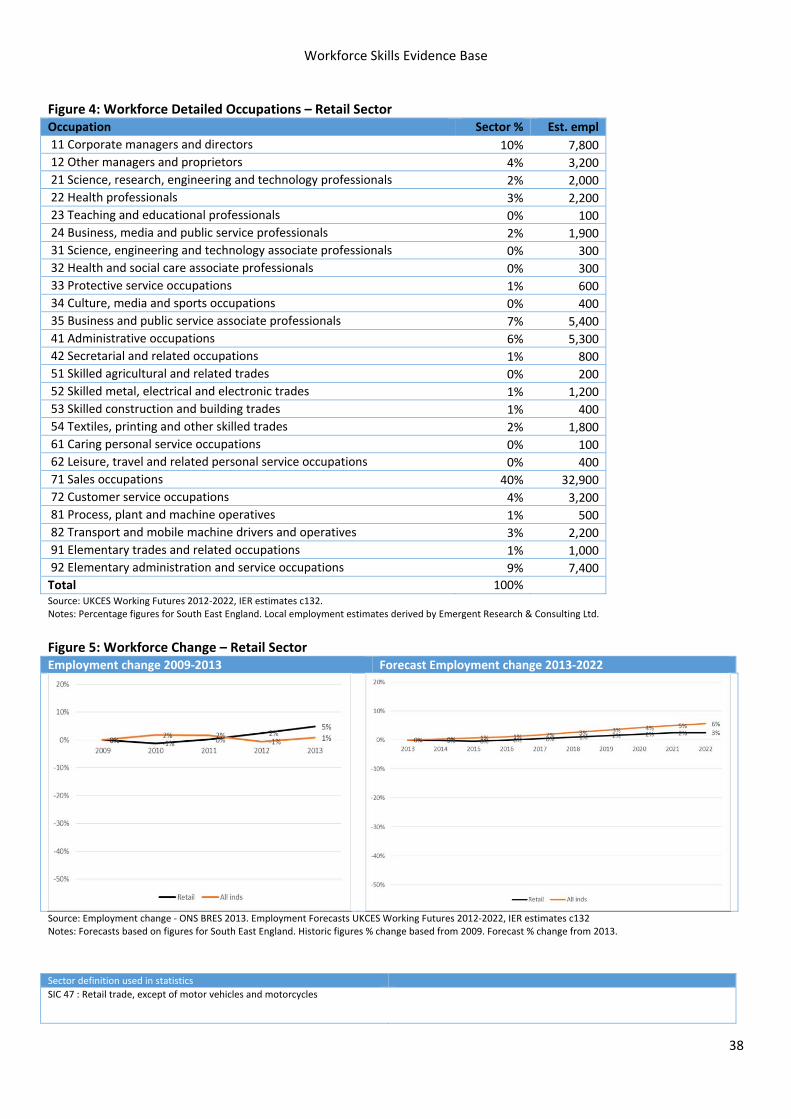
Workforce Skills Evidence Base
38
Figure 4: Workforce Detailed Occupations – Retail Sector Occupation Sector % Est. empl
11 Corporate managers and directors 10% 7,800
12 Other managers and proprietors 4% 3,200
21 Science, research, engineering and technology professionals 2% 2,000
22 Health professionals 3% 2,200
23 Teaching and educational professionals 0% 100
24 Business, media and public service professionals 2% 1,900
31 Science, engineering and technology associate professionals 0% 300
32 Health and social care associate professionals 0% 300
33 Protective service occupations 1% 600
34 Culture, media and sports occupations 0% 400
35 Business and public service associate professionals 7% 5,400
41 Administrative occupations 6% 5,300
42 Secretarial and related occupations 1% 800
51 Skilled agricultural and related trades 0% 200
52 Skilled metal, electrical and electronic trades 1% 1,200
53 Skilled construction and building trades 1% 400
54 Textiles, printing and other skilled trades 2% 1,800
61 Caring personal service occupations 0% 100
62 Leisure, travel and related personal service occupations 0% 400
71 Sales occupations 40% 32,900
72 Customer service occupations 4% 3,200
81 Process, plant and machine operatives 1% 500
82 Transport and mobile machine drivers and operatives 3% 2,200
91 Elementary trades and related occupations 1% 1,000
92 Elementary administration and service occupations 9% 7,400
Total 100% Source: UKCES Working Futures 2012‐2022, IER estimates c132. Notes: Percentage figures for South East England. Local employment estimates derived by Emergent Research & Consulting Ltd.
Figure 5: Workforce Change – Retail Sector Employment change 2009‐2013 Forecast Employment change 2013‐2022
Source: Employment change ‐ ONS BRES 2013. Employment Forecasts UKCES Working Futures 2012‐2022, IER estimates c132 Notes: Forecasts based on figures for South East England. Historic figures % change based from 2009. Forecast % change from 2013.
Sector definition used in statistics
SIC 47 : Retail trade, except of motor vehicles and motorcycles
Workforce Skills Evidence Base
39
Analysis of the Retail Sector
1. Key Messages from the Sector Dashboard
The retail sector is a significant employment sector in Kent & Medway accounting for 13% of the area’s workforce and is well represented across the area as a whole. Many Districts have higher than national proportions of employment in the sector and there is a particularly large concentration of retail employment in Dartford in particular (which includes the Bluewater development).
Although some retail employers are very large, microbusinesses with fewer than 10 staff employ a larger proportion of the workforce than they do across the economy as a whole (46% compared with 35%).
Nearly half (45%) of all employment in the sector is focused in sales and customer services occupations. The qualification profile of the workforce is comparatively focused on lower level qualifications. Only 46% of the workforce have a level 3 qualification (compared with 61% of all workers).
Employment in the sector within Kent & Medway grew by 5% between 2009 and 2013 but the sector is not expected to grow as fast as overall employment over the next 5‐7 years. Nevertheless, the size of the sector means that modest growth (3%) could translate to an additional requirement of 2‐3,000 staff by 2022.
2. Sector Issues highlighted in National Research Research published by UKCES provides the most up‐to‐date national assessment of skills and workforce issues affecting most of the retail sector as a whole.11 Figure 6 (overleaf) summarises some key points from the analysis using the “PESTLE” analytical framework, with some additional input from Emergent Research’s recent experience of the sector. The report concludes that the sector needs to address to the following priority areas in order to manage and make the most of the change and challenges it faces:
Attracting new entrants with the right skills, whilst this is partly about improving customer service skills in applicants it is also about improving the image of the sector as a career opportunity amongst prospective employees
Developing and retaining the workforce, including the interpersonal and IT skills of customer services staff but also the leadership and management skills of retail managers.
Appropriate customer service skills in the sector are required to ensure customer loyalty and attract new customers
Technological advances assisting the sector and requiring new/additional skill sets for employees
11 Wholesale and Retail: Sector Skills Assessment 2012, UKCES, November 2012.
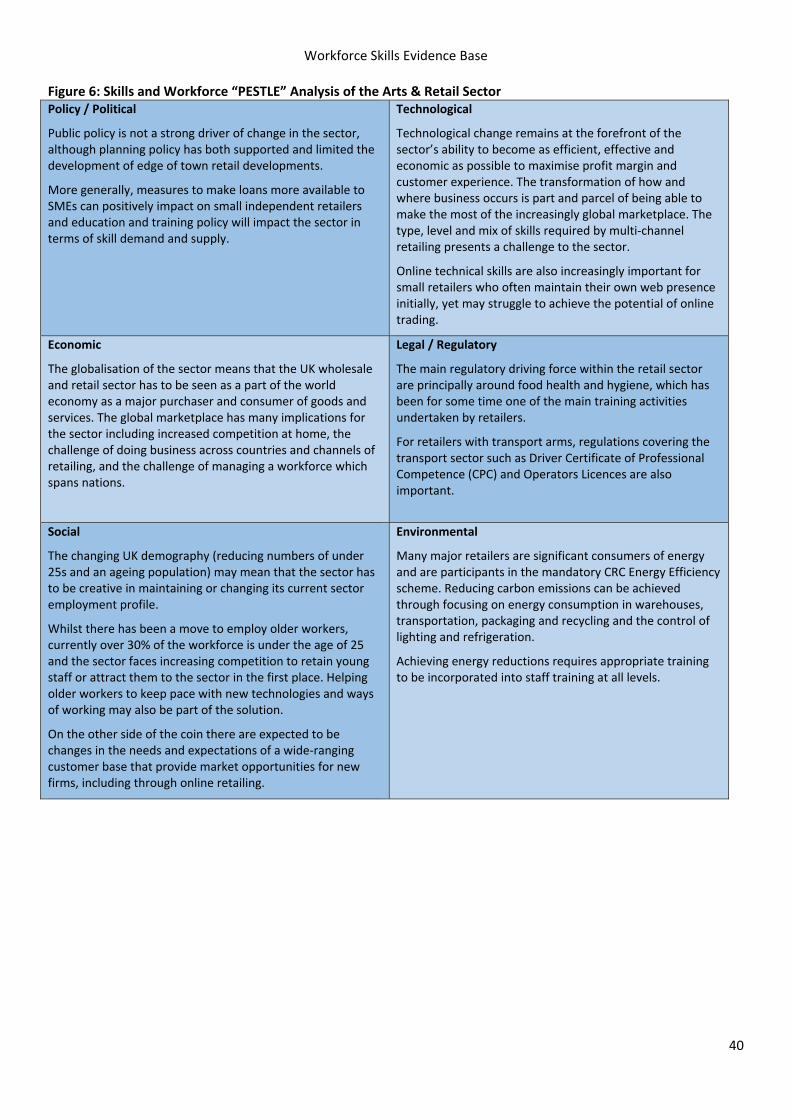
Workforce Skills Evidence Base
40
Figure 6: Skills and Workforce “PESTLE” Analysis of the Arts & Retail Sector Policy / Political
Public policy is not a strong driver of change in the sector, although planning policy has both supported and limited the development of edge of town retail developments.
More generally, measures to make loans more available to SMEs can positively impact on small independent retailers and education and training policy will impact the sector in terms of skill demand and supply.
Technological
Technological change remains at the forefront of the sector’s ability to become as efficient, effective and economic as possible to maximise profit margin and customer experience. The transformation of how and where business occurs is part and parcel of being able to make the most of the increasingly global marketplace. The type, level and mix of skills required by multi‐channel retailing presents a challenge to the sector.
Online technical skills are also increasingly important for small retailers who often maintain their own web presence initially, yet may struggle to achieve the potential of online trading.
Economic
The globalisation of the sector means that the UK wholesale and retail sector has to be seen as a part of the world economy as a major purchaser and consumer of goods and services. The global marketplace has many implications for the sector including increased competition at home, the challenge of doing business across countries and channels of retailing, and the challenge of managing a workforce which spans nations.
Legal / Regulatory
The main regulatory driving force within the retail sector are principally around food health and hygiene, which has been for some time one of the main training activities undertaken by retailers.
For retailers with transport arms, regulations covering the transport sector such as Driver Certificate of Professional Competence (CPC) and Operators Licences are also important.
Social
The changing UK demography (reducing numbers of under 25s and an ageing population) may mean that the sector has to be creative in maintaining or changing its current sector employment profile.
Whilst there has been a move to employ older workers, currently over 30% of the workforce is under the age of 25 and the sector faces increasing competition to retain young staff or attract them to the sector in the first place. Helping older workers to keep pace with new technologies and ways of working may also be part of the solution.
On the other side of the coin there are expected to be changes in the needs and expectations of a wide‐ranging customer base that provide market opportunities for new firms, including through online retailing.
Environmental
Many major retailers are significant consumers of energy and are participants in the mandatory CRC Energy Efficiency scheme. Reducing carbon emissions can be achieved through focusing on energy consumption in warehouses, transportation, packaging and recycling and the control of lighting and refrigeration.
Achieving energy reductions requires appropriate training to be incorporated into staff training at all levels.
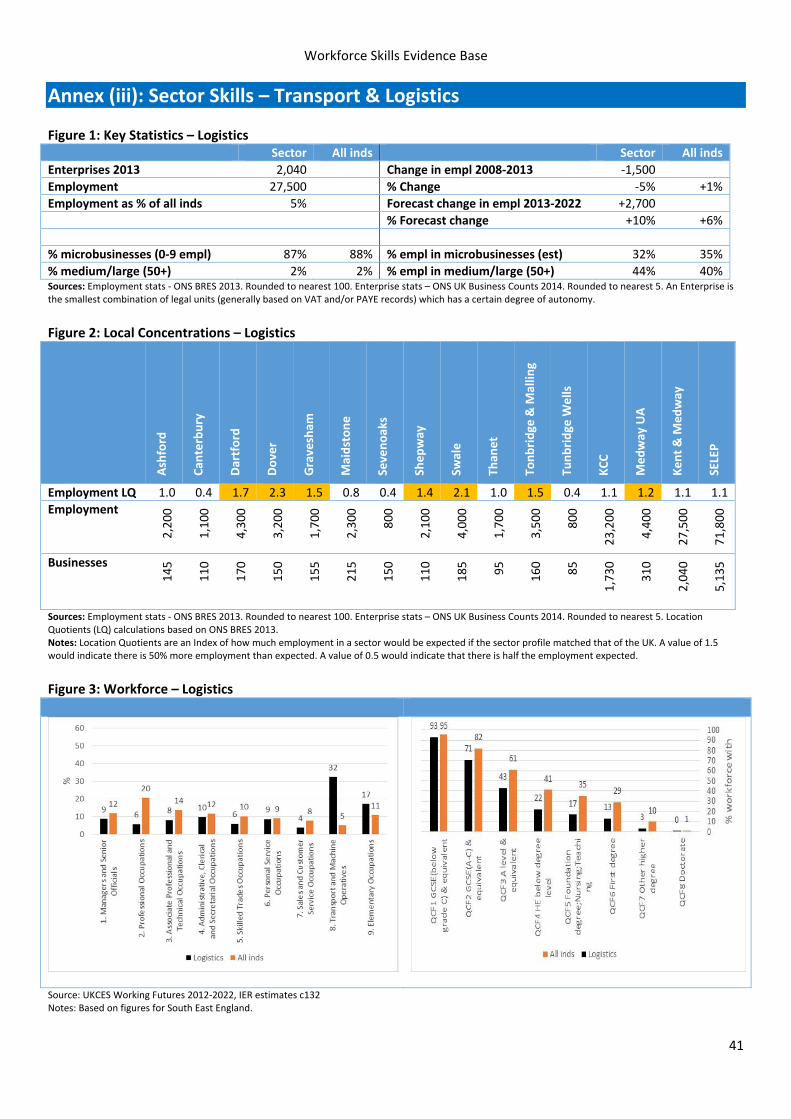
Workforce Skills Evidence Base
41
Annex (iii): Sector Skills – Transport & Logistics Figure 1: Key Statistics – Logistics Sector All inds Sector All inds
Enterprises 2013 2,040 Change in empl 2008‐2013 ‐1,500
Employment 27,500 % Change ‐5% +1%
Employment as % of all inds 5% Forecast change in empl 2013‐2022 +2,700
% Forecast change +10% +6%
% microbusinesses (0‐9 empl) 87% 88% % empl in microbusinesses (est) 32% 35%
% medium/large (50+) 2% 2% % empl in medium/large (50+) 44% 40%Sources: Employment stats ‐ ONS BRES 2013. Rounded to nearest 100. Enterprise stats – ONS UK Business Counts 2014. Rounded to nearest 5. An Enterprise is the smallest combination of legal units (generally based on VAT and/or PAYE records) which has a certain degree of autonomy.
Figure 2: Local Concentrations – Logistics
Ashford
Can
terbury
Dartford
Dover
Gravesham
Maidstone
Sevenoaks
Shepway
Swale
Than
et
Tonbridge & M
allin
g
Tunbridge
Wells
KCC
Medway UA
Kent & M
edway
SELEP
Employment LQ 1.0 0.4 1.7 2.3 1.5 0.8 0.4 1.4 2.1 1.0 1.5 0.4 1.1 1.2 1.1 1.1
Employment
2,200
1,100
4,300
3,200
1,700
2,300
800
2,100
4,000
1,700
3,500
800
23,200
4,400
27,500
71,800
Businesses
145
110
170
150
155
215
150
110
185
95
160
85
1,730
310
2,040
5,135
Sources: Employment stats ‐ ONS BRES 2013. Rounded to nearest 100. Enterprise stats – ONS UK Business Counts 2014. Rounded to nearest 5. Location Quotients (LQ) calculations based on ONS BRES 2013. Notes: Location Quotients are an Index of how much employment in a sector would be expected if the sector profile matched that of the UK. A value of 1.5 would indicate there is 50% more employment than expected. A value of 0.5 would indicate that there is half the employment expected.
Figure 3: Workforce – Logistics
Source: UKCES Working Futures 2012‐2022, IER estimates c132 Notes: Based on figures for South East England.
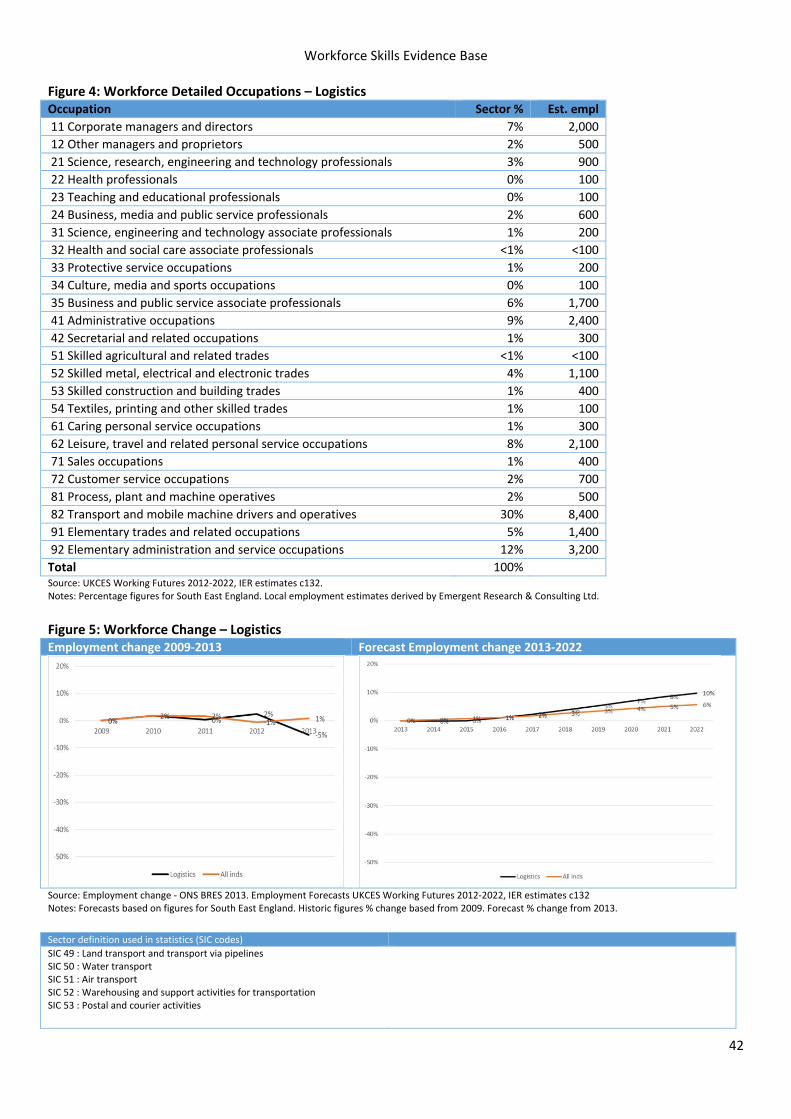
Workforce Skills Evidence Base
42
Figure 4: Workforce Detailed Occupations – Logistics Occupation Sector % Est. empl
11 Corporate managers and directors 7% 2,000
12 Other managers and proprietors 2% 500
21 Science, research, engineering and technology professionals 3% 900
22 Health professionals 0% 100
23 Teaching and educational professionals 0% 100
24 Business, media and public service professionals 2% 600
31 Science, engineering and technology associate professionals 1% 200
32 Health and social care associate professionals <1% <100
33 Protective service occupations 1% 200
34 Culture, media and sports occupations 0% 100
35 Business and public service associate professionals 6% 1,700
41 Administrative occupations 9% 2,400
42 Secretarial and related occupations 1% 300
51 Skilled agricultural and related trades <1% <100
52 Skilled metal, electrical and electronic trades 4% 1,100
53 Skilled construction and building trades 1% 400
54 Textiles, printing and other skilled trades 1% 100
61 Caring personal service occupations 1% 300
62 Leisure, travel and related personal service occupations 8% 2,100
71 Sales occupations 1% 400
72 Customer service occupations 2% 700
81 Process, plant and machine operatives 2% 500
82 Transport and mobile machine drivers and operatives 30% 8,400
91 Elementary trades and related occupations 5% 1,400
92 Elementary administration and service occupations 12% 3,200
Total 100% Source: UKCES Working Futures 2012‐2022, IER estimates c132. Notes: Percentage figures for South East England. Local employment estimates derived by Emergent Research & Consulting Ltd.
Figure 5: Workforce Change – Logistics Employment change 2009‐2013 Forecast Employment change 2013‐2022
Source: Employment change ‐ ONS BRES 2013. Employment Forecasts UKCES Working Futures 2012‐2022, IER estimates c132 Notes: Forecasts based on figures for South East England. Historic figures % change based from 2009. Forecast % change from 2013.
Sector definition used in statistics (SIC codes)
SIC 49 : Land transport and transport via pipelines SIC 50 : Water transport SIC 51 : Air transport SIC 52 : Warehousing and support activities for transportation SIC 53 : Postal and courier activities

Workforce Skills Evidence Base
43
Analysis of the Logistics Sector
1. Key Messages from the Sector Dashboard
Logistics is a significant employment sector in Kent & Medway accounting for 5% of the workforce (1 in 20 workers). Employment in the sector is particularly concentrated in areas well served by motorways near London and the port towns. There are higher than average employment concentrations in Dartford, Gravesham and Tonbridge & Malling and in Dover, Shepway and Swale.
Although the majority of logistics businesses are microbusinesses employing fewer than 10 staff, employment is slightly more likely to be concentrated in medium and large businesses (44% in businesses with 50+ staff) than the average for all industries.
Around a third of the workforce are transport and mobile machine operatives (drivers) and the qualification profile of the sector is more focused on low level qualifications than the all industry average. Some 57% of logistics workers do not have a level 3 qualification (compared with 39% across all industries).
Employment trends in the period between 2009 and 2013 were somewhat erratic but the sector is forecast to grow regionally in terms of employment at a faster rate than the economy overall. This could translate into a need for an additional 2‐3,000 workers in the sector in Kent & Medway by 2022.
2. Issues identified in National Research Research by the UK Commission for Employment and Skills (UKCES)12 provides the most up‐to‐date national assessment of skills and workforce issues affecting the sector. Figure 6 (overleaf) summarises some key points from the analysis using the “PESTLE” analytical framework, with some additional input from Emergent Research’s recent experience of the sector. UKCES also identified the following specific skills priorities that need to be addressed for sector:
Attract new recruits
Promote clearer development pathways
Professionalise the workforce and increase businesses’ investment in skills development.
Additionally, in the case of passenger transport, improving the customer service experience is considered to be crucial.
12Transportation and Storage Sector Skills Assessment 2012, UKCES, October 2012.
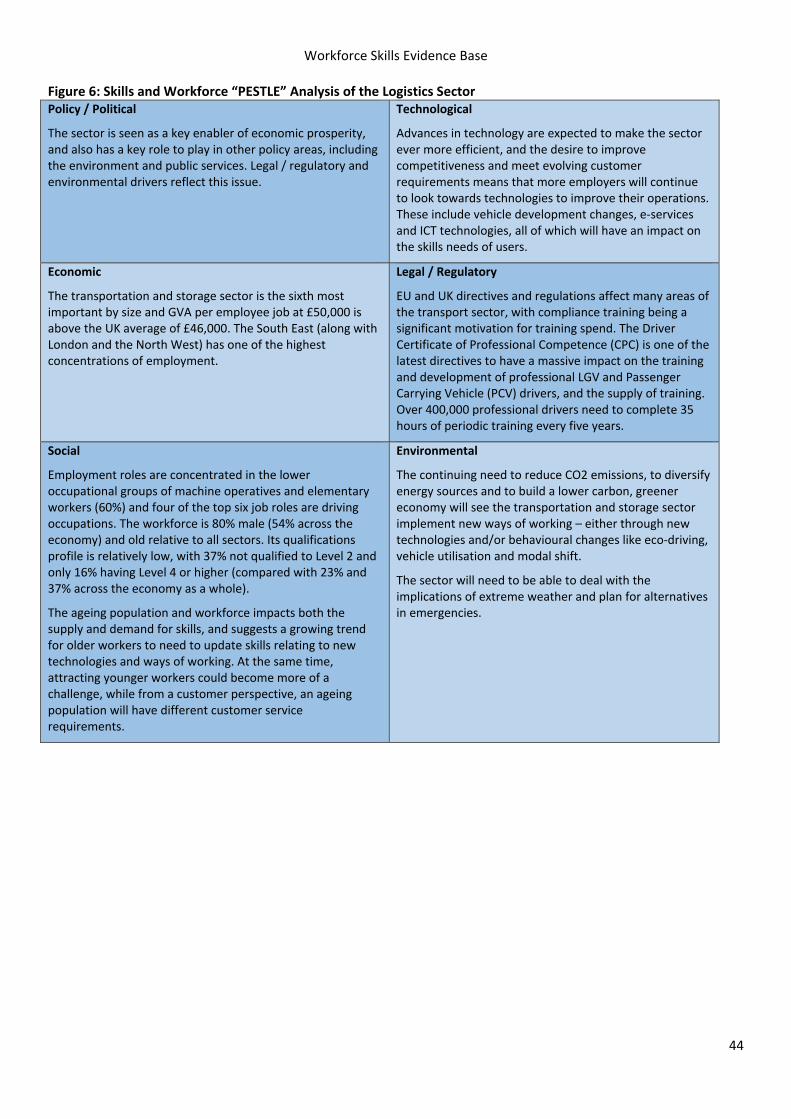
Workforce Skills Evidence Base
44
Figure 6: Skills and Workforce “PESTLE” Analysis of the Logistics Sector Policy / Political
The sector is seen as a key enabler of economic prosperity, and also has a key role to play in other policy areas, including the environment and public services. Legal / regulatory and environmental drivers reflect this issue.
Technological
Advances in technology are expected to make the sector ever more efficient, and the desire to improve competitiveness and meet evolving customer requirements means that more employers will continue to look towards technologies to improve their operations. These include vehicle development changes, e‐services and ICT technologies, all of which will have an impact on the skills needs of users.
Economic
The transportation and storage sector is the sixth most important by size and GVA per employee job at £50,000 is above the UK average of £46,000. The South East (along with London and the North West) has one of the highest concentrations of employment.
Legal / Regulatory
EU and UK directives and regulations affect many areas of the transport sector, with compliance training being a significant motivation for training spend. The Driver Certificate of Professional Competence (CPC) is one of the latest directives to have a massive impact on the training and development of professional LGV and Passenger Carrying Vehicle (PCV) drivers, and the supply of training. Over 400,000 professional drivers need to complete 35 hours of periodic training every five years.
Social
Employment roles are concentrated in the lower occupational groups of machine operatives and elementary workers (60%) and four of the top six job roles are driving occupations. The workforce is 80% male (54% across the economy) and old relative to all sectors. Its qualifications profile is relatively low, with 37% not qualified to Level 2 and only 16% having Level 4 or higher (compared with 23% and 37% across the economy as a whole).
The ageing population and workforce impacts both the supply and demand for skills, and suggests a growing trend for older workers to need to update skills relating to new technologies and ways of working. At the same time, attracting younger workers could become more of a challenge, while from a customer perspective, an ageing population will have different customer service requirements.
Environmental
The continuing need to reduce CO2 emissions, to diversify energy sources and to build a lower carbon, greener economy will see the transportation and storage sector implement new ways of working – either through new technologies and/or behavioural changes like eco‐driving, vehicle utilisation and modal shift.
The sector will need to be able to deal with the implications of extreme weather and plan for alternatives in emergencies.
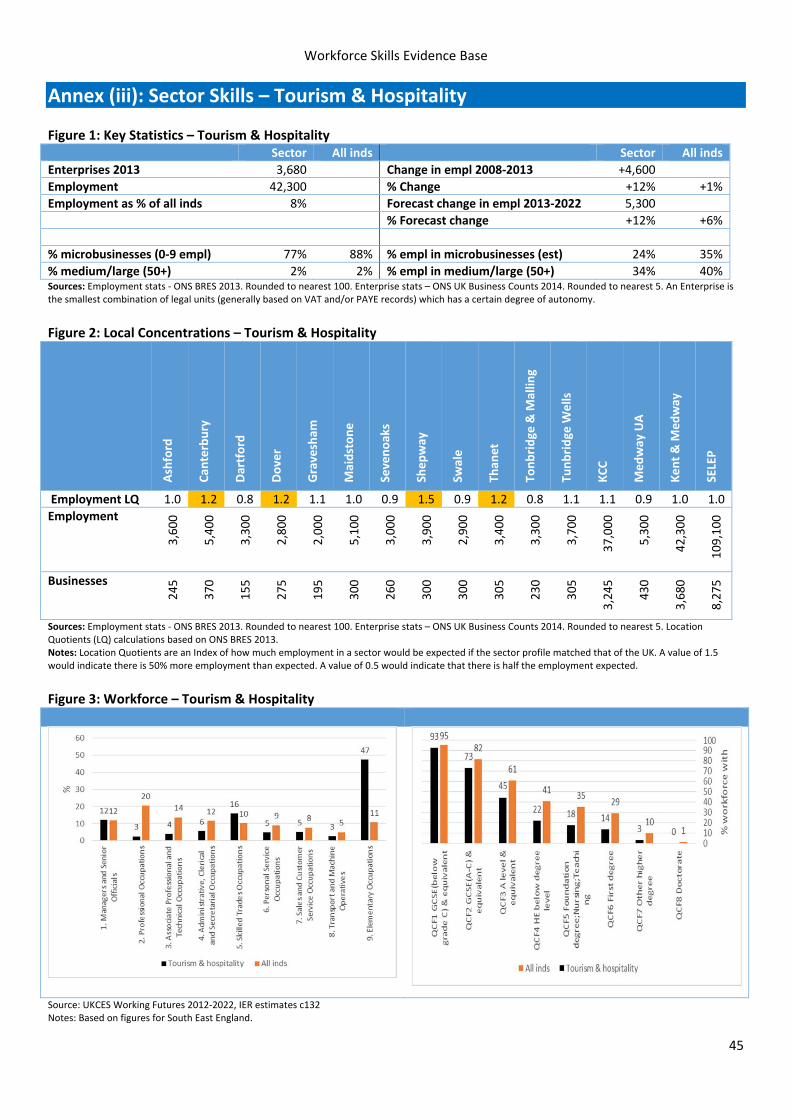
Workforce Skills Evidence Base
45
Annex (iii): Sector Skills – Tourism & Hospitality Figure 1: Key Statistics – Tourism & Hospitality Sector All inds Sector All inds
Enterprises 2013 3,680 Change in empl 2008‐2013 +4,600
Employment 42,300 % Change +12% +1%
Employment as % of all inds 8% Forecast change in empl 2013‐2022 5,300
% Forecast change +12% +6%
% microbusinesses (0‐9 empl) 77% 88% % empl in microbusinesses (est) 24% 35%
% medium/large (50+) 2% 2% % empl in medium/large (50+) 34% 40%Sources: Employment stats ‐ ONS BRES 2013. Rounded to nearest 100. Enterprise stats – ONS UK Business Counts 2014. Rounded to nearest 5. An Enterprise is the smallest combination of legal units (generally based on VAT and/or PAYE records) which has a certain degree of autonomy.
Figure 2: Local Concentrations – Tourism & Hospitality
Ashford
Can
terbury
Dartford
Dover
Gravesham
Maidstone
Sevenoaks
Shepway
Swale
Than
et
Tonbridge & M
allin
g
Tunbridge
Wells
KCC
Medway UA
Kent & M
edway
SELEP
Employment LQ 1.0 1.2 0.8 1.2 1.1 1.0 0.9 1.5 0.9 1.2 0.8 1.1 1.1 0.9 1.0 1.0
Employment
3,600
5,400
3,300
2,800
2,000
5,100
3,000
3,900
2,900
3,400
3,300
3,700
37,000
5,300
42,300
109,100
Businesses
245
370
155
275
195
300
260
300
300
305
230
305
3,245
430
3,680
8,275
Sources: Employment stats ‐ ONS BRES 2013. Rounded to nearest 100. Enterprise stats – ONS UK Business Counts 2014. Rounded to nearest 5. Location Quotients (LQ) calculations based on ONS BRES 2013. Notes: Location Quotients are an Index of how much employment in a sector would be expected if the sector profile matched that of the UK. A value of 1.5 would indicate there is 50% more employment than expected. A value of 0.5 would indicate that there is half the employment expected.
Figure 3: Workforce – Tourism & Hospitality
Source: UKCES Working Futures 2012‐2022, IER estimates c132 Notes: Based on figures for South East England.
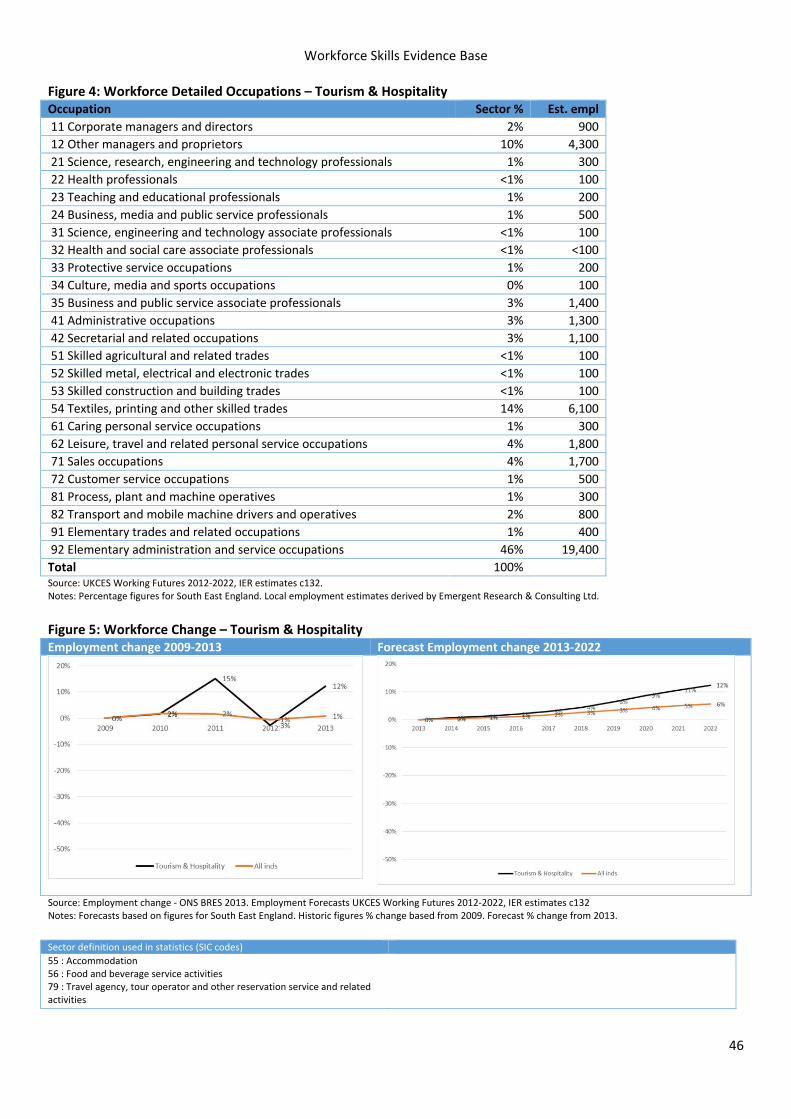
Workforce Skills Evidence Base
46
Figure 4: Workforce Detailed Occupations – Tourism & Hospitality Occupation Sector % Est. empl
11 Corporate managers and directors 2% 900
12 Other managers and proprietors 10% 4,300
21 Science, research, engineering and technology professionals 1% 300
22 Health professionals <1% 100
23 Teaching and educational professionals 1% 200
24 Business, media and public service professionals 1% 500
31 Science, engineering and technology associate professionals <1% 100
32 Health and social care associate professionals <1% <100
33 Protective service occupations 1% 200
34 Culture, media and sports occupations 0% 100
35 Business and public service associate professionals 3% 1,400
41 Administrative occupations 3% 1,300
42 Secretarial and related occupations 3% 1,100
51 Skilled agricultural and related trades <1% 100
52 Skilled metal, electrical and electronic trades <1% 100
53 Skilled construction and building trades <1% 100
54 Textiles, printing and other skilled trades 14% 6,100
61 Caring personal service occupations 1% 300
62 Leisure, travel and related personal service occupations 4% 1,800
71 Sales occupations 4% 1,700
72 Customer service occupations 1% 500
81 Process, plant and machine operatives 1% 300
82 Transport and mobile machine drivers and operatives 2% 800
91 Elementary trades and related occupations 1% 400
92 Elementary administration and service occupations 46% 19,400
Total 100% Source: UKCES Working Futures 2012‐2022, IER estimates c132. Notes: Percentage figures for South East England. Local employment estimates derived by Emergent Research & Consulting Ltd.
Figure 5: Workforce Change – Tourism & Hospitality Employment change 2009‐2013 Forecast Employment change 2013‐2022
Source: Employment change ‐ ONS BRES 2013. Employment Forecasts UKCES Working Futures 2012‐2022, IER estimates c132 Notes: Forecasts based on figures for South East England. Historic figures % change based from 2009. Forecast % change from 2013.
Sector definition used in statistics (SIC codes)
55 : Accommodation 56 : Food and beverage service activities 79 : Travel agency, tour operator and other reservation service and related activities
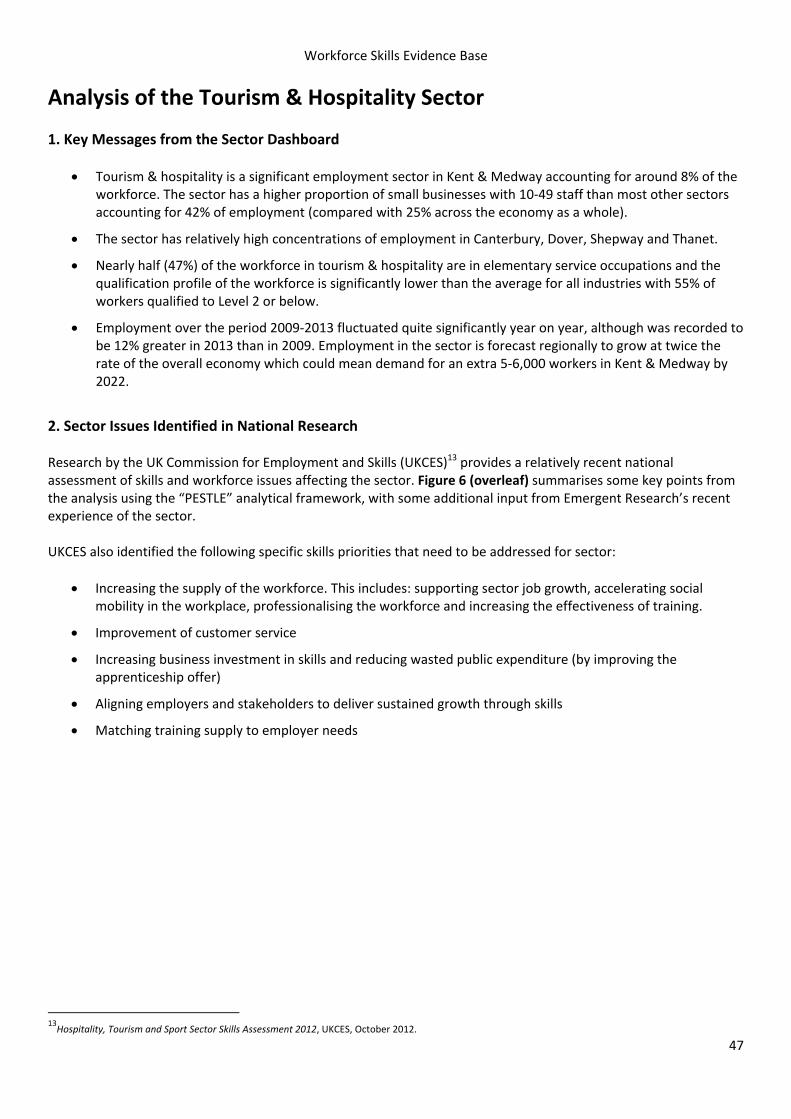
Workforce Skills Evidence Base
47
Analysis of the Tourism & Hospitality Sector
1. Key Messages from the Sector Dashboard
Tourism & hospitality is a significant employment sector in Kent & Medway accounting for around 8% of the workforce. The sector has a higher proportion of small businesses with 10‐49 staff than most other sectors accounting for 42% of employment (compared with 25% across the economy as a whole).
The sector has relatively high concentrations of employment in Canterbury, Dover, Shepway and Thanet.
Nearly half (47%) of the workforce in tourism & hospitality are in elementary service occupations and the qualification profile of the workforce is significantly lower than the average for all industries with 55% of workers qualified to Level 2 or below.
Employment over the period 2009‐2013 fluctuated quite significantly year on year, although was recorded to be 12% greater in 2013 than in 2009. Employment in the sector is forecast regionally to grow at twice the rate of the overall economy which could mean demand for an extra 5‐6,000 workers in Kent & Medway by 2022.
2. Sector Issues Identified in National Research Research by the UK Commission for Employment and Skills (UKCES)13 provides a relatively recent national assessment of skills and workforce issues affecting the sector. Figure 6 (overleaf) summarises some key points from the analysis using the “PESTLE” analytical framework, with some additional input from Emergent Research’s recent experience of the sector. UKCES also identified the following specific skills priorities that need to be addressed for sector:
Increasing the supply of the workforce. This includes: supporting sector job growth, accelerating social mobility in the workplace, professionalising the workforce and increasing the effectiveness of training.
Improvement of customer service
Increasing business investment in skills and reducing wasted public expenditure (by improving the apprenticeship offer)
Aligning employers and stakeholders to deliver sustained growth through skills
Matching training supply to employer needs
13Hospitality, Tourism and Sport Sector Skills Assessment 2012, UKCES, October 2012.
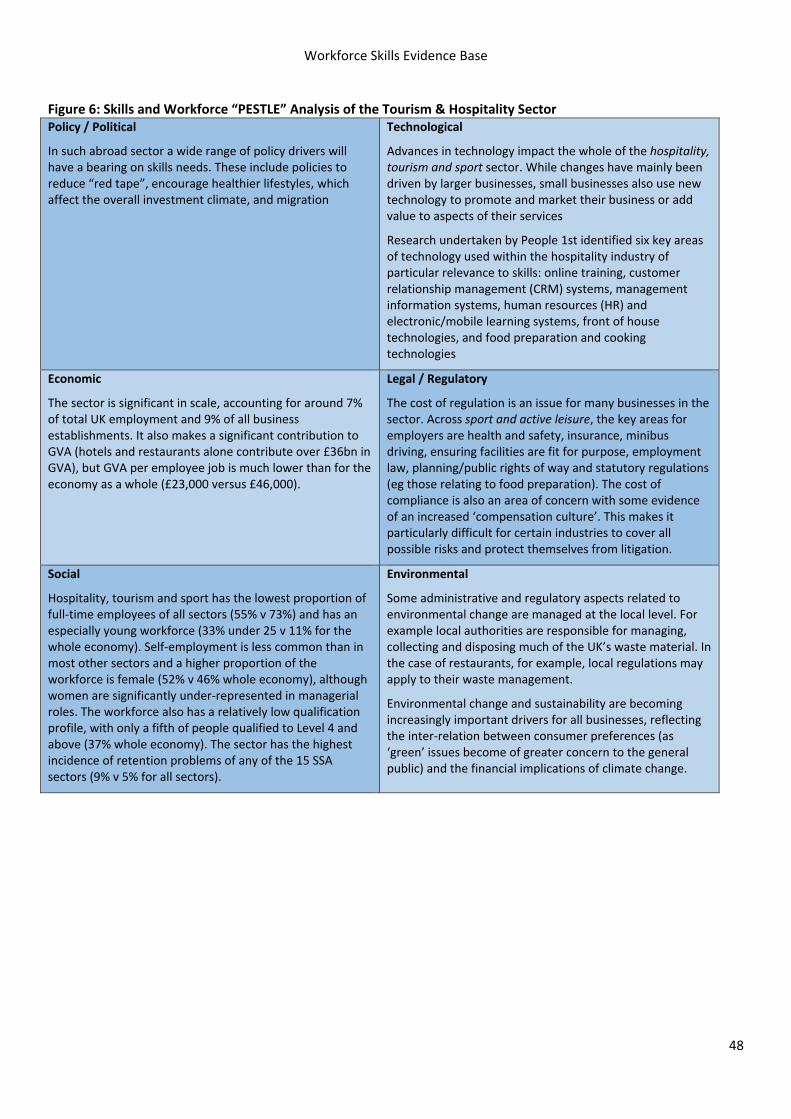
Workforce Skills Evidence Base
48
Figure 6: Skills and Workforce “PESTLE” Analysis of the Tourism & Hospitality Sector Policy / Political
In such abroad sector a wide range of policy drivers will have a bearing on skills needs. These include policies to reduce “red tape”, encourage healthier lifestyles, which affect the overall investment climate, and migration
Technological
Advances in technology impact the whole of the hospitality, tourism and sport sector. While changes have mainly been driven by larger businesses, small businesses also use new technology to promote and market their business or add value to aspects of their services
Research undertaken by People 1st identified six key areas of technology used within the hospitality industry of particular relevance to skills: online training, customer relationship management (CRM) systems, management information systems, human resources (HR) and electronic/mobile learning systems, front of house technologies, and food preparation and cooking technologies
Economic
The sector is significant in scale, accounting for around 7% of total UK employment and 9% of all business establishments. It also makes a significant contribution to GVA (hotels and restaurants alone contribute over £36bn in GVA), but GVA per employee job is much lower than for the economy as a whole (£23,000 versus £46,000).
Legal / Regulatory
The cost of regulation is an issue for many businesses in the sector. Across sport and active leisure, the key areas for employers are health and safety, insurance, minibus driving, ensuring facilities are fit for purpose, employment law, planning/public rights of way and statutory regulations (eg those relating to food preparation). The cost of compliance is also an area of concern with some evidence of an increased ‘compensation culture’. This makes it particularly difficult for certain industries to cover all possible risks and protect themselves from litigation.
Social
Hospitality, tourism and sport has the lowest proportion of full‐time employees of all sectors (55% v 73%) and has an especially young workforce (33% under 25 v 11% for the whole economy). Self‐employment is less common than in most other sectors and a higher proportion of the workforce is female (52% v 46% whole economy), although women are significantly under‐represented in managerial roles. The workforce also has a relatively low qualification profile, with only a fifth of people qualified to Level 4 and above (37% whole economy). The sector has the highest incidence of retention problems of any of the 15 SSA sectors (9% v 5% for all sectors).
Environmental
Some administrative and regulatory aspects related to environmental change are managed at the local level. For example local authorities are responsible for managing, collecting and disposing much of the UK’s waste material. In the case of restaurants, for example, local regulations may apply to their waste management.
Environmental change and sustainability are becoming increasingly important drivers for all businesses, reflecting the inter‐relation between consumer preferences (as ‘green’ issues become of greater concern to the general public) and the financial implications of climate change.
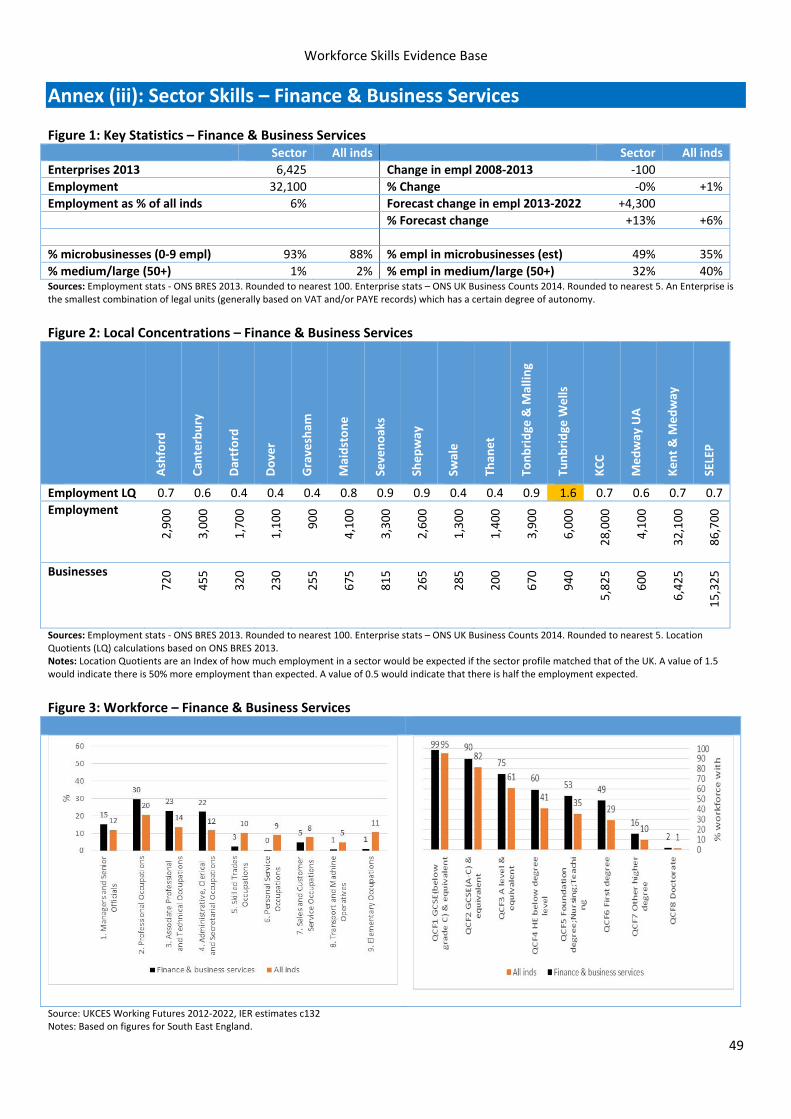
Workforce Skills Evidence Base
49
Annex (iii): Sector Skills – Finance & Business Services Figure 1: Key Statistics – Finance & Business Services Sector All inds Sector All inds
Enterprises 2013 6,425 Change in empl 2008‐2013 ‐100
Employment 32,100 % Change ‐0% +1%
Employment as % of all inds 6% Forecast change in empl 2013‐2022 +4,300
% Forecast change +13% +6%
% microbusinesses (0‐9 empl) 93% 88% % empl in microbusinesses (est) 49% 35%
% medium/large (50+) 1% 2% % empl in medium/large (50+) 32% 40%Sources: Employment stats ‐ ONS BRES 2013. Rounded to nearest 100. Enterprise stats – ONS UK Business Counts 2014. Rounded to nearest 5. An Enterprise is the smallest combination of legal units (generally based on VAT and/or PAYE records) which has a certain degree of autonomy.
Figure 2: Local Concentrations – Finance & Business Services
Ashford
Can
terbury
Dartford
Dover
Gravesham
Maidstone
Sevenoaks
Shepway
Swale
Than
et
Tonbridge & M
allin
g
Tunbridge
Wells
KCC
Medway UA
Kent & M
edway
SELEP
Employment LQ 0.7 0.6 0.4 0.4 0.4 0.8 0.9 0.9 0.4 0.4 0.9 1.6 0.7 0.6 0.7 0.7
Employment
2,900
3,000
1,700
1,100
900
4,100
3,300
2,600
1,300
1,400
3,900
6,000
28,000
4,100
32,100
86,700
Businesses
720
455
320
230
255
675
815
265
285
200
670
940
5,825
600
6,425
15,325
Sources: Employment stats ‐ ONS BRES 2013. Rounded to nearest 100. Enterprise stats – ONS UK Business Counts 2014. Rounded to nearest 5. Location Quotients (LQ) calculations based on ONS BRES 2013. Notes: Location Quotients are an Index of how much employment in a sector would be expected if the sector profile matched that of the UK. A value of 1.5 would indicate there is 50% more employment than expected. A value of 0.5 would indicate that there is half the employment expected.
Figure 3: Workforce – Finance & Business Services
Source: UKCES Working Futures 2012‐2022, IER estimates c132 Notes: Based on figures for South East England.
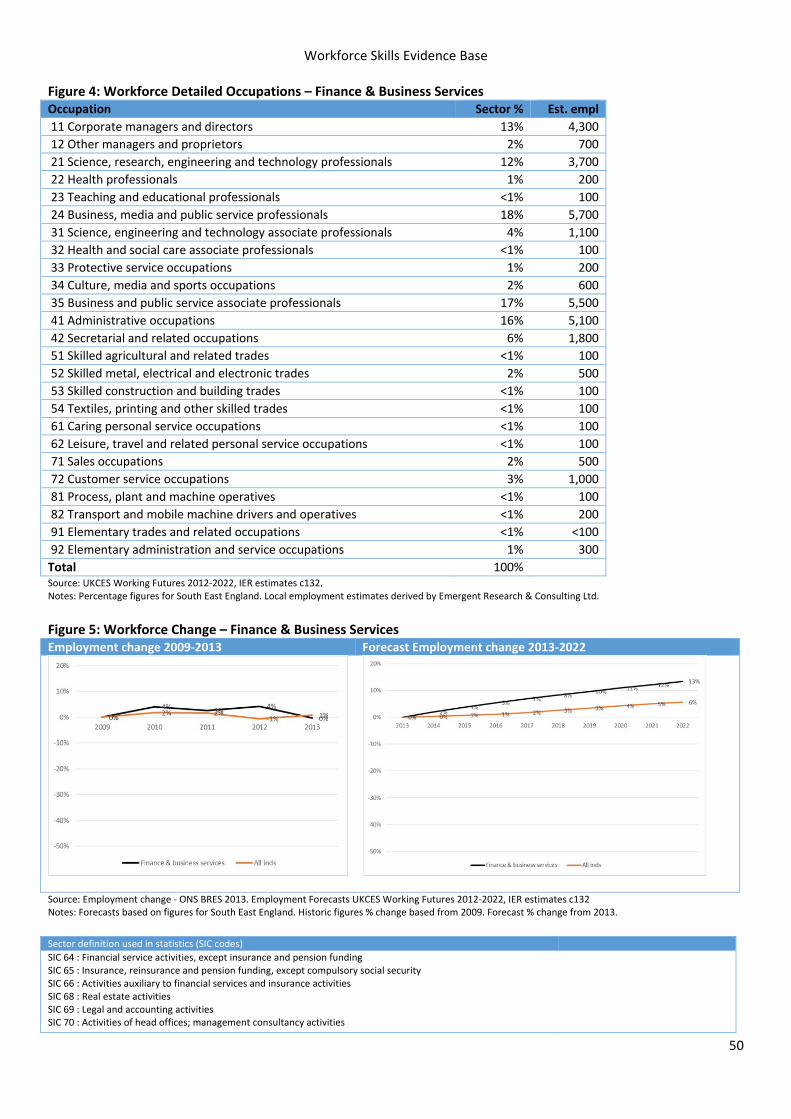
Workforce Skills Evidence Base
50
Figure 4: Workforce Detailed Occupations – Finance & Business Services Occupation Sector % Est. empl
11 Corporate managers and directors 13% 4,300
12 Other managers and proprietors 2% 700
21 Science, research, engineering and technology professionals 12% 3,700
22 Health professionals 1% 200
23 Teaching and educational professionals <1% 100
24 Business, media and public service professionals 18% 5,700
31 Science, engineering and technology associate professionals 4% 1,100
32 Health and social care associate professionals <1% 100
33 Protective service occupations 1% 200
34 Culture, media and sports occupations 2% 600
35 Business and public service associate professionals 17% 5,500
41 Administrative occupations 16% 5,100
42 Secretarial and related occupations 6% 1,800
51 Skilled agricultural and related trades <1% 100
52 Skilled metal, electrical and electronic trades 2% 500
53 Skilled construction and building trades <1% 100
54 Textiles, printing and other skilled trades <1% 100
61 Caring personal service occupations <1% 100
62 Leisure, travel and related personal service occupations <1% 100
71 Sales occupations 2% 500
72 Customer service occupations 3% 1,000
81 Process, plant and machine operatives <1% 100
82 Transport and mobile machine drivers and operatives <1% 200
91 Elementary trades and related occupations <1% <100
92 Elementary administration and service occupations 1% 300
Total 100% Source: UKCES Working Futures 2012‐2022, IER estimates c132. Notes: Percentage figures for South East England. Local employment estimates derived by Emergent Research & Consulting Ltd.
Figure 5: Workforce Change – Finance & Business Services Employment change 2009‐2013 Forecast Employment change 2013‐2022
Source: Employment change ‐ ONS BRES 2013. Employment Forecasts UKCES Working Futures 2012‐2022, IER estimates c132 Notes: Forecasts based on figures for South East England. Historic figures % change based from 2009. Forecast % change from 2013.
Sector definition used in statistics (SIC codes)
SIC 64 : Financial service activities, except insurance and pension fundingSIC 65 : Insurance, reinsurance and pension funding, except compulsory social security SIC 66 : Activities auxiliary to financial services and insurance activities SIC 68 : Real estate activities SIC 69 : Legal and accounting activities SIC 70 : Activities of head offices; management consultancy activities
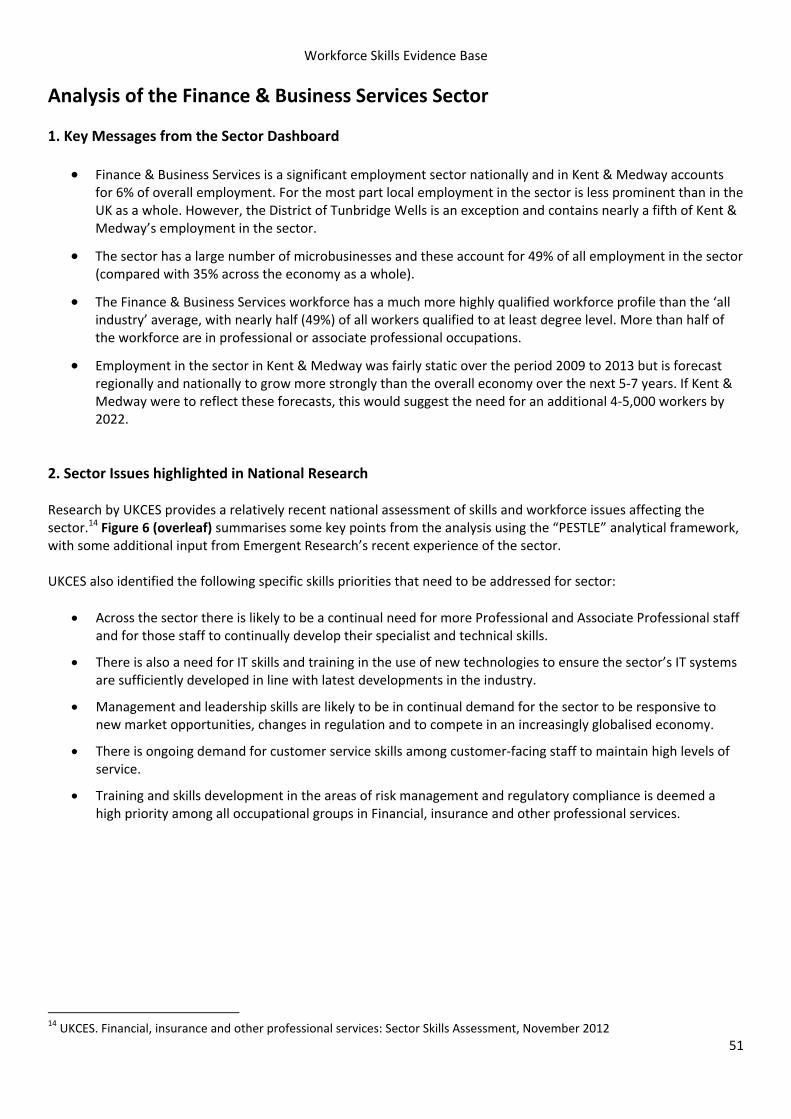
Workforce Skills Evidence Base
51
Analysis of the Finance & Business Services Sector
1. Key Messages from the Sector Dashboard
Finance & Business Services is a significant employment sector nationally and in Kent & Medway accounts for 6% of overall employment. For the most part local employment in the sector is less prominent than in the UK as a whole. However, the District of Tunbridge Wells is an exception and contains nearly a fifth of Kent & Medway’s employment in the sector.
The sector has a large number of microbusinesses and these account for 49% of all employment in the sector (compared with 35% across the economy as a whole).
The Finance & Business Services workforce has a much more highly qualified workforce profile than the ‘all industry’ average, with nearly half (49%) of all workers qualified to at least degree level. More than half of the workforce are in professional or associate professional occupations.
Employment in the sector in Kent & Medway was fairly static over the period 2009 to 2013 but is forecast regionally and nationally to grow more strongly than the overall economy over the next 5‐7 years. If Kent & Medway were to reflect these forecasts, this would suggest the need for an additional 4‐5,000 workers by 2022.
2. Sector Issues highlighted in National Research Research by UKCES provides a relatively recent national assessment of skills and workforce issues affecting the sector.14 Figure 6 (overleaf) summarises some key points from the analysis using the “PESTLE” analytical framework, with some additional input from Emergent Research’s recent experience of the sector. UKCES also identified the following specific skills priorities that need to be addressed for sector:
Across the sector there is likely to be a continual need for more Professional and Associate Professional staff and for those staff to continually develop their specialist and technical skills.
There is also a need for IT skills and training in the use of new technologies to ensure the sector’s IT systems are sufficiently developed in line with latest developments in the industry.
Management and leadership skills are likely to be in continual demand for the sector to be responsive to new market opportunities, changes in regulation and to compete in an increasingly globalised economy.
There is ongoing demand for customer service skills among customer‐facing staff to maintain high levels of service.
Training and skills development in the areas of risk management and regulatory compliance is deemed a high priority among all occupational groups in Financial, insurance and other professional services.
14 UKCES. Financial, insurance and other professional services: Sector Skills Assessment, November 2012
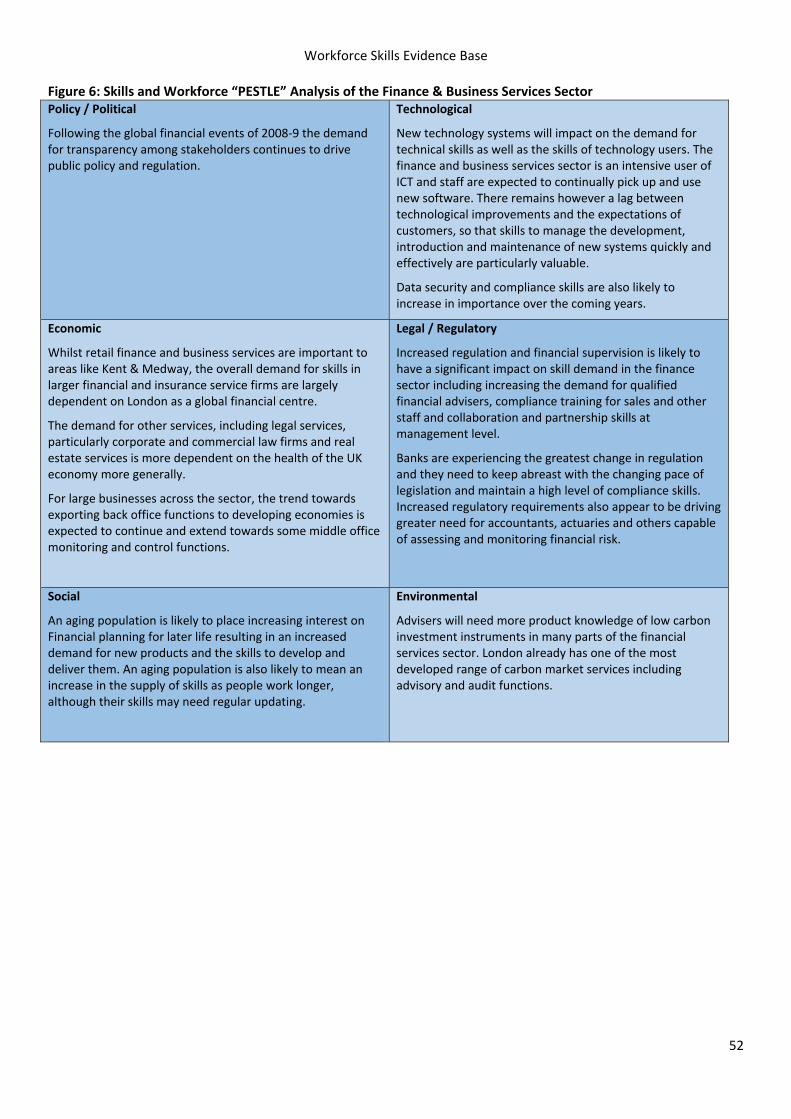
Workforce Skills Evidence Base
52
Figure 6: Skills and Workforce “PESTLE” Analysis of the Finance & Business Services Sector Policy / Political
Following the global financial events of 2008‐9 the demand for transparency among stakeholders continues to drive public policy and regulation.
Technological
New technology systems will impact on the demand for technical skills as well as the skills of technology users. The finance and business services sector is an intensive user of ICT and staff are expected to continually pick up and use new software. There remains however a lag between technological improvements and the expectations of customers, so that skills to manage the development, introduction and maintenance of new systems quickly and effectively are particularly valuable.
Data security and compliance skills are also likely to increase in importance over the coming years.
Economic
Whilst retail finance and business services are important to areas like Kent & Medway, the overall demand for skills in larger financial and insurance service firms are largely dependent on London as a global financial centre.
The demand for other services, including legal services, particularly corporate and commercial law firms and real estate services is more dependent on the health of the UK economy more generally.
For large businesses across the sector, the trend towards exporting back office functions to developing economies is expected to continue and extend towards some middle office monitoring and control functions.
Legal / Regulatory
Increased regulation and financial supervision is likely to have a significant impact on skill demand in the finance sector including increasing the demand for qualified financial advisers, compliance training for sales and other staff and collaboration and partnership skills at management level.
Banks are experiencing the greatest change in regulation and they need to keep abreast with the changing pace of legislation and maintain a high level of compliance skills. Increased regulatory requirements also appear to be driving greater need for accountants, actuaries and others capable of assessing and monitoring financial risk.
Social
An aging population is likely to place increasing interest on Financial planning for later life resulting in an increased demand for new products and the skills to develop and deliver them. An aging population is also likely to mean an increase in the supply of skills as people work longer, although their skills may need regular updating.
Environmental
Advisers will need more product knowledge of low carbon investment instruments in many parts of the financial services sector. London already has one of the most developed range of carbon market services including advisory and audit functions.
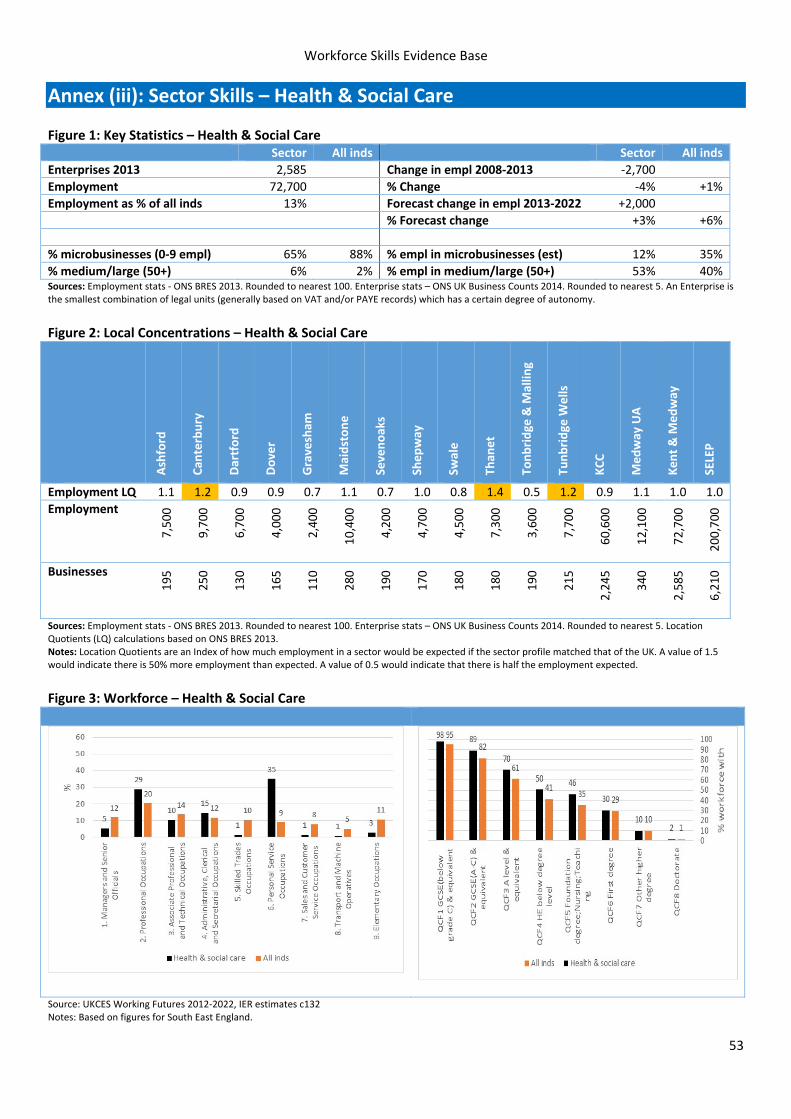
Workforce Skills Evidence Base
53
Annex (iii): Sector Skills – Health & Social Care Figure 1: Key Statistics – Health & Social Care Sector All inds Sector All inds
Enterprises 2013 2,585 Change in empl 2008‐2013 ‐2,700
Employment 72,700 % Change ‐4% +1%
Employment as % of all inds 13% Forecast change in empl 2013‐2022 +2,000
% Forecast change +3% +6%
% microbusinesses (0‐9 empl) 65% 88% % empl in microbusinesses (est) 12% 35%
% medium/large (50+) 6% 2% % empl in medium/large (50+) 53% 40%Sources: Employment stats ‐ ONS BRES 2013. Rounded to nearest 100. Enterprise stats – ONS UK Business Counts 2014. Rounded to nearest 5. An Enterprise is the smallest combination of legal units (generally based on VAT and/or PAYE records) which has a certain degree of autonomy.
Figure 2: Local Concentrations – Health & Social Care
Ashford
Can
terbury
Dartford
Dover
Gravesham
Maidstone
Sevenoaks
Shepway
Swale
Than
et
Tonbridge & M
allin
g
Tunbridge
Wells
KCC
Medway UA
Kent & M
edway
SELEP
Employment LQ 1.1 1.2 0.9 0.9 0.7 1.1 0.7 1.0 0.8 1.4 0.5 1.2 0.9 1.1 1.0 1.0
Employment
7,500
9,700
6,700
4,000
2,400
10,400
4,200
4,700
4,500
7,300
3,600
7,700
60,600
12,100
72,700
200,700
Businesses
195
250
130
165
110
280
190
170
180
180
190
215
2,245
340
2,585
6,210
Sources: Employment stats ‐ ONS BRES 2013. Rounded to nearest 100. Enterprise stats – ONS UK Business Counts 2014. Rounded to nearest 5. Location Quotients (LQ) calculations based on ONS BRES 2013. Notes: Location Quotients are an Index of how much employment in a sector would be expected if the sector profile matched that of the UK. A value of 1.5 would indicate there is 50% more employment than expected. A value of 0.5 would indicate that there is half the employment expected.
Figure 3: Workforce – Health & Social Care
Source: UKCES Working Futures 2012‐2022, IER estimates c132 Notes: Based on figures for South East England.
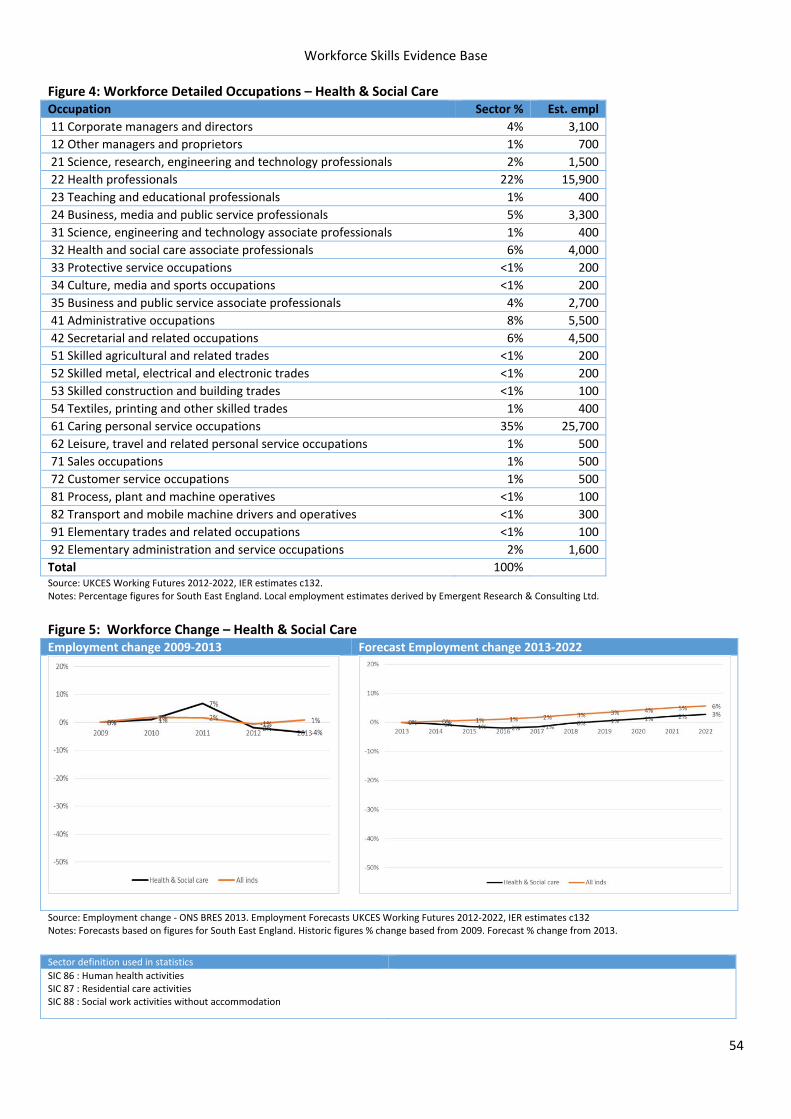
Workforce Skills Evidence Base
54
Figure 4: Workforce Detailed Occupations – Health & Social Care Occupation Sector % Est. empl
11 Corporate managers and directors 4% 3,100
12 Other managers and proprietors 1% 700
21 Science, research, engineering and technology professionals 2% 1,500
22 Health professionals 22% 15,900
23 Teaching and educational professionals 1% 400
24 Business, media and public service professionals 5% 3,300
31 Science, engineering and technology associate professionals 1% 400
32 Health and social care associate professionals 6% 4,000
33 Protective service occupations <1% 200
34 Culture, media and sports occupations <1% 200
35 Business and public service associate professionals 4% 2,700
41 Administrative occupations 8% 5,500
42 Secretarial and related occupations 6% 4,500
51 Skilled agricultural and related trades <1% 200
52 Skilled metal, electrical and electronic trades <1% 200
53 Skilled construction and building trades <1% 100
54 Textiles, printing and other skilled trades 1% 400
61 Caring personal service occupations 35% 25,700
62 Leisure, travel and related personal service occupations 1% 500
71 Sales occupations 1% 500
72 Customer service occupations 1% 500
81 Process, plant and machine operatives <1% 100
82 Transport and mobile machine drivers and operatives <1% 300
91 Elementary trades and related occupations <1% 100
92 Elementary administration and service occupations 2% 1,600
Total 100% Source: UKCES Working Futures 2012‐2022, IER estimates c132. Notes: Percentage figures for South East England. Local employment estimates derived by Emergent Research & Consulting Ltd.
Figure 5: Workforce Change – Health & Social Care Employment change 2009‐2013 Forecast Employment change 2013‐2022
Source: Employment change ‐ ONS BRES 2013. Employment Forecasts UKCES Working Futures 2012‐2022, IER estimates c132 Notes: Forecasts based on figures for South East England. Historic figures % change based from 2009. Forecast % change from 2013.
Sector definition used in statistics
SIC 86 : Human health activities SIC 87 : Residential care activities SIC 88 : Social work activities without accommodation
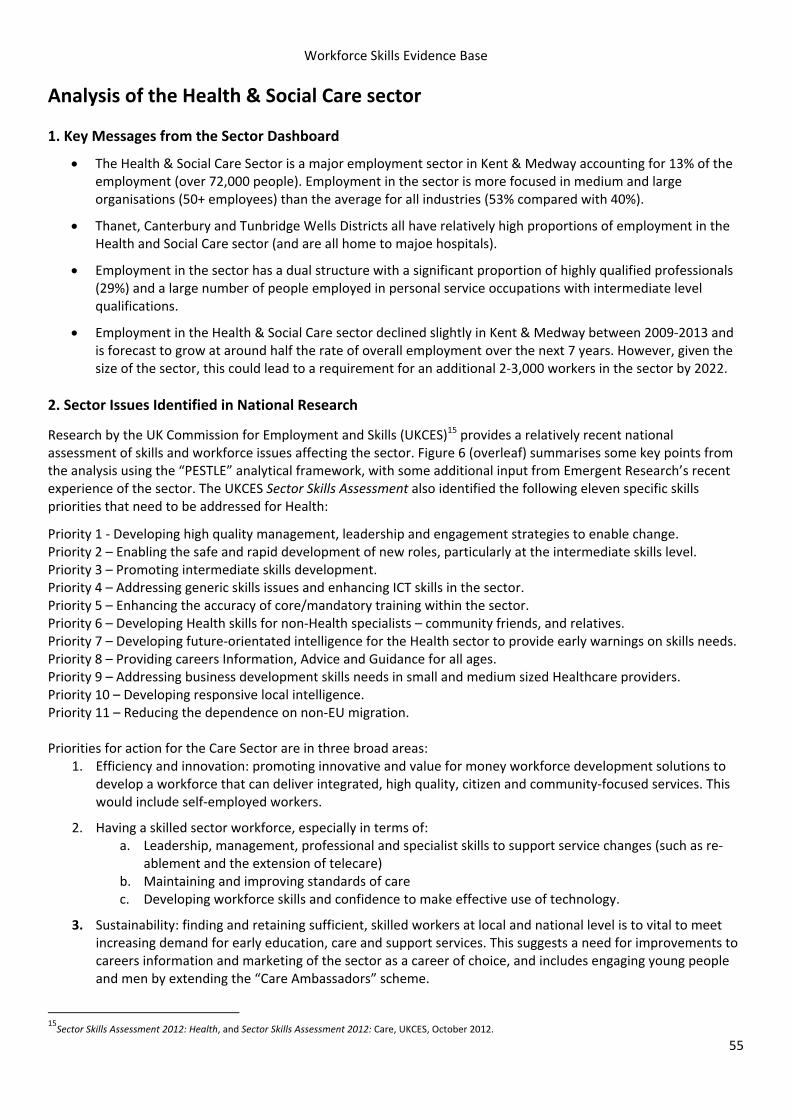
Workforce Skills Evidence Base
55
Analysis of the Health & Social Care sector
1. Key Messages from the Sector Dashboard
The Health & Social Care Sector is a major employment sector in Kent & Medway accounting for 13% of the employment (over 72,000 people). Employment in the sector is more focused in medium and large organisations (50+ employees) than the average for all industries (53% compared with 40%).
Thanet, Canterbury and Tunbridge Wells Districts all have relatively high proportions of employment in the Health and Social Care sector (and are all home to majoe hospitals).
Employment in the sector has a dual structure with a significant proportion of highly qualified professionals (29%) and a large number of people employed in personal service occupations with intermediate level qualifications.
Employment in the Health & Social Care sector declined slightly in Kent & Medway between 2009‐2013 and is forecast to grow at around half the rate of overall employment over the next 7 years. However, given the size of the sector, this could lead to a requirement for an additional 2‐3,000 workers in the sector by 2022.
2. Sector Issues Identified in National Research
Research by the UK Commission for Employment and Skills (UKCES)15 provides a relatively recent national assessment of skills and workforce issues affecting the sector. Figure 6 (overleaf) summarises some key points from the analysis using the “PESTLE” analytical framework, with some additional input from Emergent Research’s recent experience of the sector. The UKCES Sector Skills Assessment also identified the following eleven specific skills priorities that need to be addressed for Health:
Priority 1 ‐ Developing high quality management, leadership and engagement strategies to enable change. Priority 2 – Enabling the safe and rapid development of new roles, particularly at the intermediate skills level. Priority 3 – Promoting intermediate skills development. Priority 4 – Addressing generic skills issues and enhancing ICT skills in the sector. Priority 5 – Enhancing the accuracy of core/mandatory training within the sector. Priority 6 – Developing Health skills for non‐Health specialists – community friends, and relatives. Priority 7 – Developing future‐orientated intelligence for the Health sector to provide early warnings on skills needs. Priority 8 – Providing careers Information, Advice and Guidance for all ages. Priority 9 – Addressing business development skills needs in small and medium sized Healthcare providers. Priority 10 – Developing responsive local intelligence. Priority 11 – Reducing the dependence on non‐EU migration. Priorities for action for the Care Sector are in three broad areas:
1. Efficiency and innovation: promoting innovative and value for money workforce development solutions to develop a workforce that can deliver integrated, high quality, citizen and community‐focused services. This would include self‐employed workers.
2. Having a skilled sector workforce, especially in terms of: a. Leadership, management, professional and specialist skills to support service changes (such as re‐
ablement and the extension of telecare) b. Maintaining and improving standards of care c. Developing workforce skills and confidence to make effective use of technology.
3. Sustainability: finding and retaining sufficient, skilled workers at local and national level is to vital to meet increasing demand for early education, care and support services. This suggests a need for improvements to careers information and marketing of the sector as a career of choice, and includes engaging young people and men by extending the “Care Ambassadors” scheme.
15Sector Skills Assessment 2012: Health, and Sector Skills Assessment 2012: Care, UKCES, October 2012.
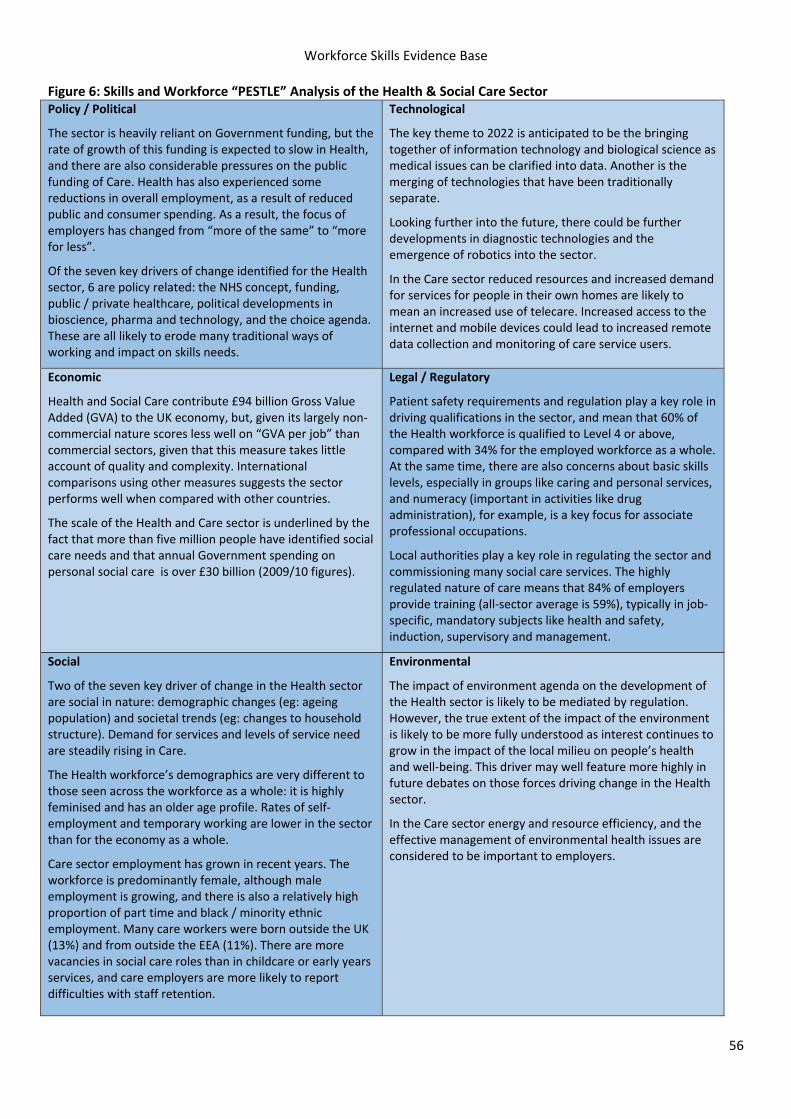
Workforce Skills Evidence Base
56
Figure 6: Skills and Workforce “PESTLE” Analysis of the Health & Social Care Sector Policy / Political
The sector is heavily reliant on Government funding, but the rate of growth of this funding is expected to slow in Health, and there are also considerable pressures on the public funding of Care. Health has also experienced some reductions in overall employment, as a result of reduced public and consumer spending. As a result, the focus of employers has changed from “more of the same” to “more for less”.
Of the seven key drivers of change identified for the Health sector, 6 are policy related: the NHS concept, funding, public / private healthcare, political developments in bioscience, pharma and technology, and the choice agenda. These are all likely to erode many traditional ways of working and impact on skills needs.
Technological
The key theme to 2022 is anticipated to be the bringing together of information technology and biological science as medical issues can be clarified into data. Another is the merging of technologies that have been traditionally separate.
Looking further into the future, there could be further developments in diagnostic technologies and the emergence of robotics into the sector.
In the Care sector reduced resources and increased demand for services for people in their own homes are likely to mean an increased use of telecare. Increased access to the internet and mobile devices could lead to increased remote data collection and monitoring of care service users.
Economic
Health and Social Care contribute £94 billion Gross Value Added (GVA) to the UK economy, but, given its largely non‐commercial nature scores less well on “GVA per job” than commercial sectors, given that this measure takes little account of quality and complexity. International comparisons using other measures suggests the sector performs well when compared with other countries.
The scale of the Health and Care sector is underlined by the fact that more than five million people have identified social care needs and that annual Government spending on personal social care is over £30 billion (2009/10 figures).
Legal / Regulatory
Patient safety requirements and regulation play a key role in driving qualifications in the sector, and mean that 60% of the Health workforce is qualified to Level 4 or above, compared with 34% for the employed workforce as a whole. At the same time, there are also concerns about basic skills levels, especially in groups like caring and personal services, and numeracy (important in activities like drug administration), for example, is a key focus for associate professional occupations.
Local authorities play a key role in regulating the sector and commissioning many social care services. The highly regulated nature of care means that 84% of employers provide training (all‐sector average is 59%), typically in job‐specific, mandatory subjects like health and safety, induction, supervisory and management.
Social
Two of the seven key driver of change in the Health sector are social in nature: demographic changes (eg: ageing population) and societal trends (eg: changes to household structure). Demand for services and levels of service need are steadily rising in Care.
The Health workforce’s demographics are very different to those seen across the workforce as a whole: it is highly feminised and has an older age profile. Rates of self‐employment and temporary working are lower in the sector than for the economy as a whole.
Care sector employment has grown in recent years. The workforce is predominantly female, although male employment is growing, and there is also a relatively high proportion of part time and black / minority ethnic employment. Many care workers were born outside the UK (13%) and from outside the EEA (11%). There are more vacancies in social care roles than in childcare or early years services, and care employers are more likely to report difficulties with staff retention.
Environmental
The impact of environment agenda on the development of the Health sector is likely to be mediated by regulation. However, the true extent of the impact of the environment is likely to be more fully understood as interest continues to grow in the impact of the local milieu on people’s health and well‐being. This driver may well feature more highly in future debates on those forces driving change in the Health sector.
In the Care sector energy and resource efficiency, and the effective management of environmental health issues are considered to be important to employers.
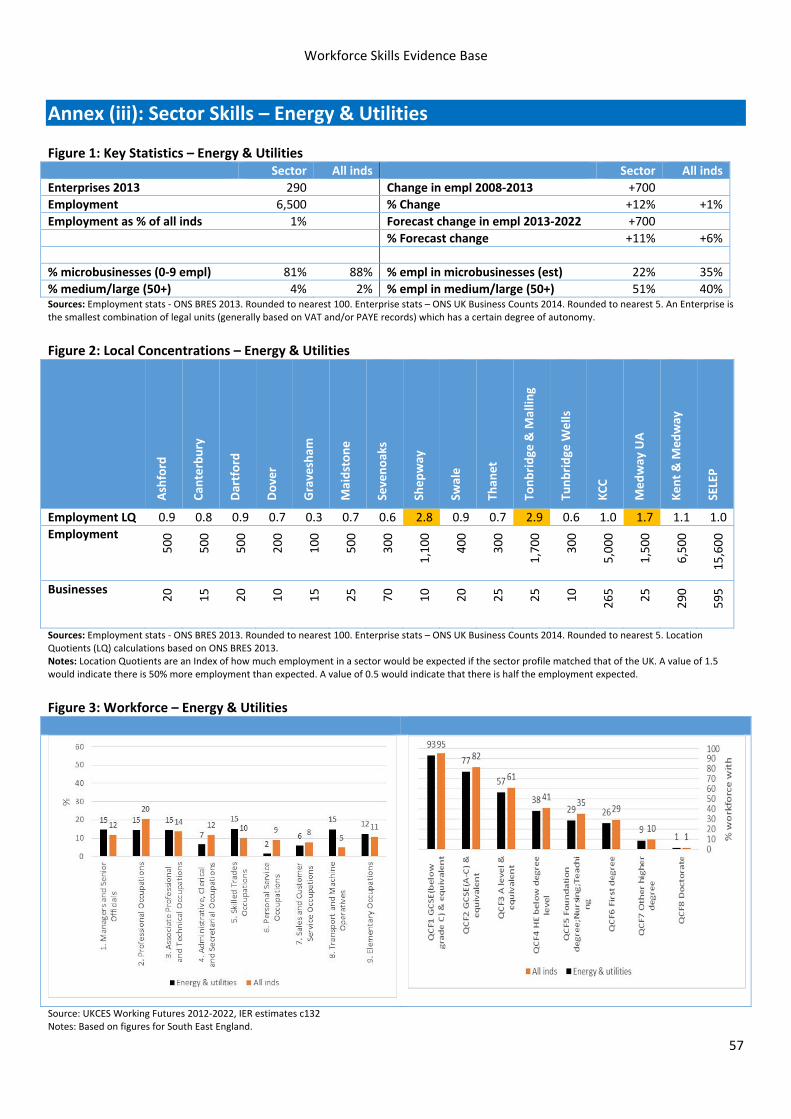
Workforce Skills Evidence Base
57
Annex (iii): Sector Skills – Energy & Utilities Figure 1: Key Statistics – Energy & Utilities Sector All inds Sector All inds
Enterprises 2013 290 Change in empl 2008‐2013 +700
Employment 6,500 % Change +12% +1%
Employment as % of all inds 1% Forecast change in empl 2013‐2022 +700
% Forecast change +11% +6%
% microbusinesses (0‐9 empl) 81% 88% % empl in microbusinesses (est) 22% 35%
% medium/large (50+) 4% 2% % empl in medium/large (50+) 51% 40%Sources: Employment stats ‐ ONS BRES 2013. Rounded to nearest 100. Enterprise stats – ONS UK Business Counts 2014. Rounded to nearest 5. An Enterprise is the smallest combination of legal units (generally based on VAT and/or PAYE records) which has a certain degree of autonomy.
Figure 2: Local Concentrations – Energy & Utilities
Ashford
Can
terbury
Dartford
Dover
Gravesham
Maidstone
Sevenoaks
Shepway
Swale
Than
et
Tonbridge & M
allin
g
Tunbridge
Wells
KCC
Medway UA
Kent & M
edway
SELEP
Employment LQ 0.9 0.8 0.9 0.7 0.3 0.7 0.6 2.8 0.9 0.7 2.9 0.6 1.0 1.7 1.1 1.0
Employment
500
500
500
200
100
500
300
1,100
400
300
1,700
300
5,000
1,500
6,500
15,600
Businesses
20
15
20
10
15
25
70
10
20
25
25
10
265
25
290
595
Sources: Employment stats ‐ ONS BRES 2013. Rounded to nearest 100. Enterprise stats – ONS UK Business Counts 2014. Rounded to nearest 5. Location Quotients (LQ) calculations based on ONS BRES 2013. Notes: Location Quotients are an Index of how much employment in a sector would be expected if the sector profile matched that of the UK. A value of 1.5 would indicate there is 50% more employment than expected. A value of 0.5 would indicate that there is half the employment expected.
Figure 3: Workforce – Energy & Utilities
Source: UKCES Working Futures 2012‐2022, IER estimates c132 Notes: Based on figures for South East England.
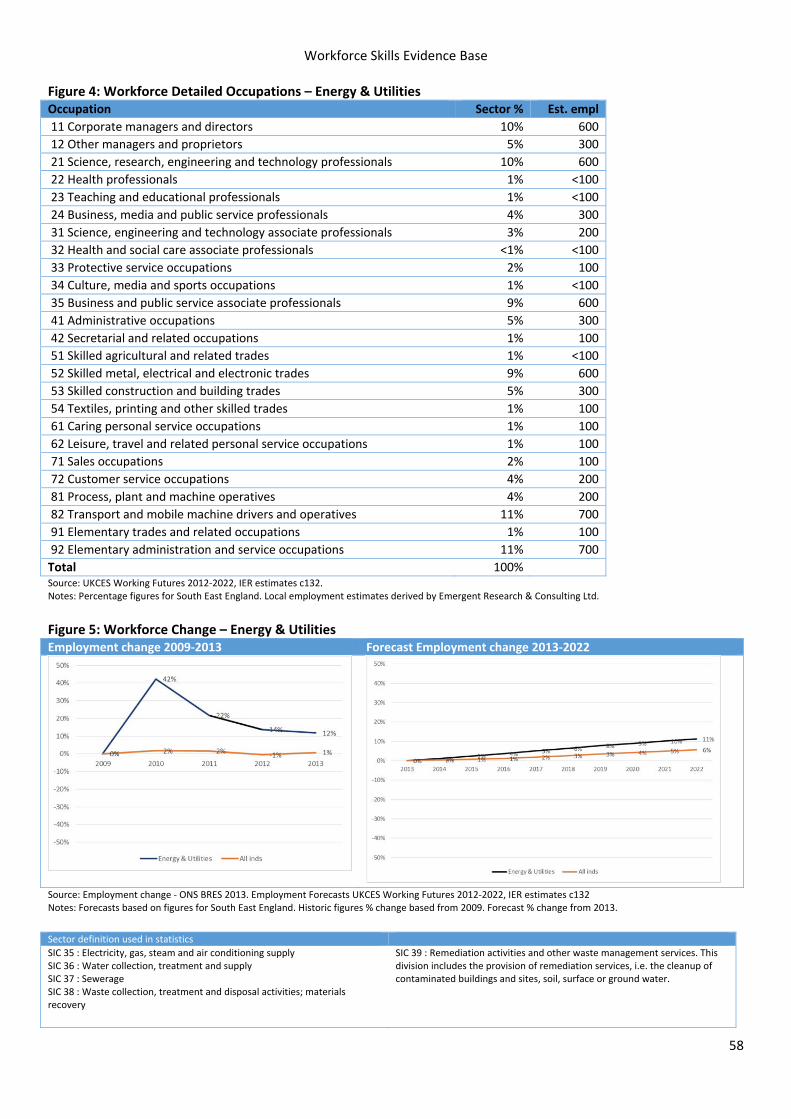
Workforce Skills Evidence Base
58
Figure 4: Workforce Detailed Occupations – Energy & Utilities Occupation Sector % Est. empl
11 Corporate managers and directors 10% 600
12 Other managers and proprietors 5% 300
21 Science, research, engineering and technology professionals 10% 600
22 Health professionals 1% <100
23 Teaching and educational professionals 1% <100
24 Business, media and public service professionals 4% 300
31 Science, engineering and technology associate professionals 3% 200
32 Health and social care associate professionals <1% <100
33 Protective service occupations 2% 100
34 Culture, media and sports occupations 1% <100
35 Business and public service associate professionals 9% 600
41 Administrative occupations 5% 300
42 Secretarial and related occupations 1% 100
51 Skilled agricultural and related trades 1% <100
52 Skilled metal, electrical and electronic trades 9% 600
53 Skilled construction and building trades 5% 300
54 Textiles, printing and other skilled trades 1% 100
61 Caring personal service occupations 1% 100
62 Leisure, travel and related personal service occupations 1% 100
71 Sales occupations 2% 100
72 Customer service occupations 4% 200
81 Process, plant and machine operatives 4% 200
82 Transport and mobile machine drivers and operatives 11% 700
91 Elementary trades and related occupations 1% 100
92 Elementary administration and service occupations 11% 700
Total 100% Source: UKCES Working Futures 2012‐2022, IER estimates c132. Notes: Percentage figures for South East England. Local employment estimates derived by Emergent Research & Consulting Ltd.
Figure 5: Workforce Change – Energy & Utilities Employment change 2009‐2013 Forecast Employment change 2013‐2022
Source: Employment change ‐ ONS BRES 2013. Employment Forecasts UKCES Working Futures 2012‐2022, IER estimates c132 Notes: Forecasts based on figures for South East England. Historic figures % change based from 2009. Forecast % change from 2013.
Sector definition used in statistics
SIC 35 : Electricity, gas, steam and air conditioning supply SIC 36 : Water collection, treatment and supply SIC 37 : Sewerage SIC 38 : Waste collection, treatment and disposal activities; materials recovery
SIC 39 : Remediation activities and other waste management services. This division includes the provision of remediation services, i.e. the cleanup of contaminated buildings and sites, soil, surface or ground water.
Workforce Skills Evidence Base
59
Analysis of the Energy & Utilities Sector
1. Key Messages from the Sector Dashboard
The Energy & Utilities sector is a relatively small employment sector within Kent & Medway accounting for just 1% of employment. Employment in the sector is relatively concentrated in medium and large employers (50+ employees), who employ 51% of the workforce (compared with 40% across all industries).
There are particular local concentrations of energy & utility sector employment in Tonbridge & Malling, Medway and Shepway.
The sector has quite a diverse workforce with many different occupations and the qualification profile of the workforce is similar to the all industry average. However workers are slightly less likely to have graduate level qualifications (29% compared with 35% across all industries).
Employment grew significantly over the period of 2009‐2013 in Kent & Medway (although the figures for 2010 may be an outlier or potential error in the national statistics) and the sector is forecast to grow regionally at a faster rate than the overall economy. This could mean a demand for an additional 5‐700 workers in Kent & Medway by 2022.
2. Sector Issues Identified in National Research Research by the UK Commission for Employment and Skills (UKCES)16 provides a relatively recent national assessment of skills and workforce issues affecting the sector. Figure 6 (below) summarises some key points from the analysis using the “PESTLE” analytical framework, with some additional input from Emergent Research’s recent experience of the sector. UKCES also identified the following specific skills priorities that need to be addressed for sector:
Improving the image of the sector in order to attract the skilled employees needed to meet sector ambition.
Ensuring appropriate Apprenticeship frameworks are in place and promoting these as attractive entry routes into the sector for all ages and abilities.
Establishing effective mechanisms that ensure, and prove, the competency of the workforce in a way that meets legislative and regulatory requirements and which are consistent and recognised across sector employers (where appropriate).
Ensuring that mechanisms are in place, and promoted to employers, which ensure that the higher level skills needs of the workforce can be delivered (particularly supporting progression routes from level 3 upwards).
Ensuring that the skills needed for research, development, installation, operation and maintenance of new technologies are identified and the necessary provision in place to deliver them.
Promoting the importance of management and leadership skills across the sector and ensuring that appropriate provision is available to the sector.
Ensuring that education and skills providers operating within the sector are aware of, and capable of meeting, the current and future skills of the sector.
16Energy and Utilities Sector Skills Assessment 2012, UKCES, October 2012.
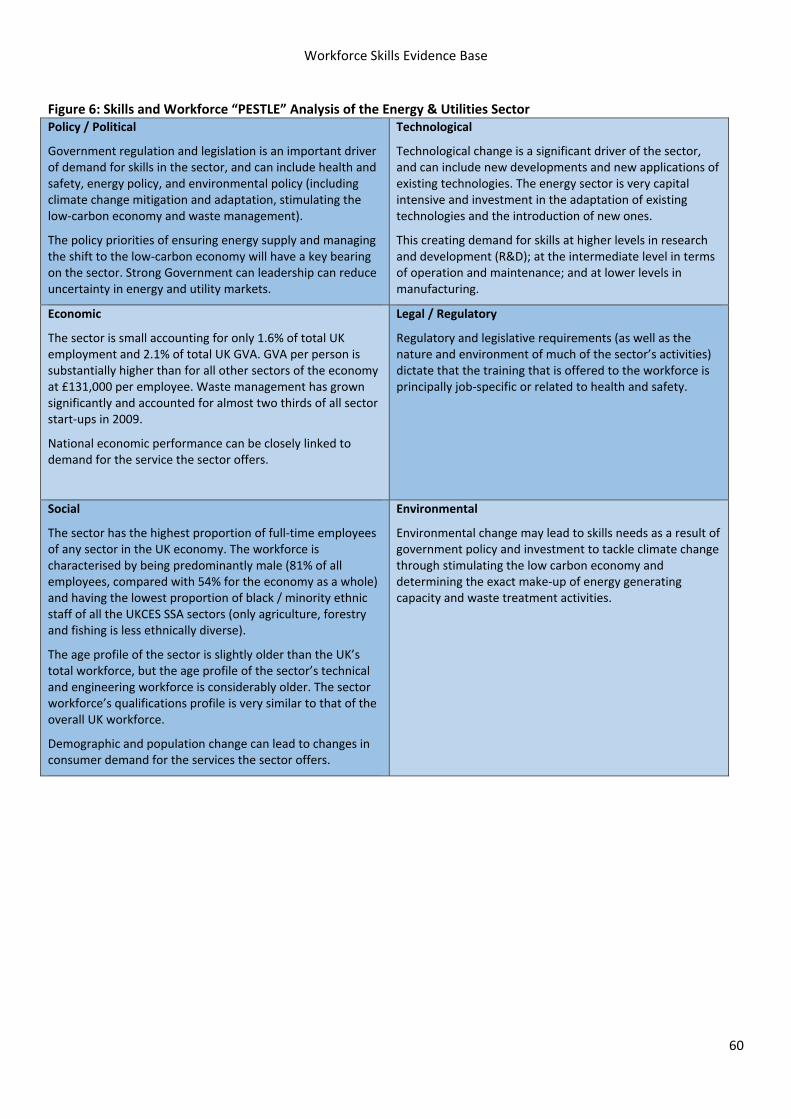
Workforce Skills Evidence Base
60
Figure 6: Skills and Workforce “PESTLE” Analysis of the Energy & Utilities Sector Policy / Political
Government regulation and legislation is an important driver of demand for skills in the sector, and can include health and safety, energy policy, and environmental policy (including climate change mitigation and adaptation, stimulating the low‐carbon economy and waste management).
The policy priorities of ensuring energy supply and managing the shift to the low‐carbon economy will have a key bearing on the sector. Strong Government can leadership can reduce uncertainty in energy and utility markets.
Technological
Technological change is a significant driver of the sector, and can include new developments and new applications of existing technologies. The energy sector is very capital intensive and investment in the adaptation of existing technologies and the introduction of new ones.
This creating demand for skills at higher levels in research and development (R&D); at the intermediate level in terms of operation and maintenance; and at lower levels in manufacturing.
Economic
The sector is small accounting for only 1.6% of total UK employment and 2.1% of total UK GVA. GVA per person is substantially higher than for all other sectors of the economy at £131,000 per employee. Waste management has grown significantly and accounted for almost two thirds of all sector start‐ups in 2009.
National economic performance can be closely linked to demand for the service the sector offers.
Legal / Regulatory
Regulatory and legislative requirements (as well as the nature and environment of much of the sector’s activities) dictate that the training that is offered to the workforce is principally job‐specific or related to health and safety.
Social
The sector has the highest proportion of full‐time employees of any sector in the UK economy. The workforce is characterised by being predominantly male (81% of all employees, compared with 54% for the economy as a whole) and having the lowest proportion of black / minority ethnic staff of all the UKCES SSA sectors (only agriculture, forestry and fishing is less ethnically diverse).
The age profile of the sector is slightly older than the UK’s total workforce, but the age profile of the sector’s technical and engineering workforce is considerably older. The sector workforce’s qualifications profile is very similar to that of the overall UK workforce.
Demographic and population change can lead to changes in consumer demand for the services the sector offers.
Environmental
Environmental change may lead to skills needs as a result of government policy and investment to tackle climate change through stimulating the low carbon economy and determining the exact make‐up of energy generating capacity and waste treatment activities.
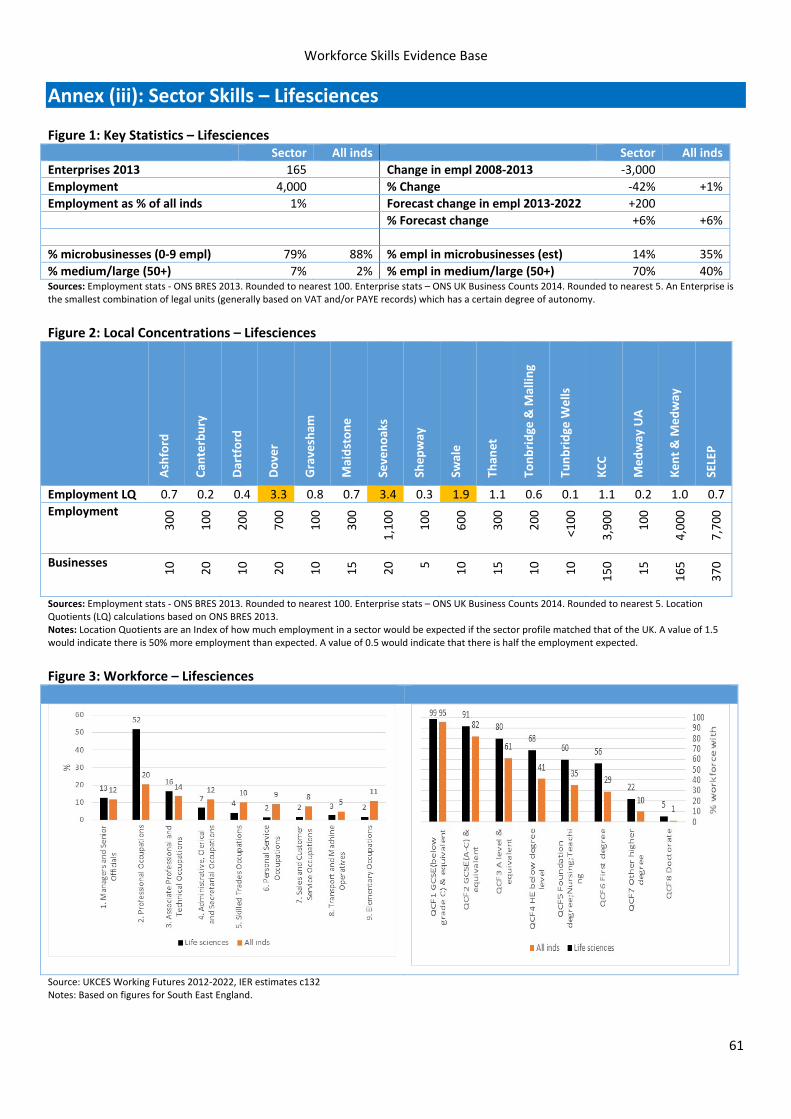
Workforce Skills Evidence Base
61
Annex (iii): Sector Skills – Lifesciences Figure 1: Key Statistics – Lifesciences Sector All inds Sector All inds
Enterprises 2013 165 Change in empl 2008‐2013 ‐3,000
Employment 4,000 % Change ‐42% +1%
Employment as % of all inds 1% Forecast change in empl 2013‐2022 +200
% Forecast change +6% +6%
% microbusinesses (0‐9 empl) 79% 88% % empl in microbusinesses (est) 14% 35%
% medium/large (50+) 7% 2% % empl in medium/large (50+) 70% 40%Sources: Employment stats ‐ ONS BRES 2013. Rounded to nearest 100. Enterprise stats – ONS UK Business Counts 2014. Rounded to nearest 5. An Enterprise is the smallest combination of legal units (generally based on VAT and/or PAYE records) which has a certain degree of autonomy.
Figure 2: Local Concentrations – Lifesciences
Ashford
Can
terbury
Dartford
Dover
Gravesham
Maidstone
Sevenoaks
Shepway
Swale
Than
et
Tonbridge & M
allin
g
Tunbridge
Wells
KCC
Medway UA
Kent & M
edway
SELEP
Employment LQ 0.7 0.2 0.4 3.3 0.8 0.7 3.4 0.3 1.9 1.1 0.6 0.1 1.1 0.2 1.0 0.7
Employment
300
100
200
700
100
300
1,100
100
600
300
200
<100
3,900
100
4,000
7,700
Businesses
10
20
10
20
10
15
20
5
10
15
10
10
150
15
165
370
Sources: Employment stats ‐ ONS BRES 2013. Rounded to nearest 100. Enterprise stats – ONS UK Business Counts 2014. Rounded to nearest 5. Location Quotients (LQ) calculations based on ONS BRES 2013. Notes: Location Quotients are an Index of how much employment in a sector would be expected if the sector profile matched that of the UK. A value of 1.5 would indicate there is 50% more employment than expected. A value of 0.5 would indicate that there is half the employment expected.
Figure 3: Workforce – Lifesciences
Source: UKCES Working Futures 2012‐2022, IER estimates c132 Notes: Based on figures for South East England.
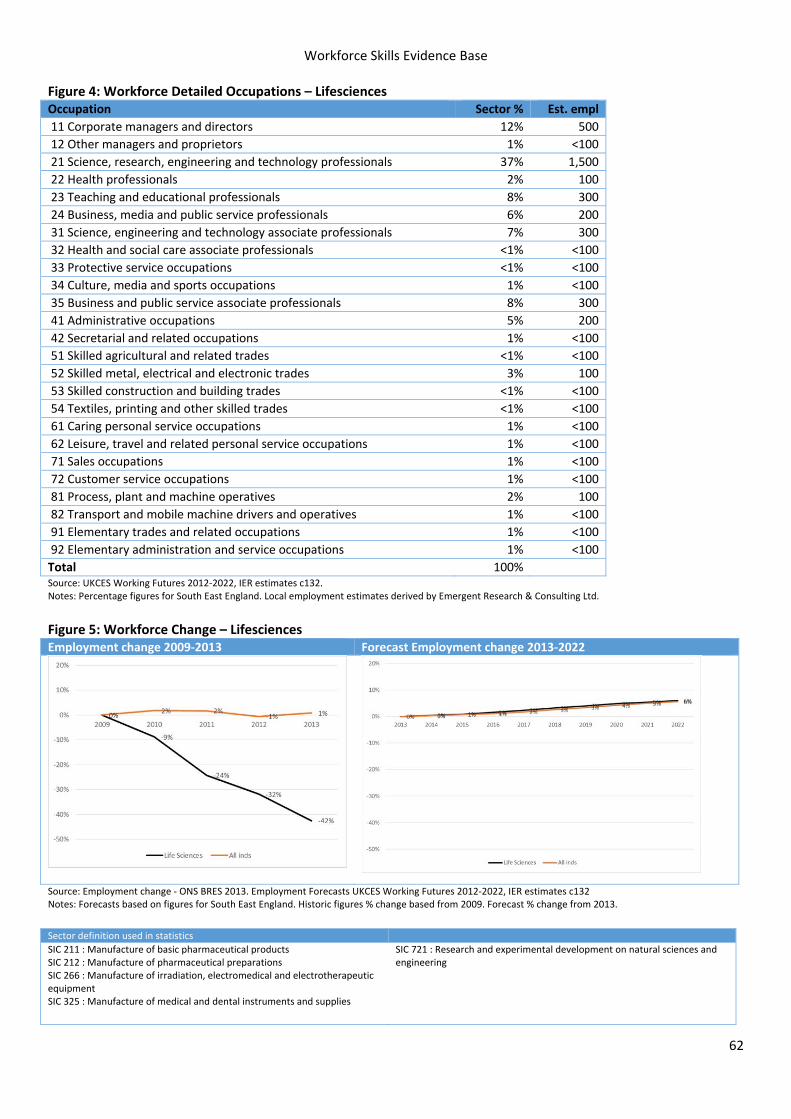
Workforce Skills Evidence Base
62
Figure 4: Workforce Detailed Occupations – Lifesciences Occupation Sector % Est. empl
11 Corporate managers and directors 12% 500
12 Other managers and proprietors 1% <100
21 Science, research, engineering and technology professionals 37% 1,500
22 Health professionals 2% 100
23 Teaching and educational professionals 8% 300
24 Business, media and public service professionals 6% 200
31 Science, engineering and technology associate professionals 7% 300
32 Health and social care associate professionals <1% <100 33 Protective service occupations <1% <100 34 Culture, media and sports occupations 1% <100 35 Business and public service associate professionals 8% 300
41 Administrative occupations 5% 200
42 Secretarial and related occupations 1% <100 51 Skilled agricultural and related trades <1% <100 52 Skilled metal, electrical and electronic trades 3% 100
53 Skilled construction and building trades <1% <100 54 Textiles, printing and other skilled trades <1% <100 61 Caring personal service occupations 1% <100 62 Leisure, travel and related personal service occupations 1% <100 71 Sales occupations 1% <100 72 Customer service occupations 1% <100 81 Process, plant and machine operatives 2% 100
82 Transport and mobile machine drivers and operatives 1% <100 91 Elementary trades and related occupations 1% <100 92 Elementary administration and service occupations 1% <100 Total 100% Source: UKCES Working Futures 2012‐2022, IER estimates c132. Notes: Percentage figures for South East England. Local employment estimates derived by Emergent Research & Consulting Ltd.
Figure 5: Workforce Change – Lifesciences Employment change 2009‐2013 Forecast Employment change 2013‐2022
Source: Employment change ‐ ONS BRES 2013. Employment Forecasts UKCES Working Futures 2012‐2022, IER estimates c132 Notes: Forecasts based on figures for South East England. Historic figures % change based from 2009. Forecast % change from 2013.
Sector definition used in statistics
SIC 211 : Manufacture of basic pharmaceutical products SIC 212 : Manufacture of pharmaceutical preparations SIC 266 : Manufacture of irradiation, electromedical and electrotherapeutic equipment SIC 325 : Manufacture of medical and dental instruments and supplies
SIC 721 : Research and experimental development on natural sciences and engineering
Workforce Skills Evidence Base
63
Analysis of the Lifesciences Sector
1. Key Messages from the Sector Dashboard
Lifesciences is a relatively small sector in terms of employment but is viewed as strategically important for the future by both national and local government.
Although some microbusinesses are critical to the sector, employment is dominated by larger businesses. Some 70% of the workforce is employed by companies with 50 or more staff (compared with 40% across all industries).
The workforce is predominantly professional and highly qualified with the most skilled professionals operating in a national and international labour market.
Employment in Kent & Medway contracted sharply over the period 2009 to 2013, principally as the result of the relocation decisions of some large Lifesciences businesses, including Pfizers decision to move its Headquarters from Sandwich).
Regionally and nationally employment in the sector is expected to grow at similar levels to the overall economy for the next 5‐7 years.
2. Sector Issues highlighted in National Research Research by the UKCES in 2010 provides a relatively recent national assessment of skills and workforce issues affecting the sector.17 Figure 6 (overleaf) summarises some key points from the analysis using the “PESTLE” analytical framework, with some additional input from Emergent Research’s recent experience of the sector. The UKCES paper concludes that the future skill needs of the sector relate very much to:
• Skills required by the R&D process (e.g. highly qualified scientists able to translate scientific breakthroughs into products);
• The production process (e.g. engineers, technicians, and operatives);
• Management (e.g. developing and managing inter‐disciplinary teams, being able to diversify the product range, managing mature product ranges, etc.).
The report notes that many of the skills which the bio‐medical sector will increasingly require are ones which are typically in short‐supply across the economy (e.g. generic skills related to management and leadership, highly qualified scientists and engineers working at the cutting edge of product development). The nature of skill demand in the sector is such that supply will always struggle to keep pace. There are, however, a range of more commonplace skills which the sector is currently dependent upon and will continue to be over the period to 2020. These include a range of engineering and technician roles related to the production of everyday products and operatives who work on assembly lines.
17 UKCES 2010, Strategic Skills Needs in the Bio‐Medical Sector
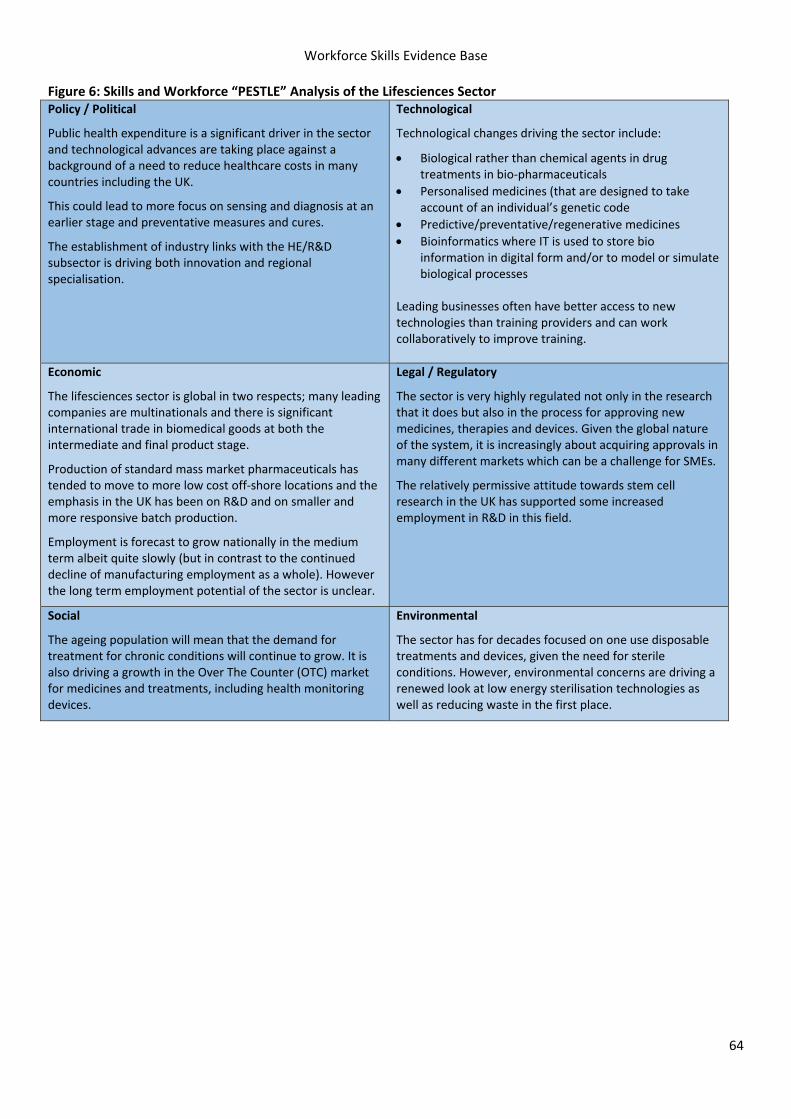
Workforce Skills Evidence Base
64
Figure 6: Skills and Workforce “PESTLE” Analysis of the Lifesciences Sector Policy / Political
Public health expenditure is a significant driver in the sector and technological advances are taking place against a background of a need to reduce healthcare costs in many countries including the UK.
This could lead to more focus on sensing and diagnosis at an earlier stage and preventative measures and cures.
The establishment of industry links with the HE/R&D subsector is driving both innovation and regional specialisation.
Technological
Technological changes driving the sector include:
Biological rather than chemical agents in drug treatments in bio‐pharmaceuticals
Personalised medicines (that are designed to take account of an individual’s genetic code
Predictive/preventative/regenerative medicines
Bioinformatics where IT is used to store bio information in digital form and/or to model or simulate biological processes
Leading businesses often have better access to new technologies than training providers and can work collaboratively to improve training.
Economic
The lifesciences sector is global in two respects; many leading companies are multinationals and there is significant international trade in biomedical goods at both the intermediate and final product stage.
Production of standard mass market pharmaceuticals has tended to move to more low cost off‐shore locations and the emphasis in the UK has been on R&D and on smaller and more responsive batch production.
Employment is forecast to grow nationally in the medium term albeit quite slowly (but in contrast to the continued decline of manufacturing employment as a whole). However the long term employment potential of the sector is unclear.
Legal / Regulatory
The sector is very highly regulated not only in the research that it does but also in the process for approving new medicines, therapies and devices. Given the global nature of the system, it is increasingly about acquiring approvals in many different markets which can be a challenge for SMEs.
The relatively permissive attitude towards stem cell research in the UK has supported some increased employment in R&D in this field.
Social
The ageing population will mean that the demand for treatment for chronic conditions will continue to grow. It is also driving a growth in the Over The Counter (OTC) market for medicines and treatments, including health monitoring devices.
Environmental
The sector has for decades focused on one use disposable treatments and devices, given the need for sterile conditions. However, environmental concerns are driving a renewed look at low energy sterilisation technologies as well as reducing waste in the first place.
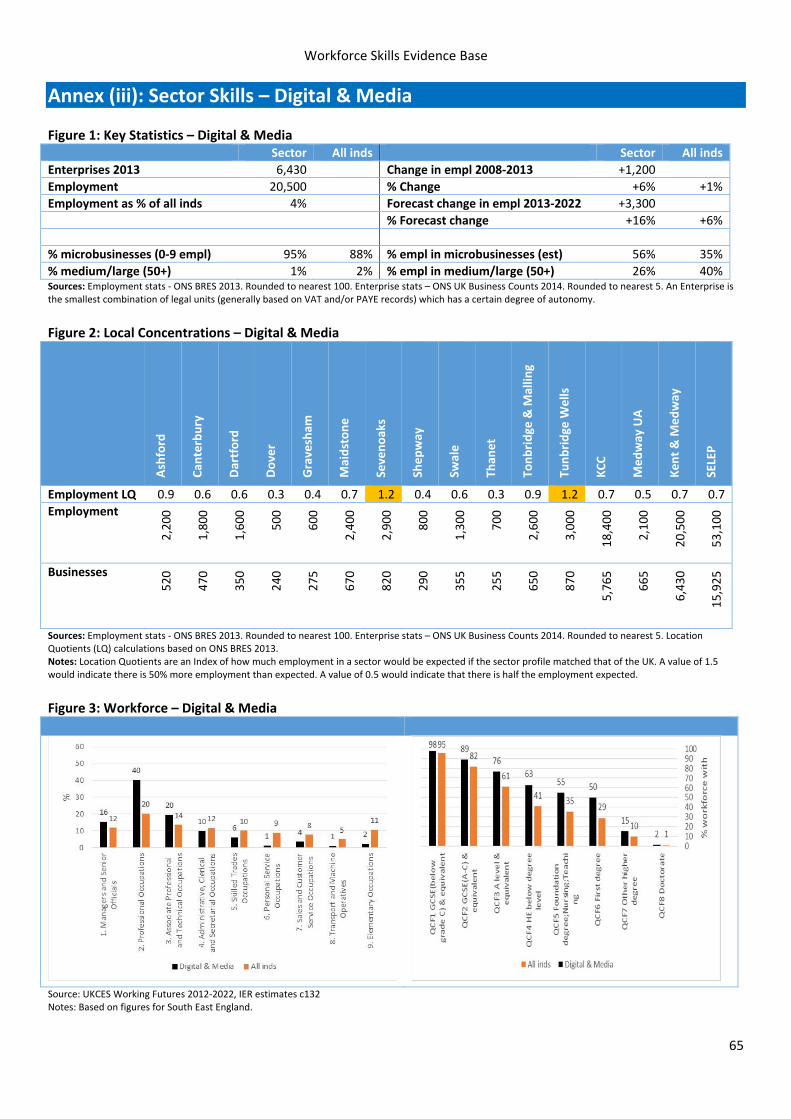
Workforce Skills Evidence Base
65
Annex (iii): Sector Skills – Digital & Media Figure 1: Key Statistics – Digital & Media Sector All inds Sector All inds
Enterprises 2013 6,430 Change in empl 2008‐2013 +1,200
Employment 20,500 % Change +6% +1%
Employment as % of all inds 4% Forecast change in empl 2013‐2022 +3,300
% Forecast change +16% +6%
% microbusinesses (0‐9 empl) 95% 88% % empl in microbusinesses (est) 56% 35%
% medium/large (50+) 1% 2% % empl in medium/large (50+) 26% 40%Sources: Employment stats ‐ ONS BRES 2013. Rounded to nearest 100. Enterprise stats – ONS UK Business Counts 2014. Rounded to nearest 5. An Enterprise is the smallest combination of legal units (generally based on VAT and/or PAYE records) which has a certain degree of autonomy.
Figure 2: Local Concentrations – Digital & Media
Ashford
Can
terbury
Dartford
Dover
Gravesham
Maidstone
Sevenoaks
Shepway
Swale
Than
et
Tonbridge & M
allin
g
Tunbridge
Wells
KCC
Medway UA
Kent & M
edway
SELEP
Employment LQ 0.9 0.6 0.6 0.3 0.4 0.7 1.2 0.4 0.6 0.3 0.9 1.2 0.7 0.5 0.7 0.7
Employment
2,200
1,800
1,600
500
600
2,400
2,900
800
1,300
700
2,600
3,000
18,400
2,100
20,500
53,100
Businesses
520
470
350
240
275
670
820
290
355
255
650
870
5,765
665
6,430
15,925
Sources: Employment stats ‐ ONS BRES 2013. Rounded to nearest 100. Enterprise stats – ONS UK Business Counts 2014. Rounded to nearest 5. Location Quotients (LQ) calculations based on ONS BRES 2013. Notes: Location Quotients are an Index of how much employment in a sector would be expected if the sector profile matched that of the UK. A value of 1.5 would indicate there is 50% more employment than expected. A value of 0.5 would indicate that there is half the employment expected.
Figure 3: Workforce – Digital & Media
Source: UKCES Working Futures 2012‐2022, IER estimates c132 Notes: Based on figures for South East England.
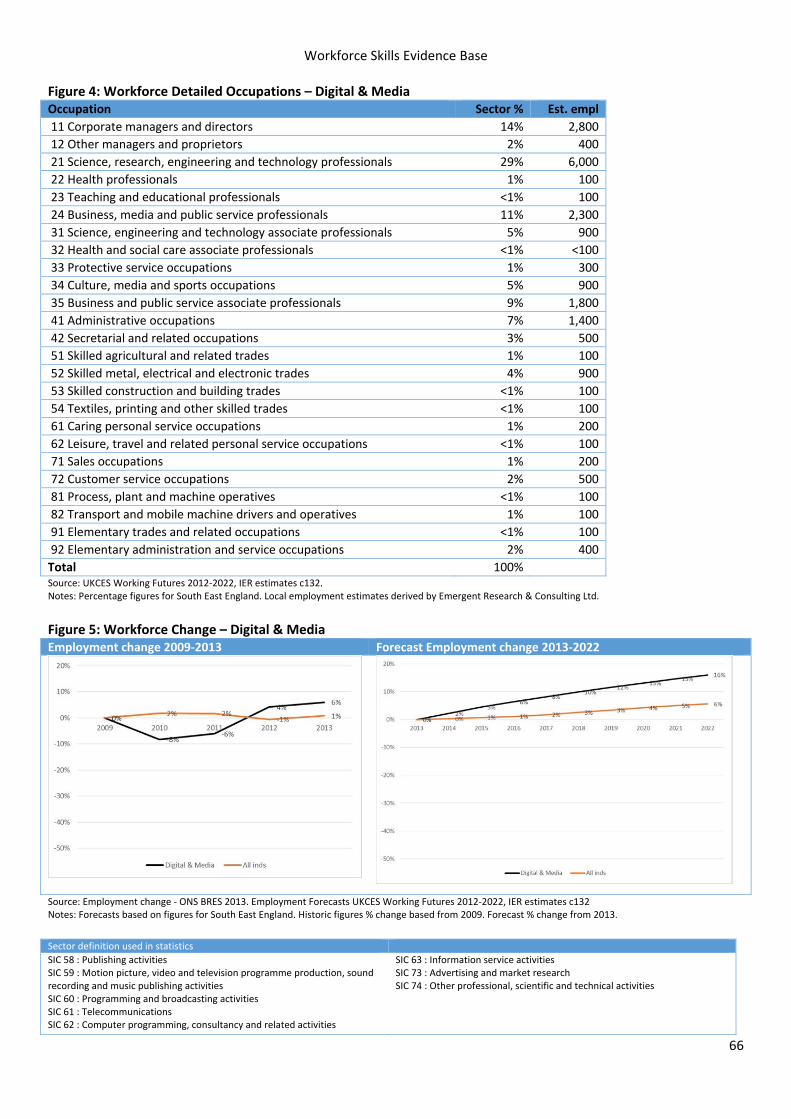
Workforce Skills Evidence Base
66
Figure 4: Workforce Detailed Occupations – Digital & Media Occupation Sector % Est. empl
11 Corporate managers and directors 14% 2,800
12 Other managers and proprietors 2% 400
21 Science, research, engineering and technology professionals 29% 6,000
22 Health professionals 1% 100
23 Teaching and educational professionals <1% 100
24 Business, media and public service professionals 11% 2,300
31 Science, engineering and technology associate professionals 5% 900
32 Health and social care associate professionals <1% <100
33 Protective service occupations 1% 300
34 Culture, media and sports occupations 5% 900
35 Business and public service associate professionals 9% 1,800
41 Administrative occupations 7% 1,400
42 Secretarial and related occupations 3% 500
51 Skilled agricultural and related trades 1% 100
52 Skilled metal, electrical and electronic trades 4% 900
53 Skilled construction and building trades <1% 100
54 Textiles, printing and other skilled trades <1% 100
61 Caring personal service occupations 1% 200
62 Leisure, travel and related personal service occupations <1% 100
71 Sales occupations 1% 200
72 Customer service occupations 2% 500
81 Process, plant and machine operatives <1% 100
82 Transport and mobile machine drivers and operatives 1% 100
91 Elementary trades and related occupations <1% 100
92 Elementary administration and service occupations 2% 400
Total 100% Source: UKCES Working Futures 2012‐2022, IER estimates c132. Notes: Percentage figures for South East England. Local employment estimates derived by Emergent Research & Consulting Ltd.
Figure 5: Workforce Change – Digital & Media Employment change 2009‐2013 Forecast Employment change 2013‐2022
Source: Employment change ‐ ONS BRES 2013. Employment Forecasts UKCES Working Futures 2012‐2022, IER estimates c132 Notes: Forecasts based on figures for South East England. Historic figures % change based from 2009. Forecast % change from 2013.
Sector definition used in statistics
SIC 58 : Publishing activities SIC 59 : Motion picture, video and television programme production, sound recording and music publishing activities SIC 60 : Programming and broadcasting activities SIC 61 : Telecommunications SIC 62 : Computer programming, consultancy and related activities
SIC 63 : Information service activitiesSIC 73 : Advertising and market research SIC 74 : Other professional, scientific and technical activities
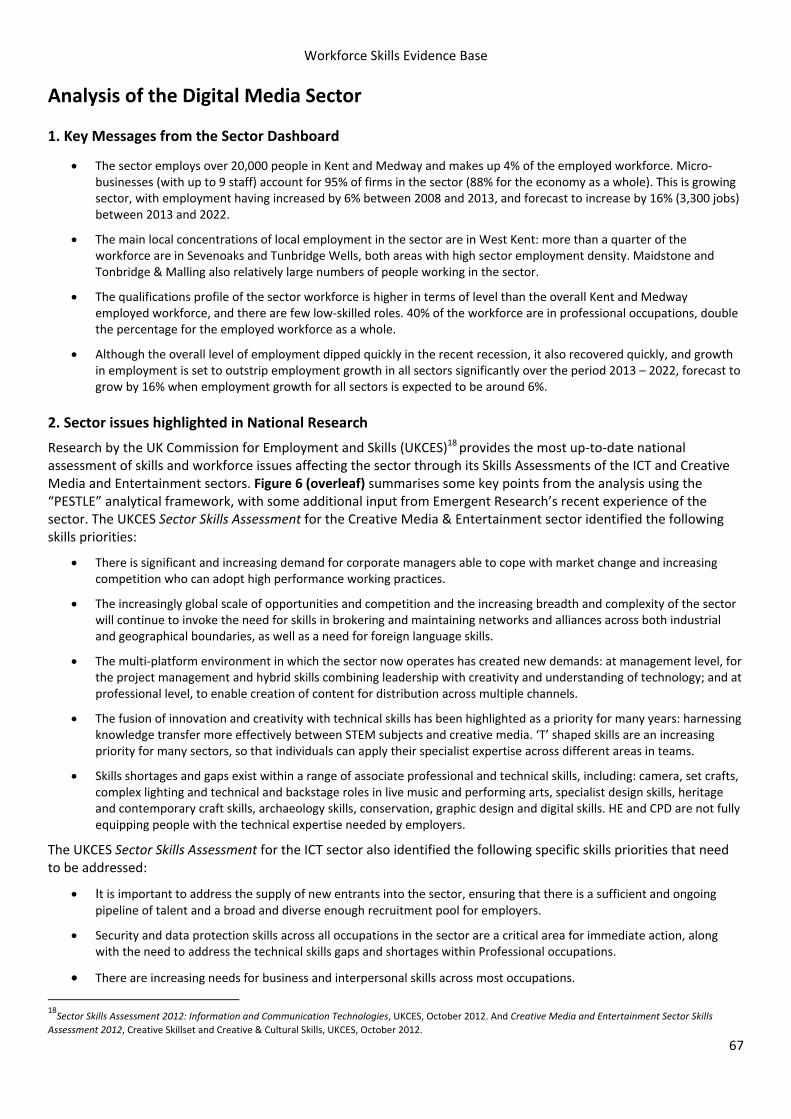
Workforce Skills Evidence Base
67
Analysis of the Digital Media Sector
1. Key Messages from the Sector Dashboard
The sector employs over 20,000 people in Kent and Medway and makes up 4% of the employed workforce. Micro‐businesses (with up to 9 staff) account for 95% of firms in the sector (88% for the economy as a whole). This is growing sector, with employment having increased by 6% between 2008 and 2013, and forecast to increase by 16% (3,300 jobs) between 2013 and 2022.
The main local concentrations of local employment in the sector are in West Kent: more than a quarter of the workforce are in Sevenoaks and Tunbridge Wells, both areas with high sector employment density. Maidstone and Tonbridge & Malling also relatively large numbers of people working in the sector.
The qualifications profile of the sector workforce is higher in terms of level than the overall Kent and Medway employed workforce, and there are few low‐skilled roles. 40% of the workforce are in professional occupations, double the percentage for the employed workforce as a whole.
Although the overall level of employment dipped quickly in the recent recession, it also recovered quickly, and growth in employment is set to outstrip employment growth in all sectors significantly over the period 2013 – 2022, forecast to grow by 16% when employment growth for all sectors is expected to be around 6%.
2. Sector issues highlighted in National Research
Research by the UK Commission for Employment and Skills (UKCES)18 provides the most up‐to‐date national assessment of skills and workforce issues affecting the sector through its Skills Assessments of the ICT and Creative Media and Entertainment sectors. Figure 6 (overleaf) summarises some key points from the analysis using the “PESTLE” analytical framework, with some additional input from Emergent Research’s recent experience of the sector. The UKCES Sector Skills Assessment for the Creative Media & Entertainment sector identified the following skills priorities:
There is significant and increasing demand for corporate managers able to cope with market change and increasing competition who can adopt high performance working practices.
The increasingly global scale of opportunities and competition and the increasing breadth and complexity of the sector will continue to invoke the need for skills in brokering and maintaining networks and alliances across both industrial and geographical boundaries, as well as a need for foreign language skills.
The multi‐platform environment in which the sector now operates has created new demands: at management level, for the project management and hybrid skills combining leadership with creativity and understanding of technology; and at professional level, to enable creation of content for distribution across multiple channels.
The fusion of innovation and creativity with technical skills has been highlighted as a priority for many years: harnessing knowledge transfer more effectively between STEM subjects and creative media. ‘T’ shaped skills are an increasing priority for many sectors, so that individuals can apply their specialist expertise across different areas in teams.
Skills shortages and gaps exist within a range of associate professional and technical skills, including: camera, set crafts, complex lighting and technical and backstage roles in live music and performing arts, specialist design skills, heritage and contemporary craft skills, archaeology skills, conservation, graphic design and digital skills. HE and CPD are not fully equipping people with the technical expertise needed by employers.
The UKCES Sector Skills Assessment for the ICT sector also identified the following specific skills priorities that need to be addressed:
It is important to address the supply of new entrants into the sector, ensuring that there is a sufficient and ongoing pipeline of talent and a broad and diverse enough recruitment pool for employers.
Security and data protection skills across all occupations in the sector are a critical area for immediate action, along with the need to address the technical skills gaps and shortages within Professional occupations.
There are increasing needs for business and interpersonal skills across most occupations.
18Sector Skills Assessment 2012: Information and Communication Technologies, UKCES, October 2012. And Creative Media and Entertainment Sector Skills
Assessment 2012, Creative Skillset and Creative & Cultural Skills, UKCES, October 2012.
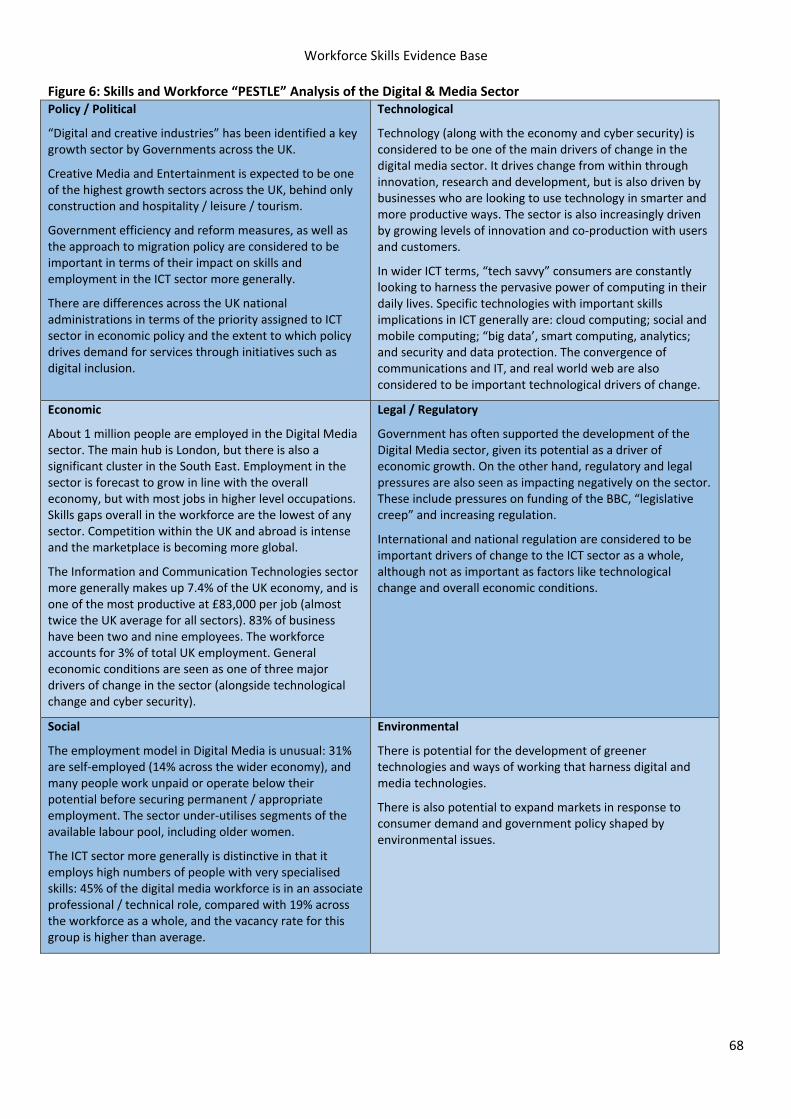
Workforce Skills Evidence Base
68
Figure 6: Skills and Workforce “PESTLE” Analysis of the Digital & Media Sector Policy / Political
“Digital and creative industries” has been identified a key growth sector by Governments across the UK.
Creative Media and Entertainment is expected to be one of the highest growth sectors across the UK, behind only construction and hospitality / leisure / tourism.
Government efficiency and reform measures, as well as the approach to migration policy are considered to be important in terms of their impact on skills and employment in the ICT sector more generally.
There are differences across the UK national administrations in terms of the priority assigned to ICT sector in economic policy and the extent to which policy drives demand for services through initiatives such as digital inclusion.
Technological
Technology (along with the economy and cyber security) is considered to be one of the main drivers of change in the digital media sector. It drives change from within through innovation, research and development, but is also driven by businesses who are looking to use technology in smarter and more productive ways. The sector is also increasingly driven by growing levels of innovation and co‐production with users and customers.
In wider ICT terms, “tech savvy” consumers are constantly looking to harness the pervasive power of computing in their daily lives. Specific technologies with important skills implications in ICT generally are: cloud computing; social and mobile computing; “big data’, smart computing, analytics; and security and data protection. The convergence of communications and IT, and real world web are also considered to be important technological drivers of change.
Economic
About 1 million people are employed in the Digital Media sector. The main hub is London, but there is also a significant cluster in the South East. Employment in the sector is forecast to grow in line with the overall economy, but with most jobs in higher level occupations. Skills gaps overall in the workforce are the lowest of any sector. Competition within the UK and abroad is intense and the marketplace is becoming more global.
The Information and Communication Technologies sector more generally makes up 7.4% of the UK economy, and is one of the most productive at £83,000 per job (almost twice the UK average for all sectors). 83% of business have been two and nine employees. The workforce accounts for 3% of total UK employment. General economic conditions are seen as one of three major drivers of change in the sector (alongside technological change and cyber security).
Legal / Regulatory
Government has often supported the development of the Digital Media sector, given its potential as a driver of economic growth. On the other hand, regulatory and legal pressures are also seen as impacting negatively on the sector. These include pressures on funding of the BBC, “legislative creep” and increasing regulation.
International and national regulation are considered to be important drivers of change to the ICT sector as a whole, although not as important as factors like technological change and overall economic conditions.
Social
The employment model in Digital Media is unusual: 31% are self‐employed (14% across the wider economy), and many people work unpaid or operate below their potential before securing permanent / appropriate employment. The sector under‐utilises segments of the available labour pool, including older women.
The ICT sector more generally is distinctive in that it employs high numbers of people with very specialised skills: 45% of the digital media workforce is in an associate professional / technical role, compared with 19% across the workforce as a whole, and the vacancy rate for this group is higher than average.
Environmental
There is potential for the development of greener technologies and ways of working that harness digital and media technologies.
There is also potential to expand markets in response to consumer demand and government policy shaped by environmental issues.
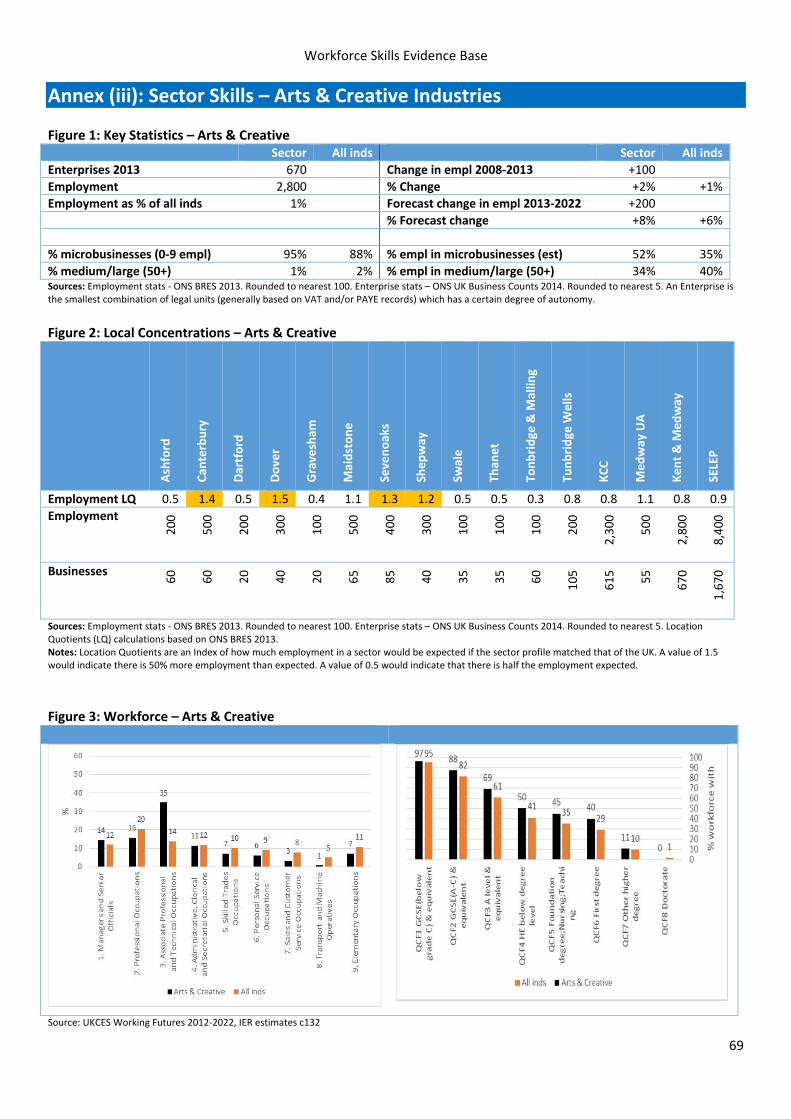
Workforce Skills Evidence Base
69
Annex (iii): Sector Skills – Arts & Creative Industries Figure 1: Key Statistics – Arts & Creative Sector All inds Sector All inds
Enterprises 2013 670 Change in empl 2008‐2013 +100
Employment 2,800 % Change +2% +1%
Employment as % of all inds 1% Forecast change in empl 2013‐2022 +200
% Forecast change +8% +6%
% microbusinesses (0‐9 empl) 95% 88% % empl in microbusinesses (est) 52% 35%
% medium/large (50+) 1% 2% % empl in medium/large (50+) 34% 40%Sources: Employment stats ‐ ONS BRES 2013. Rounded to nearest 100. Enterprise stats – ONS UK Business Counts 2014. Rounded to nearest 5. An Enterprise is the smallest combination of legal units (generally based on VAT and/or PAYE records) which has a certain degree of autonomy.
Figure 2: Local Concentrations – Arts & Creative
Ashford
Can
terbury
Dartford
Dover
Gravesham
Maidstone
Sevenoaks
Shepway
Swale
Than
et
Tonbridge & M
allin
g
Tunbridge
Wells
KCC
Medway UA
Kent & M
edway
SELEP
Employment LQ 0.5 1.4 0.5 1.5 0.4 1.1 1.3 1.2 0.5 0.5 0.3 0.8 0.8 1.1 0.8 0.9
Employment
200
500
200
300
100
500
400
300
100
100
100
200
2,300
500
2,800
8,400
Businesses
60
60
20
40
20
65
85
40
35
35
60
105
615
55
670
1,670
Sources: Employment stats ‐ ONS BRES 2013. Rounded to nearest 100. Enterprise stats – ONS UK Business Counts 2014. Rounded to nearest 5. Location Quotients (LQ) calculations based on ONS BRES 2013. Notes: Location Quotients are an Index of how much employment in a sector would be expected if the sector profile matched that of the UK. A value of 1.5 would indicate there is 50% more employment than expected. A value of 0.5 would indicate that there is half the employment expected.
Figure 3: Workforce – Arts & Creative
Source: UKCES Working Futures 2012‐2022, IER estimates c132
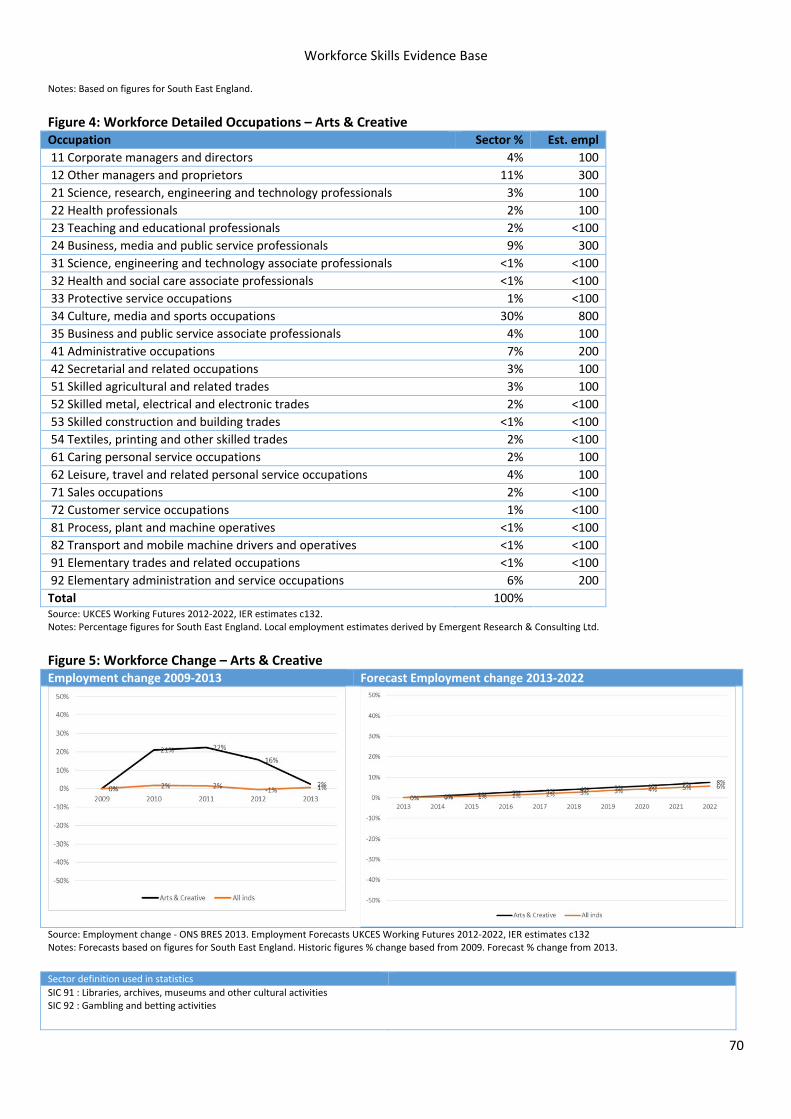
Workforce Skills Evidence Base
70
Notes: Based on figures for South East England.
Figure 4: Workforce Detailed Occupations – Arts & Creative Occupation Sector % Est. empl
11 Corporate managers and directors 4% 100
12 Other managers and proprietors 11% 300
21 Science, research, engineering and technology professionals 3% 100
22 Health professionals 2% 100
23 Teaching and educational professionals 2% <100
24 Business, media and public service professionals 9% 300
31 Science, engineering and technology associate professionals <1% <100
32 Health and social care associate professionals <1% <100
33 Protective service occupations 1% <100
34 Culture, media and sports occupations 30% 800
35 Business and public service associate professionals 4% 100
41 Administrative occupations 7% 200
42 Secretarial and related occupations 3% 100
51 Skilled agricultural and related trades 3% 100
52 Skilled metal, electrical and electronic trades 2% <100
53 Skilled construction and building trades <1% <100
54 Textiles, printing and other skilled trades 2% <100
61 Caring personal service occupations 2% 100
62 Leisure, travel and related personal service occupations 4% 100
71 Sales occupations 2% <100
72 Customer service occupations 1% <100
81 Process, plant and machine operatives <1% <100
82 Transport and mobile machine drivers and operatives <1% <100
91 Elementary trades and related occupations <1% <100
92 Elementary administration and service occupations 6% 200
Total 100% Source: UKCES Working Futures 2012‐2022, IER estimates c132. Notes: Percentage figures for South East England. Local employment estimates derived by Emergent Research & Consulting Ltd.
Figure 5: Workforce Change – Arts & Creative Employment change 2009‐2013 Forecast Employment change 2013‐2022
Source: Employment change ‐ ONS BRES 2013. Employment Forecasts UKCES Working Futures 2012‐2022, IER estimates c132 Notes: Forecasts based on figures for South East England. Historic figures % change based from 2009. Forecast % change from 2013.
Sector definition used in statistics
SIC 91 : Libraries, archives, museums and other cultural activitiesSIC 92 : Gambling and betting activities

Workforce Skills Evidence Base
71
Analysis of the Arts & Creative Sector
1. Key Messages from the Sector Dashboard
It should be noted that the sector dashboard does not include broadcasting and digital media which are covered by a separate dashboard which can be read in conjunction with this one.
The Arts and Creative sector is small in employment terms, accounting for only 1% of all employment in Kent and Medway. Micro‐businesses predominate, making up 95% of companies (compared with only 88% for the economy as a whole). While employment is expected to grow in coming years, the scale of this growth is small, and is expected to be in the low hundreds.
Arts and Creative sector employment form a larger than average proportion of the workforce in Canterbury and Dover (the latter presumably related to the District’s museums and historic buildings including Dover castle). However no individual District or Borough has more than 500 jobs in the sector (as defined here – excluding digital media and craft manufacturing for example).
The most common broad occupational category in the sector is Associate Professional and Technical Occupations. These account for 35% of employment in the sector, as opposed to 14% of employment for the economy as a whole. The sector workforce is better qualified in terms of level than the workforce as a whole, especially in terms of Higher Level skills (Level 4 +).
The numbers of people employed in the sector have remained largely static in recent years, but are expected to rise by around 8% from 2013 to 2022 (compared with 6% for the economy as a whole).
2. Sector Issues highlighted in National Research Research by Creative and Cultural Skills, the sector skills representative body for the arts and creative sector provides the most up‐to‐date national assessment of skills and workforce issues affecting the sector.19 It should be noted that the sector focus of Creative and Cultural Skills includes media and broadcasting which we have covered more directly in the Sector Dashboard for the Digital & Media sector. Figure 6 (overleaf) summarises some key points from the analysis using the “PESTLE” analytical framework, with some additional input from Emergent Research’s recent experience of the sector. The report concludes that:
The intersection between the digital world and the creative industries will depend on a workforce that is recalibrated to mix creativity with technical coding and programming skills, as well as knowledge of STEM subjects.
In the current climate of public funding, the growth in the base of self‐employed workers is an important factor to consider in skills planning, which has been reported for some time but will increasingly require a workforce equipped to operate independently and in entrepreneurial ways.
The need for professional skills, both for sole traders, freelancers and employees in larger businesses, is paramount as the sector responds to the economic climate. Having the capability to diversify income streams, reach new markets, undertake robust financial planning and respond to the changing demands of customers will be key in the next decade. The evidence also shows that in larger organisations, strong leadership skills and management capabilities are also vital to accommodate change.
Higher level technical skills and knowledge will continue to be essential to the creative and cultural industries in the next decade. The creative sector needs people with a depth of technical skills; those who can ‘make and do’ as well as conceive ideas.
19 Creative & Cultural Skills, 2015 ‘Building a Creative Nation: The Next Decade’
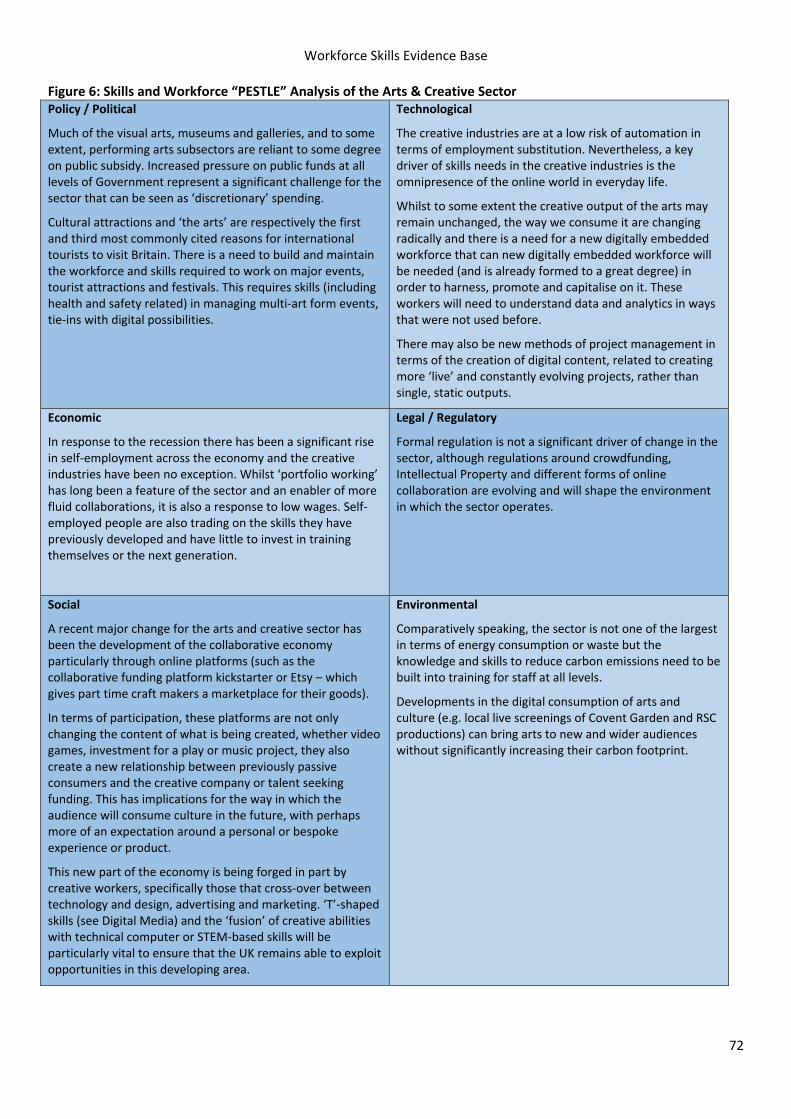
Workforce Skills Evidence Base
72
Figure 6: Skills and Workforce “PESTLE” Analysis of the Arts & Creative Sector Policy / Political
Much of the visual arts, museums and galleries, and to some extent, performing arts subsectors are reliant to some degree on public subsidy. Increased pressure on public funds at all levels of Government represent a significant challenge for the sector that can be seen as ‘discretionary’ spending.
Cultural attractions and ‘the arts’ are respectively the first and third most commonly cited reasons for international tourists to visit Britain. There is a need to build and maintain the workforce and skills required to work on major events, tourist attractions and festivals. This requires skills (including health and safety related) in managing multi‐art form events, tie‐ins with digital possibilities.
Technological
The creative industries are at a low risk of automation in terms of employment substitution. Nevertheless, a key driver of skills needs in the creative industries is the omnipresence of the online world in everyday life.
Whilst to some extent the creative output of the arts may remain unchanged, the way we consume it are changing radically and there is a need for a new digitally embedded workforce that can new digitally embedded workforce will be needed (and is already formed to a great degree) in order to harness, promote and capitalise on it. These workers will need to understand data and analytics in ways that were not used before.
There may also be new methods of project management in terms of the creation of digital content, related to creating more ‘live’ and constantly evolving projects, rather than single, static outputs.
Economic
In response to the recession there has been a significant rise in self‐employment across the economy and the creative industries have been no exception. Whilst ‘portfolio working’ has long been a feature of the sector and an enabler of more fluid collaborations, it is also a response to low wages. Self‐employed people are also trading on the skills they have previously developed and have little to invest in training themselves or the next generation.
Legal / Regulatory
Formal regulation is not a significant driver of change in the sector, although regulations around crowdfunding, Intellectual Property and different forms of online collaboration are evolving and will shape the environment in which the sector operates.
Social
A recent major change for the arts and creative sector has been the development of the collaborative economy particularly through online platforms (such as the collaborative funding platform kickstarter or Etsy – which gives part time craft makers a marketplace for their goods).
In terms of participation, these platforms are not only changing the content of what is being created, whether video games, investment for a play or music project, they also create a new relationship between previously passive consumers and the creative company or talent seeking funding. This has implications for the way in which the audience will consume culture in the future, with perhaps more of an expectation around a personal or bespoke experience or product.
This new part of the economy is being forged in part by creative workers, specifically those that cross‐over between technology and design, advertising and marketing. ‘T’‐shaped skills (see Digital Media) and the ‘fusion’ of creative abilities with technical computer or STEM‐based skills will be particularly vital to ensure that the UK remains able to exploit opportunities in this developing area.
Environmental
Comparatively speaking, the sector is not one of the largest in terms of energy consumption or waste but the knowledge and skills to reduce carbon emissions need to be built into training for staff at all levels.
Developments in the digital consumption of arts and culture (e.g. local live screenings of Covent Garden and RSC productions) can bring arts to new and wider audiences without significantly increasing their carbon footprint.

Workforce Skills Evidence Base
73
Workforce Skills Evidence Base
74
Canterbury Innovation Centre University Road Canterbury Kent CT2 7FG
Liverpool Science Park Innovation Centre 1 131 Mount Pleasant Liverpool L3 5TF
Kent and Medway Economic Partnership www.kmep.org.uk │ [email protected] │ 03000 417106