Workforce Report 2010
32
-
Upload
margaret-martin -
Category
Documents
-
view
221 -
download
0
Transcript of Workforce Report 2010

8/6/2019 Workforce Report 2010
http://slidepdf.com/reader/full/workforce-report-2010 1/32

8/6/2019 Workforce Report 2010
http://slidepdf.com/reader/full/workforce-report-2010 2/32
1
Executive Summary and Key Findings
Similar to state governments across the nation,Minnesota’s state employees are older than non-government employees and large numbers will beeligible to retire very soon. State government
workforces, including Minnesota’s, are aging faster thanfederal and local governments. Financial pressures posedby Minnesota’s state budget point toward a workforcereduction, which in turn poses important considerationsfor workforce planning and development.
In 2000 the median age of state employees was 45.5. In2010 median age for state employees has increased to50.5. In fiscal year 2010, within the executive branch of state government, the average retirement age was 61.30.
There were fewer retirements than average in fiscal year
2009, likely due to employees’ desires to rebuild thevalue of retirement savings after a global economicdecline. It is anticipated that those who did not retire foreconomic reasons in 2009 will retire soon, as will thosewho are imminently eligible to retire. Retirementsincreased over 16 percent between fiscal years 2009 and2010 and are likely to increase even more in 2011.
Typically, organizations hire new employees to fillworkforce gaps left by high rates of retirement.Employees who are preparing to retire transferknowledge and train in new employees in order to retainorganizational knowledge and productivity. Because of the financial constraints on agency budgets vacancieshave not been filled for many positions. There has beenan overall reduction in permanent hiring, and the overallsize of the workforce is reduced. In fact, most hiring infiscal year 2010 has been on a contingent basis, whichprovides short-term budget relief, however, it does notsupport a long standing, well-trained and developedworkforce.
The reduction in permanent rehiring can lead to a highlevel of uncertainty in the workplace. In the past year,only 26 percent of new employees were hired on a full-time, permanent basis. The increasingly transient natureof new hires combined with the departure of retirees andtheir institutional knowledge create a situation that willincrease struggles with job retention, retainingorganizational knowledge, and developing talent of Minnesota’s government workforce.
Key Findings
1. The median age of Minnesota’s workforce isincreasing. In 2000, the median age of Minnesota’s workforce was 45.5. It was 50.5 in2010.
2. Almost 60 percent of new hires in fiscal year2010 were hired on an emergency, provisional,seasonal, temporary, or limited status. There areapproximately 10 percent fewer permanent newhires than in 2009 and 15 percent fewer than in2008. Only 26 percent of new hires in fiscal year2010 were hired on a full time, permanent statusThis is a three percent decrease from 2009 andsix percent decrease from 2008.
3. The total cost of compensation increased only1.03 percent since fiscal year 2009. That is amuch smaller change than in prior years (4.84percent increase in 2009, 7.28 percent increasein 2008).
4. In the last 10 years, full-time equivalency (FTE)increased by approximately one-half percent inMinnesota’s state government.
5. Retirements have increased over 16 percent
since fiscal year 2009. They are expected toincrease even more in 2011 according the statedemographer.
6. The number of years that an average employeehas stayed employed with the state of Minnesotain fiscal year 2010 is 12.92 years. The averagelength of employment has increased by 1.86percent since fiscal year 2009, when the averagelength was 12.68 years.
7. The cost of overtime decreased by
approximately $2 million since fiscal year 2009.
8/6/2019 Workforce Report 2010
http://slidepdf.com/reader/full/workforce-report-2010 3/32
2010 Minnesota Workforce Report, 2
Table of Contents
Executive Summary and Key Findings ............................................................................................................................... 1
Key Findings ............................................................................................................................... 1
About this Report ......................................................................................................................... 4
Key Facts to Consider .................................................................................................................. 5
Definitions .................................................................................................................................. 5
2010 Workforce Profile ........................................................................................................................................................ 6
The State Government Workforce Separated by Branch .......... ......... .......... ......... .......... ......... ......... 7
Workforce Counts ........................................................................................................................ 8
Full-time Equivalencies (FTEs)................................................................................................... 10
Workforce Distribution by Agency (FTE) .................................................................................... 11
Workforce Diversity Profile ............................................................................................................................................... 15
Overall Workforce Diversity Profile ............................................................................................ 15
Increasing Median Age of State Government Workforce .............................................................................................. 16
Retirement ........................................................................................................................................................................... 19
Average Age of Retirement has Increased .................................................................................... 20
Employee Turnover ............................................................................................................................................................ 21
Employee Retention ............................................................................................................................................................ 22
New Hires ............................................................................................................................................................................. 23
Agencies that did the Most Hiring in 2010 ......... .......... ......... .......... .......... ......... .......... ......... ....... 25
New Hire Profile ........................................................................................................................ 25
Age Distribution of Full-Time New Hires in 2010 ......... ......... .......... .......... ......... .......... ......... ...... 26
New Hires and Churnover ........................................................................................................... 27
A Glance at Compensation ................................................................................................................................................. 28
Bargaining Unit Information ............................................................................................................................................. 29
Minnesota’s Workforce at Work ....................................................................................................................................... 30
A Recent Story of How State Employees Made a Difference… ..................................................... 30
Tables
Table A: State Government Workforce at a Glance (as of July 2010)............................................... 6
Table B: Workforce Separated by Branch (supporting table) .......................................................................................... 7
Table C: Size of Minnesota’s Workforce (Appointment Count) by Calendar and Fiscal Year (supporting table) .......... 8
Table D: FTE Count by Fiscal Year ............................................................................................. 10
Table E: Appointment Count and FTEs by Agency .......... .......... ......... .......... ......... .......... ......... .... 12
Table F: Workforce Distribution by County ................................................................................. 14
Table G: Workforce Diversity Comparison .................................................................................. 15
Table H: Retirement and Age Profile by Agency .......................................................................... 16
Table I: Total Retirements by Year ............................................................................................. 19

8/6/2019 Workforce Report 2010
http://slidepdf.com/reader/full/workforce-report-2010 4/32
2010 Minnesota Workforce Report, 3
Table J: Average Age of Retirement (supporting table) ................................................................................................. 20
Table K: 15 jobs with the Highest Turnover in Fis cal Year 2010 .......... ......... .......... .......... ......... ... 21
Table L: Agencies with Highest Total Turnover Rates in Fiscal Year 2010* ................................................................ 21
Table M: Workforce Totals ............................................................................................................................................ 21
Table N: Years of Service – Fiscal Years 2006-2010 .................................................................................................... 22
Table O: New Hires by Year (supporting table) ............................................................................................................. 23
Table P: Jobs of New Hires ............................................................................................................................................ 24
Table Q: Agencies with Highest Number of New Hires................................................................. 25
Table R: New Hire Profile .......................................................................................................... 25
Table S: Age Distribution of New Hires in 2010 (supporting table) .............................................................................. 26
Table T: Internal and External Hires (supporting table) ................................................................................................. 27
Table U: Total Compensation 2006-2010 .......... ......... .......... ......... .......... .......... ......... .......... ........ 28
Table V: Overtime in Hours and Dollar Amount........................................................................... 28
Table W: Who is Represented in the Union? ................................................................................................................. 29
Charts
Chart 1: Workforce Distribution by Branch ....... .... .... .... .... .... .... .... .... .... .... .... .... .... .... .... .... .... .... .... .... .... . 7
Chart 2: Minnesota’s Workforce Size 2001-2010 (Appointment Count) .... ... .. ... ... .. ... ... .. ... ... .. ... ... .. ... ... .. ... ... .. 8
Chart 3: Ten agencies employ over 82 Percent of the workforce ... .. ... ... .. ... ... .. ... ... ... .. ... ... .. ... ... .. ... ... .. ... ... .. . 11
Chart 4: Workforce Distribution by County (Appointment Count) .. ... ... .. ... ... .. ... ... ... .. ... ... .. ... ... .. ... ... .. ... ... .. . 13
Chart 5: 2010 Minnesota State Workforce Diversity Profile .. ... .. ... ... ... .. ... ... .. ... ... .. ... ... .. ... ... .. ... ... .. ... ... .. ... . 15
Chart 6: Average Age of Retirement ................................................................................................... 20
Chart 7: New Hires by Year ......... .......... ......... .......... ......... .......... ......... .......... .......... ......... .......... .... 23
Chart 8: New Hires with Full-time, Unlimited Status .................................................................................................... 24
Chart 9: New Hires with Part-time or Contingent Status ............................................................................................... 24
Chart 10: New Hires ......... ......... .......... ......... .......... .......... ......... .......... ......... .......... ......... .......... ..... 26
Chart 11: Comparison of Internal and External Hires . .... .... .... .... .... .... .... .... .... .... .... .... .... .... .... .... .... .... .... . 27
Chart 12: 2010 Union Representation .... .... .... .... .... .... .... .... .... .... .... .... .... .... .... .... .... .... .... .... .... .... .... .... .. 29

8/6/2019 Workforce Report 2010
http://slidepdf.com/reader/full/workforce-report-2010 5/32
2010 Minnesota Workforce Report, 4
Minnesota Management and Budget (MMB) is theemployee relations and finance agency of Minnesota’sexecutive branch of government. MMB’s mission is toincrease state government’s capacity to manage andutilize financial, human, information and analyticalresources to ensure exceptional service and value forMinnesota’s citizens.
Coordinating the state’s personnel and labor relationsactivities, MMB assists statewide agencies with issuesrelating to state employment. Some of the tasks includepolicy development, administration of the state’s meritsystem, negotiation and administration of laboragreements, and development of compensation plans forall state employees. MMB also manages the insurancebenefits for all employees and their dependents. Theagency is committed to the continuous improvement of human capital management and services that supportstate government.
This report was completed by Workforce Planning andDevelopment, a division of MMB. Workforce Planningand Development provides guidance to state agencies inpreparing workforce plans; offers diversity leadership,consultation and technical assistance to ensurecompliance with state and federal requirements for theAmericans with Disabilities Act (ADA); providesguidance to local governments in achieving andmaintaining gender equity in their compensation plans;and puts forth custom-designed services and training topublic service clients through Enterprise Learning and
Management (ELD).
About this Report
The 2010 Minnesota Workforce Report focuses on stateemployees in the executive branch of state government.This information reflects all permanent and non-permanent employees in state agencies under the jurisdiction of the governor and other executive officials.
This report does not include information on thelegislative or judicial branches, public higher education(specifically MnSCU or University of Minnesota), or theretirement agencies (Minnesota State Retirement System[MSRS], Teacher’s Retirement Association [TRA], orPublic Employee Retirement Association [PERA]).
The primary source of the Minnesota Workforce Reportdata is the State’s Human Resources InformationSystem, referred to as SEMA4. Information was alsoprovided by Minnesota State Retirement System
(MSRS), State Demographic Center, and MMB’sBudget Division.
The data contained in this report represents the status of the state government workforce as of July 2010.

8/6/2019 Workforce Report 2010
http://slidepdf.com/reader/full/workforce-report-2010 6/32
2010 Minnesota Workforce Report, 5
Key Facts to Consider
The following key events impacted the workforce duringthe past two years:
July 2009 – Contracts and plans for employeescontained no salary increases. Performance-basedincreases stopped for fiscal year 2010.July 2010 – Contracts and plans for employeescontained no salary increases.
Definitions
Average – The most representative score in adistribution.
Cabinet-level agency – The following agencies areconsidered cabinet-level: The Departments of
Administration, Agriculture, Commerce, Corrections,Education, Employment and Economic Development,Health, Human Rights, Labor and Industry, Managementand Budget, Natural Resources, Public Safety, HumanServices, Revenue, Transportation, and Veterans Affairs;the Housing Finance and Pollution Control Agencies;the Office of Iron Range Resources and Rehabilitation;the Bureau of Mediation Services; and Office of Enterprise Technology. Each has appointedcommissioners or executives who are part of theGovernor’s Cabinet.
Calendar year – January through December.
Churnover – Intra- and inter-agency movementpromotion, transfer, and demotion.
Contingent workforce - Refers to seasonal, temporarylimited, emergency, and provisional employees hired
expecting to be terminated at the end of his or her timeof employment.
Enterprise – Refers to the entire executive branch.
Executive Branch - Agencies of state governmenestablished by statute or constitution who have withintheir particular field of responsibility statewide jurisdiction and who are not within the legislative o judicial branches of government.
Fiscal Year – July through June. Fiscal year 2010 was
the time parameter used for this report.
Median – The point at which 50 percent of cases in adistribution fall below and 50 percent fall above. Thecenter point of a distribution.
Turnover – Turnover can be voluntary, which has beendetermined to be beyond the control of management, orinvoluntary, which is at the control of management.
Unlimited status – Employees hired on a permanentstatus. Others are hired on seasonal, emergency
temporary, limited, or provisional status.
8/6/2019 Workforce Report 2010
http://slidepdf.com/reader/full/workforce-report-2010 7/32
2010 Minnesota Workforce Report, 6
2010 Workforce Profile
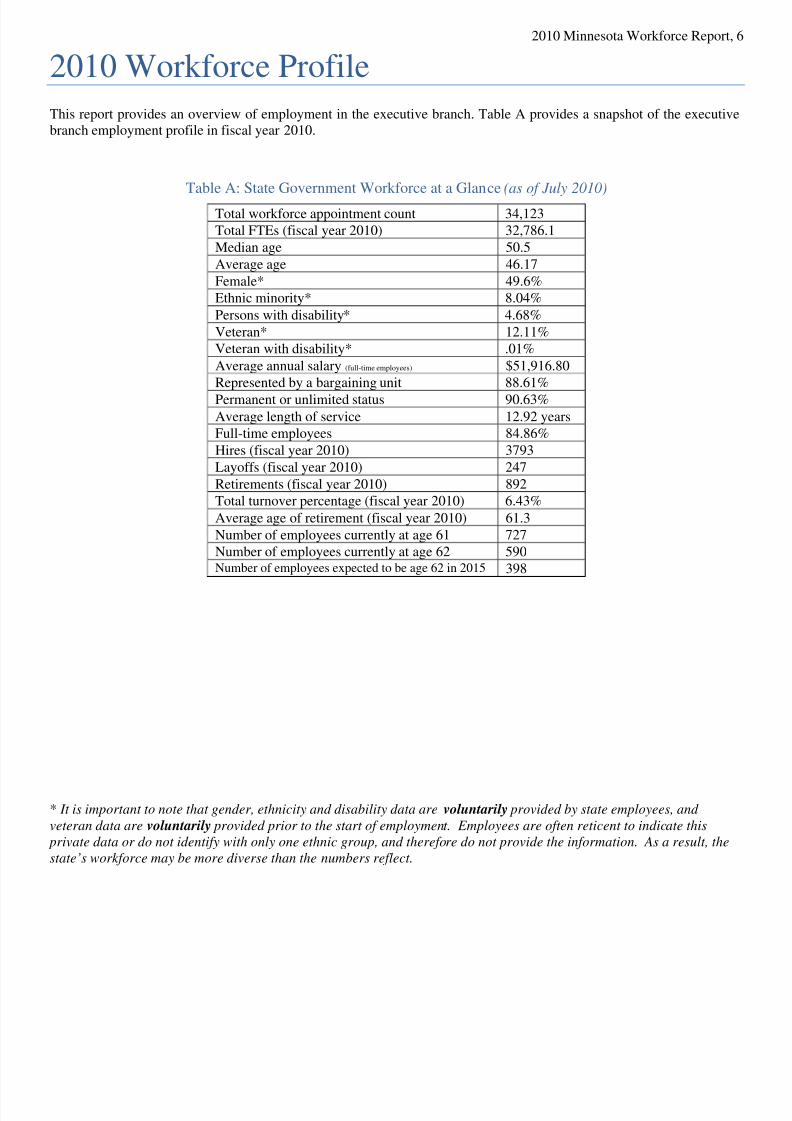
This report provides an overview of employment in the executive branch. Table A provides a snapshot of the executivebranch employment profile in fiscal year 2010.
Table A: State Government Workforce at a Glance (as of July 2010)
Total workforce appointment count 34,123Total FTEs (fiscal year 2010) 32,786.1
Median age 50.5
Average age 46.17
Female* 49.6%Ethnic minority* 8.04%
Persons with disability* 4.68%
Veteran* 12.11%Veteran with disability* .01%
Average annual salary (full-time employees) $51,916.80Represented by a bargaining unit 88.61%
Permanent or unlimited status 90.63%
Average length of service 12.92 yearsFull-time employees 84.86%
Hires (fiscal year 2010) 3793
Layoffs (fiscal year 2010) 247
Retirements (fiscal year 2010) 892Total turnover percentage (fiscal year 2010) 6.43%
Average age of retirement (fiscal year 2010) 61.3
Number of employees currently at age 61 727Number of employees currently at age 62 590Number of employees expected to be age 62 in 2015 398
* It is important to note that gender, ethnicity and disability data are voluntarily provided by state employees, and
veteran data are voluntarily provided prior to the start of employment. Employees are often reticent to indicate this
private data or do not identify with only one ethnic group, and therefore do not provide the information. As a result, the
state’s workforce may be more diverse than the numbers reflect.
8/6/2019 Workforce Report 2010
http://slidepdf.com/reader/full/workforce-report-2010 8/32
2010 Minnesota Workforce Report, 7
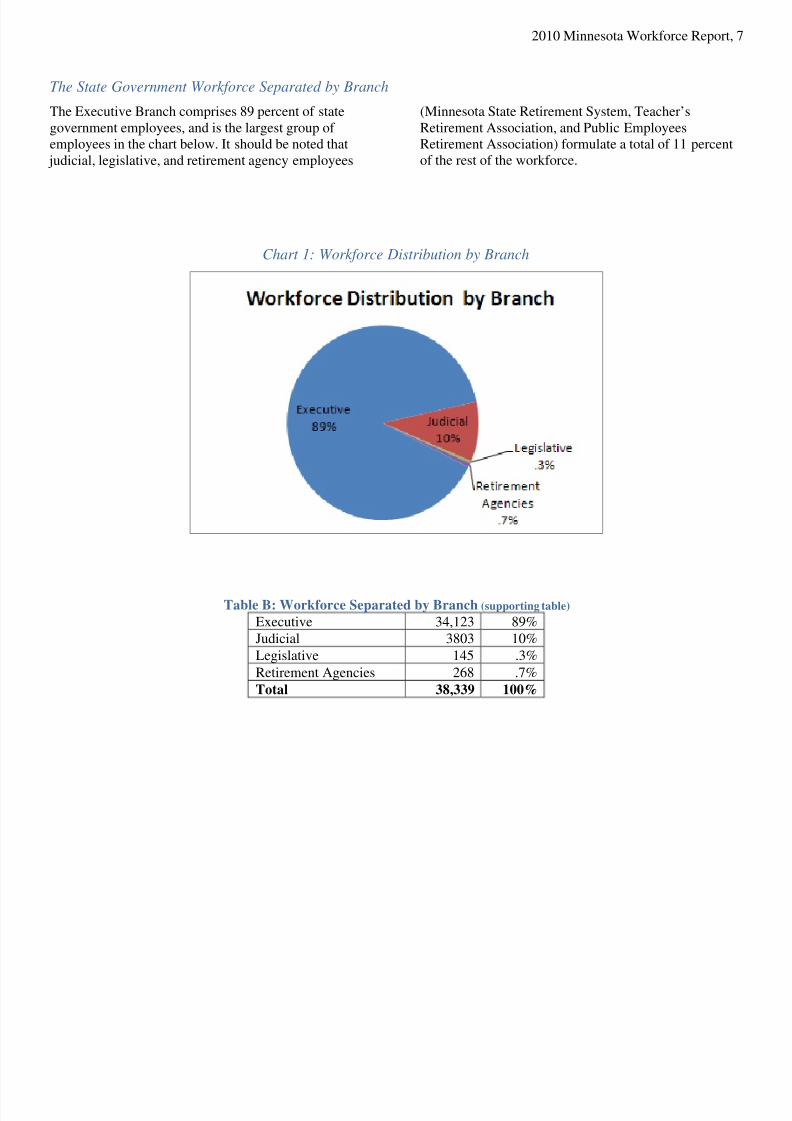
The State Government Workforce Separated by Branch
The Executive Branch comprises 89 percent of stategovernment employees, and is the largest group of employees in the chart below. It should be noted that judicial, legislative, and retirement agency employees
(Minnesota State Retirement System, Teacher’sRetirement Association, and Public EmployeesRetirement Association) formulate a total of 11 percentof the rest of the workforce.
Chart 1: Workforce Distribution by Branch
Table B: Workforce Separated by Branch (supporting table)
Executive 34,123 89%Judicial 3803 10%
Legislative 145 .3%
Retirement Agencies 268 .7%
Total 38,339 100%

8/6/2019 Workforce Report 2010
http://slidepdf.com/reader/full/workforce-report-2010 9/32
2010 Minnesota Workforce Report, 8
Workforce Counts
The size of Minnesota’s workforce fluctuates throughoutthe year due to seasonal appointments in programsthroughout various agencies. Appointment count isdefined by the number of active appointments workingfor the state of Minnesota. Each employee counts as one,
regardless of their unlimited or contingent employmentstatus or full or part-time hours. In addition, someemployees hold multiple appointments. For example, anemployee may have a part-time position with one agencyand a seasonal position with another. The size of Minnesota’s workforce decreased in 2002, 2003 and2004, then increased between 2005 and
2009. In 2010, the size of the workforce decreased by.25 percent. The reasons for the decrease were hiringrestrictions that resulted in only critical positions beingfilled and budget cuts that prevented rehiring with avacant position. Most new employees of 2010 were
hired on a contingent basis. A high number of contingently hired employees does not maintain a well-developed workforce, which will be discussed later inthis report.
Chart 2: Minnesota’s Workforce Size 2001-2010 (Appointment Count)
Table C: Size of Minnesota’s Workforce (Appointment Count) by Calendar and Fiscal Year (supporting table)
2001 2002 2003 2004 2005 2006 2007 2008 2009 2010
Calendar***Year Count(January)
33,251 33,510 32,799 31,434 31,519 31,648 32,206 32,937 32,996 33,090
Fiscal** Year
Count (July)
34,596 33,909 32,527 32,492 32,410 32,976 33,347 33,683 34,213 34,123
% changebetween
fiscal andcalendar yr
appointmentcounts
+4.04%* +1.19%* -.82%* +3.37%* +2.60%* +5.09%* +4.58%* +2.26%* +3.56%* +3.12%
*** Calendar year: January through December** Fiscal year: July through June

8/6/2019 Workforce Report 2010
http://slidepdf.com/reader/full/workforce-report-2010 10/32
2010 Minnesota Workforce Report, 9
*There is a change in workforce size from January to July. This is because of the additional of limited, temporary,emergency, provisional, or seasonal (contingent) employees for spring and summer months, mostly to Department of Natural Resources and Department of Transportation.

8/6/2019 Workforce Report 2010
http://slidepdf.com/reader/full/workforce-report-2010 11/32
2010 Minnesota Workforce Report, 10
Full-Time Equivalencies (FTEs)
To establish a more consistent measure of workforce,budget planners use full-time quivalencies (FTEs). Todetermine FTEs, a calculation is made based on theactual number of hours paid to employees divided by2,088 hours per year. The resulting number indicates theequivalent of employees’ hours, regardless of the termsof his or her employee status. For example, four half time employees would be described as two FTEs.
The Executive Branch had 32,786.1 FTEs during fiscalyear 2010. In the last year, the workforce has increasedin .78 percent when calculating FTEs. In the last 10years the FTE size of the workforce has only increasedby a total of .55 percent.
Table D: FTE Count by Fiscal Year
Year 2001 2002 2003 2004 2005 2006 2007 2008 2009 2010
FTE 32,607.9 31,934.1 31,987.3 30,797.6 30,906.4 31,206.8 31,820.6 32,430.3 32,532.8 32,786.1
%Change
+2.06% +.17% -3.72% +.35% -2.26% +1.97% +1.92% +2.20% +.78%

8/6/2019 Workforce Report 2010
http://slidepdf.com/reader/full/workforce-report-2010 12/32
2010 Minnesota Workforce Report, 11
Workforce Distribution by Agency (FTE)
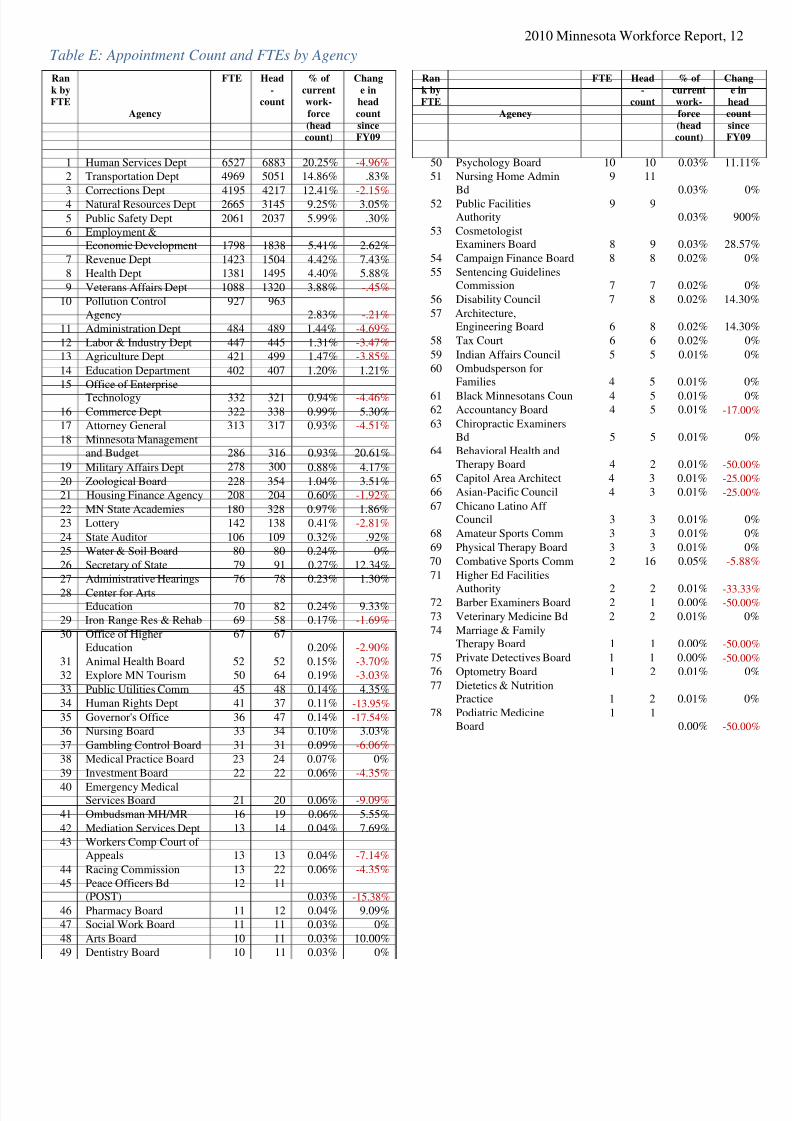
Ten agencies employ over 80 percent of the workforce.They are the largest in size. All information in the TableE is listed in rank order by FTE, which indicates theequivalent of full-time employees within each agency.Also listed in the table is the appointment count of eachexecutive branch agency, board and commission, thecurrent percentage of the workforce that each agencyemploys, and change in each agency’s appointmentcount since 2009.
Over 47 percent of the state workforce is employed bythree agencies: Departments of Human Services (DHS),Transportation (MnDOT), and Corrections (DOC),respectively. State agency sizes range from the largest,such as DHS which employs approximately one-fifth of the executive branch employees, to very small, including
boards that have one employee to meet the needs of theorganization.
As illustrated in Table E, most agencies experienced adecrease in appointment count during the past year. Infact, over 42 percent of state agencies, boards, andcommissions saw a reduction in their appointment countEighteen agencies, boards and commissions, or almost23 percent, did not experience loss or gain, while almost32 percent of agencies, boards and commissionsexperienced a gain in appointment count. Agencies thatexperienced gains were primarily in response tolegislative initiatives, federally funded programs, orshort-term efforts, such as the implementation of Statewide Integrated Financial Tools (SWIFT).
Chart 3: Ten Agencies Employ Over 82 Percent of the Workforce
8/6/2019 Workforce Report 2010
http://slidepdf.com/reader/full/workforce-report-2010 13/32
2010 Minnesota Workforce Report, 12
Table E: Appointment Count and FTEs by Agency
Ran
k byFTE
Agency
FTE Head
-count
% of
currentwork-
force
(headcount)
Chang
e inhead
count
sinceFY09
1 Human Services Dept 6527 6883 20.25% -4.96%
2 Transportation Dept 4969 5051 14.86% .83%
3 Corrections Dept 4195 4217 12.41% -2.15%4 Natural Resources Dept 2665 3145 9.25% 3.05%
5 Public Safety Dept 2061 2037 5.99% .30%
6 Employment &Economic Development 1798 1838 5.41% 2.62%
7 Revenue Dept 1423 1504 4.42% 7.43%
8 Health Dept 1381 1495 4.40% 5.88%
9 Veterans Affairs Dept 1088 1320 3.88% -.45%
10 Pollution ControlAgency
927 9632.83% -.21%
11 Administration Dept 484 489 1.44% -4.69%
12 Labor & Industry Dept 447 445 1.31% -3.47%
13 Agriculture Dept 421 499 1.47% -3.85%
14 Education Department 402 407 1.20% 1.21%
15 Office of EnterpriseTechnology 332 321 0.94% -4.46%
16 Commerce Dept 322 338 0.99% 5.30%
17 Attorney General 313 317 0.93% -4.51%
18 Minnesota Managementand Budget 286 316 0.93% 20.61%
19 Military Affairs Dept 278 300 0.88% 4.17%
20 Zoological Board 228 354 1.04% 3.51%
21 Housing Finance Agency 208 204 0.60% -1.92%
22 MN State Academies 180 328 0.97% 1.86%
23 Lottery 142 138 0.41% -2.81%
24 State Auditor 106 109 0.32% .92%
25 Water & Soil Board 80 80 0.24% 0%
26 Secretary of State 79 91 0.27% 12.34%
27 Administrative Hearings 76 78 0.23% 1.30%
28 Center for ArtsEducation 70 82 0.24% 9.33%
29 Iron Range Res & Rehab 69 58 0.17% -1.69%
30 Office of HigherEducation
67 670.20% -2.90%
31 Animal Health Board 52 52 0.15% -3.70%
32 Explore MN Tourism 50 64 0.19% -3.03%
33 Public Utilities Comm 45 48 0.14% 4.35%
34 Human Rights Dept 41 37 0.11% -13.95%
35 Governor's Office 36 47 0.14% -17.54%
36 Nursing Board 33 34 0.10% 3.03%
37 Gambling Control Board 31 31 0.09% -6.06%
38 Medical Practice Board 23 24 0.07% 0%
39 Investment Board 22 22 0.06% -4.35%
40 Emergency MedicalServices Board 21 20 0.06% -9.09%
41 Ombudsman MH/MR 16 19 0.06% 5.55%
42 Mediation Services Dept 13 14 0.04% 7.69%
43 Workers Comp Court of Appeals 13 13 0.04% -7.14%
44 Racing Commission 13 22 0.06% -4.35%
45 Peace Officers Bd(POST)
12 110.03% -15.38%
46 Pharmacy Board 11 12 0.04% 9.09%
47 Social Work Board 11 11 0.03% 0%
48 Arts Board 10 11 0.03% 10.00%
49 Dentistry Board 10 11 0.03% 0%
Ran
k byFTE
Agency
FTE Head
-count
% of
currentwork-
force
(headcount)
Cha
e ihea
cou
sinFY
50 Psychology Board 10 10 0.03% 11.
51 Nursing Home AdminBd
9 110.03%
52 Public FacilitiesAuthority
9 90.03% 90
53 CosmetologistExaminers Board 8 9 0.03% 28.5
54 Campaign Finance Board 8 8 0.02%
55 Sentencing GuidelinesCommission 7 7 0.02%
56 Disability Council 7 8 0.02% 14.3
57 Architecture,Engineering Board 6 8 0.02% 14.3
58 Tax Court 6 6 0.02%
59 Indian Affairs Council 5 5 0.01%
60 Ombudsperson forFamilies 4 5 0.01%
61 Black Minnesotans Coun 4 5 0.01% 62 Accountancy Board 4 5 0.01% -17.
63 Chiropractic ExaminersBd 5 5 0.01%
64 Behavioral Health andTherapy Board 4 2 0.01% -50.
65 Capitol Area Architect 4 3 0.01% -25.
66 Asian-Pacific Council 4 3 0.01% -25.
67 Chicano Latino Aff Council 3 3 0.01%
68 Amateur Sports Comm 3 3 0.01%
69 Physical Therapy Board 3 3 0.01%
70 Combative Sports Comm 2 16 0.05% -5.8
71 Higher Ed Facilities
Authority 2 2 0.01% -33.72 Barber Examiners Board 2 1 0.00% -50.
73 Veterinary Medicine Bd 2 2 0.01%
74 Marriage & FamilyTherapy Board 1 1 0.00% -50.
75 Private Detectives Board 1 1 0.00% -50.
76 Optometry Board 1 2 0.01%
77 Dietetics & NutritionPractice 1 2 0.01%
78 Podiatric MedicineBoard
1 10.00% -50.

8/6/2019 Workforce Report 2010
http://slidepdf.com/reader/full/workforce-report-2010 14/32
2010 Minnesota Workforce Report, 13
Chart 4: Workforce Distribution by County (Appointment Count)
The following map indicates the number of employeesemployed by appointment count within each countythroughout the state of Minnesota. On the page 13 is the
supporting table (Table F) listing each of the counties inalphabetical order, as well as the percentage of theworkforce within each county.
Kittson Roseau
Lake ofthe Woods
KoochichingMarshall
Beltrami
Pennington
Red Lake
Polk C l e a
r w a t e r
Norman
M a h n o m e n
Itasca
St. Louis
Lake Cook
Cass
H u b b a r d
BeckerClay
Aitkin
CarltonCrowWing
W a d e n a
WilkinOtter Tail
Grant
PopeStevens
Douglas
BigStone
TraverseBenton
Stearns
Morrison
Todd
C h i s a g o
Isanti
K a n a b e c
MilleLacs
Wright
Sherburne
ChippewaLac
QuiParle
Swift
K a n d i y o h i
Meeker
McLeodRenville
SibleyLyon
L i n c o l n
Yellow Medicine
Nicollet
Brown
Redwood
JacksonNoblesRock
Murray
P i p e
s t o n
e
FillmoreMowerFreebornFaribaultMartin Houston
WinonaOlmsted
DodgeSteele
W a s e c a
Blue Earth
Wabasha
GoodhueRice
LeSueur
Watonwan
Pine
Anoka
Carver
DakotaScott
Hennepin
Out-of-State
2049 32
47
1200269 38
16
43196
0
95 303
14184
265
302
4
109
462
37
331
103
220
72442
25 126
16
246 47
4
41 254 420
15
901316
25
1108
14960
1786
1341
556220
7
14
31 44037
38 414
20 115
57
1814
11
11593 204 40105 45 1145
21327
11 16 83 32
52
8 135 50510 126
956
18 48 60 66 22
4
41
430

8/6/2019 Workforce Report 2010
http://slidepdf.com/reader/full/workforce-report-2010 15/32
2010 Minnesota Workforce Report, 14
Approximately 60 percent of state employees work inthe seven-county metro area (Anoka, Carver, Dakota,Hennepin, Ramsey, Scott, and Washington counties)while greater Minnesota employs 40 percent of executive branch employees. Almost 60 percent of stategovernment employees work in five counties, 43 percentof whom work in Ramsey County. Ramsey County is the
largest and is where the state Capitol and many centraloffices of the various agencies, boards and commissionsare located. Hennepin County, is the second largest andholds the largest residential population in the state.Washington, St. Louis, and Nicollet Counties are the
next largest for employing state workers, respectively.The majority of employees in Washington County areemployees with the Department of Corrections, which iswhere the Minnesota Correctional Facility-Stillwater islocated. A large number of the employees are alsoemployed with the Department of Transportation. TheDepartments of Transportation, Natural Resources,
Human Services, Revenue, and Public Safety have largenumbers of employees in St. Louis County. Almost allthe employees in Nicollet County are employed withHuman Services.
Table F: Workforce Distribution by County
County # %
Aitkin 52 0.15%
Anoka 1108 3.25%
Becker 265 0.01%
Beltrami 431 1.26%
Benton 41 0.12%
Big Stone 14 0.04%
Blue Earth 331 .97%
Brown 105 0.19%
Carlton 956 2.80%
Carver 25 0.07%
Cass 103 0.30%
Chippewa 38 0.11%
Chisago 420 1.23%
Clay 109 .32%
Clearwater 14 0.04%
Cook 38 0.11%
Cottonwood 83 0.24%
Crow Wing 724 1.74%
Dakota 901 2.12%
Dodge 50 0.15%
Douglas 126 0.37%
Faribault 18 0.05%
Fillmore 66 0.19%
Freeborn 48 0.14%
Goodhue 213 0.62%
Grant 25 0.07%
Hennepin 1786 5.23%
Houston 22 0.06%
Hubbard 302 0.89%
Isanti 254 0.74%
County # %
Itasca 303 0.89%
Jackson 5 0.01%
Kanabec 15 0.04%
Kandiyohi 414 1.21%
Kittson 20 0.06%
Koochiching 47 0.17%
Lac Qui Parle 4 0.01%
Lake 269 0.79%
Lake Of Woods 32 0.09%
Le Sueur 45 0.13%
Lincoln 3 0.01%
Lyon 204 .60%
Mahnomen 18 0.05%
Marshall 16 0.05%
Martin 37 0.11%
McLeod 57 0.17%
Meeker 20 0.06%
Mille Lacs 47 0.14%
Morrison 246 0.72%
Mower 60 0.18%
Murray 16 0.05%
Nicollet 1159 3.39%
Nobles 56 0.16%
Norman 4 0.01%
Olmsted 510 1.49%
Otter Tail 462 1.35%
Pennington 96 0.28%
Pine 220 0.64%
Pipestone 11 0.03%
Polk 95 0.28%
Pope 31 0.09%
County # %
Ramsey 14920 43.72%
Red Lake 0 .00%
Redwood 40 0.12%
Renville 18 0.05%
Rice 1145 3.36%
Rock 220 0.64%
Roseau 49 0.14%
Scott 316 0.93%
Sherburne 430 1.26%
Sibley 11 0.03%
St Louis 1200 3.52%
Stearns 440 1.29%
Steele 135 0.40%
Stevens 37 0.11%
Swift 7 0.02%
Todd 16 0.05%
Traverse 4 0.01%
Wabasha 27 0.08%
Wadena 42 0.12%
Waseca 8 0.02%
Washington 1341 3.93%
Watonwan 32 0.09%
Wilkin 4 0.01%
Winona 126 .37%
Wright 115 0.34%
YellowMedicine 14 0.04%

8/6/2019 Workforce Report 2010
http://slidepdf.com/reader/full/workforce-report-2010 16/32
2010 Minnesota Workforce Report, 15
Workforce Diversity Profile
Overall Workforce Diversity Profile
The census data from 2010 data is not yet available,therefore, 2000 census data was utilized for comparisonsin this report.
The percentage of female employment is relatively equalacross the state government workforce, state privatesector workforce, and U.S. private sector workforce,with state employment representing about half of theemployee base. Minnesota’s government workforce is
close in comparison to the private sector workforce inethnic minority private sector workforce, and U.S.private sector workforce, with state employmentrepresenting about half of the employee base.Minnesota’s government workforce is close incomparison to the private sector workforce in ethnicminority.
Chart 5: 2010 Minnesota State Workforce Diversity
Profile
Table G: Workforce Diversity Comparison
2010MinnesotaState
GovernmentWorkforce
2000MinnesotaPrivate
SectorWorkforce
2000US Private
SectorWorkforce
Ethnic Minority 8.04%* 9.30% 27.23%
Persons withDisability
4.68%* 15.8% 19%
Female 49.6%* 47.4% 46.8%
Veteran withDisability
.01%* n/a n/a
Veteran 12.11%* n/a n/a
Age 40 or Older 71.07% n/a n/a
* It is important to note that gender, ethnicity and disability data are voluntarily provided by state employees, and
veteran data are voluntarily provided prior to the start of employment. Employees are often reticent to indicate this
private data or do not identify with only one ethnic group, and therefore do not provide the information. As a result, the
state’s workforce may be more diverse than the numbers reflect.
.

8/6/2019 Workforce Report 2010
http://slidepdf.com/reader/full/workforce-report-2010 17/32
2010 Minnesota Workforce Report, 16
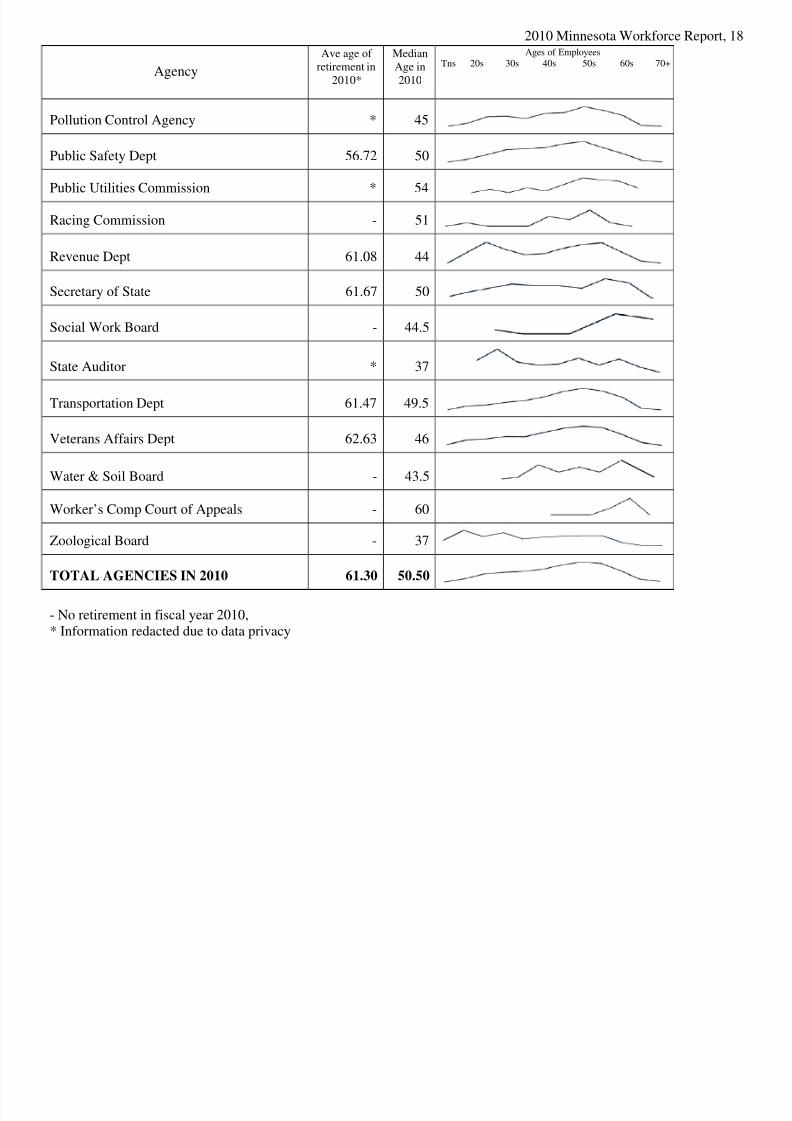
Increasing Median Age of State Government Workforce
The median age of the workforce is increasing across thenation. According to demographic experts, stategovernment workforces across the nation are especially
at risk because of the high numbers of baby boomers instate employment nearing retirement age. The medianage of the Minnesota state workforce is currently 50.5,compared to 45.5 in 2000. This represents an increase inmedian age of five years over the last decade. If thistrend continues, in 2020, the median age of theMinnesota state workforce will be 55.5. Below is anexample of the current age trends in the state workforce.There are 51 agencies, boards, and commissions listed inthe table below. To be included in the table, agencies,boards and commissions needed to have 11 employees,
therefore, 27 agencies, boards, and commissions werefully redacted for data privacy reasons. Furthermore, if there was only one retiree per agency, their ages were
not listed due to data privacy.
The age distribution lines represent a clear picture of theages of Minnesota’s workforce by agency. There aresome agencies that do not have a high level of employees age 45 or above, while there are several thatwill be vulnerable to retirement trends during theupcoming years and need to build their employeepipeline with the hiring and development of new,unlimited hires. Of the 51 agencies, boards andcommissions listed below, 28 have an employee basewith a median age of 50 or higher.
Table H: Retirement and Age Profile by Agency
Agency
Ave age of retirement in
2010*
MedianAge in2010
Ages of EmployeesTns 20s 30s 40s 50s 60s 70+
Administration Dept 60.89 52
Administrative Hearings 65.50 55
Agriculture Dept 62.86 50.5
Animal Health Board - 52
Arts Board - 49
Attorney General 61.38 49
Combative Sports Commission * 31.5
Commerce Dept 59.80 51
Corrections Dept 55.65 47
Emergency Medical Services Board - 41.5
Employ & Econ Development Dept 60.72 51
Explore Minnesota Tourism 64.00 54
Minnesota State Academies 63.80 50.5

8/6/2019 Workforce Report 2010
http://slidepdf.com/reader/full/workforce-report-2010 18/32
2010 Minnesota Workforce Report, 17
Agency
Ave age of retirement in
2010*
MedianAge in2010
Ages of EmployeesTns 20s 30s 40s 50s 60s 70+
Gambling Control Board * 52
Governor’s Office - 46
Health Department 61.15 49
Housing Finance Agency * 51
Human Rights Dept - 51
Human Services Dept 58.67 48
Investment Board - 49
Iron Range Resources - 51.5
Labor & Industry Dept 62.29 52
Lottery 60.56 50
Mediation Services - 56.5
Medical Practice Board - 45
Military Affairs Dept 61.36 42.5
Minnesota Management & Budget 58.25 50
MN Center for Arts Education * 51
Natural Resources Dept 60.43 50
Nursing Board - 48
Nursing Home Admin Board - 39
Office of Enterprise Tech 62.41 50
Office of Higher Education - 47
Ombudsman MH/DD - 45
Peace Officer’s Board (POST) - 51
Pharmacy Board * 50
8/6/2019 Workforce Report 2010
http://slidepdf.com/reader/full/workforce-report-2010 19/32
2010 Minnesota Workforce Report, 18
Agency
Ave age of retirement in
2010*
MedianAge in2010
Ages of EmployeesTns 20s 30s 40s 50s 60s 70+
Pollution Control Agency * 45
Public Safety Dept 56.72 50
Public Utilities Commission * 54
Racing Commission - 51
Revenue Dept 61.08 44
Secretary of State 61.67 50
Social Work Board - 44.5
State Auditor * 37
Transportation Dept 61.47 49.5
Veterans Affairs Dept 62.63 46
Water & Soil Board - 43.5
Worker’s Comp Court of Appeals - 60
Zoological Board - 37
TOTAL AGENCIES IN 2010 61.30 50.50
- No retirement in fiscal year 2010,* Information redacted due to data privacy

8/6/2019 Workforce Report 2010
http://slidepdf.com/reader/full/workforce-report-2010 20/32
2010 Minnesota Workforce Report, 19
Retirement
Minnesota state government employee retirement trendsof the previous five years reflect the nation’s economicchallenges. Upcoming patterns are difficult to assessbecause of sporadic patterns. There was a significantdrop of approximately 14 percent in fiscal year 2009 and
a significant increase in 2010 of over 16 percent. Over64 percent of retirements in the past year occurred in thefour largest agencies: Corrections, Human Services,Transportation, and Natural Resources.
The actual number of upcoming retirees is difficult toproject at this time because of sporadic trend patterns. Itis expected that there are people who wanted to retire,but have held onto their jobs during the past two yearsbecause of economic recession. The state of Minnesota
is projecting an increase in retirement for the nextseveral years. Potential events that precipitate retirementare numerous and may include the addition of earlyretirement incentive (ERI), restoration of retirementportfolios, legislative changes, workplace andprogramming change, and personal readiness.
Table I: Total Retirements by Year
2006 2007 2008 2009 2010
831 887 891 767 892+6.7% +.45 -14.14% +16.29%

8/6/2019 Workforce Report 2010
http://slidepdf.com/reader/full/workforce-report-2010 21/32
2010 Minnesota Workforce Report, 20
Average Age of Retirement has Increased
The chart and table below represent the increase in theaverage age of retirement over the last 10 years. Theaverage age of retirement within the Executive Branchhas increased by 1.84 percent in the last 10 years. It isexpected that the average age of retirement will continueto increase. One factor that may influence the continuedincrease is the age at which a person can accrue fullbenefits continues to change. Currently, to be eligible fornormal retirement benefits, an employee must haveworked with the state until the age of 65 or 66,depending upon his or her current
age. An employee can also meet Rule of 90 if hiredbefore June 30, 1989.
An early retirement incentive (ERI) was authorized bythe legislature for certain retirement-eligible employeeswho have 15 years of service. This ERI may haveimpacted the average age of retirement, as well as the
number of retirees for fiscal years 2010 and 2011. Moreinformation on retirement eligibility can be found in theMinnesota State Retirement System Handbook athttp://www.msrs.state.mn.us/pdf/hbgerp09.pdf .
Chart 6: Average Age of Retirement
Table J: Average Age of Retirement (supporting table)
Fiscal Year 2001 2002 2003 2004 2005 2006 2007 2008 2009 2010
AverageAge
60.19 60.13 60.27 60.81 60.43 61.10 60.88 60.99 60.94 61.30
Percentage -.1% +.23% +.89% -.62% +1.11% -.36% +.18% -.1% +.59%
8/6/2019 Workforce Report 2010
http://slidepdf.com/reader/full/workforce-report-2010 22/32
2010 Minnesota Workforce Report, 21
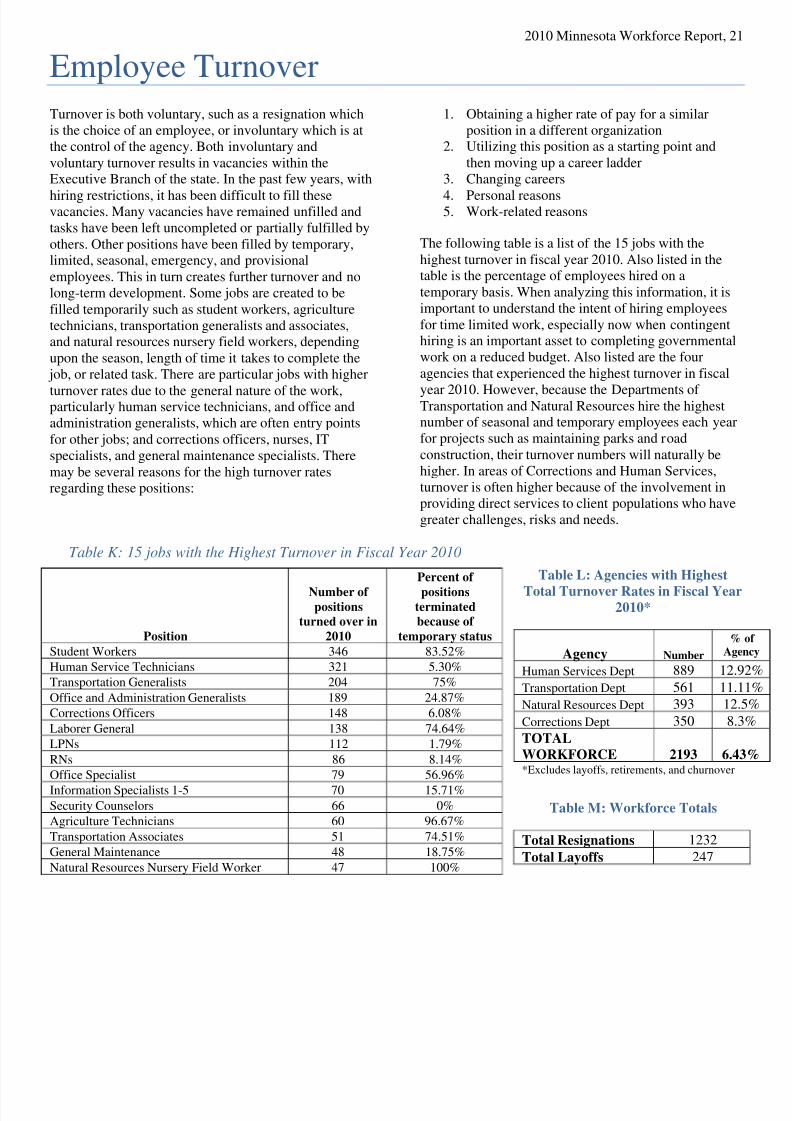
Employee Turnover
Turnover is both voluntary, such as a resignation whichis the choice of an employee, or involuntary which is atthe control of the agency. Both involuntary andvoluntary turnover results in vacancies within theExecutive Branch of the state. In the past few years, with
hiring restrictions, it has been difficult to fill thesevacancies. Many vacancies have remained unfilled andtasks have been left uncompleted or partially fulfilled byothers. Other positions have been filled by temporary,limited, seasonal, emergency, and provisionalemployees. This in turn creates further turnover and nolong-term development. Some jobs are created to befilled temporarily such as student workers, agriculturetechnicians, transportation generalists and associates,and natural resources nursery field workers, dependingupon the season, length of time it takes to complete the job, or related task. There are particular jobs with higher
turnover rates due to the general nature of the work,particularly human service technicians, and office andadministration generalists, which are often entry pointsfor other jobs; and corrections officers, nurses, ITspecialists, and general maintenance specialists. Theremay be several reasons for the high turnover ratesregarding these positions:
1. Obtaining a higher rate of pay for a similarposition in a different organization
2. Utilizing this position as a starting point andthen moving up a career ladder
3. Changing careers
4. Personal reasons5. Work-related reasons
The following table is a list of the 15 jobs with thehighest turnover in fiscal year 2010. Also listed in thetable is the percentage of employees hired on atemporary basis. When analyzing this information, it isimportant to understand the intent of hiring employeesfor time limited work, especially now when contingenthiring is an important asset to completing governmentalwork on a reduced budget. Also listed are the fouragencies that experienced the highest turnover in fiscal
year 2010. However, because the Departments of Transportation and Natural Resources hire the highestnumber of seasonal and temporary employees each yearfor projects such as maintaining parks and roadconstruction, their turnover numbers will naturally behigher. In areas of Corrections and Human Services,turnover is often higher because of the involvement inproviding direct services to client populations who havegreater challenges, risks and needs.
Table K: 15 jobs with the Highest Turnover in Fiscal Year 2010
Position
Number of positions
turned over in
2010
Percent of
positionsterminated
because of
temporary status
Student Workers 346 83.52%
Human Service Technicians 321 5.30%
Transportation Generalists 204 75%
Office and Administration Generalists 189 24.87%
Corrections Officers 148 6.08%
Laborer General 138 74.64%
LPNs 112 1.79%
RNs 86 8.14%
Office Specialist 79 56.96%
Information Specialists 1-5 70 15.71%Security Counselors 66 0%
Agriculture Technicians 60 96.67%
Transportation Associates 51 74.51%
General Maintenance 48 18.75%
Natural Resources Nursery Field Worker 47 100%
Table L: Agencies with Highest
Total Turnover Rates in Fiscal Year2010*
Agency Number
%Age
Human Services Dept 889 12.9
Transportation Dept 561 11.1
Natural Resources Dept 393 12.
Corrections Dept 350 8.3
TOTAL
WORKFORCE 2193 6.43*Excludes layoffs, retirements, and churnover
Table M: Workforce Totals
Total Resignations 1232
Total Layoffs 247

8/6/2019 Workforce Report 2010
http://slidepdf.com/reader/full/workforce-report-2010 23/32
2010 Minnesota Workforce Report, 22
Employee Retention
Employees who enter Minnesota state employment stayfor an average of 12.85 years. In looking at each of thelast five years, new employee retention time decreasedbetween fiscal years 2006 to 2009. Retention increasedfrom fiscal years 2009 to 2010. The increase in retention
time during the past year is likely due to a generaldecrease in job openings in state agencies. Retention isnearly at the same level it was five years ago. Minnesotaagencies are implementing several strategies that focuson meeting the needs of the state while increasingemployee retention. These strategies include:
1. Increasing telecommuting opportunities andflexible work schedules
2. Increasing the use of a contingent workforce inappropriate jobs
3. Adding pro-appointments, where retirees returnby invitation for a period of time on acontractual basis to provide expertise
4. Developing relationships with external partners,including community based organizations andhigher education to help identify and developpotential state employees
5. Promotion of internship, apprenticeship andtraining opportunities
6. Enhancing state employee learning anddevelopment opportunities to increase skills thatpromote adaptability and career flexibility
Table N: Years of Service – Fiscal Years 2006-2010
Fiscal Year Average years of service2006 13.00
2007 12.83 (-1.33%)
2008 12.79 (-.31%)2009 12.68 (-.87%)
2010 12.92 (+1.86%)

8/6/2019 Workforce Report 2010
http://slidepdf.com/reader/full/workforce-report-2010 24/32
2010 Minnesota Workforce Report, 23
New Hires
Minnesota state government hired fewer new employeesin fiscal year 2010 than at any time in the past 10 years.In fact, there was over a 17 percent reduction in newhires in fiscal year 2010. Agencies are generally notcreating new positions or not refilling positions after a
vacancy. There have been hiring restrictions since 2008requesting agencies only fill positions that are critical totheir ongoing processes. This has been important inreducing salary burdens to the government. However,this has impacted the workforce as well in several ways.Typically the state hires unlimited employees for reasonsincluding transferring knowledge from experienced staff to new staff, building skills, adding innovation andcreativity in the workforce, and pinpointing talent for
future leadership roles. There has been a reduction inhiring full-time, unlimited employees during fiscal year2010. This year 26 percent of new hires were on a full-time, unlimited status. In fiscal year 2009, there were 29percent, and in fiscal year 2008, 32 percent of new hires
were acquired on a full-time, unlimited status. As aresult, the increasing age of the general workforce willcontinue to generate issues with loss of talent withoutthe transfer of knowledge.
When new employees are not hired or there is anoverreliance on a contingent staff, the long-termdevelopment process does not happen. The expectedupswing in retirement will leave many agency programswithout needed skills and talents.
Chart 7: New Hires by Year
Table O: New Hires by Year (supporting table)
Fiscal
Year
2001 2002 2003 2004 2005 2006 2007 2008 2009 2010
NewHires
6345 5165 3962 4550 4788 5515 5676 5192 4586 3793
Change -18.6% -42.65% +14.84% +5.23% +15.18% +2.92% -8.53% -11.67% -17.29%

8/6/2019 Workforce Report 2010
http://slidepdf.com/reader/full/workforce-report-2010 25/32
2010 Minnesota Workforce Report, 24
Chart 8: New Hires with Full-Time, Unlimited Status Chart 9: New Hires with Part-Time or Contingen
Status
Of the new employees that joined the workforce duringfiscal year 2010, almost 55 percent took positions in oneof the 15 jobs listed on the table below. More than 10percent of the new state employees are listed as studentworkers. The table below also demonstrates that many
new employees are hired on a contingent basis. Theymay complete road work, snow and ice removal, statepark assistance and/or maintenance, clerical work,
custodial work, or assistance to professional jobs,depending on the season of the year or type of work needed. Some of these jobs last for a few weeks, whileothers last as long as a season or as long as a schoolyear. This list corresponds closely with the turnover list
previously addressed. Many of these individuals arerehired annually for same or similar positions.
Table P: Jobs of New Hires
Job
Number of
new hires in
fiscal year2010
Percentage hired
on an unlimited or
trainee status
Student Workers (Paraprofessional, Maintenance,
Custodial, Clerical) 407 2.0%Human Services Technician 229 86.28%
Transportation Generalist and Senior 205 10.9%
Natural Resources Nursery Field Worker 179 0%
Laborer - General 163 0%
Corrections Officer Trainee & 2 113 90.38%
Office Specialist 106 0%
Revenue Tax Specialist, Principal & Senior 102 98.9%
Information Technology Specialist 1-5 86 45.35%
Unemployment Insurance Operations Analyst 83 0%
Revenue Collections Officer 1 & 2 76 98.5%
Licensed Practical Nurse 1 & 2 74 93.24%
Natural Resources Worker 68 0%
Transportation Associate 64 18.75%Agricultural Technician 63 0%
Total of these positions 2077

8/6/2019 Workforce Report 2010
http://slidepdf.com/reader/full/workforce-report-2010 26/32
2010 Minnesota Workforce Report, 25
Agencies that did the Most Hiring in 2010
Approximately half of the state’s new hires from fiscalyear 2010 were employed by four agencies. These arefour of the six largest agencies in the state. TheTransportation and Natural Resources Departments hirethe most contingent employees based on their types of work projects. Other agencies often face
new hiring demands that correspond with recent federalor state funded initiatives that must be completed withinspecific time parameters, or sudden changes in theeconomy that generate increased demands for stateservices provided by agencies.
Table Q: Agencies with Highest Number of New Hires
Agency Number of
New HiresTransportation Dept 637
Human Services Dept 488
Natural Resources Dept 461
Employ & Econ Development Dept 297
Total of these four agencies 1883
New Hire Profile
The following table is the profile of the state’s new hiresin fiscal year 2010. Almost 67 percent are full-time andover half are female. Less than 40 percent of newemployees are hired on an unlimited or permanentstatus. The average salary for a new, full-time employeeis $36,108. The median age of all new hires is much
younger than just the median age of unlimited orpermanent new hires. Many contingently hiredemployees participate in jobs during school breaks or aspart of their school year, which is likely one reason forthe decrease in age.
Table R: New Hire Profile
Ethnic minority 8.3%Female 51.62%
Disability 2.64%Special disabled veteran .05%
Veteran 7.43%
Full-time 66.57%
Unlimited (permanent) status 37.88%Full-time, unlimited 26%
Age 40 or older 40.65%
Median age of all new hires 35Median age of unlimited, full-timehires
42
Average yearly compensation ratefor new full-time hires
$36,108

8/6/2019 Workforce Report 2010
http://slidepdf.com/reader/full/workforce-report-2010 27/32
2010 Minnesota Workforce Report, 26
Age distribution of full-time new hires in 2010
When looking at all full-time new hires, the largestproportion of employees is between the ages of 20 and24. It is approximately 20 percent. Data showed thatover 71 percent of 20 to 24 year olds were hired on a
contingent basis.
When looking specifically at full-time, unlimitedemployees, the largest group of new hires in fiscal year2010 is in the 25 to 29 year age category.
Chart 10: New Hires
Table S: Age Distribution of New Hires in 2010 (supporting table)
Age of all newhires in 2010 Percentage
16-19 4.39%
20-24 19.1%
25-29 15.73%30-34 10.13%
35-39 8.3%
40-44 9.23%
45-49 8.78%
50-54 8.67%
55-59 7.24%
60-64 5.01%
65-69 2.26%
70+ 1.16%

8/6/2019 Workforce Report 2010
http://slidepdf.com/reader/full/workforce-report-2010 28/32
2010 Minnesota Workforce Report, 27
New Hires and Churnover
Overall, the amount of external hiring has declinedduring the past five years. The amount of internal hiringor what Minnesota employees refer to as “churnover”has also decreased. The gap between hiring external andinternal employees closed during fiscal years 2006 to2009. During these years, the closure in that gapdemonstrated an increase in hiring internal candidates tofill open positions which assists in retaining anddeveloping current employees. However the gap openedagain in 2010 by over seven percent. The question is,“why?” Possible explanations include:
1. A large percentage of open positions were of atemporary, emergency, limited, seasonal, orprovisional. Most permanently hired staff wouldnot change into a contingent position.
2. Skills gaps. Jobs change over time and mayrequire a change in skill. Furthermore, a specific
skill may not have been transferred from a
previous employee to an internal employee. Anexternal candidate may have been morequalified than an internal candidate.
3. Lack of advancement. A specific position mayhave been a demotion or lateral move for analready employed, interested candidate.
When considering both intra- and inter-agencytransition, the amount of internal promotions hasdecreased in the past five years; however transfers todifferent positions and movement from temporary tounlimited positions has increased. When analyzing theinformation noted below, it is important to rememberthat MnSCU (Minnesota State Colleges andUniversities) information is not directly included,however, if an internal employee transitioned out of orinto a MnSCU position from a different state agencythrough transfer, promotion, or movement, their
information is counted. Demotion activity is not reportedin this count.
Chart 11: Internal and External Hires
Table T: Internal and External Hires (supporting table)
New Hire Promotion Transfer Movement Total
2006 5515 – 59.45% 2413 – 26.01% 467 – 5.03% 881 – 9.50% 9276
2007 5676 - 57.5% 2464 - 24.96% 558 – 5.65% 1173 - 11.88% 9871
2008 5192 - 56.34% 2326 - 25.24% 560 – 6.07% 1137 - 12.33% 9215
2009 4586 - 55.12% 2060 - 24.76% 504 – 6.06% 1170 - 14.06% 8320
2010 3793 – 58.77% 1645 - 25.49% 427 – 6.62% 589 – 9.13% 6454

8/6/2019 Workforce Report 2010
http://slidepdf.com/reader/full/workforce-report-2010 29/32
2010 Minnesota Workforce Report, 28
A Glance at Compensation
Table U: Total Compensation 2006-2010
Fiscal
Year
Total Compensation
2006 $1,984,244,016
2007 $2,065,562,238 (+4.10%)2008 $2,215,924,110 (+7.28%)
2009 $2,323,172,602 (+4.84%)2010 $2,347,034,216 (+1.03%)
Source: IA Warehouse-Executive Branch Payroll Expenditures
Total compensation, which includes the employer’s costfor salary, overtime, pay differentials, health insurance,retirement, and FICA, has increased in the past fiveyears on an annual basis. These increases have occurredbecause of general salary increases that were grantedfrom fiscal years 2006 to 2009, the legislatively
mandated increases in employer and employeeretirement contributions from fiscal years 2007 to 2010and the rising cost of employer-paid health insurancebenefits over the entire five year period. Please note thatthe increase in overall compensation has significantly
dropped from fiscal years 2009 to 2010 compared toprevious years. This is due to there being no generalsalary increases and no step progression increases givento employees in fiscal year 2010.
To learn more about agency-specific salaries, benefits,
and retirement expenditures, visit the Executive BranchTotal Compensation Report athttp://www.mmb.state.mn.us/doc/comp/tc/tc-rpt.pdf
.
Table V: Overtime in Hours and Dollar Amount
Year Overtime Hours Used Total Overtime Paid
2006 1,182,218 $38,198,465
2007 1,277,051 (+8.02%) $42,725,972 (+11.85%)
2008 1,298,148 (+1.65%) $45,420,304 (+6.30%)2009 1,197,922 (-7.72%) $44,453,026 (-2.13%)
2010 1,122,628 (-6.28%) $42,172,149 (-5.13%)
Source: IA Warehouse
Both the number of overtime hours and theovertime compensation have decreased in thelast two years. The state of Minnesota has
aggressively managed its use of overtimeduring this period. However, eliminatingovertime altogether is not possible. Overtimeis used to complete important projects andprovide essential services. Some examples ofovertime uses include completing roadwaysbefore the end of the construction season,providing safety and assistance in naturaldisasters, coverage during unexpectedabsences in prisons and health care facilities,maintaining the performance and security of the state’s many and varied information
systems, and keeping the community safe ona daily basis. Agencies are constantlyworking to find ways to contain costs,especially in this time of diminishingbudgets, and so it is noteworthy that thenumber of overtime hours utilized hasdeclined by 13.5 percent in the past twofiscal years.

8/6/2019 Workforce Report 2010
http://slidepdf.com/reader/full/workforce-report-2010 30/32
2010 Minnesota Workforce Report, 29
Bargaining Unit Information
Chart 12: 2010 Union Representation
Table W: Who is Represented in the Union?
Employment
Status
Percentage of
employees
representedFull-time employees 90.99%Part-time employees 88.13%
Unlimited employees 91.03%Contingent (limited,emergency, seasonal,
temporary, provisional)employees
67.7%
Trainees 55.56%
Almost all of the state’s employees are represented by aunion. More specifically, close to 89 percent of theworkforce is represented by the American Federation of State, County, and Municipal Employees (AFCSME),the Middle Management Association (MMA),Minnesota Association of Professional Employees(MAPE), Minnesota Government Engineers Council,Minnesota Law Enforcement Association, MinnesotaNurses Association, Residential Schools Educators, orHealth Treatment Professionals. Approximately 11percent of the workforce is not represented by a union.These individuals include but are not limited to specifiedmanagers and executives and employees withinsufficient work time.

8/6/2019 Workforce Report 2010
http://slidepdf.com/reader/full/workforce-report-2010 31/32
2010 Minnesota Workforce Report, 30
Minnesota’s Workforce at Work
A Recent Story of How State Employees Made a Difference…
On September 23, 2010, a state of emergency was issuedafter two days of “extreme” rainfall. The tremendous
amount of rain caused strain on sewer systems, roadwash outs, and flooding in homes, apartments, buildingsand field crops. Severe living and traveling difficultiesexisted for residents in the southern portion of Minnesota and surrounding areas. The emergency ordertriggered an immediate response from several stateagencies to ensure the safety of Minnesota’s citizens.
Many agencies work together to respond to disasters andassist citizens during crisis events. While this reportdoes not list all of them, below are some examples of how Minnesota’s government workforce brought their
expertise and experience together to provide service andsupport to Minnesota’s citizens.
• Department of Military Affairs: The MinnesotaNational Guard supported communities, officials,and coordinators by assisting with traffic, controlpoints, security and other activities around theSouthern Minnesota area.
• Department of Public Safety: When the state of emergency was issued, Department of Public Safety-Department of Homeland Security and EmergencyManagement immediately responded by facilitating
the coordination of disaster relief with FEMA, TheNational Guard, American Red Cross, variouscommunity officials and employees, communitymembers, businesses, and volunteers. In addition,troopers assisted with traffic control and detourroutes for the next several days.
• Department of Education: The Department of Education has collected flood damage estimatesfrom school districts, has informed the districts of available grants, and continues long-term assistanceto Minnesota districts impacted by the flood.
• Department of Human Services: DHS monitored
the needs of deaf and hard of hearing individuals inthe flooded area. They also monitored the needs of individuals in state-run facilities.
• Pollution Control Agency: MPCA worked withwastewater facility owners to get resumption of normal treatment; with city officials to removechemical containers and propane tanks; and withhousehold hazardous waste programs to organize
collection events. They managed the packing,transporting, and disposing of collected waste.
• Department of Transportation: MnDOT quicklyidentified which roads were closed, which onestravelers should not drive on, and which ones hadlevees and/or damage. One news story stated that awedding couple directed all of their guests to theMnDOT website to find the best detoured and safestroutes so their guests could still attend their specialevent. MnDOT also participates in resolving manyof the long-term damage of flooding to roads andbridges.
• Department of Commerce: The Department of Commerce provided helpful information to low-
income flood victims on how to receiveWeatherization and Energy Assistance from theirOffice of Energy Security.
• Department of Natural Resources: DNR identifiedstate lands, parks, trails, and facilities that needed tobe closed until the water receded. Flooding causeddamage to a trail bridge making it unsafe andirreparable. The removal process was startedimmediately. They issued warnings due to thedanger of the high levels of water in combinationwith fall debris from trees and hunting, which theycommunicated through their website. DNR kept
enforcement officers assigned and standing bythroughout the entire situation.
• Department of Corrections: DOC facilitatedSentence to Service work crews to do flood clean up
• Department of Agriculture: The Department of Agriculture advised farmers with crops on how toevaluate their flooding situations thoroughly, andprovided updated website assistance.
• Department of Health: MDH provided informationregarding environmental health. They providedtesting kits to private well owners in the flood areato assess their drinking water situations. MDH also
worked to address behavioral health by mobilizingstrike teams to meet recovery phase needs. Generalinformation regarding health and safety wasprovided on their website for people experiencingflood. They also provided compliance monitoringfor care facilities and worked with other facilities onrelocations as needed.

8/6/2019 Workforce Report 2010
http://slidepdf.com/reader/full/workforce-report-2010 32/32
2010 Minnesota Workforce Report, 31
Minnesota Management and Budget400 Centennial Office Building
658 Cedar Street