Workforce equality and diversity report
60
Workforce equality and diversity report 2019/20
Transcript of Workforce equality and diversity report

Workforce equality and diversity report
2019/20


Workforce Equality and Diversity Report 2019/20 Page 3
TABLE OF CONTENTS
1. INTRODUCTION ................................................................................................................. 5
2. OUR STRATEGIC PRIORITIES ........................................................................................ 7
Key findings ......................................................................................................................... 8
3. KEY ACHIEVEMENTS ..................................................................................................... 10
4. FUTURE ACTIONS AND PRIORITIES FOR 2020/21 .................................................... 12
5. WORKFORCE COMPOSITION ....................................................................................... 14
Workforce composition by ethnicity .................................................................................. 15 Workforce composition by age ......................................................................................... 16 Workforce composition by gender .................................................................................... 17 Trust Board of Directors composition by gender and ethnicity........................................ 17 Workforce composition by religious belief ........................................................................ 18 Workforce composition by sexual orientation .................................................................. 19 Workforce composition by disability ................................................................................. 19 Workforce Disability Equality Standard (WDES) ............................................................. 20 Disability, sexual orientation and religion data quality ..................................................... 20 Staff networks ................................................................................................................... 20
6. RECRUITMENT ................................................................................................................ 21
Recruitment for leadership diversity ................................................................................. 22 Recruitment by ethnicity ................................................................................................... 23 Recruitment by gender ..................................................................................................... 23 Recruitment by age, disability, sexual orientation and religion ....................................... 24
7. NON-MANDATORY TRAINING ....................................................................................... 26
8. PROMOTIONS AND LEAVERS ...................................................................................... 29
Promotions and leavers by ethnicity ................................................................................ 30 Promotions and leavers by gender .................................................................................. 30
9. PERFORMANCE DEVELOPMENT REVIEWS—NON-MEDICAL STAFF .................... 31
10. APPLICATION OF FORMAL EMPLOYEE RELATIONS PROCEDURES .................. 34
Disciplinary cases ............................................................................................................. 35 Sickness absence cases .................................................................................................. 37 Probationary cases ........................................................................................................... 38 Performance (capability) cases ........................................................................................ 39 Grievance cases (including bullying and harassment) .................................................... 40

Workforce Equality and Diversity Report 2019/20 Page 4
11. LOCAL CLINICAL EXCELLENCE AWARDS FOR CONSULTANTS ......................... 42
12. STAFF EXPERIENCE—2019 NHS STAFF SURVEY .................................................. 44
13. APPENDICES ................................................................................................................. 47
Appendix 1: Workforce Race Equality Standard (WRES) ........................................... 48 Appendix 2: Gender pay gap 2019/20 .......................................................................... 49 Appendix 3: Workforce Disability Equality Standard (WDES) Mar 2020 ..................... 50 Appendix 4: Improving Equality, Diversity and Inclusion Action Plan years 2–3 ........ 52

Workforce Equality and Diversity Report 2019/20 Page 5
SECTION 1
INTRODUCTION

Workforce Equality and Diversity Report 2019/20 Page 6
We are delighted to present our workforce equality report with details of the actions taken to address gaps in equality identified last year. This is one of our responsibilities under the Equality Act 2010 and supports the delivery of the general public sector equality duty (PSED).
At our Trust, we are committed to providing fair and inclusive services and employment which meet the diverse needs of our patients and staff. During the last year we have continued to focus on embedding equality, diversity and inclusion in everything we do.
COVID-19 shone a light on inequality and why equality, diversity and inclusion are crucial elements to address in all NHS organisations. Our staff have been challenged by the response to COVID-19 and many lessons were learned—these will form part of our year 2 and year 3 equality, diversity and inclusion plan. Over the next 2 years we want to foster a culture of inclusion and belonging and live our PROUD values which bring our EDI ambitions alive.
We cannot put patients first or be responsive to patients and staff if we don’t take into account their diverse needs. We need to be open and honest and have brave conversations about diversity and inclusion. We must be unfailingly kind in all of our interactions and determined to develop in this area.
We will not just embed equality—we will look at how we value people and how we can encourage others to value people, reflect, and improve our behaviours towards our people and our patients.
Our report includes:
• An outline of our vision at the Trust to be the employer of choice
• An overview of key achievements
• The profile of our workforce and key findings
• Future plans for 2020/21 based on our priority areas for action
We certainly have more work to do to ensure that we improve the experience of our people but we remain confident that the plans we have in place and the launch of the NHS People Plan—which has a clear focus on belonging in the NHS—means we will achieve our ambition to ensure all our staff have a great experience working at the Trust.
Our new Board Diversity and Inclusion Advisor role could not be timelier and assures the Trust’s resolve and determination to address recognised equality gaps. This will be achieved by implementing processes and promoting an inclusive and culturally sensitive organisational culture. Diversity is a fact in our Trust with 100 nations represented by our staff—but inclusion is a choice. This report and the EDI plan will map our journey to ensuring that inclusion is not a choice, but simply the way we work.
Thomas Simons Gubby Ayida Director of Human Resources and OD Board Diversity and Inclusion Advisor
18 Jun 2020

Workforce Equality and Diversity Report 2019/20 Page 7
SECTION 2
OUR STRATEGIC PRIORITIES

Workforce Equality and Diversity Report 2019/20 Page 8
The Trust has three strategic priorities:
• Deliver high-quality, patient-centred care
• Be the employer of choice
• Deliver better care at lower cost
Our staff also work to a strong set of PROUD values which are:
• Putting patients first
• Responsive to patients and staff
• Open and honest
• Unfailingly kind
• Determined to develop
The Trust is committed to promoting equality of opportunities for all its employees and believe individuals should be treated fairly in all aspects of their employment—including training, career development and promotion—regardless of their race, gender, disability or any other protected characteristic. We aim to create a culture that respects and values individual differences and that encourages individuals to develop and maximise their true potential.
Key findings
Our workforce remains broadly representative of the population we serve and the workforce data is similar to previous years. The data in the report covers financial year 2019/20 running 1 Apr 2019 to 31 Mar 2020.
46% BAME staff
75% female staff
2% declare a disability
3% of staff are bisexual, gay or
lesbian
100 nationalities
16% work part-time
Trust workforce

Workforce Equality and Diversity Report 2019/20 Page 9
• Our staff survey results highlight that, as a Trust, we score below average at 8.6 for equality, diversity and inclusion compared to other Trusts—the best Trust scored 9.4 and the average was 9.0.
• The staff survey highlighted that the percentage of staff experiencing bullying and harassment or abuse from patients or relatives reduced, teamworking and the quality of care improved, and the quality of appraisals was significantly higher than last year. Black, Asian and Minority Ethnic (BAME) staff were also more positive in believing that the Trust provides equal opportunities for career progression or promotion.
• There has been a continued increase in the number of BAME staff in post—an increase of 2% since last year—and BAME staff now represent 46% of our workforce which is the same percentage as our non-BAME staff.
• In Apr 2020 the Trust undertook an initiative to decrease the numbers of staff recorded under ethnicity as not stated, resulting in a 5% increase of staff declaring their ethnicity. This work will continue in 2020/21.
• BAME staff report a poorer experience than non-BAME staff—for example, non-BAME staff are 1.4x more likely to be shortlisted than BAME, and BAME staff are 2.4x more likely to enter into formal disciplinary processes than non-BAME staff, which is higher than the London average for acute trusts.
• The gender pay gap report highlighted that female employees earn an hourly mean average pay of 17.7% less than male employees.
• Only 2% of staff have declared a disability yet 11.5% stated in the confidential staff survey that they had a disability, highlighting significant under-reporting.

Workforce Equality and Diversity Report 2019/20 Page 10
SECTION 3
KEY ACHIEVEMENTS

Workforce Equality and Diversity Report 2019/20 Page 11
We are proud to have achieved the following as at Aug 2020:
• Launched an LGBTQ+ staff network sponsored by an executive board member and became a member of the Stonewall Diversity Champions programme.
• Commenced a Reciprocal Mentoring for Inclusion programme in partnership with NHS Elect to mentor executives and senior leaders by diverse, under-represented staff members from across the organisation.
• Joined the Timewise Accredited Partnership programme to develop and drive cultural change and introduce best practice flexible working into the organisation.
• Launched Diversity and Inclusion Champions into the Trust recruitment process for Band 8a and above roles and ensured our recruitment practices encourage and enable all staff to be successful.
• Positive progress against our Model Employer targets, with more of our BAME staff in leadership positions, 33% BAME staff on our new MBA Leadership programme and 45% BAME staff on MSc Leadership.
• Introduced a check and challenge process when investigation and disciplinary action are being considered, reducing the number of staff going through formal processes.
• Executive-led lived experience listening events focusing on career progression and recruitment.
• Maintained our Disability Confident status at level 2 and working towards Level 3.
• Achieved 100% compliance in completing individual staff risk assessments, prioritising ‘at risk’ staff, to ensure the physical and psychological safety of our people during COVID-19.

Workforce Equality and Diversity Report 2019/20 Page 12
SECTION 4
FUTURE ACTIONS AND PRIORITIES FOR 2020/21
Workforce Equality and Diversity Report 2019/20 Page 13
Our future actions and priorities for 2020/21 are to:
• Implement the Improving Equality, Diversity and Inclusion Action Plan years 2–3 and the Trust-level priorities identified in the NHS People Plan.
• Improve key metrics for WRES/WDES/gender pay gap and be among the best performing Trust nationally.
• Work collaboratively across North West London to prioritise a focus on equality, diversity and inclusion and put in place resources to make necessary changes.
Workforce Equality and Diversity Report 2019/20 Page 14
SECTION 5
WORKFORCE COMPOSITION

Workforce Equality and Diversity Report 2019/20 Page 15
At the end of financial year (FY) 2019/20, the Trust had 6,394 substantive staff, an increase of 214 (3.5%) compared to the end of FY 2018/19. This compares to a 5.3% increase from FY 2017/18 to 2018/19. The section provides a high-level summary of the workforce composition by protected characteristics.
Workforce composition by ethnicity
For the purposes of this report, the Trust has combined staff categories as non-BAME, BAME and ‘not stated’. The national electronic staff record does not give the option of ‘do not wish to declare’ for ethnicity so these are recorded by default as ‘not stated’.
The non-BAME category incorporates staff that identify as White British, White Irish and any other White background. BAME includes staff who identify as Asian (Indian, Pakistani, Bangladeshi), mixed (White and Black/Asian), Black (Caribbean, African) and other (Chinese and any other). This is in line with the Office of National Statistics census categories.
46% of our workforce (2,931 staff) identify as non-BAME compared to 46% (2,934 staff) as BAME. This compares with 48% and 44% respectively at the same point last year. 8% (529) of our staff are recorded as ‘not stated’, which is the same as the previous year.
The Trust employs an ethnically diverse workforce reflective of the population of London.
Trust diversity compared to London
Asian Black Mixed White British
White other
Other
Chelsea and Westminster 23% 13% 3% 33% 14% 14%
London (2020)1 19% 13% 5% 45% 15% 3%
BAME staff form the majority of staff in Agenda for Change (AfC) bands 2–5. Within the BAME staff group there have been increases 16% in AfC Band 5 and 125% in trainee medical grades compared to last year.
Non-BAME staff form the majority of staff from bands 6–VSM (very senior manager).
There have been no significant increases in non-BAME staff across staff groups, however medical career grades have shown reductions of 63 BAME and 60 non-BAME during 2019/20.
1 www.ethnicity-facts-figures.service.gov.uk/uk-population-by-ethnicity/national-and-regional-
populations/regional-ethnic-diversity/latest

Workforce Equality and Diversity Report 2019/20 Page 16
Pay grade distribution of non-BAME and BAME staff across staff groups
Workforce composition by age
Age profile by pay grade
314
344
18
6 779
465
228
67 25 9
4 1
191
139 18
0
2
189
197
179 41
9
539
443
180
64 28
22
7
282
184
175
23
57 56 32 120
78 43 12 4 2
3
2
26
39
50 5
0%
10%
20%
30%
40%
50%
60%
70%
80%
90%
100%
Not Stated
Non BAME
BAME
165
159
103
637
435
232
62
16 6
7
470
16
9
1
127
124
93
166
253
217
62 36
12
6
6
136
207 16
10
95
142
88
147 21
7
177
91
27
13 7
2
23
183
16 7
82 90 74
82
100 85 40 12
6 7
2 4 88
20 11
14 25
8
9
10
8 4 2
3 1
2
11 4 1
65 56 35
248
82
9 1
69
0%
10%
20%
30%
40%
50%
60%
70%
80%
90%
100%
65 and over
55 - 64
45 - 54
35 - 44
25-34
Under 25

Workforce Equality and Diversity Report 2019/20 Page 17
Age ranges of our workforce
Age range Workforce
<25 9%
25–34 38%
35–44 24%
45–54 20%
55–64 11%
65+ 2%
The 25–34 age range represents the single largest age group, accounting for 38% of the Trust workforce—an increase of 3% on the previous year. The 35–44 age range is the second-largest group at 24%. Staff aged 55 and over account for 13% of workforce.
Workforce composition by gender
Our workforce consists of 75% (4,818) female staff and 25% (1,576) male staff. In AfC bands 2–8D there are more females than males in each of the grades. At Band 9 the split is 50:50. In the medical grades, including consultant grade, there are more females than males. The very senior manager (VSM) grade2 is the only grade where the gender balance is in favour of males by 60% to 40%. This is an increase from 56% to 43% male/female last year.
Gender profile by band
Trust Board of Directors composition by gender and ethnicity
The Board of Directors comprises seven posts—the chief executive supported by six executive directors:
• Deputy Chief Executive and COO
• Medical Director and CCIO
• Chief Financial Officer
• Director of HR and OD
• Chief Nursing Officer
• Chief Information Officer
2 Across the NHS, 47% of very senior manager roles are held by women—see Gender in the NHS
425
438
315
1085
933
604
194
60 22 15 5 37 262
41
1
12
12
3
158
86 204
164
124
66 33 18 13 5 28 243
293
18
0%
20%
40%
60%
80%
100%
Male
Female

Workforce Equality and Diversity Report 2019/20 Page 18
At 31 Mar 2020, the gender balance at executive director level was 57% female and 43% male compared to the overall workforce profile of 75% female and 25% male.
Trust Board by gender
The ethnicity profile of the executive directors is 100% non-BAME with no BAME staff at this level within the organisation.
The Trust chair and seven non-executive directors complete the Trust Board. Of these, seven are male and one is female.
Five (63%) are non-BAME and three (37%) are BAME. BAME representation at non-executive director level within the organisation has increased by 13% in 2018/19 following more diverse recruitment channels.
Workforce composition by religious belief
In 2019/20, the majority of staff, who stated a religious belief, identify as Christian (43%), compared to 41% in 2018/19. Other religious groups have changed less than 1% since last year.
The percentage of staff recorded as unspecified, meaning no data is recorded on the electronic staff record (ESR) system is 18%, down from 21% the previous year.
Religious belief n° %
Atheism 616 10%
Buddhism 60 <1%
Christianity 2,740 43%
Hinduism 305 5%
Islam 412 6%
Jainism 16 <1%
Judaism 21 <1%
Sikhism 106 2%
Did not wish to disclose religion/belief 673 11%
Other 274 4%
Unspecified 1,171 18%
Total 6,394 100%
57%
43%
Female 4
Male 3

Workforce Equality and Diversity Report 2019/20 Page 19
Workforce composition by sexual orientation
In 2019/20, the majority of our staff (69%) identify as heterosexual, an increase of 3% from the previous year. Less than 3% of staff declare themselves as gay or lesbian and less than 1% as bisexual.
Declaration rates in other groups have changed by less than 1% from last year. The percentage in the undefined category is 18%, which has reduced from 21% last year.
Sexual Orientation Total %
Bisexual 37 <1%
Gay or lesbian 161 3%
Heterosexual or straight 4,403 69%
Not stated (person asked but declined to provide a response) 616 10%
Other sexual orientation not listed 3 <1%
Undecided 5 <1%
Undefined 1,169 18%
Total 6,394 100%
Workforce composition by disability
There are five possible responses that staff can give in this category—yes, no, prefer not to answer, not declared and unspecified.
In 2019/20, 123 staff (2%) have a disability declared on the Trust ESR system. 1,476 staff were in the ‘not declared’ and ‘unspecified’ categories. 170 staff did not declare if they had a disability and 16 staff preferred not to answer. There has been a 6% reduction in the ‘not declared’ and ‘unspecified’ categories since 2018/19.
The 2019 staff survey shows that 2,671 members of staff responded to the question “Do you have any physical or mental health conditions, disabilities or illnesses that have lasted or are expected to last for 12 months or more? Of these respondents 11.6% (309) members of staff stated that they had. This means 186 have not declared their disability on their staff records. However, due to all staff undertaking a risk assessment which asked staff to declare if they had a disability, this data is being reviewed to update ESR.
Workforce composition by disability
75%
3%
0%
20%
2%
No 4779
Not Declared 170
Prefer Not To Answer 16
Unspecified 1306
Yes 123

Workforce Equality and Diversity Report 2019/20 Page 20
Workforce Disability Equality Standard (WDES)
Every NHS organisation is required to submit 10 evidenced-based metrics and action plans to NHS England by 31 Aug 2020. The Trust’s WDES metrics and action plan can be found at www.chelwest.nhs.uk/equalityinfo.
Disability, sexual orientation and religion data quality
Trust data on sexual orientation and religion has increased by 3% since 2018/19 and data on disability has remained consistent. We highlight the importance of completing demographic data by encouraging staff to update their information on our ESR self-service system and by utilising robust data capture processes when new employees join the Trust.
We encourage staff who become disabled over the course of their employment to declare their disability and ensure that this is recorded on their ESR record.
Protected characteristic Known status for all staff
at 31 Mar 2019 Known status for all staff
at 31 Mar 2020
Disability 77% 77%
Sexual orientation 79% 82%
Religion 79% 82%
Staff networks
The Trust’s BAME, women’s and LGBTQ+ staff networks provide an important way for staff to have a voice within the organisation and provide opportunities to convey their experiences. They also evable staff to feel empowered to help shape workplace culture and the environment in which they work.
In 2020/21, the Trust will develop a disability staff network. The work of all the networks will be brought together and play a pivotal role as part of implementing the Improving Equality, Diversity and Inclusion Action Plan years 2–3. Network chairs participate in the Trust’s workforce development committee.

Workforce Equality and Diversity Report 2019/20 Page 21
SECTION 6
RECRUITMENT

Workforce Equality and Diversity Report 2019/20 Page 22
We are committed to delivering open, transparent recruitment processes that do not discriminate against people on the grounds of their protected characteristics. In support of this commitment, we monitor the progress of applicants throughout the selection process.
The Trust uses the NHS Jobs website as its main source for advertising internal and external vacancies and undertakes periodic overseas recruitment, primarily for nursing staff. Our recruitment management system is TRAC. We also utilise social media platforms including LinkedIn and Twitter and take part in events such as the London-wide virtual careers fair in autumn 2020.
Recruitment for leadership diversity
In Jan 2020, in conjunction with the BAME staff network, we launched the Diversity and Inclusion Champions programme, which was initially aimed at recruitment for AfC Band 8a and above. The diversity and inclusion champions are staff members from diverse backgrounds across the organisation who have received interview skills training to participate in these interview panels.
As at Aug 2020 the Trust has 28 trained diversity and inclusion champions and monthly training sessions are ongoing. We plan to extend the programme to recruitment for AfC Bands 6–7 and medical appointments during years 2–3 of our Improving Equality, Diversity and Inclusion Action Plan.
Projected numbers of BAME staff in post
2019 2020 2021 2022 2023
Band 8a 74 78 82 86 90
Band 8b 25 27 29 31 33
Band 8c 10 11 12 13 14
Band 8d 6 6 7 7 8
Band 9 2 2 3 3 3
VSM 5 6 7 8 9
BAME staff in post 2019
2019 ambition 2019 actual Gap
Band 8a 74 70 -4
Band 8b 25 20 -5
Band 8c 10 8 -2
Band 8d 6 4 -2
Ban 9 2 1 -1
VSM 5 2 -3
BAME staff in post 2020
2020 ambition 2020 actual Gap
Band 8a 78 71 -7
Band 8b 27 30 +3
Band 8c 11 14 +3
Band 8d 6 4 -2
Ban 9 2 4 +2
VSM 6 3 -3
Workforce Equality and Diversity Report 2019/20 Page 23
Recruitment by ethnicity
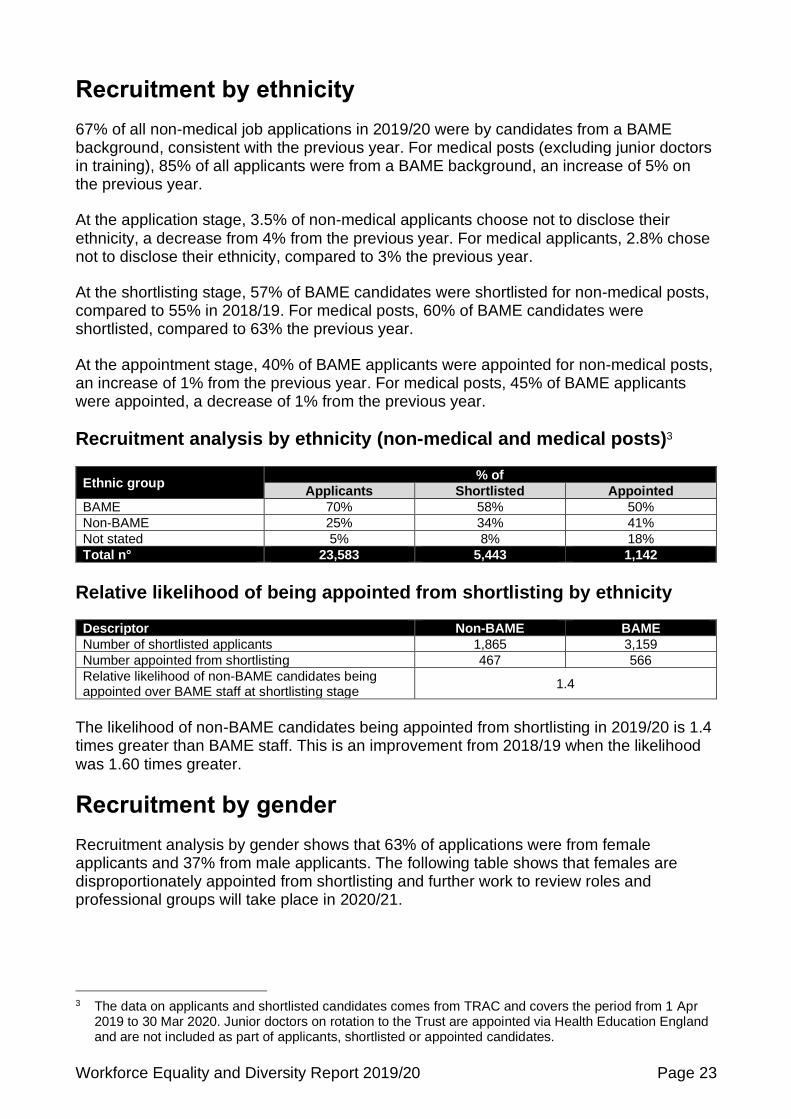
67% of all non-medical job applications in 2019/20 were by candidates from a BAME background, consistent with the previous year. For medical posts (excluding junior doctors in training), 85% of all applicants were from a BAME background, an increase of 5% on the previous year.
At the application stage, 3.5% of non-medical applicants choose not to disclose their ethnicity, a decrease from 4% from the previous year. For medical applicants, 2.8% chose not to disclose their ethnicity, compared to 3% the previous year.
At the shortlisting stage, 57% of BAME candidates were shortlisted for non-medical posts, compared to 55% in 2018/19. For medical posts, 60% of BAME candidates were shortlisted, compared to 63% the previous year.
At the appointment stage, 40% of BAME applicants were appointed for non-medical posts, an increase of 1% from the previous year. For medical posts, 45% of BAME applicants were appointed, a decrease of 1% from the previous year.
Recruitment analysis by ethnicity (non-medical and medical posts)3
Ethnic group % of
Applicants Shortlisted Appointed
BAME 70% 58% 50%
Non-BAME 25% 34% 41%
Not stated 5% 8% 18%
Total n° 23,583 5,443 1,142
Relative likelihood of being appointed from shortlisting by ethnicity
Descriptor Non-BAME BAME
Number of shortlisted applicants 1,865 3,159
Number appointed from shortlisting 467 566
Relative likelihood of non-BAME candidates being appointed over BAME staff at shortlisting stage
1.4
The likelihood of non-BAME candidates being appointed from shortlisting in 2019/20 is 1.4 times greater than BAME staff. This is an improvement from 2018/19 when the likelihood was 1.60 times greater.
Recruitment by gender
Recruitment analysis by gender shows that 63% of applications were from female applicants and 37% from male applicants. The following table shows that females are disproportionately appointed from shortlisting and further work to review roles and professional groups will take place in 2020/21.
3 The data on applicants and shortlisted candidates comes from TRAC and covers the period from 1 Apr
2019 to 30 Mar 2020. Junior doctors on rotation to the Trust are appointed via Health Education England and are not included as part of applicants, shortlisted or appointed candidates.

Workforce Equality and Diversity Report 2019/20 Page 24
Recruitment analysis by gender
Group % of
Applicants Shortlisted Appointed
Female 63% 71% 72%
Male 37% 29% 27%
Do not wish to disclose <1% <1% <1%
Total n° 23,583 5,443 1,142
Recruitment by age, disability, sexual orientation and religion
Analysis by age, disability, sexual orientation and religion shows the conversion rates from shortlisting to appointment are broadly in line with the breakdown of applicants and the Trust profile for age and disability.
• The 25–34 age group makes up the largest percentage of applicants and appointees
• 4% of appointees declared a disability, compared to 3% of applicants
• 87% of applicants identified as heterosexual
• 49% of applicants identified as Christian
Recruitment analysis by age
Group % of
Applicants Shortlisted Appointed
<25 16% 14% 17%
25-34 47% 46% 47%
35-44 21% 22% 19%
45-54 11% 13% 13%
55-64 4% 4% 3%
65+ <1% 1% <1%
Not stated <1% 0% 0%
Total n° 23,583 5,443 1,142
Recruitment analysis by disability
Group % of
Applicants Shortlisted Appointed
No 94% 90% 79%
Not stated 3% 6% 17%
Yes 3% 4% 4%
Total n° 23,583 5,443 1,142
Recruitment analysis by sexual orientation
Group % of
Applicants Shortlisted Appointed
Bisexual 1% 1% 1%
Gay 2% 2% 2%
Heterosexual 87% 88% 86%
Lesbian 1% 1% 1%
Not stated 9% 8% 10%
Total n° 23,583 5,443 1,142

Workforce Equality and Diversity Report 2019/20 Page 25
Recruitment analysis by religion
Group % of
Applicants Shortlisted Appointed
Atheism 9% 11% 10%
Buddhism 1% 5% 1%
Christianity 49% 47% 41%
Hinduism 7% 6% 13%
Not disclosed 13% 17% 9%
Islam 18% 11% 24%
Jainism <1% <1% <1%
Judaism <1% <1% <1%
Sikhism 2% 2% 1%
Total n° 23,583 5,443 1,142

Workforce Equality and Diversity Report 2019/20 Page 26
SECTION 7
NON-MANDATORY TRAINING

Workforce Equality and Diversity Report 2019/20 Page 27
The Trust offers development through a variety of methods—including eLearning, internal
courses and access to external courses—across a wide spectrum of topics from clinical
specialist courses to personal and management development. We have also increased our
use of the apprenticeship levy and offer a variety of programmes funded through that
scheme.
Note: A large proportion of our professional development training is provided by external
organisations from which we may not always receive participation rates.
The data below is based on substantive staff and leavers only during the 2019/20 financial
year, recorded within ESR on the continuous personal and professional development
(CPPD) database. An additional 51 non-substantive staff attended non-mandatory training
during this period but are not included in the statistics—for example bank, honorary or
secondee staff.
We have seen a decrease in funding from Health Education England for the past 4 years.
Funding for 2019/20 was £197,000, down from £250,000 in 2018/19. Less funding
available for the CPPD budget remains challenging—however, development has been
targeted towards specific clinical areas of focus.
Staff attending non-mandatory training by ethnicity
Analysis of non-mandatory training shows that the relative likelihood of non-BAME staff accessing non-mandatory training compared to BAME staff is 0.9. The ratio was 1.1 in the previous year. This reflects that during the reporting period, proportionally more BAME staff have accessed non-mandatory training than non-BAME staff compared to the previous year.
Relative likelihood of accessing non-mandatory training by ethnicity
Descriptor Non-BAME BAME
Number of staff in organisation 2,931 2,934
Number of staff who have accessed non-mandatory training 515 577
Relative likelihood of non-BAME staff accessing non-mandatory training over BAME staff
0.9
49%
43%
8%
BAME
Non BAME
Undefined

Workforce Equality and Diversity Report 2019/20 Page 28
Staff attending non-mandatory training by gender
Female staff accounted for 78% of staff attending non-mandatory training, with males at 22%—the gender composition of the workforce is 75% and 25% male.
Staff attending non-mandatory training by disability
Disabled staff account for 2% of the overall number of staff accessing non-mandatory
training courses, which reflects the percentage of staff recorded on ESR as having
declared a disability.
78%
22%
Female
Male
2%
77%
21%
Yes
No
Unspecified
Workforce Equality and Diversity Report 2019/20 Page 29
SECTION 8
PROMOTIONS AND LEAVERS

Workforce Equality and Diversity Report 2019/20 Page 30
Promotions and leavers by ethnicity
During 2019/20, 51% of staff who received promotions were non-BAME and 43% were BAME. 49% of staff who left the Trust during the year were non-BAME and 40% were BAME.
Analysis of promotions and leavers by ethnicity
Group Promotions Leavers
BAME 43% 40%
Non-BAME 51% 49%
Not Stated 6% 11%
Promotions and leavers by gender
In 2019/20, 76% of staff who received promotions were female and 24% were male, closely mirroring the gender distribution of our workforce which is 75% female and 25% male. 71% of staff who left the Trust were female and 29% were male.
Analysis of promotions and leavers by gender
Group Promotions Leavers
Female 76% 71%
Male 24% 29%
2907
634
166
2967
773
197520
17022
0
500
1000
1500
2000
2500
3000
3500
Inpost Leavers Promotions
BME
Non-BAME
Not Stated
4828
1119
293
1565
45892
0
1000
2000
3000
4000
5000
6000
In Post Leavers Promotions
Female
Male

Workforce Equality and Diversity Report 2019/20 Page 31
SECTION 9
PERFORMANCE DEVELOPMENT REVIEWS—NON-MEDICAL STAFF

Workforce Equality and Diversity Report 2019/20 Page 32
During 2019/20, 3,356 performance development reviews (PDRs) were completed. This number excludes medical staff and those on maternity leave or career breaks.
PDRs by ethnicity
PDRs by gender
PDR outcomes by ethnicity
47.4%
45.7%
6.8%
BAME
Non BAME
Not Stated
79.1%
20.9%
Female
Male
81
411
1075
18 20 2
105
501
888
14 131253
155
5 30
200
400
600
800
1000
1200
Continuallyexceptional
ExceedExpectations
Good RequiresImprovement
Too new toaccess
Unacceptable
BAME
Non BAME
Not stated
Total PDRs BAME 1607 Non BAME 1521 Not stated 228 Total 3356
Total PDRs Female 2654 Male 701 Total 3356

Workforce Equality and Diversity Report 2019/20 Page 33
‘Good’ continues to be the most common PDR rating across the Trust, ‘Exceeds expectations’ second and ‘Continually exceptional’ the third most common.
Of the 2,118 staff in the ‘Good’ category, 51% were BAME staff and 42% were non-BAME, 9% in favour of BAME staff with an increase of 2% from 2018/19.
Of the 965 staff in the ‘Exceeded expectations’ category, 43% were BAME staff and 52% were non-BAME. The percentage for BAME staff has increased by 7% since last year and the percentage for non-BAME staff has decreased by 4%.
Of the 198 staff in the ‘Continually exceptional’ category, 41% were BAME staff and 53% were non-BAME, 12% in favour of non-BAME staff with an increase of 1% from 2018/19 and no change for non-BAME staff.
Of the 37 staff in the ‘Requires improvement’ category, 49% were BAME staff and 38% were non-BAME. This an increase of 7% for BAME staff and a reduction of 4% in non-BAME staff from 2018/19 but must be taken in the contact of the small numbers of staff involved.
Of the 2 staff in the ‘Unacceptable’ category, both were BAME staff.

Workforce Equality and Diversity Report 2019/20 Page 34
SECTION 10
APPLICATION OF FORMAL EMPLOYEE RELATIONS PROCEDURES

Workforce Equality and Diversity Report 2019/20 Page 35
During 2019/20 there were 327 formal employee relations cases compared to 451 cases in 2018/19. Employee relations cases are recorded in the following categories:
• Disciplinary
• Sickness absence
• Probation
• Performance (capability)
• Grievance including bullying and harassment
Employee relations cases
Case Type 2018/19 2019/20
Disciplinary 79 48
Sickness absence 265 215
Probation 55 39
Performance (capability) 20 8
Grievance including bullying and harassment 32 17
Total 451 327
The cases in the above categories are broken down by ethnicity, gender and age to give an indication of how these relate to the composition of the workforce.
Disciplinary cases
There were 48 disciplinary cases during 2019/20 compared to 79 cases in 2018/19. BAME staff accounted for 29 of these (60%) while representing 46% of the total workforce. Non BAME staff accounted for 12 of cases (25%) while representing 46% of the workforce. In Oct 2019 the Trust introduced a pre-formal disciplinary investigation checklist with the objective of reducing the overall numbers of cases and reducing the disproportionate impact on BAME staff.
As the overall number of cases has decreased, so has the percentage of BAME staff involved in disciplinary proceedings. This has fallen from 64% in 2018/19 to 60% in 2019/20, but remains higher than the percentage of BAME staff in the workforce.
Disciplinary cases by ethnicity4
4 ‘Undefined’ indicates that ethnicity data has not been recorded on the electronic staff record
15%
25%60%
Undefined
Non BAME
BAME
Total Cases: 48
BAME: 29 Non BAME: 12 Undefined: 7

Workforce Equality and Diversity Report 2019/20 Page 36
The relative likelihood of BAME staff entering the formal disciplinary procedure is 2.4x greater than for non-BAME staff. This is an improvement from 2.7x greater in 2018/19. The calculation does take into account the changes in the overall number of BAME and non-BAME staff within the organisation.
Likelihood of entering the formal disciplinary hearing by ethnicity
Descriptor Non-BAME BAME
Number of staff in organisation 2,931 2,934
Number of staff who have entered into disciplinary proceedings 12 29
Relative likelihood of BAME staff entering into disciplinary proceedings compared to non-BAME staff
2.4
Disciplinary cases by gender
Analysis of disciplinary cases by gender shows that females account for 58% of cases, an increase of 2% from the previous year. Cases involving male staff have decreased by 1% to 42% from the previous year. This remains disproportionate to the number of male staff and will be investigated as part of our ongoing review following the launch of our disciplinary checklist.
Disciplinary cases by age shows that the 25–34 age group is the single largest age group at 25% of cases. This age group represents 38% of the workforce.
Disciplinary cases by age
Female 58%
Male 42%
Total cases: 48
Female: 28Male: 20
2%
25%
23%21%
21%
8% Disciplinary Under 25
Disciplinary 25 - 34
Disciplinary 35 - 44
Disciplinary 45 - 54
Disciplinary 55 - 64
Disciplinary 65+
Total Cases: 48
<25 1 25–34 12 35–44 11 45–54 10 55–64 10 65+ 4

Workforce Equality and Diversity Report 2019/20 Page 37
Sickness absence cases
There were 215 sickness absence cases in 2019/20, compared to 265 in 2018/19.
Sickness cases by ethnicity
Sickness absence by ethnicity shows that BAME staff accounted for 49% of cases, which is an increase of 8% from 2018/19. Non-BAME staff accounted for 42% of cases, which is a 10% reduction from previous year.
The number of undefined, which indicates that ethnicity data has not been recorded on the electronic staff record, has increased by 2% from 2018/19.
Sickness cases by gender
In 2019/20, sickness absence cases by gender shows that females accounted for 84% of cases, an increase of 7% from 2018/19. Males accounted for 16% of cases.
In 2018/19 females accounted for 77% of sickness absence cases which was roughly in line with the workforce split of 75% female and 25% male.
49%
9%
42%
Sickness BAME
Sickness Undefined
Sickness Non BAME
84 %
16%
Sickness Female
Sickness Male
Total Cases: 215
BAME: 105 Non BAME: 91 Undefined: 19
Total Cases: 215
Female: 180 Male: 35

Workforce Equality and Diversity Report 2019/20 Page 38
Sickness cases by age
In 2019/20, sickness absence cases by age shows that the 45–54 age group make up the single largest group of cases at 25%. All categories remain consistent with the results in 2018/19.
Probationary cases
Probationary cases by ethnicity
There were 39 probationary cases in 2019/20, down from 55 in 2018/19. BAME staff accounted for the 67% of probationary cases, an increase of 5% from the previous year. 21% of probationary cases related to non-BAME staff who represent 46% of the Trust workforce.
The number of undefined, where the ethnicity data has not been recorded on the electronic staff record, has increased to 12% from 5% the previous year. The Trust is implementing a probation checklist similar to the disciplinary checklist to ensure a robust decision-making process.
3%
22%
23%25%
21%
6% Sickness Under 25
Sickness 25 - 34
Sickness 35 - 44
Sickness 45 - 54
Sickness 55 - 64
Sickness 65+
67%12%
21%
Probationary BAME
Probationary Undefined
Probationary Non BAME
Total Cases: 215
Under 25: 7 25 – 34: 47 35 – 44: 50 45 – 54: 54 55- 64: 45 65+ 12
Total Cases: 39
BAME: 26 Non BAME: 8 Undefined: 5

Workforce Equality and Diversity Report 2019/20 Page 39
Probationary cases by gender
Female staff accounted for 72% of probation cases,an increase from 65% in 2018/19. The percentage for males has decreased to 28% from 35% the previous year.
Probationary cases by age
Probation cases by age show that the 25–34 age range account for the majority of cases at 44% cases, which remains unchanged from last year. This age group is also the largest single age range, representing 38% of the workforce.
Performance (capability) cases
There were 8 performance cases in 2019/20 down from 20 the previous year.
Performance cases by ethnicity
72%
28%
Probationary Female
Probationary Male
23%
44%
10%
13%
10%
Probationary Under 25Probationary 25 - 34Probationary 35 - 44Probationary 45 - 54Probationary 55 - 64
25%
75%Performance Management Non BAME
Performance Management BAME
Total Cases: 39
Female: 28 Male: 11
Total Cases: 39
Under 25: 9 25 – 34: 17 35 – 44: 4 45 – 54: 5 55- 64: 4
Total Cases: 8
BAME: 6 Non BAME: 2

Workforce Equality and Diversity Report 2019/20 Page 40
BAME staff accounted for 75% of cases compared to 60% of cases in 2018/19, and increase of 15%, despite fewer cases overall. In line with the disciplinary checklist and probation checklist, a review of these cases will be undertaken as part of the actions in the EDI plan.
Performance cases by gender
Performance cases by gender shows that of the 8 cases, 7 (88%) involved female staff, an increase of 13% from 2018/19. 1 case (12%) involved male staff, a decrease of 13% from the previous year.
Performance cases by age
Performance cases by age show that the 45–54 age range account for 50% of cases, and increase of 30% from 2018/19. In the previous year the 55–64 age range accounted for the largest percentage of cases at 35%.
Grievance cases (including bullying and harassment)
Grievance cases (which include bullying and harassment) often involve multiple employees, including the individual submitting the complaint and the person who may be accused of inappropriate behaviour.
There were 17 cases in 2019/20 a reduction from 32 in 2018/19.
88%
12%
Performance Management Female
Performance Management Male
12.5%
12.5%
50%
25%
Performance Management 25 - 34
Performance Management 35 - 44
Performance Management 45 - 54
Performance Management 55 - 64
Total Cases: 8
Female: 7 Male: 1
Total Cases: 8 25 – 34: 1 35 – 44: 1 45 – 54: 4 55- 64: 2

Workforce Equality and Diversity Report 2019/20 Page 41
Grievance cases by ethnicity
12 of the grievance cases (70%) involved BAME staff, an increase from 41% in 2018/19. Non-BAME staff accounted for 3 cases (18%) a decrease from 50% the previous year. The percentage of undefined has increased to 12% in 2019/20 from 9% the previous year.
Grievance cases by gender
Female staff accounted for 76% of grievance cases, a 10% increase from 2018/19. Cases involving males staff decreased by 10% from the previous year.
12%
18%
70%Grievance / Bullying & Harrassment Undefined
Grievance / Bullying & Harrassment Non BAME
Grievance / Bullying & Harrassment BAME
76%
24%
Grievance / Bullying &Harrassment Female
Grievance / Bullying &Harrassment Male
Total Cases: 17
BAME: 12 Non BAME: 3 Undefined: 2
Total Cases: 17
Female: 13 Male: 4

Workforce Equality and Diversity Report 2019/20 Page 42
SECTION 11
LOCAL CLINICAL EXCELLENCE AWARDS FOR CONSULTANTS

Workforce Equality and Diversity Report 2019/20 Page 43
The 2019/20 local clinical excellence round was cancelled and in its place the Trust was asked to pay a one-off payment to all consultants who meet the eligibility criteria. 398 consultants met the criteria to receive the payment.
One off payment by ethnicity
Ethnic origin %
Non-BAME consultants 224 (56%)
BAME consultants 154 (39%)
Unknown 20 (5%)
Total 398
One off payment by gender
Gender %
Female 214 (54%)
Male 184 (46%)
Total 398

Workforce Equality and Diversity Report 2019/20 Page 44
SECTION 12
STAFF EXPERIENCE—2019 NHS STAFF SURVEY

Workforce Equality and Diversity Report 2019/20 Page 45
The 2019 staff survey results revealed some differences in experience when analysed by disability status, ethnicity, age and gender. The full results of the 2019 staff survey can be found at www.nhsstaffsurveyresults.com.
2019 staff survey by gender
Theme Female Male
Staff engagement 7.3 7.4
Bullying and harassment 7.5 7.7
Equality diversity and inclusion 8.5 8.8
Morale 6.1 6.0
Health and wellbeing 5.7 6.0
Immediate managers 7.0 6.9
Quality of appraisals 6.3 6.3
Safety culture 7.0 7.0
Disabled staff are the least likely group to report positive experiences across a range of indicators. Our disabled staff are significantly less engaged than our non-disabled staff and score less positively on the majority of factors. Staff in the age groups of 21–30 are also the least engaged and, interestingly, score the lowest in relation to health and wellbeing, whereas staff over 65 score the highest. BAME staff have a higher engagement score and are more positive than non-BAME staff across the majority of factors despite some of the WRES scores.
2019 staff survey by disability
Theme Disabled Non-disabled
Staff engagement 6.9 7.4
Bullying and harassment 6.7 7.6
Equality diversity and inclusion 8.2 8.6
Morale 5.7 6.1
Health and wellbeing 4.6 5.9
Immediate managers 6.9 6.9
Quality of appraisals 5.3 6.4
Safety culture 6.6 7.0
2019 staff survey themes by age
Theme 21–30 31–40 41–50 51–65 66+
Staff engagement 7.1 7.3 7.4 7.4 7.9
Bullying and harassment 7.3 7.6 7.6 7.6 8.6
Equality diversity and inclusion 8.6 8.5 8.5 8.6 9.4
Morale 5.8 6.0 6.0 6.2 7.1
Health and wellbeing 5.4 5.8 5.8 5.8 7.3
Immediate managers 7.1 7.1 6.9 6.7 7.1
Quality of appraisals 6.4 6.4 6.4 6.0 6.1
Safety culture 6.9 6.9 7.0 7.0 7.3

Workforce Equality and Diversity Report 2019/20 Page 46
2019 staff survey themes by ethnicity
Theme Non-BAME BAME
Staff engagement 7.2 7.5
Bullying and harassment 7.5 7.6
Equality diversity and inclusion 8.1 9.1
Morale 6.2 6.1
Health and wellbeing 5.7 5.8
Immediate managers 6.8 7.1
Quality of appraisals 5.6 7.0
Safety culture 6.9 7.1
NHS national staff survey questions mandated by the WRES
Under the Workforce Race Equality Standard (WRES), the Trust is required to publish the responses by ethnicity to specific NHS staff survey results as detailed below.
Question Ethnicity %
5. Percentage of staff experiencing bullying, harassment or abuse from patients or relatives
non-BAME 37%
BAME 37%
6. Percentage of staff experiencing bullying, harassment or abuse from staff
non-BAME 27%
BAME 28%
7. Percentage believing the Trust provides equal opportunities for career progression or promotion
non-BAME 87%
BAME 75%
8. Percentage of staff experiencing discrimination at work from managers or colleagues
non-BAME 7%
BAME 13%
Workforce Equality and Diversity Report 2019/20 Page 47
APPENDICES

Workforce Equality and Diversity Report 2019/20 Page 48
Appendix 1: Workforce Race Equality Standard (WRES)
The table below summarises the Trust’s annual WRES return which was submitted to the national WRES team in Aug 2020.
WRES indicator Ethnicity Headcount Explanatory notes
1. Workforce reporting
Non-BAME 2,931
At 31 Mar 2020 BAME 2,934
Unknown 529
2. Relative likelihood of staff being appointed from shortlisting across all posts
Non-BAME staff 1.4x more likely
Based on NHS Jobs and TRAC data captured during 2019/20
3. Relative likelihood of staff entering the formal disciplinary process
BAME staff 2.4x more likely
Based on 2019/20 cases
4. Relative likelihood of staff accessing non-mandatory training and continuing professional development
Non-BAME staff 0.9x more likely
Data should be read with caution, as not all non-mandatory training is captured through the current training databases across both sites
5. Percentage of staff experiencing bullying, harassment or abuse from patients or relatives
Non-BAME 37%
2019 staff survey
BAME 37%
6. Percentage of staff experiencing bullying, harassment or abuse from staff
Non-BAME 27%
BAME 28%
7. Percentage believing the Trust provides equal opportunities for career progression or promotion
Non-BAME 87%
BAME 75%
8. Percentage of staff experiencing discrimination at work from managers or colleagues
Non-BAME 7%
BAME 13%
9. Percentage difference between BAME Board voting membership and overall BAME workforce
BAME board members
19%
As at 31 Mar 2020 Overall BAME workforce
46%
Workforce Equality and Diversity Report 2019/20 Page 49
Appendix 2: Gender pay gap 2019/20
Gender pay reporting legislation requires employers with 250 or more employees to publish statutory calculations every year showing how large the pay gap is between their male and female employees.
The results must be published on both the employer's website and the government website gender-pay-gap.service.gov.uk. The requirements of the legislation are that employers must publish six calculations:
• Average gender pay gap as a mean average
• Average gender pay gap as a median average
• Average bonus gender pay gap as a mean average
• Average bonus gender pay gap as a median average
• Proportion of males receiving a bonus payment and proportion of females receiving a bonus payment
• Proportion of males and females when divided into four groups ordered from lowest to highest pay
The Trust’s full gender pay gap report is published at www.chelwest.nhs.uk/genderpaygap and highlights that female employees earn an hourly mean average pay of 17.7% less than men, and the actions the Trust is taking.

Workforce Equality and Diversity Report 2019/20 Page 50
Appendix 3: Workforce Disability Equality Standard (WDES) Mar 2020
Metric Description Notes
Metric 1
Percentage of staff in Agenda for Change (AfC) pay bands or medical and dental subgroups and very senior managers (VSM)—including executive board members—compared to the percentage of staff in the overall workforce
Data from ESR—123 staff have a disability recorded on ESR. Data identified by:
• Non-clinical or clinical
• Band or grade
Metric 2
Relative likelihood of disabled staff compared to non-disabled staff being appointed from shortlisting across all posts. This refers to both external and internal posts
A figure below 1 indicates that disabled staff are more likely than non-disabled staff to be appointed from shortlisting. Trust score is 1.1. Data comes from TRAC—207 applicants with disabilities shortlisted/38 appointed in 2019/20.
• Doesn’t take into account how many withdraw after shortlisting or attending interviews
• Trust holds Disability Confident Employer Level 2 status until Oct 2020
• Disability Confident Employer Level 2 info pack is available
Metric 3
Relative likelihood of disabled staff compared to non-disabled staff entering the formal capability process, as measured by entry into the formal capability procedure
A figure above 1 indicates that disabled staff are more likely than non-disabled staff to enter the formal capability process. Trust score is 2.2. Data from ESR 2018/19—13 cases where the employee had a disability recorded in ESR. Breakdown by case type:
• Sickness cases: 6
• Disciplinary cases: 0
• Grievance/bullying and harassment cases: 2
• Performance management cases: 1
• Probation cases: 4 The Trust on place Maintaining the Employment of People with Disabilities: Guidance for Line Managers
Metric 4a
Percentage of disabled staff compared to non-disabled staff experiencing harassment, bullying or abuse from:
• patients/service users, their relatives or other members of the public
• managers
• other colleagues
Four questions from staff survey combined—higher percentages are worse From patients/service users, their relatives or other members of the public:
• N° of respondents: 2,637
• Disabled: 42%
• Non-disabled: 36% From managers:
• N° of respondents: 2,627
• Disabled: 26%
• Non-disabled:14% From other colleagues:
• N° of respondents: 2,617
• Disabled: 30%
• Non-disabled: 20%

Workforce Equality and Diversity Report 2019/20 Page 51
Metric Description Notes
Metric 4b
Percentage of disabled staff compared to non-disabled staff saying that the last time they experienced harassment, bullying or abuse at work, they or a colleague reported it
• N° of respondents: 1,141
• Disabled: 48%
• Non-disabled: 52%
Metric 5
Percentage of disabled staff compared to non-disabled staff believing the Trust provides equal opportunities for career progression or promotion
Question from staff survey—higher percentages better
• N° of respondents: 1,808
• Disabled: 79%
• Non-disabled: 81%
Metric 6
Percentage of disabled staff compared to non-disabled staff saying that they have felt pressure from their manager to come to work, despite not feeling well enough to perform their duties
Question from staff survey—higher percentages worse
• N° of respondents: 1,524
• Disabled: 30%
• Non-disabled:23%
Metric 7
Percentage of disabled staff compared to non-disabled staff saying that they are satisfied with the extent to which their organisation values their work
Question from staff survey—higher percentages better
• N° of respondents: 2,651
• Disabled: 39%
• Non-disabled:55%
Metric 8
Percentage of disabled staff saying that their employer has made adequate adjustments to enable them to carry out their work
Question from staff survey—higher percentages better
• N° of respondents: 179
• Trust score: 74%
Metric 9a
Staff engagement score for disabled staff compared to non-disabled staff and the overall engagement score for the organisation
One of 10 staff survey themes scored from 0–10
• N° of respondents: 2,742
• Disabled: 6.9
• Non-disabled: 7.4
• Overall Trust score: 7.3
Metric 9b
Has your trust taken action to facilitate the voices of disabled staff in your organisation to be heard (yes or no)?
Yes—Trust had disabled staff start/finish a task group which helped produce the Maintaining the Employment of People with Disabilities: Guidance for Line Managers
Metric 10
Percentage difference between the organisation’s Board voting membership and its organisation’s overall workforce, disaggregated:
• By voting membership of Board
• By executive membership of Board
Make-up of Trust Board including non-executive directors by disability:
• Executive Board: 0%
• Overall workforce: 2%

Workforce Equality and Diversity Report 2019/20 Page 52
Appendix 4: Improving Equality, Diversity and Inclusion Action Plan years 2–3
The Trust’s year 1 race equality plan has been updated to reflect our priorities for the next 2 years of our 3-year plan. It focuses on a shift from our commitment to ensuring processes are in place to treat staff fairly, equally and free from discrimination, to ensuring all staff are provided with a positive working environment. Therefore, as well as embedding and reviewing the processes implemented in year 1, the plan focuses on creating a safe, inclusive work culture. This includes learning to listen more and understanding the lived experiences of our staff.
Our vision and success measures
• Leadership commitment at all levels for the equality, diversity and inclusion agenda
• Influential staff networks for BAME, LGBTQ+, Women and Disability operating and having a voice in the organisation
• Improving our key metrics for WRES/WDES/gender pay gap to be among the best performing Trusts nationally
• Significantly improving our staff survey results for EDI, harassment and bullying
Key actions Due date Intended impact/outcome Impact measure Owner
Objective 1: Continue to embed the Board’s and senior managers’ commitment to improving equality, diversity and inclusion
1. The Board and Executive Cabinet sign-up to, and sign-off, the Year 2 and 3 of the Action Plan and pledge commitment to delivery
End Q2 2020 Staff, are clear of the Board commitment to provide a fair, inclusive and non-discriminatory work environment
Staff experience Q9b, Q9c, Q9d Commitment is published
Board executive
2. All ward/ department managers and heads of services to be able to talk to their staff about the board commitment
End Q4 2020 Improve staff awareness of the commitment to be a fair and inclusive employer
Staff experience Q9b, Q9c, Q9d
Board executive
3. The Board, executive and senior managers participate in development and mandatory training on race equality, and compassionate and inclusive leadership annually
End Q4 each year
Increased awareness amongst senior staff of diversity, inclusion issues and changes in leadership behaviour where appropriate
Staff experience Q9b, Q9c, Q9d Evidence of training CQC well-led domain
Board executive
4. All senior and middle managers to have an objective to embed inclusion as part of the appraisal process
Q4 2020 The Board, executive cabinet and senior managers act as role models for equality and inclusion
Staff experience Q9c, Q9d Board executive

Workforce Equality and Diversity Report 2019/20 Page 53
Key actions Due date Intended impact/outcome Impact measure Owner
5. All executives and senior managers to participate in reciprocal mentoring for inclusion programme
Q2 2020
The executive and senior managers are mentored by a member of staff from an under-represented group to get a deep understanding about the lived experience of staff in the organisation. Create a safe environment to have uncomfortable conversations.
Staff experience Q9, Q9a, Q9d
Board executive
6. Share learning and celebration of staff participating in reciprocal mentoring scheme
Q4 2020 To determine benefits of reciprocal mentoring scheme and positive experiences
Staff experience Q9, Q9a, Q9d
Deputy director of people and OD
7. Ongoing communication programme to facilitate conversations about inclusivity and specific issues on race, LGBTQ+ and disability among senior managers
End Q4 2020 Increased awareness for managers of the BAME/LGBTQ+/Disability/Women’s staff experience
Staff survey Q9c, Q9d Director of HR
and OD
8. Trust people strategy to include the key equality, diversity and inclusion outcomes aligned to NWL tackling inequalities and creating inclusive cultures/workstreams
End Q4 2020
Staff and managers understand the work to be undertaken over the next 3–5 years and key measures for improvement over period agreed
Staff experience Q9a, Q9d, Q14 WRES/WDES/GPG
Director of HR and OD
Objective 2: Develop influential staff networks for BAME, LGBTQ+, Women and Disability
1. Develop regular feedback/listening events for staff attending the networks and undertake ‘look forward’ surveys to assess how the Trust can support staff using lessons learnt
End Q1 2020 and every
quarter
BAME staff share what they want from a BAME network and are involved in its creation
Staff experience Q9c, Q9d Network chairs
2. Ensure terms of reference and governance arrangements for the networks
End Q1 2020 and annual
review
Provides an opportunity for the Board and executive team to engage directly with BAME/LGBTQ+/Disabled/Women about their experience
EDI manager/ network chairs
3. Launch the Disability network End Q3 2020 Provides a voice for disabled staff in the organisation
Staff experience questions WDES score
EDI manager/ network chairs
4. Produce and develop calendar of significant events for BAME/LGBTQ+/Disabled/ Women staff communities
End Q4 every year
Improve staff experience through celebrating difference
Staff experience Q14 EDI manager/ network chairs

Workforce Equality and Diversity Report 2019/20 Page 54
Key actions Due date Intended impact/outcome Impact measure Owner
5. Develop a communication strategy for the staff networks
End Q2 2020 and every
quarter
Provides an opportunity for staff to directly influence Trust strategy
EDI manager/ network chairs/ communications staff engagement
lead
6. Establish resources (financial and time) required to support network officers to effectively carry out roles
Q2
Network officers support chair attending meetings, planning and undertaking network activities, producing network work plan and contributing to EDI plans
Improvement in impact and effectiveness of network and providing personal development opportunities for network officers
Director of HR and OD
7. Network chairs to produce an annual report to update the people and OD committee
Q1–Q4 all scheduled
dates
Communicate work and output from staff networks
Network chairs
8. Set meetings/agenda/reporting structures Q1–Q4 The network has a demonstrable impact on the culture of the Trust
EDI manager/ network chairs
9. Develop annual work plan with detailed action plan
Q1–Q4 Record and evidence work from network and enable visibility of work plan
EDI manager/ network chairs
and officers
10. Celebrate success of BAME/LGBTQ+/ Disabled/Women in the organisation
End Q2 2020 Increase awareness of all staff’s contribution to the Trust
Staff experience Q9, Q9a, Q9d
Objective 3: Ensure fairness in Trust disciplinary, grievance and performance management processes
1. Review the impact of the disciplinary checklist for BAME staff
End Q1 each year
Provides a transparent and structured approach to the disciplinary process and a reduction in the number of staff going through the disciplinary process
WRES indicator 3 Head of
employee relations
2. Articulate the lessons learned from the review of 79 disciplinary cases and implement changes in approach as required
End Q2 each year
Themes are understood and guide revisions in process
Staff survey Q15 Head of
employee relations
3. Identify and train interview experts from BAME backgrounds staff to support and participate in disciplinary panels contribute and participate in training events
End Q3 2020 A sustained reduction in actual or perceived discrimination against BAME staff
Staff survey Q12, Q13, Q15c WRES indicators 5, 6, 8
Head of employee relations

Workforce Equality and Diversity Report 2019/20 Page 55
Key actions Due date Intended impact/outcome Impact measure Owner
4. Undertake an analysis of the application of use of performance management processes across the Trust by site, staff group and protected characteristics
End Q3 2020 ‘Hot spots’ identified and provide focus for additional support and performance process minimises bias
WRES indicators 3, 7 WDES
Head of employee
relations/deputy director of people
and OD
5. Develop a process for “check and challenge” for the review of probationary “failures”
Q3 2020 Reduce the number of staff failing the probation process
Reduction in number of all staff and, particularly, BAME staff impacted
Head of employee relations
6. Introduce the resolution framework to approach employee relations issues informally
Q3 2020
Reduction in formal ER cases Reduction in BAME staff entering the formal disciplinary process ‘Supportive conversations’ handled through mediation Managers have increased cultural awareness
WRES indicators 3, 5 Staff survey questions Reduction in formal cases Staff experience
Deputy director of people and OD
Objective 4: Ensure fairness of recruitment processes and progression opportunities for under-represented staff
1. Embed new recruitment processes to make sure that they are fair and equitable throughout the pathway from JDs to post-interview processes with new guidance promoted
Q2 2020 Competency-based and non-discriminatory selection practices are used by the Trust
Staff survey Q14 WRES indicator 2
Head of resourcing/deputy director of people
and OD
2. Further roll-out of EDI champions from all protected characteristic to participate in panels bands 6–7
Q3 2020 To ensure check and challenge of potential biases within the interview process
Staff engagement score in staff survey
Head of resourcing/deputy director of people
and OD
3. Develop a process and associated guidance to ensure that unsuccessful internal candidates for band 8a roles initially and then Band 7 and above receive support when applying for roles and feedback and an associated personal/career development plan
End Q3 2020 Processes in place to track the career progression of BAME and other under-represented groups
WRES indicators 1, 2 Staff survey Q19f WDES indicator 2
Associate director of learning and
OD

Workforce Equality and Diversity Report 2019/20 Page 56
Key actions Due date Intended impact/outcome Impact measure Owner
4. Develop a consistent approach and process for providing ‘stretch’ opportunities for under-represented staff and BAME representation is included on senior leadership development selection panels
End Q2 2020
Opportunities are provided to BAME staff for professional, career development and increase in numbers of BAME staff applying and getting on leadership courses
Staff experience Q4, Q5, Q19f Formal monitoring and reporting to be included as part of evaluation process
Associate director of learning and
OD
Objective 5: Address the negative experience that BAME and other groups have of bullying and harassment
1. In partnership with staffside, networks and FTSU guardian, review and triangulate hard and soft intelligence regarding staff experience of bullying and harassment
End Q2 2020 Understand themes or areas of greater reporting of bullying and harassment
Staff survey Q14 WRES indicator 6 WDES indicator 4a
Deputy director of people and OD
2. Develop a comprehensive set of interventions to address the issues emerging from the review
Q3 2020 A sustained reduction in actual or perceived discrimination against BAME/disability
Staff survey Q12, Q13, Q15c WRES indicators 5, 6, 8
Deputy director of people and OD
3. Develop a zero tolerance to ‘racism’ reported by staff
End Q3 2020 Reduce impact of aggression from patients to all BAME staff
Staff experience Q4, Q5
Security manager/site
director of nursing
4. Hold 6-monthly focus groups with staff who have reported violence and aggression
Q4 2020
Provide support and identify root causes to find practical solutions to reduce incidents of violence and aggression and improve staff experience
WRES indicators 5, 6 Violence and
aggression lead
5. Annual report on violence and aggression experienced by staff
Q1 2021 Identify root causes to identify solutions to reduce violence and aggression from patients and staff on staff
WRES indicators 5, 6 Violence and
aggression lead
6. Develop and educate managers on how to support staff who have experienced racially motivated violence and aggression
Q4 2020 Improve support of staff who have experienced racial/homophobic/other abuse
Staff experience Q4, Q5 WRES indicator 5
Violence and aggression lead

Workforce Equality and Diversity Report 2019/20 Page 57
Key actions Due date Intended impact/outcome Impact measure Owner
Objective 6: Embed a culture of inclusion and compassion
1. Undertake deep dive into EDI metrics/ WRES/WDES/GPG
Q4 2021 Develop action to move the needle on cultural indicators
WRES indicators 5–8 WDES/GPG
Deputy director of people and OD
2. Identify leaders to support areas which may required to transform workplace cultures
Q4 2020 CW leaders who understand the causes of the distress of difficulties staff experience
WRES indicators 5–8 Deputy director of
people and OD
3. Raise awareness of responsibility of all managers for the culture of the organisation
Q4 2020 Leaders embody compassion in their leadership, and that means for behaviours
Staff Experience
Associate director of learning and
OD/deputy director of people
and OD
4. Identify areas of focus within the organisation, such as divisions and, where possible, departments/wards
Q4 2020 Target areas to focus support and cultural transformation work
WRES indicators 5–8 Deputy director of
people and OD
5. Buddy with NELF (organisation with improved WRES metrics)
Q3 2020 Shared replicable good practice models of improvement
WRES indicators 5–8 Deputy director of
people and OD
6. Communicate to the public the Trust zero tolerance of violence and aggression to our staff
Q3 2020 Reduce abuse and harassment from patients WRES indicators 5–8 Deputy director of
people and OD/chief nurse

Workforce Equality and Diversity Report 2019/20 Page 58
Key actions Due date Intended impact/outcome Impact measure Owner
Objective 7: Understand the impact of COVID-19 on specific staff groups and the underlying health inequalities to ensure all staff are kept safe and well at work
1. Ensure that all risks are mitigated for staff through individual risk assessments/ workplace assessments/access to health and well-being services by ensuring they are culturally sensitive.
Q3 2020
Ensure the health and wellbeing of those disproportionately impacted by COVID-19 Pro-active use of information from risk assessments about the health of our workforce to promote better health Culturally sensitive services Proportionate take up of counselling/EAP/psychological support services by BAME staff and men which are known to be under-represented
Staff survey Q11 Health and wellbeing
Director of HR
2. Understand lived experiences of specifically BAME staff adversely affected by COVID 19 pandemic working at the Trust
Q3 2020
Staff are able to have conversations about and participate and contribute to changes needed that they have personally experienced
Staff survey Q11 Health and wellbeing Specific survey—BAME network
BAME network chair/deputy
director of people and OD


369 Fulham RoadLondonSW10 9NH
Main Switchboard+44 (0)20 3315 8000
Websitewww.chelwest.nhs.uk
fb.com/chelwestfb.com/westmidhospital
@chelwestft@westmidhospital
@chelwestft