Workforce Assessment: The Future of NHTSA's Defects ... · PDF fileWorkforce Assessment: The...
88
Workforce Assessment The Future of NHTSA’s Defects Investigations
Transcript of Workforce Assessment: The Future of NHTSA's Defects ... · PDF fileWorkforce Assessment: The...
Workforce Assessment The Future of NHTSA’s Defects Investigations

i
ContentsPreface . . . . . . . . . . . . . . . . . . . . . . . . . . . . . . . . . . . . . . . . . . . . . . . . . . . . . . . . . . . . . . . . . . . . . . . . . . . . . . . . . .1
Executive Summary . . . . . . . . . . . . . . . . . . . . . . . . . . . . . . . . . . . . . . . . . . . . . . . . . . . . . . . . . . . . . . . . . . . . . . . .3
General Background on NHTSA and Current Challenges . . . . . . . . . . . . . . . . . . . . . . . . . . . . . . . . . . . . . . . . . . . . .4
The 2011 OIG Audit of the Office of Defects Investigation (ODI) and NHTSA’s Follow-Up Workforce Assessment . . .4
Summary of Staffing Models for ODI . . . . . . . . . . . . . . . . . . . . . . . . . . . . . . . . . . . . . . . . . . . . . . . . . . . . . . . . . . . .5
Current ODI Workforce . . . . . . . . . . . . . . . . . . . . . . . . . . . . . . . . . . . . . . . . . . . . . . . . . . . . . . . . . . . . . . . . . . . . . .8
ODI Workforce Challenges . . . . . . . . . . . . . . . . . . . . . . . . . . . . . . . . . . . . . . . . . . . . . . . . . . . . . . . . . . . . . . . . . . . .9
Technology . . . . . . . . . . . . . . . . . . . . . . . . . . . . . . . . . . . . . . . . . . . . . . . . . . . . . . . . . . . . . . . . . . . . . . . . . . . . . . .9
Data . . . . . . . . . . . . . . . . . . . . . . . . . . . . . . . . . . . . . . . . . . . . . . . . . . . . . . . . . . . . . . . . . . . . . . . . . . . . . . 9
High-Profile Investigations . . . . . . . . . . . . . . . . . . . . . . . . . . . . . . . . . . . . . . . . . . . . . . . . . . . . . . . . . . . 10
Toyota Unintended Acceleration (UA) . . . . . . . . . . . . . . . . . . . . . . . . . . . . . . . . . . . . . . . . . . . . . . . . . . . . . . . 10
Chevrolet Volt . . . . . . . . . . . . . . . . . . . . . . . . . . . . . . . . . . . . . . . . . . . . . . . . . . . . . . . . . . . . . . . . . . . . . . . . 10
General Motors Air Bag Non-deployment . . . . . . . . . . . . . . . . . . . . . . . . . . . . . . . . . . . . . . . . . . . . . . . . . . . 10
Takata . . . . . . . . . . . . . . . . . . . . . . . . . . . . . . . . . . . . . . . . . . . . . . . . . . . . . . . . . . . . . . . . . . . . . . . . . . . . . 11
Improving the Defects Investigation Program . . . . . . . . . . . . . . . . . . . . . . . . . . . . . . . . . . . . . . . . . . . . . . . . . . . . 12
Safety Enforcement in Other Modes . . . . . . . . . . . . . . . . . . . . . . . . . . . . . . . . . . . . . . . . . . . . . . . . . . . . 13
Resource Models . . . . . . . . . . . . . . . . . . . . . . . . . . . . . . . . . . . . . . . . . . . . . . . . . . . . . . . . . . . . . . . . . . . . . . . . . 15
Fiscal Year (FY) 2016 Budget Request – Minimum Boost to Current Defects Programs . . . . . . . . . . . . 16
New Paradigm – New, Comprehensive Defects Program . . . . . . . . . . . . . . . . . . . . . . . . . . . . . . . . . . . . 17
Division Assessments . . . . . . . . . . . . . . . . . . . . . . . . . . . . . . . . . . . . . . . . . . . . . . . . . . . . . . . . . . . . . . . . . . . . . .20
Defects Assessment Division (DAD) . . . . . . . . . . . . . . . . . . . . . . . . . . . . . . . . . . . . . . . . . . . . . . . . . . . . 20
Early Warning Division (EWD) . . . . . . . . . . . . . . . . . . . . . . . . . . . . . . . . . . . . . . . . . . . . . . . . . . . . . . . . . 21
Vehicle Control Division (VCD) . . . . . . . . . . . . . . . . . . . . . . . . . . . . . . . . . . . . . . . . . . . . . . . . . . . . . . . . 21
Vehicle Integrity Division . . . . . . . . . . . . . . . . . . . . . . . . . . . . . . . . . . . . . . . . . . . . . . . . . . . . . . . . . . . . . 22
Medium and Heavy Duty Vehicles Division (MHDVD) . . . . . . . . . . . . . . . . . . . . . . . . . . . . . . . . . . . . . . . 22
Recall Management Division (RMD) . . . . . . . . . . . . . . . . . . . . . . . . . . . . . . . . . . . . . . . . . . . . . . . . . . . . 23
Correspondence Research Division (CRD) . . . . . . . . . . . . . . . . . . . . . . . . . . . . . . . . . . . . . . . . . . . . . . . 23

ii
New Initiatives . . . . . . . . . . . . . . . . . . . . . . . . . . . . . . . . . . . . . . . . . . . . . . . . . . . . . . . . . . . . . . . . . . . . . . . . . . .25
ODI Trend Analysis Division . . . . . . . . . . . . . . . . . . . . . . . . . . . . . . . . . . . . . . . . . . . . . . . . . . . . . . . . . . 25
Defects Investigation Support . . . . . . . . . . . . . . . . . . . . . . . . . . . . . . . . . . . . . . . . . . . . . . . . . . . . . . . . . 26
Office of the Chief Counsel . . . . . . . . . . . . . . . . . . . . . . . . . . . . . . . . . . . . . . . . . . . . . . . . . . . . . . . . . . . 26
Conclusion . . . . . . . . . . . . . . . . . . . . . . . . . . . . . . . . . . . . . . . . . . . . . . . . . . . . . . . . . . . . . . . . . . . . . . . . . . . . . .28
Appendices . . . . . . . . . . . . . . . . . . . . . . . . . . . . . . . . . . . . . . . . . . . . . . . . . . . . . . . . . . . . . . . . . . . . . . . . . . . . . .29
Appendix A: Staffing Recommendations by ODI Division . . . . . . . . . . . . . . . . . . . . . . . . . . . . . . . . . . . . 29
Appendix B: ProSource . . . . . . . . . . . . . . . . . . . . . . . . . . . . . . . . . . . . . . . . . . . . . . . . . . . . . . . . . . . . . . 31
1
PrefaceAt the National Highway Traffic Safety Administration, each of us knows this number: 32,719. It’s the number of Americans who lost their lives on our highways in 2013. We know that number by heart because those people were mothers and fathers, sons and daughters, friends and co-workers. Every one of those lives matter, whether they died in a drunk-driving crash, because of texting at the wheel, from drowsy driving – or from a vehicle safety defect.
NHTSA’s system for identifying and addressing defective vehicles came under intense scrutiny in the last year. Much of that scrutiny came from the outside – from Congress, the media, and safety advocates. We welcome the constructive suggestions of those who share our dedication to saving lives. But we have also scrutinized ourselves.
Today, we release the two documents that are the product of our internal scrutiny. Together, they are a blueprint for how we will implement the lessons we learned and set our defect investigation system on a long-term path for greater effectiveness.
The first document, NHTSA’s Path Forward, is the result of the due diligence review NHTSA conducted in the wake of the GM ignition switch recall. It is no overstatement to say that this was one of the most significant cases in NHTSA’s history, not only because of the tragic toll of deaths and injuries, and the technical challenges it presented, but because of the unprecedented steps the manufacturer took to conceal a deadly defect. NHTSA’s Path Forward lays out the lessons NHTSA learned from that episode and how we are changing our processes and practices in response.
The second document, Workforce Assessment: The Future of NHTSA’s Defects Investigations, responds to a previous commitment to the U.S. Department of Transportation’s Office of Inspector General to assess NHTSA’s workforce in light of the breathtaking advances in vehicle technology. The GM ignition switch investigation arose just as NHTSA worked to complete this workforce assessment, and frankly, in light of the fundamental questions the GM case brought up, the original effort was insufficient. So we took the time to get it right. The assessment we release today is a comprehensive examination of the defects investigation system we need to build, and can with resources from Congress that commits to a vehicle safety system as robust as those that keep our skies and railways safe.
2
People have asked hard questions of NHTSA in the last year. We have asked hard questions of ourselves. This self-examination has not always been easy. As an agency dedicated to using every tool available to save lives, reduce injuries, and prevent crashes on our roads, this scrutiny provided us an invaluable opportunity to further our safety mission. The passionate, dedicated safety professionals of NHTSA are determined to save lives, and with the release of these documents, we take an important step toward improving our ability to save them.
Mark R. Rosekind, Ph.D. NHTSA Administrator

3
Executive SummaryOn February 7, 2014, General Motors (GM) announced that a safety defect existed in the 2005-2007 model year s(MYs) Chevrolet Cobalt and Pontiac G5 vehicles. GM reported that the vehicles had an ignition switch susceptible to being jarred out of the “run” position, potentially causing air bags not to deploy in a crash. The decade-long investigation into the root cause of these non-deployments by both the National Highway Traffic Safety Administration (NHTSA) and GM led many to question how it could have taken so long to identify and remedy the issue.
Soon after the GM recall went public, U.S. Department of Transportation (DOT) and NHTSA officials met to discuss the implications of the recall. From this discussion, NHTSA set three immediate priorities:
1. Protect the driving public by ensuring that GM quickly recalled and fixed all vehicles that could be affected by this defect;
2. Hold GM accountable for any failure to follow the legal requirement to quickly report and recall the subject vehicles; and
3. Improve NHTSA’s ability to find potential defects through (1) a review of the agency’s actions and assumptions in this case; and (2) an evaluation of the agency’s current resources, data, and pro-cesses involved in identifying vehicle safety defects.
These priorities led to an in-depth examination of GM’s ignition switch defect, as well as the practices of NHTSA’s Office of Defects Investigation (ODI), the body within NHTSA responsible for identifying vehicle defects. The intent of this scrutiny was to determine what GM and NHTSA each knew about the defect and then to develop lessons learned to institute process improvements within ODI. The lessons learned, listed below, are discussed in NHTSA’s Path Forward.
1. Increase the Accountability of the Automotive Industry
2. Increase NHTSA’s Knowledge Base of New and Emerging Technologies
3. Enhance ODI’s Systems Safety Approach to Detection and Analysis
4. Enhance Information Management, Analysis and Sharing
5. Establish Improved Controls for Assessing Potential Defects
6. Ensure Effective Communications and Coordination within ODI and between ODI and the Special Crash Investigation Division
After identifying lessons learned and initiating work on its planned actions, NHTSA refocused on an assessment of ODI’s workforce. The agency began this assessment in 2011 to respond to a recommendation by DOT’s Office of the Inspector General (OIG), which audited ODI following the unintended acceleration recalls by Toyota and other manufacturers. NHTSA initially hired a contractor to provide this assessment, but a review of the contractor’s findings led the agency to seek a more comprehensive and systematic review

4
of its defects investigation management. The results of that comprehensive assessment are provided in this document, including an outline of the resources that NHTSA would need to strategically improve defects investigations. It defines both the need for short-term resource increases, as illustrated by the agency’s FY 2016 budget, as well as a plan for the long-term strategic growth of the agency’s capabilities.
General Background on NHTSA and Current ChallengesNHTSA’s primary mission is to “save lives, prevent injuries, and reduce economic costs due to road traffic crashes.” NHTSA accomplishes its mission by “setting and enforcing safety performance standards for motor vehicles and motor vehicle equipment, and through grants to State and local governments to enable them to conduct effective local highway safety programs.” Within NHTSA, ODI is responsible for identifying vehicle safety defects.
While NHTSA is always looking for opportunities to improve and promote vehicle and road safety for the American public, recent events demanded the agency take a hard look at its defects investigation capability. The next 10 to 20 years are predicted to bring unprecedented numbers of significant changes to motor vehicles and drivers’ relationships with them. Recent and continuing advances in automotive technology have created innovative possibilities for improving vehicle safety. These advances also present new challenges, especially in the areas of electronics reliability, cybersecurity and privacy, and defects assessment.
The 2011 OIG Audit of ODI and NHTSA’s Follow-Up Workforce AssessmentIn 2011, the OIG conducted an audit of the process ODI used to investigate the unintended acceleration (UA) issues concerning Toyota and other manufacturers, which led to the recall of more than 8 million vehicles. Following that audit, the OIG issued a report on NHTSA’s oversight of vehicle safety. The OIG found that ODI followed established processes in the UA investigation, but that ODI needed process improvements for identifying and addressing vehicle safety defects. OIG’s report made 10 recommendations to enhance ODI’s processes, including a recommendation to assess workforce needs. OIG noted:
ODI has not conducted a workforce assessment to determine the number of staff needed nor the specialized skill sets required for ensuring that manufacturers recall vehicles and equipment with safety-related defects in a timely manner. In particular, NHTSA has not evaluated the level of staffing and skill sets needed for the timely detection of electronic system problems, such as brake override systems, keyless ignition systems, event data recorders, electronic throttle control systems,

5
and similar electrical systems, prevalent in today’s environment. As a result, NHTSA has no assurance that it has the right number of people with the right skill sets to accomplish its mission.1
Following the report’s recommendations, NHTSA hired a contractor—ProSource—to conduct a workforce assessment to determine the number of staff required to ensure that ODI meets its objectives and the most effective mix of staff. After receiving ProSource’s2 draft workforce assessment (Appendix B), ODI decided additional effort would be needed to determine the agency’s needs in order to achieve ODI’s mission.
In keeping with the recommendation in OIG’s report,3 each ODI division assessed its strategic mission, current staffing levels, and future staffing needs. Further, each division performed a gap analysis (including risk assessments and identifying single points of failure) and provided recommendations on the number and most effective mix of staff (including contractors) to meet its objectives.
The results of this assessment are set forth below. In addition to addressing human resources and additional funding, this assessment evaluates ODI’s information technology needs. ODI must review and analyze large volumes of data to discover potential safety defects and validate its defect determinations. One recommendation, already initiated, is the creation of an ODI Trend and Analysis Division, which will allow ODI to better collect and analyze the data needed to carry out its mission.
This assessment also addresses the resources of NHTSA’s Office of Chief Counsel (NCC) Litigation and Enforcement Division, which plays an integral role in the defects investigation and recall process, and the staffing and resource needs for NHTSA’s Vehicle Research and Testing Center (VRTC), which provides ODI with in-depth research and testing support.
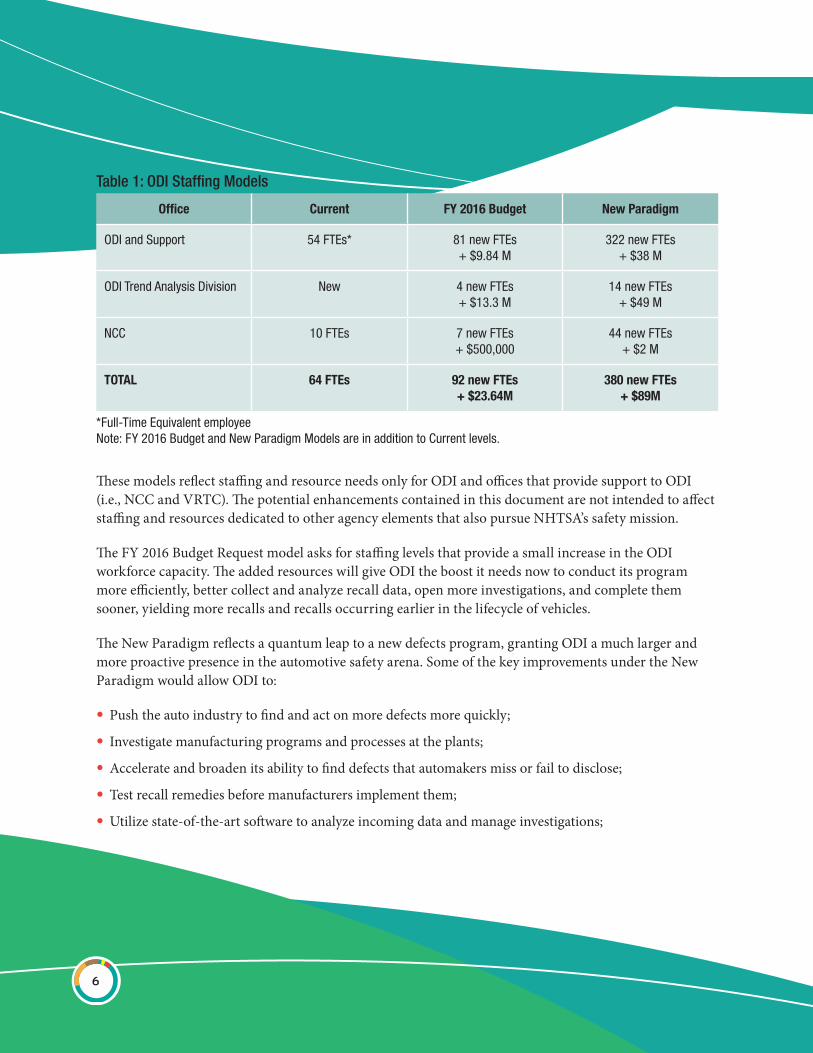
Summary of Staffing Models for ODIODI explored several staffing models as a result of the workforce assessment. The models discussed here reflect a two-step approach to improving NHTSA’s defect investigation capabilities. The first model is reflected in the Fiscal Year (FY) 2016 budget request (the FY 2016 Budget Request model), which calls for immediate increases in staff and resources to improve output under the current defects investigation model. The second outlines a new model for defects investigations within NHTSA (the New Paradigm), requiring robust, long-term, strategic increases that will significantly change ODI’s investigation and enforcement paradigm.
1 OIG Report Number MH-2012-001, “Process Improvements Are Needed For Identifying And Addressing Vehicle Safety Defects,” Oct. 6, 2001, p.18.
2 ProSource’s workforce assessment heavily emphasized process versus the determination of the effective mix and number of staff required to ensure that ODI meets its objectives. NHTSA determined this did not fulfill OIG’s recommendation.
3 Id., p. 18.
6
Table 1: ODI Staffing Models
Office Current FY 2016 Budget New Paradigm
ODI and Support 54 FTEs* 81 new FTEs+ $9 .84 M
322 new FTEs+ $38 M
ODI Trend Analysis Division New 4 new FTEs+ $13 .3 M
14 new FTEs+ $49 M
NCC 10 FTEs 7 new FTEs+ $500,000
44 new FTEs+ $2 M
TOTAL 64 FTEs 92 new FTEs+ $23.64M
380 new FTEs+ $89M
*Full-Time Equivalent employeeNote: FY 2016 Budget and New Paradigm Models are in addition to Current levels .
These models reflect staffing and resource needs only for ODI and offices that provide support to ODI (i.e., NCC and VRTC). The potential enhancements contained in this document are not intended to affect staffing and resources dedicated to other agency elements that also pursue NHTSA’s safety mission.
The FY 2016 Budget Request model asks for staffing levels that provide a small increase in the ODI workforce capacity. The added resources will give ODI the boost it needs now to conduct its program more efficiently, better collect and analyze recall data, open more investigations, and complete them sooner, yielding more recalls and recalls occurring earlier in the lifecycle of vehicles.
The New Paradigm reflects a quantum leap to a new defects program, granting ODI a much larger and more proactive presence in the automotive safety arena. Some of the key improvements under the New Paradigm would allow ODI to:
• Push the auto industry to find and act on more defects more quickly;
• Investigate manufacturing programs and processes at the plants;
• Accelerate and broaden its ability to find defects that automakers miss or fail to disclose;
• Test recall remedies before manufacturers implement them;
• Utilize state-of-the-art software to analyze incoming data and manage investigations;

7
• Conduct hundreds more investigations every year;
• Follow-up with significantly more people who file defect complaints with the agency;
• Investigate alleged vehicle defects in the field; and
• Deeply analyze death and injury reports.
In addition, the Office of Chief Counsel would be able to pursue more enforcement actions in support of ODI’s program. The expected net result would be an increase in the number of recalls in the short term, but a decrease in the long term as manufacturers are held accountable for improved quality control before production. In addition, the total volume of vehicles per recall would likely decrease because defects would be identified earlier in the production life of the vehicles.

8
Current ODI WorkforceODI, part of NHTSA’s Office of Enforcement within the Vehicle Safety organization, investigates possible defect trends, and where appropriate, seeks recalls of vehicles and vehicle equipment that pose an unreasonable safety risk. Prior to opening a defect investigation, ODI reviews and analyzes data from multiple sources including consumer complaints, also referred to as vehicle owner questionnaires (VOQs). When recalls are issued, ODI monitors manufacturers and ensures that the manufacturer sufficiently and quickly corrects the identified vehicle safety issues. ODI accomplishes its mission with 50 full-time employees (FTEs) who work in its seven divisions (Figure 1):

9
ODI currently has 8 defect screeners and 4 Early Warning data analysts to identify potential safety defects, and 16 investigators to conduct formal investigations. For the past several years, this staff has been supplemented by approximately 34 contractor employees at a cost of $3.5 million annually. Since 2002, this lean workforce has influenced the recall, on average, of nearly 9 million vehicles annually as well as the recall of millions of items of equipment for safety-related defects.
ODI Workforce Challenges
TechnologyThirty years ago, manufacturers revolutionized vehicles by putting computers on some high-end cars. Today, all new cars are equipped with multiple computers that communicate with one another, and each model year is more advanced than the last. Complex new technologies make it more challenging to identify the root causes of known defects and whether those causes are electronic in nature or the result of an old-fashioned mechanical issue.
Recent advances in automotive technology and research into vehicle innovations have created exciting new possibilities for improving vehicle safety. However, they also present new challenges. For example, NHTSA continues to research and remain actively involved in three related streams of technological development:
• in-vehicle crash-avoidance systems;
• vehicle-to-vehicle (V2V) communications; and
• self-driving vehicles.
All of these technologies are poised to reduce crashes and ultimately make our highways safer. At the same time, all of these systems present related issues such as electronics reliability, cybersecurity, and privacy, as well as risk of defects. Without additional resources, ODI is challenged to acquire and retain expert knowledge in these developing areas while maintaining expertise in more traditional crash avoidance and crashworthiness areas that continue to provide safety improvements.

10
DataAs automotive manufacturers advance in engineering and on-board electronics, both the volume and complexity of data available to NHTSA is increasing substantially. In calendar year 2013, ODI received just over 50,000 VOQs, and the agency received close to 80,000 VOQs for calendar year 2014 without any increase in staff or budget to address the bigger workload. Although the data can potentially provide a breathtaking array of information that will no doubt offer valuable new indicators of safety issues, ODI must have enough engineers and investigators with expertise to extract and interpret the data provided.
High-Profile InvestigationsIn addition to new technologies, and data processing needs, the increase in high-profile investigations has challenged NHTSA to meet increased consumer and stakeholder expectations. These high-profile cases have not only demanded additional staff and resources to address the defects as quickly as possible, but have also demanded additional scrutiny and improvements to NHTSA’s defects investigations processes.
Toyota Unintended Acceleration (UA)In 2009, NHTSA investigated the cause of unintended acceleration in Toyota vehicles, and concluded that the cause was pedal entrapment, where the gas pedal becomes entrapped in an open throttle position especially when floor mats were stacked beneath them. Many in the public were not satisfied with this mechanical explanation and critics questioned NHTSA’s ability to investigate electronic control systems.
On February 19, 2010, the OIG initiated an audit to assess the effectiveness of ODI’s processes for identifying and addressing safety defects, and subsequently, Congress and the Secretary of Transportation requested OIG to expand its audit to analyze ODI’s industrywide unintended acceleration investigations. NHTSA funded two studies, by the National Aeronautics and Space Administration (NASA) and the National Academy of Sciences (NAS), to evaluate the cause of UA and ODI’s process for investigating UA and vehicle electronics analysis, respectively. NASA, after 18 months of study, did not identify an electronic cause of UA. The NAS did not find fault with the NASA or NHTSA studies, but did recommend that NHTSA upgrade its ability to address the quickly developing advanced vehicle control technologies.
Chevrolet VoltIn late 2011, NHTSA confronted a potential hazard involving post-crash fires in Chevrolet Volt vehicles after a Volt vehicle caught fire following a crash test. This led to close reviews of fires in any electric vehicle. Despite no on-road incidents, NHTSA began probing whether electric vehicles posed unique safety hazards as opposed to gas-powered vehicles. As with the UA investigation, this probe received significant media, public, and Congressional interest.

11
General Motors Airbag Non-deploymentIn 2014, NHTSA faced more intense scrutiny when GM announced that it failed to recall vehicles that the company knew contained defective ignition switches that could disable airbags. ODI launched another high-profile investigation. At the same time, the OIG initiated an audit to assess the agency’s procedures for collecting, analyzing, and managing information to identify safety-related vehicle defects, and to determine whether information about ignition switch issues and non-deploying airbags was available to NHTSA but not used in GM defect analysis.
TakataLater in 2014, ODI persuaded several manufacturers to conduct recalls addressing a possible safety defect involving Takata brand air bag inflators that had ruptured resulting in injuries and fatalities. The investigation and recalls resulted in enormous media and Congressional attention, which continues today.
These high-volume, high-visibility investigations and recalls have expanded the expectations and demands on ODI in recent years, requiring ODI to divert considerable resources from its core mission of safety to address increased public, media, and Congressional inquiries. Moreover, NHTSA’s aggressive oversight of manufacturers involved in these recalls requires that ODI devotes substantial resources to scrutinizing input from manufacturers under consent orders from NHTSA to track all pending safety issues and provide the information to the agency. The net result is a reduction in the number of investigations ODI has been able to initiate and an increase in the time needed to complete investigations.
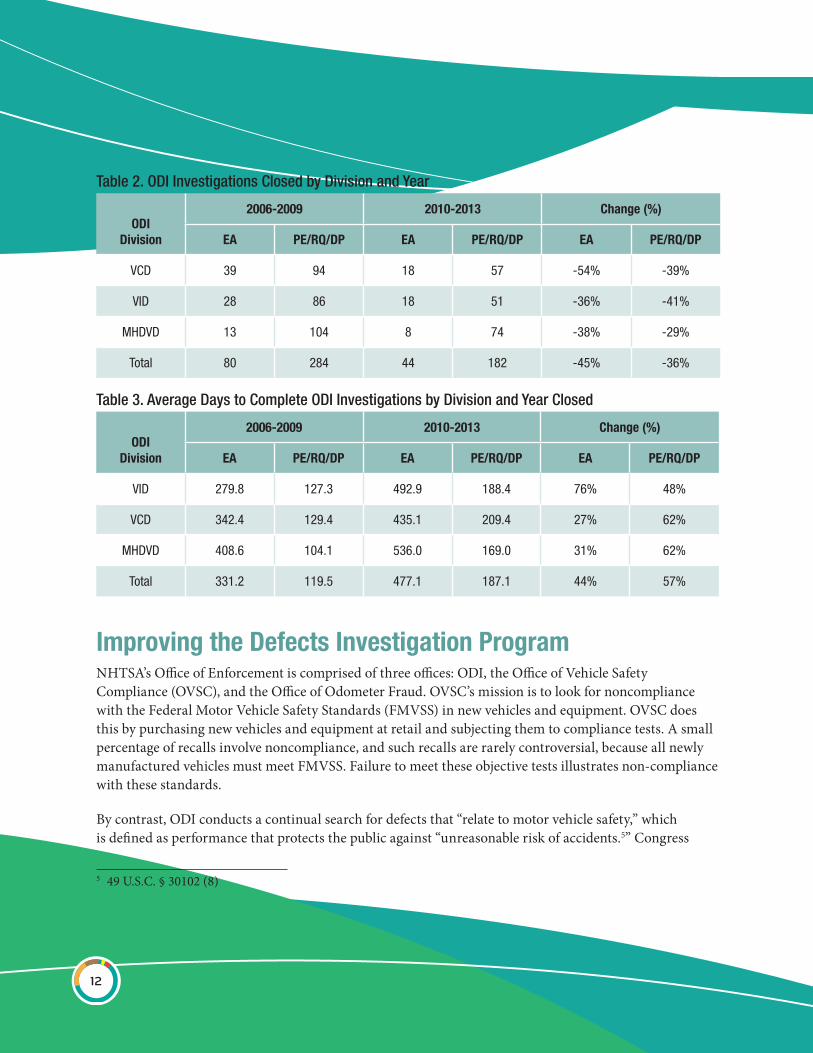
This reduction and increased completion time are reflected in Tables 1 and 2, which compare the number of investigations closed and the average completion times during the four years before the UA issue arose with the same numbers after the UA issue. Table 1 shows that the number of engineering analyses closed by ODI dropped by almost half and the number of basic investigations (preliminary evaluations, recall queries, and defect petition reviews) dropped by over a third between the two time periods.4 Table 2 shows a 44- to 57-percent increase in the number of days to complete investigations in the two time periods.
4 Preliminary Evaluations (PE’s), recall queries (RQ’s) and defect petition (DP) reviews are basic investigations that ODI targets for completion within 120 days. Engineering analyses (EA’s) are more in-depth investigations that are targeted for completion within approximately 1 year.
12
Table 2. ODI Investigations Closed by Division and Year
ODIDivision
2006-2009 2010-2013 Change (%)
EA PE/RQ/DP EA PE/RQ/DP EA PE/RQ/DP
VCD 39 94 18 57 -54% -39%
VID 28 86 18 51 -36% -41%
MHDVD 13 104 8 74 -38% -29%
Total 80 284 44 182 -45% -36%
Table 3. Average Days to Complete ODI Investigations by Division and Year Closed
ODIDivision
2006-2009 2010-2013 Change (%)
EA PE/RQ/DP EA PE/RQ/DP EA PE/RQ/DP
VID 279 .8 127 .3 492 .9 188 .4 76% 48%
VCD 342 .4 129 .4 435 .1 209 .4 27% 62%
MHDVD 408 .6 104 .1 536 .0 169 .0 31% 62%
Total 331 .2 119 .5 477 .1 187 .1 44% 57%
Improving the Defects Investigation ProgramNHTSA’s Office of Enforcement is comprised of three offices: ODI, the Office of Vehicle Safety Compliance (OVSC), and the Office of Odometer Fraud. OVSC’s mission is to look for noncompliance with the Federal Motor Vehicle Safety Standards (FMVSS) in new vehicles and equipment. OVSC does this by purchasing new vehicles and equipment at retail and subjecting them to compliance tests. A small percentage of recalls involve noncompliance, and such recalls are rarely controversial, because all newly manufactured vehicles must meet FMVSS. Failure to meet these objective tests illustrates non-compliance with these standards.
By contrast, ODI conducts a continual search for defects that “relate to motor vehicle safety,” which is defined as performance that protects the public against “unreasonable risk of accidents.5” Congress
5 49 U.S.C. § 30102 (8)

13
defined a “defect” as “any defect in performance, construction, a component, or material of a motor vehicle or motor vehicle equipment6”, and gave NHTSA the authority to order a recall if a defect meets these conditions.
However, there are no bright lines to identifying a defect. Adding to the complexity, ODI must search for problems among all vehicles on the road and all existing items of equipment. This means that its universe of possible investigation targets is enormous: more than 265 million vehicles are on the road, and motor vehicle equipment in the hundreds of millions are in use at any given time.
ODI looks at all available data to assess the relative frequency and potential severity of any possible safety defect. ODI generally pursues investigations and insists on recalls where it can most clearly identify and demonstrate safety risk.
A central element of NHTSA’s current enforcement posture, however, is to push manufacturers to fulfill their duty to find defects, because manufacturers bear the fundamental statutory duty to find and publicly identify safety defects7. The manufacturers focus on their product lines with more in-house knowledge of the numerous, complex vehicles and equipment in question, as well as with large in-house safety investigation teams. Therefore, manufacturers can identify possible defects earlier than ODI. As explained below, it is important that NHTSA continue to insist that manufacturers fulfill their statutory duty to find and disclose defects.
Safety Enforcement in Other ModesTo better understand the potential safety benefits of a new NHTSA defects investigation paradigm, it is useful to compare NHTSA’s current staffing and budget to other transportation safety agencies within DOT, specifically the Federal Aviation Administration (FAA) and Federal Rail Administration (FRA). Direct comparisons between enforcement programs in each of these modal agencies are not precise because the agency structures are different. They all, however, have the common mission of addressing risks posed by vehicles that are in use across the nation. The comparisons are useful in demonstrating at the macro level that the safety enforcement programs of NHTSA’s sister agencies work under a different paradigm (Table 4).
6 49 U.S.C. § 30102 (2)7 49 U.S.C. § 30118 (c)

14
Table 4: DOT Enforcement Programs Comparison
Agency2014 FTEs for Safety
EnforcementRatio of Agency Staff to
100 Fatalities2014 Budget for Safety
Enforcement
FAA 6,408 10,216 $1,120 M
FRA 678 .5 160 $184 .5 M
NHTSA* 90 .3 $33 .57 M
*Office of Enforcement includes ODI, OVSC, and Office of Odometer Fraud Investigation .
FAA’s Office of Aviation Safety (AVS) is responsible for setting safety standards for aircraft and aircraft operators in the national airspace system. AVS determines compliance with those standards, issues operating certificates, and oversees certificate holders to ensure that they continue to comply with the standards. AVS has seven different offices with more than 7,000 employees.
The ODI equivalent in AVS would (roughly) include the offices of Flight Standards, Aircraft Certification, Accident Investigation and Prevention, and Quality, Integration and Executive Services. In 2014, those offices had a combined total of 6,408 full-time equivalent employees (FTEs). This number does not include AVS employees in rulemaking, aerospace medicine, and air traffic control, nor does it include commercial space transportation. These selected AVS offices have oversight of 5,458 air operator certificates,210,463 aircraft, 747,959 active pilots, and 1,619 approved manufacturers. The enacted 2014 budget for these offices totaled $1.12 billion (including salaries).8
FRA has safety oversight of 780 railroads. The Office of Railroad Safety regulates and enforces railroad safety standards using a staff of safety experts, inspectors, and other professionals. The enacted 2014 budget for 2014 for this mission was 678.5 FTEs and $184.5 million (including salaries).9
By contrast, ODI must ferret out safety defects on a domestic fleet of more than 265 million light vehicles, plus hundreds of million pieces of vehicle equipment. It does this with approximately 28 (8 defect screeners, 4 early warning data analysts, and 16 investigators) of the 51 employees in ODI. ODI’s budget for 2014 was $10.6 million.
To oversee the safety of such a large fleet with such a small staff, ODI is almost completely dependent on information flowing into the agency from outside sources: consumer complaints, early warning data from manufacturers, recalls in other countries, and industry and consumer chat rooms online. Unlike
8 Reference FAA’s FY 2015 budget request, page 5.9 Reference FRA’s FY 2015 budget request, pages 14 and 36.
15
the other modal agencies, ODI’s program is not designed to have “boots-on-the-ground” inspectors. No inspection team fans out to visit, inspect or certify manufacturing plants, car dealerships, crash scenes, or complainant vehicles on a regular basis.
The biggest and best source of information about possible defects comes from consumer complaints, every one of which is read by an ODI screener. Historically, such complaints have come into the agency at a rate of about 45,000 per year. Largely due to two high-profile investigations, ODI received more than 77,000 complaints in 2014. Although ODI’s goal historically has been to increase the number of complaints it receives every year, the sudden near doubling of complaint traffic without added resources to process them has meant that even staying current in this task this year is now difficult for ODI.
To put the analysis in the context of safety risk comparison, fatalities in U.S. civil aviation in 2012 totaled 447.10 Fatalities from train accidents in 2012 totaled 9.11 Motor vehicle fatalities in 2013 were 32,719. According to a 2013 study in Research in Transportation Economics, “Comparing the Fatality Risks in United States Transportation Across Modes and Over Time,” the fatality rate for commercial aviation is 0.07 fatalities per billion passenger miles. In rail, the fatality rate for long-haul train service is 0.43 per billion passenger miles. By contrast, the fatality risk for drivers or passengers in light vehicles is 7.3 per billion passenger miles.
Only a small percentage (approximately 2%) of the annual highway fatalities is directly attributable to vehicle factors (some design issues, some owner maintenance issues, some defect issues). Rather, 94 percent of highway fatalities are related to various human factors, 12 including driver actions, such as speeding, distraction, impaired driving, and not wearing a seatbelt. Nevertheless, ODI’s work helps protect vehicle occupants from harm whether or not the crash is solely the fault of the driver. Also, for context, even two percent of the annual roadway fatalities is more than the number of annual fatalities in the air and rail modes.
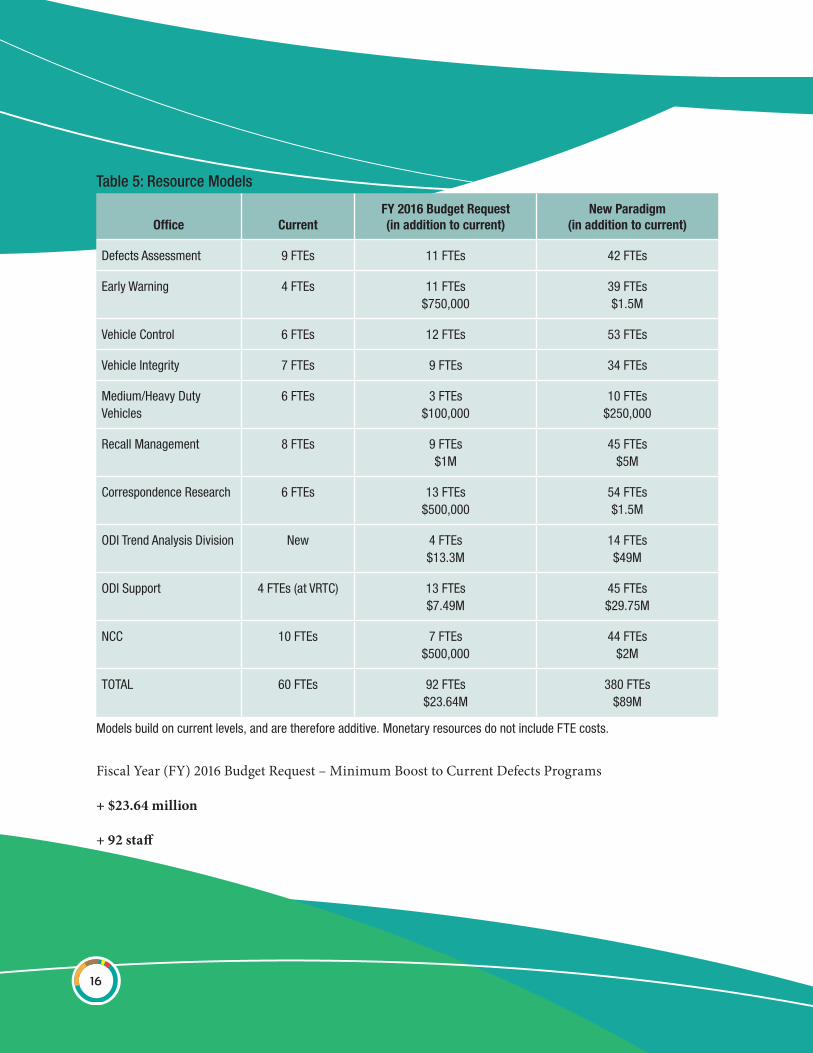
Resource ModelsBased on NHTSA’s in-depth evaluation, two resource models were developed: 1) Fiscal Year (FY) 2016 Budget Request – minimum boost to current defects programs; and 2) New Paradigm – new, comprehensive defects program. An overview of the resource needs for these two models is summarized in Table 4. Following the table are descriptions of how these models would enhance ODI’s current capabilities and effectiveness.
10 As reported by the Bureau of Transportation Statistics.11 FRA accident/incident report; this figure does not include grade crossing fatalities.12 “Critical Reasons for Crashes Investigated in the National Motor Vehicle crash Causation Survey.” www-nrd.nhtsa.
dot.gov/Pubs/812115.pdf.
16
Table 5: Resource Models
Office CurrentFY 2016 Budget Request (in addition to current)
New Paradigm (in addition to current)
Defects Assessment 9 FTEs 11 FTEs 42 FTEs
Early Warning 4 FTEs 11 FTEs$750,000
39 FTEs$1 .5M
Vehicle Control 6 FTEs 12 FTEs 53 FTEs
Vehicle Integrity 7 FTEs 9 FTEs 34 FTEs
Medium/Heavy Duty Vehicles
6 FTEs 3 FTEs$100,000
10 FTEs$250,000
Recall Management 8 FTEs 9 FTEs$1M
45 FTEs$5M
Correspondence Research 6 FTEs 13 FTEs$500,000
54 FTEs$1 .5M
ODI Trend Analysis Division New 4 FTEs$13 .3M
14 FTEs$49M
ODI Support 4 FTEs (at VRTC) 13 FTEs$7 .49M
45 FTEs$29 .75M
NCC 10 FTEs 7 FTEs$500,000
44 FTEs$2M
TOTAL 60 FTEs 92 FTEs$23 .64M
380 FTEs$89M
Models build on current levels, and are therefore additive . Monetary resources do not include FTE costs .
Fiscal Year (FY) 2016 Budget Request – Minimum Boost to Current Defects Programs
+ $23.64 million
+ 92 staff

17
The immediate needs of ODI are reflected in NHTSA’s FY 2016 budget request. The request reflects the first substantial increase to ODI staff and resources in many years, and will enable ODI to increase performance with a small boost in capacity. Under this model, if current conditions and workloads remain constant, ODI would continue operating from a reactive, rather than proactive posture described in the comprehensive New Paradigm. Specific recommendations are shown separately below for each of ODI’s divisions.
New Paradigm – New, Comprehensive Defects Program
+ $89 million
+ 380 staff
High profile investigations and recalls in recent years have illustrated that neither the general public, nor Congress, is aware that NHTSA’s enforcement program is not structured like better-known government enforcement programs. As outlined, the New Paradigm would dramatically change NHTSA’s enforcement program, allowing ODI to perform at a significantly enhanced capacity, and more closely align with similar proactive enforcement models. Furthermore, it would enable ODI to best address issues involving an array of new technologies and optimize ODI’s use of the vast increase in complex data produced by these technologies.
The New Paradigm levels would provide ODI sufficient resources to:
• Require manufacturers to provide ODI with their entire lists of pending safety issues, regardless of how far along their internal inquiries may be, and drill down into each of those issues to obtain more facts and see whether they warrant opening an investigation. NHTSA has used this technique in recent con-sent orders with GM and Hyundai. Although labor-intensive for ODI, a comprehensive defects program of this nature would seek to identify potential defects much earlier and at low levels of risk before they have developed into a risk that normal screening procedures may reveal.
• Regularly audit all manufacturers’ defects investigation processes and Early Warning reporting (EWR), either randomly or when problems appear. This could entail sending staff to scrutinize company struc-tures and processes, reporting on findings, and actively monitoring any corrective actions. Another approach is to have NHTSA staff review required audits produced by independent third-parties of the manufacturers’ processes and reporting.
• Test recall remedies routinely prior to implementation. Currently, the manufacturer chooses the recall remedy and NHTSA studies the remedy’s effectiveness relatively rarely when indicators point to a problem. Testing must await fabrication of replacement parts and can be expensive and time consuming; however, making such testing routine would enable NHTSA to seek out any problems with recall reme-dies before they are applied.

18
• Conduct hundreds of crash field investigations each year (from among the 6 million police-reported crashes that occur annually) specifically focused on finding possible defects. These investigations would be designed to look for defects in the vehicle’s manufacture or operation. Some may occur prior to opening a formal investigation and many would occur during a formal investigations, requiring staff-ing and travel money to support intensive crash reconstruction analysis. The current practice is to ask NHTSA’s Special Crash Investigators to look for specific factors in their investigations, which are not normally selected by ODI and are usually oriented toward developing data for the agency’s regulatory analyses. This change would provide NHTSA with a team similar to the “Go Team” used by the National Transportation Safety Board (NTSB) to investigate for defect-specific causes and contributing factors.
• Track details of every death and injury report. ODI currently receives about 6,000 such reports annu-ally and follows up on about 10 percent of those that may have some relation to a possible defect trend. Under this new model, ODI (with assistance from NCC) would obtain details related to every death or injury incident filed under EWR, including documents developed in lawsuits after the initial EWR notification. This would require continually reviewing new documents as well as numerous discussions with private counsel to obtain documents and interviews with witnesses to understand the import of each document.
• Pursue many more remote defect theories. This may also involve regularly hiring external experts (e.g., NHTSA hired NASA to assist with the UA investigation) that expand on NHTSA’s internal expertise. Although such activity may often not lead to meaningful outcomes, it may, in some cases, make a critical difference. For example, if ODI had gathered information on whether and how ignition switch position might affect air bag deployment under various manufacturers’ deployment strategies (even though the facts at the time made a different explanation for non-deployment seem much more plausible), it may have learned of that relationship in GM vehicles much sooner.
• Contact every complainant directly to obtain more details before any investigation has been opened. This would turn up additional useful information but would involve 50,000 to 80,000 or more phone contacts each year.
• Travel regularly to examine potentially defective vehicles (not just crashed vehicles, as discussed above) even at the pre-investigative stage. This would call for a substantial increase in trips per year whereas currently only a handful of such trips to the field are made each year.
• Follow up in a comprehensive manner on every VOQ that alleges a crash, injury, or fatality.
• Increase the number of investigations that ODI opens based on all of the additional information obtained through the application of the measures outlined above, regardless of whether the overall risk appears high.
• Combat potential increased resistance to recalls by industry. Because the threshold for establishing risk would be much lower, manufacturers’ opposition will likely increase, leading to a greater need to pursue

19
defect cases through the full process to the point of issuing a recall order and supporting litigation, if necessary.
• Pursue many more civil penalty enforcement actions for timeliness violations after obtaining and reviewing extensive documentation.
• Significantly expand scrutiny of EWR reporting for possible underreporting, including extensive research and outreach and filing special orders to ferret out incidents that were not reported; when needed, take enforcement action for underreporting.
• Develop and continuously update the highest capacity computer support systems to enable these programs to work smoothly. This would entail (1) full application of the most sophisticated content analytics software to help ODI find the smallest of indicators of risk in a vastly expanded universe of data, and (2) the full application of the highest-level business management software to track analysis of the data, contacts with consumers, field investigation activities, audits of manufacturers, investigations, document requests, litigation, etc.
• Ensure frequent training of ODI staff on developing technologies, including travel to the best available courses and detailed briefings from manufacturers each year.
The steps listed above are just some of those that would be needed to create a new paradigm model defects program that can be expected to identify and address the vast majority of safety risks in the Nation’s vehicle fleet and motor vehicle equipment before they claim lives or cause injuries. This comprehensive new paradigm provides ODI strength in numbers, data, and processes and will allow ODI to fulfill its mission in a more effective and timely manner. To provide more detail, specific recommendations are shown separately below for each of ODI’s divisions.

20
Division AssessmentsThe DOT Workforce Planning Guide provides information on assessing staffing needs for the Department’s Operating Administrations that can facilitate more efficient and accurate alignment of the workforce to meet its organizational goals, commitments, and priorities. The guide outlines each agency’s mission, a framework to analyze workforce staff that includes strategic alignment to agency mission, assessment of current staffing levels and future needs, gap analysis and recommendations. For this workforce assessment, each division chief evaluated the division’s workforce in accordance with the framework contained in the guide and provided recommendations of staffing levels. Detailed breakdowns of staffing recommendations are reflected in Appendix A.
Defects Assessment Division (DAD)Has overarching responsibility for identifying potential safety defect issues that may warrant formal investigation
Current Workload and Value of Additional ResourcesDAD reviews all available relevant information, including but not limited to vehicle owner questionnaires or consumer complaints, EWR data, foreign safety-related campaigns, external manufacturer communications (including service bulletins, service campaigns, and other documents), email, letters, anonymous reports, and information from other government investigative offices.
The increases in the FY 2016 Budget request will offer improvements to DAD’s capabilities. Under the New Paradigm, these improvements would expand further allowing DAD to effectively and efficiently conduct defects screening and data analysis, and maintain proficiency to keep pace with rapidly evolving technology and complexity in automotive systems. Additional resources would:
• Improve DAD’s data mining and analysis capability;
• Improve DAD’s case management capability;
• Enable the examination of manufacturers’ current list of possible safety issues;
• Support field inspections; and
• Enable ad hoc screening analyses.

21
Early Warning Division (EWD)Collects and analyzes early warning data and conducts compliance reviews
Current Workload and Value of Additional Resources EWD collects, manages and analyzes EWR data submitted by manufacturers under the Transportation Recall Enhancement, Accountability, and Documentation (TREAD) Act.13 This data includes but is not limited to death and injury incidents, counts of consumer complaints and warranty and property claims, dealer communications including technical service bulletins, and field report information. EWD also reviews and monitors production data and foreign recall reporting. If EWD identifies a specific concern or trend based on EWR data, EWD can formally refer this issue to DAD for further review.
These additional staff requested in the FY 2016 budget would ensure that statistical analysis and ad hoc queries of TREAD data are maintained. They would also allow EWD to perform audits of manufacturers to ensure that they are providing ODI with all of the information required under the TREAD Act (or establish a program to review audits provided by independent third-parties). In addition, ODI would identify more safety issues and defect trends earlier in the process. The FY 2016 budget requests $1.5 million additional funding for contract staff, updated analysis software and computer equipment.
The New Paradigm builds on the improvements in the FY 2016 budget request, providing a full complement of staff to increase data analysis capabilities, and would require an additional $750,000 for updated software, computer capabilities, and contract staff.
Vehicle Control Division (VCD)Conducts investigations on vehicles and equipment involved in vehicle control
Current Workload and Value of Additional ResourcesVCD investigates alleged defects involving light-duty vehicle systems and components that affect the driver’s ability to safely maintain control of the vehicle. VCD investigates defect conditions that affect the crash avoidance capability of the vehicle, an element critical to reducing crashes, injuries and fatalities.
In addition to maintaining current technical expertise about vehicle control systems, VCD investigators must develop and maintain a basic level of proficiency in consumer interviewing, field investigations, test planning, data analysis, research, statistics, report writing, presentation, and record-keeping skills.
The additional staff requested in the FY 2016 Budget would provide VCD with more knowledge and experience necessary to effectively and efficiently conduct defect investigations, review proposed investigations, and maintain technical competencies/proficiencies to keep pace with rapidly evolving
13 49 U.S.C. §§ 30101-30170.

22
technology, interactions and complexity in automotive systems. As indicated, the New Paradigm would vastly increase VCD’s staff, and therefore the breadth of knowledge required to keep pace with ever-changing vehicle technology.
Vehicle Integrity Division (VID)Conducts formal investigations on vehicles and equipment that relate to vehicle integrity
Current Workload and Value of Additional ResourcesVID is responsible for investigating alleged defects involving light-duty vehicle systems and components that affect the structure and crashworthiness of a vehicle. VID investigates defect conditions that affect the integrity of the vehicle and the performance of occupant protection components and systems. In addition to maintaining current technical knowledge about vehicle integrity systems and components, VID investigators must develop and maintain a basic level of proficiency in consumer interviewing, field investigations, test planning, data analysis, research, statistics, report writing, presentation, and record- keeping skills.
Staffing levels must rise for VID to meet future demands and perform its mission effectively and efficiently as automotive technologies continue to evolve and grow in complexity. The FY 2016 Budget Request provides a modest increase in staffing to improve its capabilities. The New Paradigm builds on this, providing the additional staffing to effectively and efficiently conduct defect investigations, review proposed investigations and maintain office technical competencies/proficiencies to keep pace with rapidly evolving technology, and the interactions and complexity in automotive systems.
Medium- and Heavy-Duty Vehicles Division (MHDVD)Conducts investigations into safety defects in motor vehicles or motor vehicle equipment involving medium and heavy duty trucks and their components
Current Workload and Value of Additional ResourcesMHDVD conducts investigations into alleged safety defects in trucks, buses, and other medium and heavy-duty vehicles and equipment, including their components. In 2013, ODI received approximately 50,000 consumer complaints about light vehicles and motorcycles. During that same period of time, fewer than 400 complaints were received on heavy trucks and buses. Accordingly, MHDVD must rely on other sources of information, including tips from the industry and EWR field reports.
The FY 2016 Budget Request provides additional staff, but more importantly provides an additional $100,000 for seminars, conferences, and other networking events vital to improving MHDVD’s capabilities. The New Paradigm provides additional staff and $250,000 for enhanced performance.
23
Recall Management Division (RMD)Administers NHTSA’s safety recall program, provides monitoring and verification of manufacturer notification and remedy campaigns
Current Workload and Value of Additional ResourcesRMD provides accurate, timely and useful recall information to a variety of customers including other Agency and Government personnel and the public. To do this, the division engages in a wide variety of administrative, analytical, investigative, and enforcement activities. RMD is unique from the other offices within ODI as it directly supports the Office of Vehicle Safety Compliance (OVSC) in the processing and oversight of recalls concerning failures of vehicles or equipment to meet minimum Federal motor vehicle safety standards.
In August 2014, RMD deployed a new “recalls portal” to reduce some of the administrative burden of organizing and filing the paperwork required from manufacturers for their recalls, and used by RMD to perform its oversight and compliance role.
The FY 2016 Budget Request provides an additional $1 million for updated software and computing equipment and contract staff, and will allow RMD to:
• Perform recalls scope and adequacy investigations and conduct audits and data requests;
• Improve recalls processing, publishing, tracking and monitoring;
• Perform audits of manufacturers to ensure compliance with recall reporting requirements; and
• Conduct ad hoc recall analysis requests.
The New Paradigm will provide an additional $5 million to build on the improvements from the FY 2016 Budget request, and would allow for a new cadre of statisticians to perform studies to support recall completion analysis, as well as records managers.
Correspondence Research Division (CRD)Collects information and data from consumers concerning potential safety-related defects, and prepares replies to correspondence relating to ODI’s mission
Current Workload and Value of Additional ResourcesCRD collects information and data from consumers concerning potential safety-related defects, maintains ODI records, and prepares replies to correspondence related to ODI’s mission including Congressional and consumer inquiries and requests for information. Correspondence volumes have increased since calendar year 2009 with a huge spike in activity in 2010 during the Toyota UA recall. Total correspondence in 2009 was 509; the 2014 total exceeded 1,709.

24
The FY 2016 Budget request provides CRD:
• Resources to promote improved coordination with ODI investigative divisions for correspondence responses requiring technical analysis;
• Resources to promote improved investigative case management;
• A Program Manager to implement a new standardized process for managing the vast volumes of records produced during the investigative process;
• Additional staff for correspondence, e-mails, and telephone calls, including one supervisor; and
• $500,000 in additional funding for
u document management;
u updated redaction software and scanning; and
u other computing equipment
The New Paradigm greatly improves CRD’s abilities, building on the FY 2016 Budget Request, and will:
• Improve Congressional correspondence;
• Improve coordination with NHTSA’s Governmental Affairs, Public Affairs, Chief Counsel, and Artemis Hotline;
• Improve records managements; and
• Provide $1.5 million in additional funding for
u document management;
u updated redaction software and scanning; and
u other computing equipment

25
New Initiatives
ODI Trend Analysis DivisionNHTSA’s dependency on data increases daily and the more information obtained the greater the need to transform the data into understandable and usable information. NHTSA faces the challenges of managing the complexities of unstructured data, changes in technology, social media data, and data captured in the form of video and natural language. To manage these challenges, ODI needs to establish an ODI trend analysis group, managed by a group of experts in the field of data analytics.
The ODI Trend Analysis Division will segregate workloads, allowing safety experts and engineers to focus more time on trend analysis, predictive analysis, anomalies, findings, and recommendations, and less time on the transformation of data.
In 2012, NHTSA implemented a proof of concept, which is now being expanded, to introduce business intelligence technologies to enhance ODI’s data analysis efforts and to introduce predictive analysis capabilities. The technology platform for this effort is based on the IBM Watson product suite and became NHTSA’s enterprise data analysis solution. The solution, titled the Corporate Information Factory (CIF), was developed to meet the data analytics needs for not only ODI, but for all NHTSA program areas.
A key purpose of the CIF is to manage the data related to automotive complaints as well as to help investigators and screeners determine trends and identify defects. The CIF consists of multiple software programs that make up clusters of complex systems and a data warehouse. These systems are built to give engineers and investigators an enhanced capability to quickly identify safety defects trends before they cause injuries or claim lives. The CIF is an intelligent toolset that can link data from multiple sources both internal and external to NHTSA, such as vehicle owner complaints, police reports, crash investigation data, and even social media type data. Once data is integrated, it can be mined to identify associations and help detect patterns. However, the toolset is a technology and trained staff must govern and administer the CIF to provide usable information that drives agency decision making and to give consumers the safety information they need.
FY 2016 Budget Request This request provides a team of data analyst experts to align with ODI divisions and share the workload necessary to detect defects. However, the majority of the responsibilities will remain in the hands of ODI engineers and investigators. This includes a request for one (1) Data Scientist to manage the program, provide data analytics and predictive guidance, maintain a portion of information technology governance, align technology with business need, manage Excellence Center resources, maintain records of decisions, and adopt improved data resources, documentation, and meta data management. The

26
expanded team would also include data analysts to address data preparation, processing, extraction, transformation, cleansing, data store management, data mining, data sharing linkage, data warehousing, toolset user training, dashboards, and reporting.
To establish the program, ODI will need $11.3 million, and to host the program annually, it will need $2 million.
New Paradigm This option provides a full team of data analytics experts to align with ODI divisions to help increase the identification of trends and defects while reducing screening and investigation times. It maximizes the opportunities to free up safety experts, engineers and investigators from data analytics to help them focus on data collection, interpretation, anomaly detection, trend analysis, pattern detection, predictive analysis, findings, recommendations, and the investigations.
Defects Investigation SupportThe information above describes the work and resource needs of each of ODI’s divisions, as well as the proposed Trend Analysis Division, but ODI is more than the sum of its parts. Certain functions of ODI cut across all of the divisions, such as communications, training, and software support. Under the new model, ODI would have personnel and funding to fill these cross-cutting duties so that the individual divisions can focus on their mission-critical activities. The following new or additional resources would be funded:
• A cadre of field investigators ready to travel on a moment’s notice to an accident site to begin an investi-gation as close in time to the accident or incident as possible so that critical evidence is preserved. This NTSB-like “Go Team” would comprise contractor employees trained in defects investigations and crash reconstruction. They would investigate any incident involving allegations of a potential defect, fire, con-trol loss or other incident with a potential for high-severity consequences.
• A stable of ODI Investigation Coordinators who would assist other NHTSA offices, such as Public Affairs, Government Affairs, and Chief Counsel by providing information, documents, and data to enable these offices to respond to inquiries that come to NHTSA from outside sources. The Investigation Coordinators would have both excellent technical and communications skills and also work to answer questions that come through ODI’s Hotline and respond to FOIA requests. Handling these very import-ant administrative duties would free ODI engineers and investigators to focus solely on their technical work, allowing investigations to be opened and completed more quickly. Likewise, recall analysts would be able to provide more thorough oversight of recalls, remedies, and recall completion rates.
27
Utilizing resources available at NHTSA’s own Vehicle Research and Test Center (VRTC), additional personnel and testing would support defects investigations and recalls. With this lab already in place, additional funding and testing engineers would permit more investigative testing to advance identification of, and develop credible data about, safety defects that warrant a recall. Engineers and technicians at VRTC could provide research and data analysis of information from manufacturers, VOQs, and other sources. They could provide test analysis (failure tests, durability tests, forensic tests, and peer tests) to confirm how specific vehicles, components, and their technologies function and fail. They could also conduct field inspections and interviews. Additional funding would also be provided for training of ODI and VRTC staff on developing technologies and testing procedures.
Office of the Chief Counsel
Current Workload and Value of Additional ResourcesNHTSA’s enforcement attorneys play a vital role in the enforcement process. NHTSA’s Office of Chief Counsel (NCC) provides legal advice and works with ODI staff to carry out enforcement actions. NHTSA’s enforcement attorneys represent the agency and defend ODI’s factual findings and assessments against challenges by the automotive industry, including defending the agency before the courts or other administrative tribunals. They provide additional assistance by assessing the legal sufficiency of the investigation and whether a safety-related defect exists, and devising strategy recommendations for achieving the goals of the agency.
Enforcement attorneys work directly with ODI to assess whether factual bases exist to support an assessment of civil penalties, such as in timeliness queries, evaluating whether a manufacturer has notified NHTSA of the existence of a safety-related defect in a timely manner. They must review and assess frequent requests from manufacturers to protect certain data as confidential business information. They also take the lead in resolution of disputes, including advising agency leadership on legal strategies and options for resolution, and negotiating the terms of settlements and consent orders.
As ODI’s workload increases, so does that of the Office of Chief Counsel. The FY 2016 Budget request provides additional legal staff to assist in defects investigations and recalls, as well as $500,000 for:
• document management and review software;
• contractor assistance for processing large document productions;
• travel in conjunction with field investigations; and
• additional training.

28
The realization of the New Paradigm will mean additional staff needed for NCC to provide appropriate legal support. Additionally, it will require $2 million for document management, contractor assistance, and training.
ConclusionNHTSA will continually seek ways to improve its ability to prevent injuries and fatalities on the Nation’s roadways. In light of recent high-profile GM recalls, NHTSA took a hard look at its processes and practices, and identified specific areas for improvement.
The workforce assessment explains the resource augmentation needed to ensure NHTSA’s ability to implement those strategic improvements. The assessment was acted upon immediately, as illustrated in the FY 2016 Budget request. The request provides limited, but effective immediate improvements to NHTSA’s defects investigations program.
Listening to the Congress and the American people, NHTSA also looked outside its own agency to explore other investigative models, resulting in a long-term strategic approach that marks a new paradigm for NHTSA’s defects program. NHTSA believes that realization of this model will position the agency to better identify recalls and remove unsafe vehicles from the nation’s roadways more quickly and effectively. By significantly improving NHTSA’s ability to identify defects, manufacturers will be held to a higher level of accountability, resulting in safer vehicles and fewer recalls in the future.

29
Appendices
Appendix A: Staffing Recommendations by ODI Division
Detailed Staffing Recommendations NeedsThe FY 2016 and the New Paradigm models build on current staffing and resources needs, and are therefore additive.
Defect Assessment Division
Current = 9* FY 2016 (+11) New Paradigm (+42)
4 Defects Engineers 4 General Engineers 12 General Engineers
4 Defects Specialists 5 Safety Defects Specialist 18 Safety Defects Specialists
1 Division Chief 2 Supervisory Safety specialists to man-age additional personnel, budget, and
oversee mission effectiveness
4 Supervisory Safety Specialists
4 FTEs dedicated to special projects and ad hoc screening analyses
4 Administrative Assistants
*Plus 5 contractor employees who provide data analysis, documentation support, and outreach
Early Warning Division
Current = 4* FY 2016 (+11) New Paradigm (+39)
3 Safety Defects Analysts (1 supervisory)
5 Safety Defects Analysts for additional Death Inquiry report analysis and car seat issues
20 Safety Defects Analysts for additional DI report analysis and car
seat issues (1 supervisory)
1 Statistician 2 Statisticians for TREAD statistical analysis
10 Statisticians for TREAD statistical analysis (1 supervisory)
2 Safety Defects Analysts to conduct audits and ensure TREAD compliance
5 Safety Defects Analysts to conduct audits and ensure TREAD compliance
1 Records manager 2 Records manager
1 Supervisory Division Chief 4 Administrative Assistants
2 FTEs for special projects and ad hoc screening analyses
1 Administrative Assistants
* Supplemented by eleven (11) contractor employees who conduct data analysis, documentation support, outreach campaign work, and compliance helpdesk support

30
Vehicle Control Division
Current = 6 FY 2016 (+12) New Paradigm (+53)
4 Engineers 2 Electrical Engineer to focus on vehicle dynamics issues and investigations
8 Electrical Engineer to focus on vehicle dynamics issues and investigations
1 Investigation Analyst 4 Mechanical Engineers to focus on vehicle dynamics issues and investigations
16 Mechanical Engineers to focus on vehicle dynamics issues and investigations
1 Division Chief 4 Electrical Engineers responsible for emerging technology such as active
safety systems
16 Electrical Engineers responsible for emerging technology such as active
safety systems
1 Division Chiefs 5 Division Chiefs
1 Administrative Assistants to assist VCD management and staff
4 Administrative Assistants
4 FTEs dedicated to special projects and ad hoc engineering analysis
Vehicle Integrity Division
Current = 7 FY 2016 (+9) New Paradigm (+34)
4 Engineers 6 General Engineers to conduct and manage defect investigations involving safety critical
systems and crashworthiness issues
24 General Engineers to conduct and manage defect investigations involving safety critical
systems and crashworthiness issues
1 Investigation Analyst 1 FTE dedicated to special projects and ad hoc engineering analysis
3 FTE dedicated to special projects and ad hoc engineering analysis
1 Safety Defects Specialist 1Administrative Assistant 3 Administrative Assistants
1 Division Chief 1 Division Chiefs 4 Division Chiefs
31
Business Process & Workforce Assessment of NHTSAs Office of Defects Investigation
For ODI Internal Use Only DTNH22-13-C-00318 i
Placeholder for Cover
32
Business Process & Workforce Assessment of NHTSAs Office of Defects Investigation
For ODI Internal Use Only DTNH22-13-C-00318 i
Table of Contents 1.0 Background & Summary .................................................................................................................................... 1
2.0 Results of the Organizational Review ................................................................................................................ 3
2.1 Organization Structure and Functions ........................................................................................................... 3
3.0 Processes and Performance Measures ................................................................................................................ 8
3.1 Pre-Investigations (Screening) ...................................................................................................................... 8
3.2 Investigations ................................................................................................................................................. 9
3.3 Recall Management ..................................................................................................................................... 14
4.0 Findings of the Gap Analysis ........................................................................................................................... 18
5.0 Revised ODI Training Plan .............................................................................................................................. 19
6.0 Recommendations ............................................................................................................................................ 21
Exhibits ..................................................................................................................................................................... 23
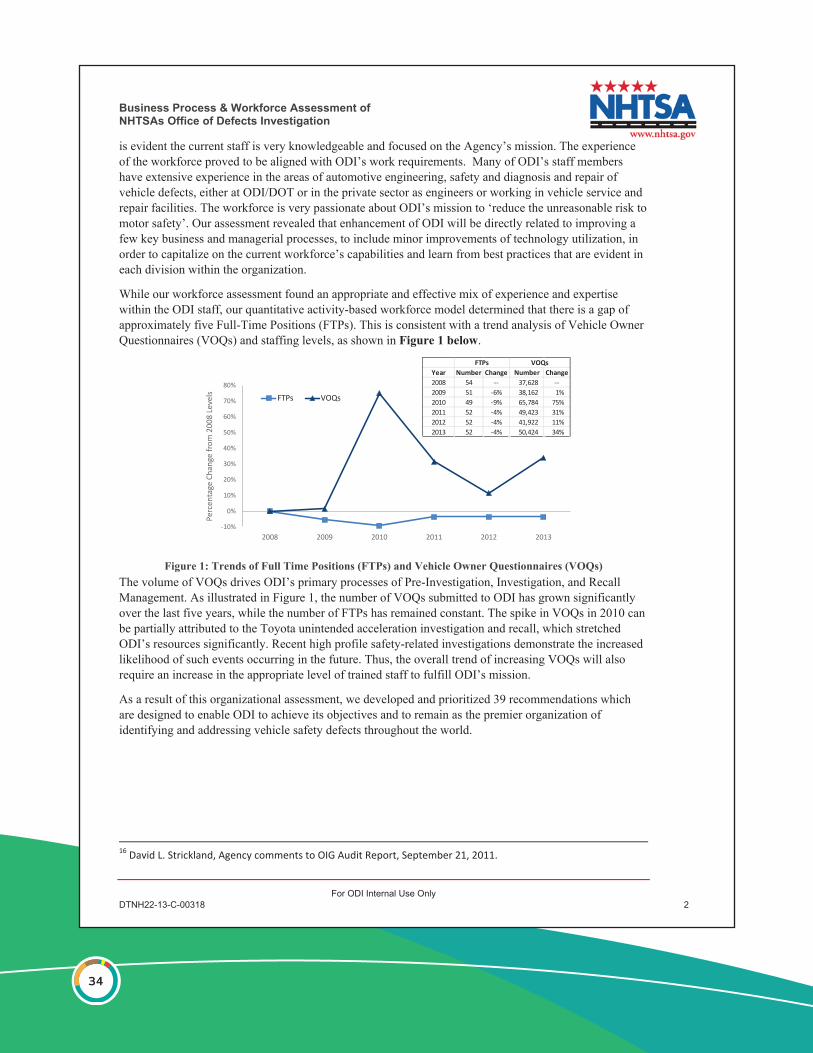
List of Figures Figure 1: Trends of Full Time Positions (FTPs) and Vehicle Owner Questionnaires (VOQs) ..................... 2
Figure 2: Parent IE to PE Open (Days) ...................................................................................................................... 9
Figure 3: CY13 Completion Times .......................................................................................................................... 10
Figure 4: CY13 PE Workflow by Month ................................................................................................................ 11
Figure 5: Hypothetical PE Completion Distribution ............................................................................................. 12
Figure 6: PE Completion Times by Type and Division ....................................................................................... 13
Figure 7: CY13 RCAK Response Time .................................................................................................................. 15
Figure 8: CY13 Weekly 573 reports Received ...................................................................................................... 15
Figure 9: CY13 "Pre-Shutdown" RCAK Response Time and 573 report Work in Process ......................... 16
Figure 10: CY13 "Pre-Shutdown" RCAK Response Time vs. 573 Work in Process .................................... 16
Figure 11: Ranking of Recommendations ............................................................................................................... 22
List of Tables Table 1: Results of Activity-Based Workforce Model ................................................................................5
Table 2: Relationship Between WIP, ACR, and Completion Time ..........................................................11
Table 3: Estimated Breakdown of ODI Resources ...................................................................................14
Table 4: Results of Activity-Based Workforce Model ..............................................................................17
Table 5: Recommendations ........................................................................................................................22

33
Business Process & Workforce Assessment of NHTSAs Office of Defects Investigation
For ODI Internal Use Only DTNH22-13-C-00318 1
1.0 Background & Summary The Department of Transportation (DOT) Office of Inspector General (OIG) conducted an audit of the National Highway Traffic Safety Administration’s (NHTSA) Office of Defects Investigation (ODI) and produced a report outlining a list of process improvements needed for identifying and addressing vehicle safety defects. The report, dated October 6, 2011, contained ten recommendations, including the recommendation that ODI undertake a workforce assessment to determine staffing needs and specialized skill sets required for ensuring timely implementation of ODI objectives. Another recommendation was that ODI develop a formal training plan. In response to these recommendations, ODI stated it would expand these recommendations to not only assess its staffing and training needs, but to also assess its business processes, performance metrics, and utilization of technology. In July 2013, ProSource360 Consulting Services Inc. (ProSource360) began the effort to review and update the training plan and perform the business process and workforce assessment of ODI. This Final Report summarizes ProSource360’s assessment, to include two additional documents produced as a result of this effort; a revised training plan, and an integrated gap analysis and maturity model.
To complete the workforce assessment, we developed questionnaires, interviewed ODI staff and contractors, analyzed workflow data and documents associated with past investigations archived within ODI’s records management tool, Artemis, and facilitated working sessions to uncover the root causes of business process inefficiencies, specifically in the area of Investigations and Recall Management. We also interviewed representatives from Transport Canada’s Defect Investigations and Recalls Division (DIR)14. The effort to revise the training plan included interviews with Division Chiefs and various staff representing each division to determine training gaps, needs, and requirements of each division.
As a framework to guide the organizational review, two commonly accepted practices were used: a business excellence maturity model and, an activity-based workforce-planning model. Maturity models are typically used for describing best-in-class or leading practices for a set of organizational functions, or dimensions, allowing the Agency to develop specific, actionable recommendations enabling business excellence. In this work, descriptions for four levels of increasing business excellence maturity were developed for each dimension. Each dimension was then scored to determine the Agency’s current level. [Note that the current state maturity score is not of primary importance; what is important is the development and prioritization of recommendations to enhance the Agency’s business excellence.]
Activity-based workforce models break down the Agency’s critical business processes into individual activities. The estimated resources (people) for each activity are calculated for the current state to establish a baseline. The activity-based model can then be used to estimate the quantity of resources with specific skill sets required to ensure that ODI meets its objectives. In addition, the model will help quantitatively drive Business Process Improvement (BPI) initiatives by focusing on those activities that consume higher levels of resources, and those activities that consume critical resources.
Combining the activity-based workforce model with the enhanced training plan and the appropriate strategic portions of DOT’s Workforce Planning Guide15 will create an enhanced ODI Workforce planning system.
As noted by the NHTSA Administrator, “ODI investigative staff is steeped with an average of nearly 25 years of automotive or investigative experience.”16 In our qualitative assessment of ODI’s workforce, it 14 DIR is a division in the Road Safety and Motor Vehicle Regulation Directorate. 15 DOT Human Capital Management, Guide to Workforce Planning, Revised June 2008.
34
Business Process & Workforce Assessment of NHTSAs Office of Defects Investigation
For ODI Internal Use Only DTNH22-13-C-00318 2
is evident the current staff is very knowledgeable and focused on the Agency’s mission. The experience of the workforce proved to be aligned with ODI’s work requirements. Many of ODI’s staff members have extensive experience in the areas of automotive engineering, safety and diagnosis and repair of vehicle defects, either at ODI/DOT or in the private sector as engineers or working in vehicle service and repair facilities. The workforce is very passionate about ODI’s mission to ‘reduce the unreasonable risk to motor safety’. Our assessment revealed that enhancement of ODI will be directly related to improving a few key business and managerial processes, to include minor improvements of technology utilization, in order to capitalize on the current workforce’s capabilities and learn from best practices that are evident in each division within the organization.
While our workforce assessment found an appropriate and effective mix of experience and expertise within the ODI staff, our quantitative activity-based workforce model determined that there is a gap of approximately five Full-Time Positions (FTPs). This is consistent with a trend analysis of Vehicle Owner Questionnaires (VOQs) and staffing levels, as shown in Figure 1 below.
Figure 1: Trends of Full Time Positions (FTPs) and Vehicle Owner Questionnaires (VOQs) The volume of VOQs drives ODI’s primary processes of Pre-Investigation, Investigation, and Recall Management. As illustrated in Figure 1, the number of VOQs submitted to ODI has grown significantly over the last five years, while the number of FTPs has remained constant. The spike in VOQs in 2010 can be partially attributed to the Toyota unintended acceleration investigation and recall, which stretched ODI’s resources significantly. Recent high profile safety-related investigations demonstrate the increased likelihood of such events occurring in the future. Thus, the overall trend of increasing VOQs will also require an increase in the appropriate level of trained staff to fulfill ODI’s mission.
As a result of this organizational assessment, we developed and prioritized 39 recommendations which are designed to enable ODI to achieve its objectives and to remain as the premier organization of identifying and addressing vehicle safety defects throughout the world.
16 David L. Strickland, Agency comments to OIG Audit Report, September 21, 2011.
-10%
0%
10%
20%
30%
40%
50%
60%
70%
80%
2008 2009 2010 2011 2012 2013
Perc
enta
ge C
hang
e fr
om 2
008
Leve
ls FTPs VOQs
Year Number Change Number Change2008 54 -- 37,628 --2009 51 -6% 38,162 1%2010 49 -9% 65,784 75%2011 52 -4% 49,423 31%2012 52 -4% 41,922 11%2013 52 -4% 50,424 34%
FTPs VOQs

35
Business Process & Workforce Assessment of NHTSAs Office of Defects Investigation
For ODI Internal Use Only DTNH22-13-C-00318 3
2.0 Results of the Organizational Review The scope of our organizational review included four focus areas:
The organizational structure of ODI The functions of the divisions within the organizational structure The business processes which support ODI’s mission The current performance measures of the business processes
Specifically, we conducted a detailed examination of how ODI’s organizational structure and functions are connected to, and enable, its business processes and performance metrics.
In our review of ODI’s organizational structure and functions, we applied a maturity model framework and created an activity-based workforce model to quantify the functions within the organizational structure. Maturity models are typically used for describing best-in-class or leading practices, allowing the organization to develop specific, actionable recommendations enabling business excellence. The use of a maturity model allows an organization to have its methods and processes assessed according to management best practice, against a clear set of external benchmarks.
Activity-based workforce models partition the Agency’s critical business processes into individual activities. The estimated resources (people) required for each individual activity is determined by multiplying the current effort (time) to perform the activity by the number of times the activity is performed in a given time frame. The individual activities are then regrouped to estimate the number of required resources to perform the business processes in their current state. In addition to the activity-based workforce model, we evaluated the DOT’s Workforce Planning Guide to determine what aspect of it should be initially incorporated into ODI’s workforce planning system.
To assess ODI’s business processes and performance metrics, ProSource360 combined staff interviews with an analysis of historical data contained within the case files archived in ODI’s electronic database, Artemis. We focused our analysis on more recent cases to assure that we were evaluating current processes. To determine the performance metrics of the Preliminary Evaluations (PEs), for example, we analyzed a set of 61 PEs, which were in process in calendar year 2013.
2.1 Organization Structure and Functions In response to the OIG report of October 6, 2011, ODI contracted ProSource360 to assess administrative strengths, i.e., supervision and development of staff, risk management coordination and practices, organizational structure, staff work assignments, staffing skill levels, process flows and use of technology, and to identify areas requiring improvement and/or modifications. A maturity model methodology was used as a framework to help guide the assessment of these organizational elements. The maturity model used in the current work was organized within two interconnected business excellence criteria: (1) workforce performance and, (2) organizational effectiveness. Each of these business excellence criteria contained a list of standard organizational dimensions to describe ODI’s practices. Each dimension was mapped to the elements identified in the work statement, as shown in Exhibit A (p. 25). Each dimension contained a description of a typical Agency’s practice at four levels of increasing maturity. In this work, the descriptions were chosen from a relevant list of best practice maturity models based on generally accepted organizational theory, as used in the assessments of other federal agencies. These descriptions were then adapted as required to maximize their effectiveness in ODI’s maturity model. The descriptions are shown in Exhibit B (p. 26). Each dimension also includes a list of questions

36
Business Process & Workforce Assessment of NHTSAs Office of Defects Investigation
For ODI Internal Use Only DTNH22-13-C-00318 4
to help identify ODI’s current maturity level for each dimension. These questions are shown in Exhibit C (p. 29).
The award of a particular maturity level indicates the business excellence maturity rating. In this assessment, the maturity level for each dimension was evaluated in two ways: (1) through interviews of a cross-section of ODI staff by ProSource360 consultants; and (2) through an anonymous survey of the full ODI staff. Roughly 50% of the staff participated in the survey, providing a statistically valid sample. The results are shown in Exhibit D (p. 31). The results of this maturity model analysis indicate ODI’s performance and effectiveness are very good, especially in critical areas such as Strategic Vision and Risk Management. The specific observations are listed in Exhibit E (p. 32).
As previously stated, the use of a maturity model allows an organization to have its methods and processes assessed according to management best practice, against a clear set of external benchmarks, allowing the organization to develop specific, actionable recommendations enabling business excellence. Thus, it is important to note that the current state maturity score is not of primary importance; what is important is the development and prioritization of recommendations to enhance the Agency’s business excellence, based on clearly identified benchmarks. The recommendations resulting from this maturity model methodology are listed in Exhibit F (p. 34). Note that these results are integrated with those resulting from the gap analysis (summarized later in this report), and the full set of recommendations are then prioritized and listed in the results section of this document.
The development of an activity-based workforce model was used to help assess the functional assignments and staffing levels required for ODI to perform current duties. Further, per the recommendation by the OIG, we evaluated the applicability of the DOT’s Workforce Planning Guide to ODI’s processes and determined that the strategic elements within the assignment and action portion of their framework will augment the effectiveness of the workforce model.
ODI’s mission statement is to “save lives by eliminating vehicle/equipment defects that pose an unreasonable risk to motor vehicle safety.” This mission cascades from NHTSA’s mission which is “dedicated to achieving highest standards of excellence in motor vehicle and highway safety.” ODI’s workforce process/business unit includes the following list of divisions:
Defects Assessment (Screening)
Early Warning
Investigative (Vehicle Integrity, Vehicle Control, Medium and Heavy Duty)
Recall Management
Correspondence Research
After a series of interviews and meetings with several employees within ODI’s seven divisions, we identified, captured, and placed all activities that were performed on a daily basis into the activity-based workforce model. We also captured and included various activities performed by ODI’s contractor support; BLF Technologies (BLF) of Alexandria, Virginia. In specific divisions, there are process activities that are commonly shared and conducted. For example VID, VCD, and MHDVD perform many similar investigative activities.
ODI Mission
Save lives by eliminating vehicle/equipment defects that pose an unreasonable risk to motor safety Identify defects that relate to motor vehicle safety Assure that defects are remedied promptly and
effectively Assure that information relating to investigations
and recalls is readily available to the public

37
Business Process & Workforce Assessment of NHTSAs Office of Defects Investigation
For ODI Internal Use Only DTNH22-13-C-00318 5
ODI currently has fifty-one employees listed and shared across its seven divisions. In alignment with the scope of ODI and its mission, each division is headed by a chief who reports to the ODI director in its organizational hierarchy. ODI also utilizes contractor support, BLF, to assist with its voluminous document management process.
The introduction of an activity-based workforce model listing the primary activities performed within ODI enables the Agency to have a snapshot of all functions that are performed and aligns them to the appropriate divisions. This model is designed to estimate the required number of FTPs needed to perform these activities across ODI’s divisions. The important variables in this model are the level of effort (LOE) required in performing these listed activities and the workload for each activity17. The results of the activity-based model are shown in here in Table 1. A more detailed summary of the methodology and the results are shown in Exhibit G (p. 36). The model results are compared to an actual adjusted FTP18 value to identify any possible gap in the number of staff required. Note that the model includes only primary activities, so those positions which do not contribute significantly to the listed activities are not included in the actual adjusted FTP calculation. The positions not tracked in the activity-based model include the Division Chiefs, the Director’s Administrative Staff Assistant, as well as ODI staff that perform assignments and lead projects that while may be critical, are not defined as primary for purposes of this assessment. .
As Table 1 demonstrates, this workforce model can be used to estimate the impact of spikes in the workload on available resources, and enables a more precise estimation of the number of staff required to ensure that ODI meets its objectives. For example, the analysis indicates that while VID and VDC together have sufficient personnel for the timely completion of a nominal amount of investigative activities (the adjusted FTP value of 9.6 is greater than the calculated nominal value of 8.7 investigators), the typical peak workload can require a significant increase in resources; the model estimates as many as 15 VID/VCD investigators are required to handle the observed spikes in the workload using the existing processes.
Observations indicate that in approximately 20% of the months in each calendar year, ODI’s workload reach these peak values. Appling this factor to the difference between the peak workload FTP requirement and the current adjusted FTP value indicates that ODI has an approximate workforce gap of 5 FTPs:
17 The LOE is categorized by a triangular distribution of low, medium, and high values. The workloads are based on monthly volumes, both nominal and peak values. 18 As shown in Exhibit G, Division-specific availability factors ranging from 50% to 90% are applied to account for time spent on ancillary activities, such as responding to media inquiries, FOIA requests, training and working on special projects. A lower availability factor indicates that collectively a Division’s resources have less time available to perform the activities listed in the model due to these ancillary activities.
Division Actual
Adjusted FTP
WF Model: Nominal Workload
WF Model: Peak
Workload
DAD 6.4 6.0 8.7
VID/VCD 9.6 8.7 15.0
MHDVD 4.8 4.4 8.7
RMD 3.0 3.3 5.5
CRD 3.6 3.7 7.2
EWD 3.2 3.8 6.1
Admin 1.5 1.4 2.9
Total 32.1 31.3 54.1
Table 1: Results of Activity-Based Workforce Model

38
Business Process & Workforce Assessment of NHTSAs Office of Defects Investigation
For ODI Internal Use Only DTNH22-13-C-00318 6
The model can also be used to identify those activities which are impacted most by workload spikes, leading to targeted process improvement actions. Such countermeasures could include process redesign or proactive cross-training to create additional in-house surge capacity, or additional personnel tasked with non-investigative or ancillary duties.
The DOT Workforce Planning Guide illustrates the agency’s use of its resources, and when and where these resources are appropriately needed to maximize efficient productivity. The DOT Workforce Planning Cycle is shown in Exhibit H (p. 40). The Guide also assures that the agency uses properly skilled people who are willing to work towards promoting and supporting its mission. An assessment of ODI’s workforce planning indicates that ODI’s seven divisions support its mission-critical objectives (MCOs). The skillsets available across ODI’s division include industry-wide automotive technical experts, electrical and mechanical engineers, recall analysts, and analytical writers. Although ODI successfully implemented strategies that outline activities for personnel, which is in accordance with the Build Framework portion of DOT’s Workforce Planning Cycle (see Exhibit H), these delineations are not unanimously followed.
To augment the activity-based workforce-planning model, we recommend that ODI initially incorporate three modules within the Assignment and Action section of the DOT’s workforce planning framework into their planning activities, namely:
Conduct Supply Analysis
Conduct Demand Analysis
Develop Gap Analysis
Conducting a Supply Analysis will answer the following two questions:
• Who works for the organization today? • To what extent do people with the required skills exist in the organization’s workforce?
Currently, ODI has not conducted a Supply Analysis to determine the adequate amount of staff it needs to fulfill its goals. Guidelines and templates with actionable steps in conducting a Supply Analysis can be found in the DOT workforce planning. In conducting a Supply Analysis, ODI would need to implement the actions listed below and create /utilize the following suggested templates:
Workforce Profile: A “snapshot” answering, “Who works for the OA now? Age Distribution Eligibility for Retirement Turnover (Competencies) Mission Critical Occupations (MCOs) Diversity
Another critical module in the workforce planning cycle is conducting the Demand Analysis. The Demand Analysis itemizes the functions ODI will need to perform in order to accomplish its strategic mission. ODI should implement the use of the Demand Analysis worksheet of the DOT Workforce Planning Guide, which is also shown in Exhibit H on page 40.
The final step in this procedure is to perform a Gap Analysis. This step compares the demand and supply data to determine the gap or surplus situation that could exist in future years. This analysis will
0.20 𝑥𝑥𝑥𝑥 (54.1 − 32.1) = 4.4 ≅ 5 𝐹𝐹𝐹𝐹𝐹𝐹𝐹𝐹𝐹𝐹𝐹𝐹𝐹𝐹𝐹𝐹
39
Business Process & Workforce Assessment of NHTSAs Office of Defects Investigation
For ODI Internal Use Only DTNH22-13-C-00318 7
identify gaps in critical skills and in the at-risk occupations by estimating the possible undersupply of people with critical characteristics in the workforce (the projected future inventory). Once the gaps have been identified, they can be prioritized based on the following questions:
• What critical workforce characteristics will the organization need in the future to accomplish its strategic intent, and what is the desired distribution of these characteristics?
• What is the distribution, in today’s workforce, of the workforce characteristics needed for the future?
• If ODI maintains current policies and programs, what distribution of characteristics will the future workforce possess?
• What changes to human resource management policies and practices and other actions will alleviate gaps between the future desired distribution and the projected future inventory?
40
Business Process & Workforce Assessment of NHTSAs Office of Defects Investigation
For ODI Internal Use Only DTNH22-13-C-00318 8
3.0 Processes and Performance Measures Recalls are necessary when a motor vehicle or item of motor vehicle equipment (including tires) contains a defect or does not comply with a Federal Motor Vehicle Safety Standard. It is the task of the ODI team to proactively identify these potential safety risks by:
Screening complaints Managing each investigative case to validate each safety risk which is identified Monitoring the manufacturer’s corrective action to ensure successful completion of a
recall campaign when a recall is initiated This requires a high performing team with a wide range of knowledge, including automotive technology, data analysis, legal and project management.
Our assessment focused on the primary business processes which drive ODI’s mission: pre-investigations and screening; investigations; and recall management. A process map of these primary processes is shown in Exhibit I (p. 42). In addition to these processes, ODI provides several other important services to the public including: responding to Congressional letters and inquiries; responding to media inquiries regarding automotive safety risks and investigations; conducting special projects; supporting rulemaking activities; and, responding to Freedom of Information Act (FOIA) requests. These important ancillary activities are critical to the success of ODI’s mission. The next parts of our assessment cover the processes and performance measures of the investigative and recall management aspects of ODI’s mission.
3.1 Pre-Investigations (Screening) 3.1.1. Early Warning Division
ODI’s first critical step in the identification and mitigation of motor vehicle safety-related defects is finding and prioritizing those potential defects which require further investigation. These activities are the primary focus of the Defects Analysis Division (DAD) and the Early Warning Division (EWD). EWD was created as a result of the Transportation Recall Enhancement, Accountability and Documentation (TREAD) Act of 2000, and is responsible for the statistical trend analysis of data supplied quarterly by manufacturers as mandated by the TREAD Act. Manufacturers of vehicles, equipment and child restraints are required to report quarterly aggregate counts of death and injury claims and notices, property damage claims, consumer complaints, warranty claims, and dealer, fleet and field reports. They must also submit actual copies of non-dealer field reports. A variety of different statistical methods are used to analyze this huge volume of data. EWD also routinely asks manufacturers for the actual content of some death and injury and other records. The quarterly analyses produced by EWD not only meets the requirements of the TREAD Act, but are also sent, when appropriate, to DAD to be included in their pre-investigation work.
Our assessment of EWD’s process indicates that no process improvement activities are warranted at this time. EWD is a best practice example of using technology to drive process performance. As discussed in later sections of our Report, a significant opportunity for ODI is improving the timely completion of defect investigations (Preliminary Evaluations (PEs) and Engineering Analyses (EAs)). Once the throughput of investigations is improved, the demand for more safety defects to investigate will increase, which will drive the need for an improvement in throughput of the pre-investigation process.

41
Business Process & Workforce Assessment of NHTSAs Office of Defects Investigation
For ODI Internal Use Only DTNH22-13-C-00318 9
3.1.2 Defects Assessment Division
The objective of safety defect screening is to propose new investigative topics to the investigative staff, and DAD’s primary method of pre-investigation is the creation of Issue Evaluations (IEs). DAD Screeners create IEs primarily through trend analysis of complaints submitted by the public, in the form of Vehicle Owner Questionnaires (VOQs). Screeners augment VOQ information by researching the public domain for automotive safety-related news. VOQs are uploaded into Artemis by a contractor, (Telesis), creating a permanent record of the complaints and providing access to the data for the DAD Screeners to perform trend analysis on the potential safety consequences of the complaints. The data is then downloaded into MS Excel or MS Access for subsequent trend analysis. This is an inefficient process, which could be improved with the adaption of a suite of tools from IBM currently in beta testing by DAD personnel. Another possible improvement to the screening process is to expand the use of a database (i.e., MS Access) throughout ODI, as the current use of MS Excel has limited capability to perform the “many-to-one” and “many-to-many” query types typical for analyzing VOQ data.
While these data analysis tools will help improve the pre-investigative process and its ability to identify new investigative topics, additional controls are needed to provide better flow from the Pre-Investigation stage to the Investigation stage.
Also, as indicated in Figure 2 below, there is a large variability in the time from when a PE was opened after the completion of the IE:
Figure 2: Parent IE to PE Open (Days)
To improve the transition from IE to PE, these critical metrics need to be continuously monitored and communicated:
• Proportion of IEs upgraded to PEs • Median number of days opened between IE and PE
Further, this should be the responsibility of a Project Management Office (PMO), to prevent the additional reporting burden from the screeners and investigators, and to assure reporting independence. These metrics should be reported monthly and used to identify corrective actions when required.
3.2 Investigations The timely completion of safety defect investigations is not only a primary objective which cascades directly from ODI’s mission statement; it also influences the performance of other business processes throughout ODI. To assess the current state of ODI’s investigations processes, we interviewed investigative staff to create a current state process map (see Exhibit I), analyzed historical data within
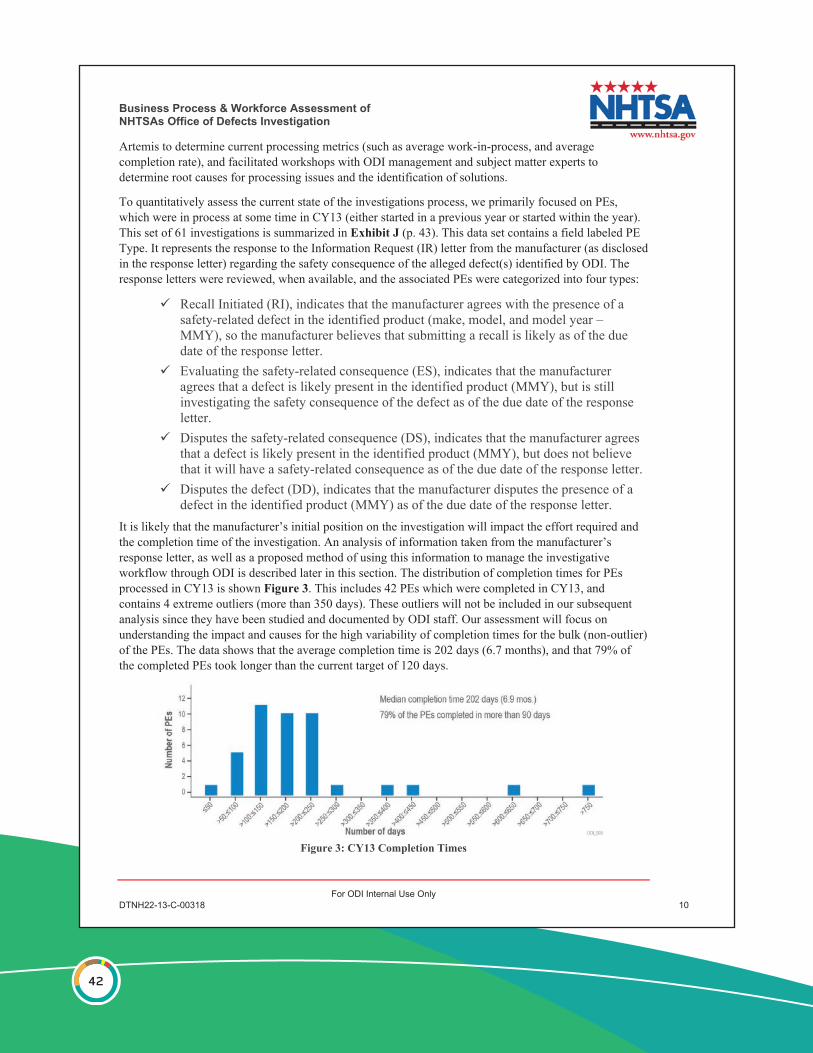
42
Business Process & Workforce Assessment of NHTSAs Office of Defects Investigation
For ODI Internal Use Only DTNH22-13-C-00318 10
Artemis to determine current processing metrics (such as average work-in-process, and average completion rate), and facilitated workshops with ODI management and subject matter experts to determine root causes for processing issues and the identification of solutions.
To quantitatively assess the current state of the investigations process, we primarily focused on PEs, which were in process at some time in CY13 (either started in a previous year or started within the year). This set of 61 investigations is summarized in Exhibit J (p. 43). This data set contains a field labeled PE Type. It represents the response to the Information Request (IR) letter from the manufacturer (as disclosed in the response letter) regarding the safety consequence of the alleged defect(s) identified by ODI. The response letters were reviewed, when available, and the associated PEs were categorized into four types:
Recall Initiated (RI), indicates that the manufacturer agrees with the presence of a safety-related defect in the identified product (make, model, and model year – MMY), so the manufacturer believes that submitting a recall is likely as of the due date of the response letter.
Evaluating the safety-related consequence (ES), indicates that the manufacturer agrees that a defect is likely present in the identified product (MMY), but is still investigating the safety consequence of the defect as of the due date of the response letter.
Disputes the safety-related consequence (DS), indicates that the manufacturer agrees that a defect is likely present in the identified product (MMY), but does not believe that it will have a safety-related consequence as of the due date of the response letter.
Disputes the defect (DD), indicates that the manufacturer disputes the presence of a defect in the identified product (MMY) as of the due date of the response letter.
It is likely that the manufacturer’s initial position on the investigation will impact the effort required and the completion time of the investigation. An analysis of information taken from the manufacturer’s response letter, as well as a proposed method of using this information to manage the investigative workflow through ODI is described later in this section. The distribution of completion times for PEs processed in CY13 is shown Figure 3. This includes 42 PEs which were completed in CY13, and contains 4 extreme outliers (more than 350 days). These outliers will not be included in our subsequent analysis since they have been studied and documented by ODI staff. Our assessment will focus on understanding the impact and causes for the high variability of completion times for the bulk (non-outlier) of the PEs. The data shows that the average completion time is 202 days (6.7 months), and that 79% of the completed PEs took longer than the current target of 120 days.
Figure 3: CY13 Completion Times

43
Business Process & Workforce Assessment of NHTSAs Office of Defects Investigation
For ODI Internal Use Only DTNH22-13-C-00318 11
Figure 4 shows the months that these 42 PEs were closed (in dark blue), along with the number of PEs in process in each month (in light blue). This work-in-process (WIP) is reasonably stable, ranging from 20 to 28 PEs open in any given month, with an average WIP of 24 PEs. The completion rate is less consistent, ranging from 2 to 5 completions each month, with an average completion rate (ACR) of 3.5 PEs per month. Superimposed on the column chart is a line chart showing the median cumulative processing days for all of the PEs in process in each month. This metric allows for a comparison of the processing times of the current WIP to the target completion times. A target completion time of 120 days, for example, would have a target median cumulative process time of 60 days, averaging all the WIP in their various stages of completion. As the chart indicates, this metric has been trending upward since June, coincident with an increase in WIP and a slight decrease in the average completion rate.
Figure 4: CY13 PE Workflow by Month
As shown in Table 2 below, this relationship between WIP, ACR and completion times is predicted by Little’s Law 19(note that for this application, completion time and lead time are synonymous). Note that the calculated average lead time increased in the June to December timeframe, corresponding with the increase in the median cumulative processing days displayed in Figure 3 above.
Time Frame
Average WIP
ACR (PEs/Month)
Avg. Lead Time,
Calculated (Months)
CY13 24.0 3.50 6.9
Jan – May 21.8 3.60 6.1
Jun – Dec 25.6 3.43 7.5
Table 2: Relationship Between WIP, ACR, and Completion Time
Using queuing theory to analyze ODI’s processes enables understanding and control of process throughput, and assists in meeting target metrics, even in an unpredictable environment such as safety defects investigation. This is done by finding the target average PE completion rate by applying capability 19 A theorem in queuing theory, with a proof published by John Little (1961), which states “The long-term average number of customers in a stable system L is equal to the long-term average effective arrival rate, λ, multiplied by the average time a customer spends in the system, W; or expressed algebraically: L = λW.
𝐿𝐿𝐿𝐿𝑒𝑒𝑒𝑒𝑎𝑎𝑎𝑎𝑎𝑎𝑎𝑎 𝐹𝐹𝐹𝐹𝑖𝑖𝑖𝑖𝑖𝑖𝑖𝑖𝑒𝑒𝑒𝑒 = 𝑊𝑊𝑊𝑊𝑊𝑊𝑊𝑊𝑊𝑊𝑊𝑊𝑊𝑊𝑊𝑊 𝐼𝐼𝐼𝐼𝑛𝑛𝑛𝑛 𝐹𝐹𝐹𝐹𝑊𝑊𝑊𝑊𝑊𝑊𝑊𝑊𝑟𝑟𝑟𝑟𝑒𝑒𝑒𝑒𝑒𝑒𝑒𝑒𝑒𝑒𝑒𝑒
𝐴𝐴𝐴𝐴𝐴𝐴𝐴𝐴𝑒𝑒𝑒𝑒𝑊𝑊𝑊𝑊𝑎𝑎𝑎𝑎𝐴𝐴𝐴𝐴𝑒𝑒𝑒𝑒 𝐶𝐶𝐶𝐶𝑊𝑊𝑊𝑊𝑖𝑖𝑖𝑖𝑝𝑝𝑝𝑝𝑙𝑙𝑙𝑙𝑒𝑒𝑒𝑒𝑙𝑙𝑙𝑙𝑖𝑖𝑖𝑖𝑊𝑊𝑊𝑊𝑛𝑛𝑛𝑛 𝑅𝑅𝑅𝑅𝑎𝑎𝑎𝑎𝑙𝑙𝑙𝑙𝑒𝑒𝑒𝑒
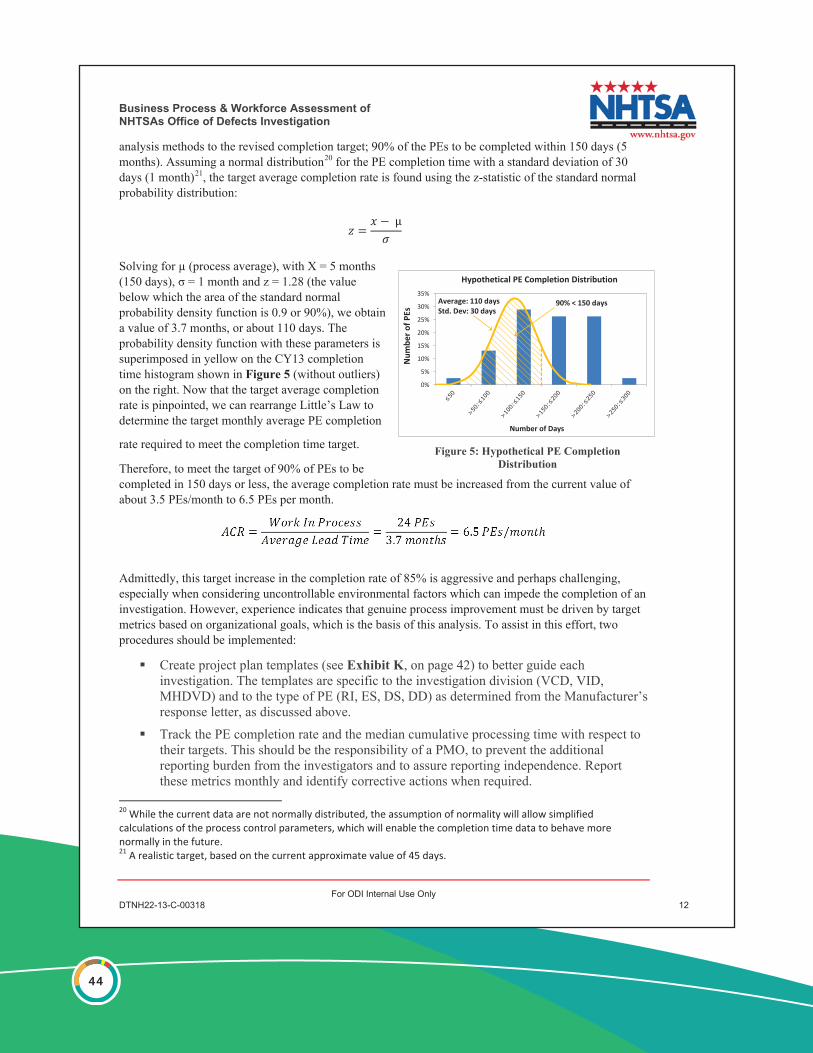
44
Business Process & Workforce Assessment of NHTSAs Office of Defects Investigation
For ODI Internal Use Only DTNH22-13-C-00318 12
analysis methods to the revised completion target; 90% of the PEs to be completed within 150 days (5 months). Assuming a normal distribution20 for the PE completion time with a standard deviation of 30 days (1 month)21, the target average completion rate is found using the z-statistic of the standard normal probability distribution:
Solving for µ (process average), with X = 5 months (150 days), σ = 1 month and z = 1.28 (the value below which the area of the standard normal probability density function is 0.9 or 90%), we obtain a value of 3.7 months, or about 110 days. The probability density function with these parameters is superimposed in yellow on the CY13 completion time histogram shown in Figure 5 (without outliers) on the right. Now that the target average completion rate is pinpointed, we can rearrange Little’s Law to determine the target monthly average PE completion
rate required to meet the completion time target.
Therefore, to meet the target of 90% of PEs to be completed in 150 days or less, the average completion rate must be increased from the current value of about 3.5 PEs/month to 6.5 PEs per month.
Admittedly, this target increase in the completion rate of 85% is aggressive and perhaps challenging, especially when considering uncontrollable environmental factors which can impede the completion of an investigation. However, experience indicates that genuine process improvement must be driven by target metrics based on organizational goals, which is the basis of this analysis. To assist in this effort, two procedures should be implemented:
Create project plan templates (see Exhibit K, on page 42) to better guide each investigation. The templates are specific to the investigation division (VCD, VID, MHDVD) and to the type of PE (RI, ES, DS, DD) as determined from the Manufacturer’s response letter, as discussed above.
Track the PE completion rate and the median cumulative processing time with respect to their targets. This should be the responsibility of a PMO, to prevent the additional reporting burden from the investigators and to assure reporting independence. Report these metrics monthly and identify corrective actions when required.
20 While the current data are not normally distributed, the assumption of normality will allow simplified calculations of the process control parameters, which will enable the completion time data to behave more normally in the future. 21 A realistic target, based on the current approximate value of 45 days.
Figure 5: Hypothetical PE Completion Distribution
𝑧𝑧 =
𝑥𝑥𝑥𝑥 − µ𝜎𝜎
0%
5%
10%
15%
20%
25%
30%
35%
Num
ber o
f PEs
Number of Days
Hypothetical PE Completion Distribution
Average: 110 daysStd. Dev: 30 days
90% < 150 days
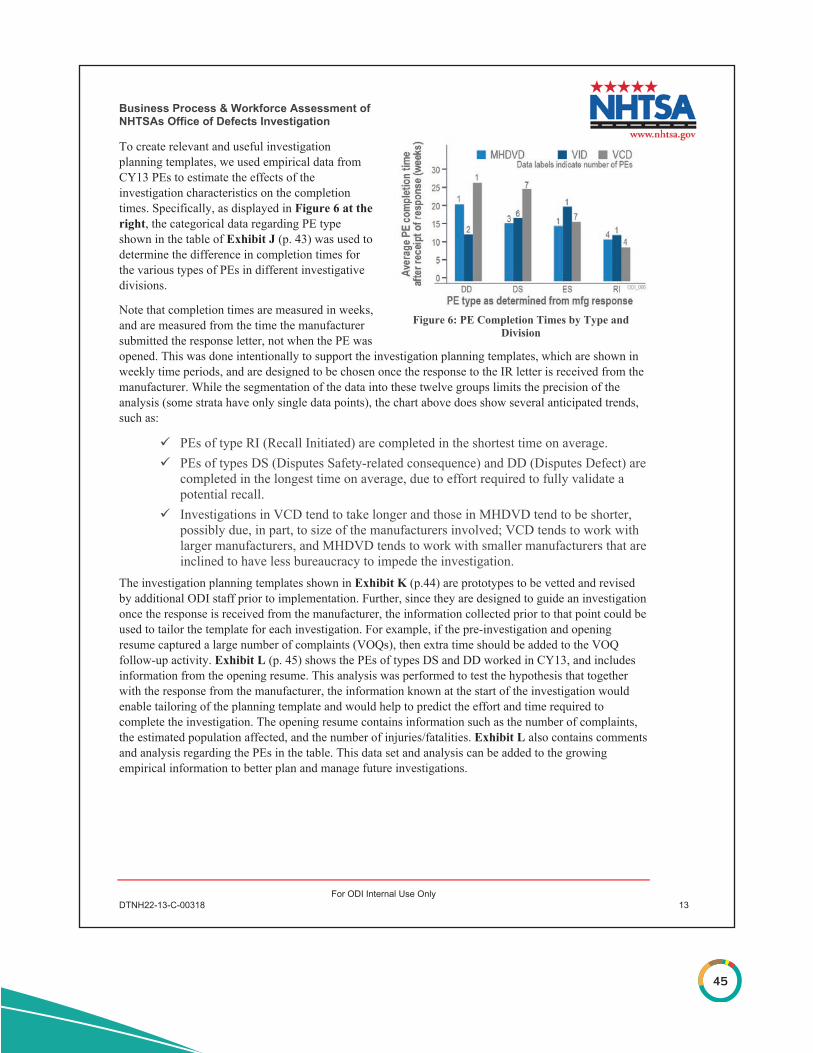
45
Business Process & Workforce Assessment of NHTSAs Office of Defects Investigation
For ODI Internal Use Only DTNH22-13-C-00318 13
To create relevant and useful investigation planning templates, we used empirical data from CY13 PEs to estimate the effects of the investigation characteristics on the completion times. Specifically, as displayed in Figure 6 at the right, the categorical data regarding PE type shown in the table of Exhibit J (p. 43) was used to determine the difference in completion times for the various types of PEs in different investigative divisions.
Note that completion times are measured in weeks, and are measured from the time the manufacturer submitted the response letter, not when the PE was opened. This was done intentionally to support the investigation planning templates, which are shown in weekly time periods, and are designed to be chosen once the response to the IR letter is received from the manufacturer. While the segmentation of the data into these twelve groups limits the precision of the analysis (some strata have only single data points), the chart above does show several anticipated trends, such as:
PEs of type RI (Recall Initiated) are completed in the shortest time on average. PEs of types DS (Disputes Safety-related consequence) and DD (Disputes Defect) are
completed in the longest time on average, due to effort required to fully validate a potential recall.
Investigations in VCD tend to take longer and those in MHDVD tend to be shorter, possibly due, in part, to size of the manufacturers involved; VCD tends to work with larger manufacturers, and MHDVD tends to work with smaller manufacturers that are inclined to have less bureaucracy to impede the investigation.
The investigation planning templates shown in Exhibit K (p.44) are prototypes to be vetted and revised by additional ODI staff prior to implementation. Further, since they are designed to guide an investigation once the response is received from the manufacturer, the information collected prior to that point could be used to tailor the template for each investigation. For example, if the pre-investigation and opening resume captured a large number of complaints (VOQs), then extra time should be added to the VOQ follow-up activity. Exhibit L (p. 45) shows the PEs of types DS and DD worked in CY13, and includes information from the opening resume. This analysis was performed to test the hypothesis that together with the response from the manufacturer, the information known at the start of the investigation would enable tailoring of the planning template and would help to predict the effort and time required to complete the investigation. The opening resume contains information such as the number of complaints, the estimated population affected, and the number of injuries/fatalities. Exhibit L also contains comments and analysis regarding the PEs in the table. This data set and analysis can be added to the growing empirical information to better plan and manage future investigations.
Figure 6: PE Completion Times by Type and
Division
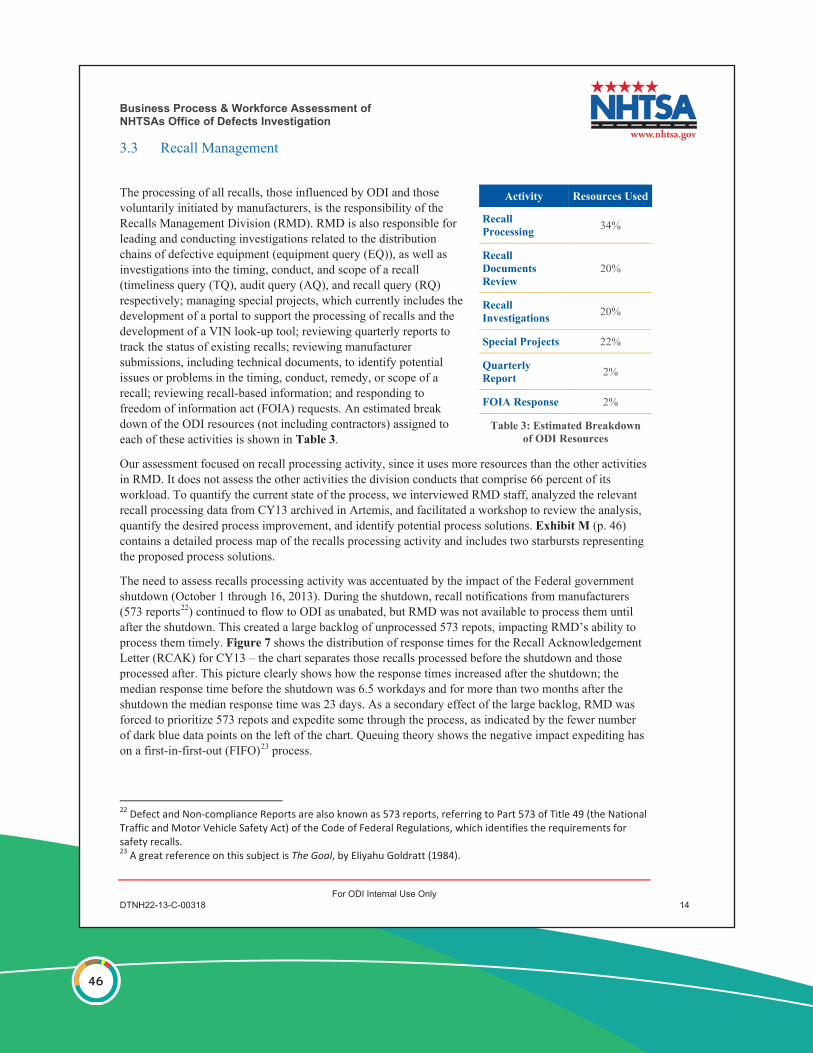
46
Business Process & Workforce Assessment of NHTSAs Office of Defects Investigation
For ODI Internal Use Only DTNH22-13-C-00318 14
3.3 Recall Management
The processing of all recalls, those influenced by ODI and those voluntarily initiated by manufacturers, is the responsibility of the Recalls Management Division (RMD). RMD is also responsible for leading and conducting investigations related to the distribution chains of defective equipment (equipment query (EQ)), as well as investigations into the timing, conduct, and scope of a recall (timeliness query (TQ), audit query (AQ), and recall query (RQ) respectively; managing special projects, which currently includes the development of a portal to support the processing of recalls and the development of a VIN look-up tool; reviewing quarterly reports to track the status of existing recalls; reviewing manufacturer submissions, including technical documents, to identify potential issues or problems in the timing, conduct, remedy, or scope of a recall; reviewing recall-based information; and responding to freedom of information act (FOIA) requests. An estimated break down of the ODI resources (not including contractors) assigned to each of these activities is shown in Table 3.
Our assessment focused on recall processing activity, since it uses more resources than the other activities in RMD. It does not assess the other activities the division conducts that comprise 66 percent of its workload. To quantify the current state of the process, we interviewed RMD staff, analyzed the relevant recall processing data from CY13 archived in Artemis, and facilitated a workshop to review the analysis, quantify the desired process improvement, and identify potential process solutions. Exhibit M (p. 46) contains a detailed process map of the recalls processing activity and includes two starbursts representing the proposed process solutions.
The need to assess recalls processing activity was accentuated by the impact of the Federal government shutdown (October 1 through 16, 2013). During the shutdown, recall notifications from manufacturers (573 reports22) continued to flow to ODI as unabated, but RMD was not available to process them until after the shutdown. This created a large backlog of unprocessed 573 repots, impacting RMD’s ability to process them timely. Figure 7 shows the distribution of response times for the Recall Acknowledgement Letter (RCAK) for CY13 – the chart separates those recalls processed before the shutdown and those processed after. This picture clearly shows how the response times increased after the shutdown; the median response time before the shutdown was 6.5 workdays and for more than two months after the shutdown the median response time was 23 days. As a secondary effect of the large backlog, RMD was forced to prioritize 573 repots and expedite some through the process, as indicated by the fewer number of dark blue data points on the left of the chart. Queuing theory shows the negative impact expediting has on a first-in-first-out (FIFO)23 process.
22 Defect and Non-compliance Reports are also known as 573 reports, referring to Part 573 of Title 49 (the National Traffic and Motor Vehicle Safety Act) of the Code of Federal Regulations, which identifies the requirements for safety recalls. 23 A great reference on this subject is The Goal, by Eliyahu Goldratt (1984).
Activity Resources Used
Recall Processing 34%
Recall Documents Review
20%
Recall Investigations 20%
Special Projects 22%
Quarterly Report 2%
FOIA Response 2%
Table 3: Estimated Breakdown of ODI Resources

47
Business Process & Workforce Assessment of NHTSAs Office of Defects Investigation
For ODI Internal Use Only DTNH22-13-C-00318 15
Figure 7: CY13 RCAK Response Time
Analogous to the case described in the previous section on PEs, this event is explained by Little’s Law; the large increase in the 573 report WIP had a direct impact on lead time (response time of the RCAK) given the nominal completion rate of the process. To confirm this effect, we first looked at the distribution of weekly receipts of 573 reports for all of CY13. This data is shown in Figure 8.
Figure 8: CY13 Weekly 573 reports Received
This data indicates a large variability in the receipt of 573 reports received throughout the year, which means that the WIP changes significantly from week to week, or even day to day. On average, fourteen 573 reports were received per week, but 18% of the time (9 out of 49 weeks) the average increased 100% to twenty-eight. To quantify the effect of the 573 report WIP on the response time of the RCAK, we created the charts below.
In Figure 9, the trends of the average weekly 573 report work in process (or more accurately ‘work in queue’) and the average RCAK response times are shown together. They appear to trend together; the response times increase and decrease with the WIP. To quantify this relationship, the same data is plotted in (x, y) pairs on the scatter chart in Figure 10. This allows for a linear regression analysis; the resultant regression coefficient (R2) of 0.58 can be translated to mean that with this data set, approximately 58% of the variability in the RCAK response time is caused by the variability in the 573 report work in queue. This is a significant contribution, considering that there are other potential sources to account for the remaining variability in the process, such as incomplete information received from the manufacturer (see the process map in Exhibit M on page 46).

48
Business Process & Workforce Assessment of NHTSAs Office of Defects Investigation
For ODI Internal Use Only DTNH22-13-C-00318 16
Figure 9: CY13 "Pre-Shutdown" RCAK Response Time and 573 report Work in Process
Figure 10: CY13 "Pre-Shutdown" RCAK Response Time vs. 573 Work in Process
Our analysis indicates that, unlike the situation described in the previous section on PE completion times, an increase in the average completion rate (ACR) of the process is not a viable solution to improve the RCAK response time. To address this source of process variability, RMD is developing a web portal to allow manufacturers to input information directly into NHTSA’s public website. There is little ODI can do to influence the number of 573 reports submitted on any given day. Thus, to address this inherent challenge, in addition to completing the development of its web portal, we recommend the following:
Test the feasibility of generating a predictive model for the submission of 573 reports, to include the study of the possible correlations between environmental factors (such as industry trends and complaint characteristics) and 573 report volume. The advanced screening techniques developed by DAD and EWD may be useful with such a study. If a predictive model could be produced, RMD would be able to proactively alert additional resources to a potential increase in 573 report demand.
Use the activity-based workforce to identify the number of trained resources needed to support this flexible capacity requirement.

49
Business Process & Workforce Assessment of NHTSAs Office of Defects Investigation
For ODI Internal Use Only DTNH22-13-C-00318 17
Based on the current effort and demand estimations, the results from the activity-based workforce model are shown in Table 4 below.
Activity Effort (minutes) Average
Monthly Workload
Peak Monthly
Workload
Average Personnel
Peak Personnel Low Mediu
m High
Review and process recall request letter from OEMs 20 30 60 58 units 95 units 0.2 0.4
Stamped received and assignment of recall number 10 20 60 58 units 95 units 0.2 0.3
Send notifications to media relations 5 15 30 58 units 95 units 0.1 0.2
Upload in Artemis 5 15 30 58 units 95 units 0.1 0.2
Generates acknowledgement letter 30 60 180 58 units 95 units 0.5 0.8
Review OEMs response to acknowledgement letter 30 60 120 58 units 95 units 0.5 0.8
Publish 573 report to public website 5 15 30 58 units 95 units 0.1 0.2
Upload package into Artemis 5 15 30 58 units 95 units 0.1 0.2
Review OEMs owner notification letter 20 40 90 58 units 95 units 0.3 0.5
Totals: 2.2 3.6
Table 4: Results of Activity-Based Workforce Model A significant result from this analysis is the estimation of additional resources required to meet RMD’s peak demand without impacting the response time of the RCAK. The table above indicates that RMD should implement cross training and certification capability to assure that one or two additional people can step in when required to support the recall process with the same quality and efficiency as full time RMD personnel.

50
Business Process & Workforce Assessment of NHTSAs Office of Defects Investigation
For ODI Internal Use Only DTNH22-13-C-00318 18
4.0 Findings of the Gap Analysis Complementing the findings of the maturity model assessment, a gap analysis was performed by ProSource360 on the following four elements involving the use of technology to support ODI’s mission and business processes: workflow technology, data analysis technology, document archiving technology, and performance tracking technology. This gap analysis was also performed on ODI’s business processes and performance metrics. The results of the gap analysis are shown in Exhibit N (p. 47).
This assessment also included a benchmarking analysis performed on ODI’s business processes and performance metrics in comparison with Transport Canada’s Defect Investigations and Recalls Division (DIR). For a peer comparison to ODI, the organizational structure, mission scope, business processes and performance of the two agencies were critically evaluated. Both agencies face similar challenges of increased demand for safety investigations and less available personnel resources.
Similarities between the two agencies include:
Use of an informal risk analysis methodology. Use of single, primary Investigators to lead each investigation. The target processing time for the ‘high level’ investigations (i.e. ODI’s PE and EA)
are approximately six to twelve months. Both agencies face challenges meeting target processing times.
Differences between the two agencies include:
ODI uses trend analysis and early warning reporting to initiate a safety investigation. TC is supported by six contract field support teams (three universities and three engineering firms).
TC does not utilize sequential steps in their safety investigations; ODI’s process is to open an EA primarily only after a PE is completed.
A summary of this comparison is shown in Exhibit O (p. 51). The recommendations resulting from this gap analysis are combined with those from the organizational review and summarized in the Recommendations Section of this report starting on page 23.

51
Business Process & Workforce Assessment of NHTSAs Office of Defects Investigation
For ODI Internal Use Only DTNH22-13-C-00318 19
5.0 Revised ODI Training Plan The ODI Training Plan was designed and developed for use in May 2013 in response to a recommendation from the Office of Inspector General OIG Audit Report (October 6, 2011)24. As a first step in our assessment of the training plan, we interviewed all of the Division Chiefs to better understand training gaps, needs, and requirements of each division. Then, random interviews were conducted with engineers and analysts in each division. Also, available position descriptions for each role were gathered and reviewed. These tasks assisted in understanding the training requirements for each position within ODI, and those areas in need of improvement. Next, information from the interviews was used to determine which classes should be added to the Training Plan’s curriculum. Currently, there are two course modules in the Training Plan. However, there is not a course module identified for employee on-boarding needs. We then examined the need to develop an on-boarding curriculum. The feedback from employee interviews was beneficial for identifying the need for tracking employee training performance and classifying courses needed. A Training Matrix was then developed for tracking employee training needs.
Our review revealed that the Training Plan curriculum did not include certain courses which would aid ODI in achieving agency goals. The Training Plan (May 2013), although standardized, does not allow ODI to define, measure, track, improve, and/or sustain its training goals. There is no centralized database being utilized to manage training performance or storage of course materials. Also, there is not an identified process to manage the development of course materials.
We recommend that ODI select an owner for the Training Plan. This will provide a large impact on the sustainability and accountability of the ODI Training Plan. The lack of a training owner does not allow for the development and addition of new courses, tracking training performance of employees, planning course schedules, etc. In order to incorporate a successful Training Plan, it is imperative that ODI has an effective system for staying abreast on vehicle technologies and identifying the associated training needs. ODI faces challenges to attain funding for new training courses. The limited ability to fund training needs and provide additional training resources has restricted the professional development of ODI staff.
The Training Plan serves as a template to:
• Understand the training needs of the organization and have an increased ability to respond effectively to changing business needs.
• Detail shortcomings in training capability. • More effectively and efficiently use workers' time as a result of higher skill levels,
combined with a better understanding of job functions. • Determine what new skills the agency acquires, targeting skills to meet the needs of
agency operations now and in the future. • Use the Training Matrix to analyze the training capacity of their organization.
24 OIG Recommendation 9: Develop a formal training program to assist ODI staff in acquiring the knowledge and staying abreast of ODI processes and current and new automobile technologies.

52
Business Process & Workforce Assessment of NHTSAs Office of Defects Investigation
For ODI Internal Use Only DTNH22-13-C-00318 20
Our Training Plan revisions are highly suited and feasible to the needs of ODI. It would, however, require that ODI invest in additional resources to:
• Develop the course materials for the identified curriculum. • Define training dates. • Manage training matrices. • Decide on additional courses and/or instructors as needs change.
The Revised Training Plan is manageable and allows for employees to be trained in a short period of time. However, the ODI team will need to identify additional resources to maintain the Training Plan. The Revised Training Plan will also assist in streamlining the management, storage, and availability of course materials by implementing all training material libraries onto ODI’s SharePoint site. The ODI SharePoint site allows all ODI employees to have access to read, study, and review available course materials stored on the SharePoint site.
It is extremely important for Division Chiefs to be able to manage the training needs in their division. The DOT’s Training Management System (TMS) is a resource to support this necessity. The TMS has more than 2,000 online courses, tools for scheduling instructor-led courses, the ability to personalize learning plans, and the capacity for competency management, employee assessments, and succession planning. Utilization of this resource by ODI Division Chiefs will serve to increase their staff’s development as well as allowing staff to stay abreast of current automobile technologies.
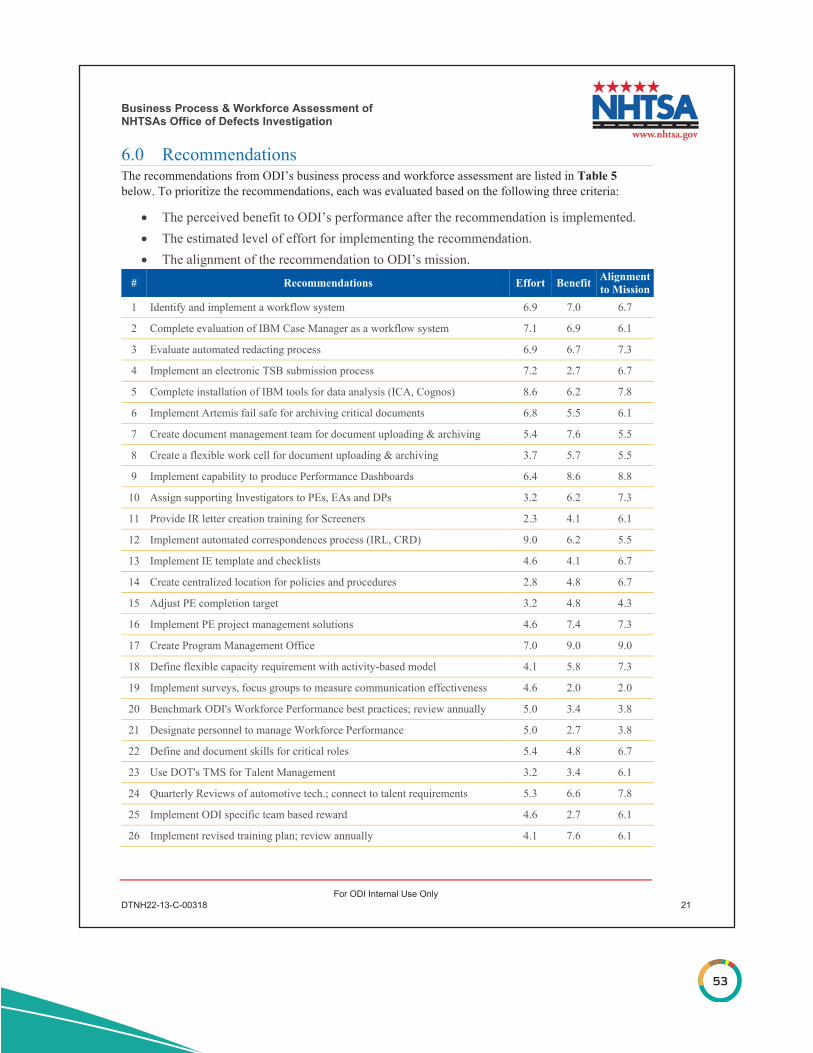
53
Business Process & Workforce Assessment of NHTSAs Office of Defects Investigation
For ODI Internal Use Only DTNH22-13-C-00318 21
6.0 Recommendations The recommendations from ODI’s business process and workforce assessment are listed in Table 5 below. To prioritize the recommendations, each was evaluated based on the following three criteria:
• The perceived benefit to ODI’s performance after the recommendation is implemented. • The estimated level of effort for implementing the recommendation. • The alignment of the recommendation to ODI’s mission.
# Recommendations Effort Benefit Alignment to Mission
1 Identify and implement a workflow system 6.9 7.0 6.7
2 Complete evaluation of IBM Case Manager as a workflow system 7.1 6.9 6.1
3 Evaluate automated redacting process 6.9 6.7 7.3
4 Implement an electronic TSB submission process 7.2 2.7 6.7
5 Complete installation of IBM tools for data analysis (ICA, Cognos) 8.6 6.2 7.8
6 Implement Artemis fail safe for archiving critical documents 6.8 5.5 6.1
7 Create document management team for document uploading & archiving 5.4 7.6 5.5
8 Create a flexible work cell for document uploading & archiving 3.7 5.7 5.5
9 Implement capability to produce Performance Dashboards 6.4 8.6 8.8
10 Assign supporting Investigators to PEs, EAs and DPs 3.2 6.2 7.3
11 Provide IR letter creation training for Screeners 2.3 4.1 6.1
12 Implement automated correspondences process (IRL, CRD) 9.0 6.2 5.5
13 Implement IE template and checklists 4.6 4.1 6.7
14 Create centralized location for policies and procedures 2.8 4.8 6.7
15 Adjust PE completion target 3.2 4.8 4.3
16 Implement PE project management solutions 4.6 7.4 7.3
17 Create Program Management Office 7.0 9.0 9.0
18 Define flexible capacity requirement with activity-based model 4.1 5.8 7.3
19 Implement surveys, focus groups to measure communication effectiveness 4.6 2.0 2.0
20 Benchmark ODI's Workforce Performance best practices; review annually 5.0 3.4 3.8
21 Designate personnel to manage Workforce Performance 5.0 2.7 3.8
22 Define and document skills for critical roles 5.4 4.8 6.7
23 Use DOT's TMS for Talent Management 3.2 3.4 6.1
24 Quarterly Reviews of automotive tech.; connect to talent requirements 5.3 6.6 7.8
25 Implement ODI specific team based reward 4.6 2.7 6.1
26 Implement revised training plan; review annually 4.1 7.6 6.1

54
Business Process & Workforce Assessment of NHTSAs Office of Defects Investigation
For ODI Internal Use Only DTNH22-13-C-00318 22
# Recommendations Effort Benefit Alignment to Mission
27 Implement new employee orientation program 5.0 5.5 5.5
28 Implement quarterly ODI lessons learned/best practices seminars 5.4 6.1 7.8
29 Designate a Training Manager (in PMO) 3.7 2.7 6.1 30 Develop training course materials with similar 'look and feel' 6.8 6.3 6.4
31 Designate a Performance Manager 5.0 2.0 4.9
32 Create contingency strategies for future safety crises 7.4 9.0 7.8
33 Implement standard guidelines and criteria for IE Panel 3.7 6.2 6.7
34 Implement check lists & review panels for critical process decision points 5.1 6.2 7.3 35 Include the NCC at the PE briefing 2.8 7.6 6.1 36 Implement customer feedback surveys 5.9 3.4 4.9 37 Implement system for summarizing manufacturer interactions 6.8 4.8 4.9 38 Implement a CRM tool 6.6 6.9 6.7 39 Audit contractors based on effectiveness 5.9 5.5 3.2
Table 5: Recommendations For each recommendation, the three criteria were independently scored on a scale of 1 to 10. The scores were averaged and ranked. Scaling factors for the effort and benefit values were calculated using commonly accepted mathematical techniques and applied to the individual values. With this approach the data points are dispersed, compensating for the natural tendency of ‘data bunching’ in this type of analysis. This approach also creates a clearer picture of the estimated relative priorities of these recommendations. A graphical ranking of the recommendations is shown in Figure 11.
Figure 11: Ranking of Recommendations
55
Business Process & Workforce Assessment of NHTSAs Office of Defects Investigation
For ODI Internal Use Only DTNH22-13-C-00318 23
Exhibits The following pages include Exhibits A through O.

56
Business Process & Workforce Assessment of NHTSAs Office of Defects Investigation
For ODI Internal Use Only DTNH22-13-C-00318 24
Exhibit A: Crosswalk Between Maturity Model Dimensions and Focus Areas of the Organizational Review
Organizational Element (Specified)
Organizational Element (Implied) Maturity Dimension
Business Excellence
Criteria
Supervision of Staff Communications/Clear
Expectations Communication Effectiveness
Workforce Performance
Performance Management Workforce Performance Management
Development of Staff Career Development
Talent Management
Reward and Recognition
Training Learning (Training)
Staff Skill Level Learning Management
Measure & Monitor Performance Workforce Performance Workforce Performance
Criteria and Measures
Risk Management Process Risk (internal)
Mission, Vision, and Strategy
Organizational Effectiveness
Decision Making and Risk Management
Program Prioritization (external)
Customer Interaction and Collaboration
Organizational Structure Enabling Efficient Processes Functions of Organizational Units
Work Assignments Empowered Workforce Workforce Collaboration and Teamwork
Process flows and Use of Technology Business Intelligence Tools Technology and Drivers of
Organizational Success
Measure and Monitor of Performance
Quality Management Quality Management
Measures are Aligned to Mission
Organizational Performance Measurement and Reporting

57
Business Process & Workforce Assessment of NHTSAs Office of Defects Investigation
For ODI Internal Use Only DTNH22-13-C-00318 25
Exhibit B: Descriptions of Maturity Model Dimensions
Workforce Performance Communication Effectiveness:
Level 1: Single channel, selected for ease of use rather than overall effectiveness. Communications are seen as single events. Communications effectiveness is not measured.
Level 2: Less than four channels, including electronic. Two way for select messages. Informal measurement of communications effectiveness. Results are not shared with other groups and may not be used.
Level 3: Four or more channels, selected for effectiveness based on audience and message. Two way. Widespread use of a formal measurement of communications effectiveness and use of feedback to improve media and message selection.
Level 4: Formal measurement of effectiveness and a commitment to continuous improvement drives programmatic measurement of media and messaging. Results are widely shared and used.
Workforce Performance Management: Level 1: The Performance Management Process is not conducted yearly. Performance management principles and
implementation are not consistent across divisions. Performance management is loosely linked with Agency’s business strategy. There is no coaching for supervisors on how to complete the process
Level 2: The Performance Management Process is conducted yearly, and is loosely linked to Agency strategy. There is some coaching for supervisors on how to complete the process.
Level 3: The Performance Management Process is conducted yearly and linked to Agency strategy. Individual goals link to Agency goals, but there is no formal cascading. There is coaching for supervisors on how to complete the process.
Level 4: A Performance Management Strategy is developed yearly, and it is fully integrated with all HR Programs and tied to individual and Agency performance. Business objectives cascade down to individual objectives. Supervisors are well-trained on how to complete performance management process.
Talent Management: Level 1: Few talent processes and technology solutions are in place for managing talent. Level 2: Process established for setting employee goals and expectations, but it is inconsistently applied across the Agency. Level 3: Formal evaluation, feedback and coaching process is established where results are tied to employee’s rewards and
compensation. Level 4: Career development is tied to the tracking and evaluation of core behaviors and skills which are tightly tied to
critical business events. Rewards and Recognition:
Level 1: There is no non-monetary rewards and recognition program in place. Level 2: There are non-monetary rewards and recognition initiatives in different divisions/ business areas. They are loosely
linked with other HR programs. Level 3: There are some non-monetary rewards and recognition programs across the Agency. They are closely linked with
other HR programs. Level 4: A comprehensive non-monetary rewards and recognition system is in place, and provides a valuable complement to
the monetary compensation program. Learning (Training)
Level 1: Learning development and delivery accountability is not aligned throughout the Agency; fragmented, inconsistent learning approaches exist across the Agency.
Level 2: Agency conducts new employee orientation and assists employees, on a case by case basis, with curriculum planning; curriculum planning is not role-based.
Level 3: Utilizes consistent Instructional Design methodology across all divisions; most courses have similar look and feel. Level 4: Designs learning deliverables only after completing target population analysis, focusing on key performance
indicators that affect target populations in the Agency. Learning Management:
Level 1: No curricula plans for professional and personal development. Level 2: Limited use of a true Instructional Design methodology; course development is more ad-hoc and requires heavy
reliance on Subject Matter Experts. Level 3: Curricula and course development is centralized within the appropriate department. Utilizes Learning Management
System across the Agency to <75% of its capability. Level 4: Creates and utilizes detailed Standards’ Guide that addresses all instructional design/ development tasks and
provides documentation templates.

58
Business Process & Workforce Assessment of NHTSAs Office of Defects Investigation
For ODI Internal Use Only DTNH22-13-C-00318 26
Workforce Performance Criteria and Measures: Level 1: No standard performance criteria are available. No performance measure exists. No benchmark information
considered for programs/ projects. Level 2: Performance management is based on job description requirements. Program/Project scorecard with basic
indicators. Basic business cases with a single target. Level 3: Performance management is based on job description requirements and some key business competencies. A clear
criterion for promotion exists. Program/Project Management scorecard with leading indicators. Scorecard used for all programs and projects.
Level 4: Performance Management Process is based on a competency model, which delineates performance criteria for each level, and is directly linked to promotion criteria. Project indicators are changed to monitor and address new issues. Performance measures tied to compensation.
Organizational Effectiveness Mission, Vision and Strategy:
Level 1: Business strategy decisions are made on an ad-hoc basis. No alignment exists between vision and business strategy. Level 2: Review of business strategy alignment is done on an ad-hoc basis. Divisions tend to define their own vision to
support their business objectives. Level 3: Business strategy decisions are made consistent with the vision. Periodic reviews are performed to realign business
strategy considering performance and external conditions. Level 4: Mission and business strategy are closely inter-linked. Periodic reviews not only focus on realignment of business
strategy but also its optimization. Creation and implementation of business strategy roadmap. Decision Making and Risk Management:
Level 1: Decision-making follows organizational hierarchy. Decisions/actions by one party may compromise the effectiveness of another. Unable to manage internal and external risk, especially those that are outside division’s scope.
Level 2: Decision-making processes vary across the agency. Some consideration is given to optimizing effectiveness. Decision-making bodies are given authority for specific areas of governance. Ability to manage some level of internal and external risk across divisions..
Level 3: Governing bodies and frameworks exist for agency with cross-functional team. There is agreement on roles and responsibilities, and decisions made are supported. Able to manage internal and external risk across divisions.
Level 4: Decision-making frameworks, including required decisions, governance groups, roles and responsibilities, processes and tools are designed for optimal organizational effectiveness and efficiency. Able to anticipate and manage internal and external risk across divisions.
Customer Interaction and Collaboration: Level 1: Customer satisfaction is not a primary metric; customer satisfaction surveys are rarely, if ever, completed. Passive
feedback process, accumulating information only when initiated by the customer. Little or no analysis performed on the information.
Level 2: Customer satisfaction is a main agency metric. Customer feedback information is obtained on an ad-hoc basis. Minimal analysis is performed to determine factors affecting customer satisfaction.
Level 3: There is a formal Customer Satisfaction Survey process in place - detailed and focuses on enhancements to the process. The survey has been completed in the last 3 years and includes questions on perception, integrity, reliability, etc.
Level 4: Customer Satisfaction expectations are reviewed, communicated and action items are taken by the Agency. Customers have an opportunity to rate the performance of the Agency’s operations. This information is used by the Agency management to improve performance.
Function of Organizational Units: Level 1: Divisions operate as functional silos. Discrete structures, roles and responsibilities require minimal collaboration. Level 2: Divisions share information as needed to maximize process efficiency thereby enhancing collaboration. Level 3: Divisions are designed to promote collaboration for the benefit of the agency. Promotes shared metrics across
divisions. Level 4: Functional and Division agency structures, roles and responsibilities, competencies and metrics are designed for
optimal organizational effectiveness and efficiency.
59
Business Process & Workforce Assessment of NHTSAs Office of Defects Investigation
For ODI Internal Use Only DTNH22-13-C-00318 27
Workforce Collaboration and Teamwork: Level 1: Employees work independently from each other. Reward and recognition are related to individual contribution.
Agency success depends on individual heroics. Level 2: Collaboration primarily based on individual relationships. Reward and recognition are related to project success.
Agency success depends on limited, ad-hoc teamwork. Level 3: Regular interaction among co-workers within divisions. Reward and recognition are related to division success;
strong sense of teamwork exists within each project. Level 4: Employees focus on collaborating with partners inside and outside the Agency. Reward and recognition are related
to Agency success. A strong sense of teamwork exists across the agency. Technology and Drivers of Organizational Success:
Level 1: Success results from heroic efforts; little or no use of technology to enhance Business Intelligence Tools. Level 2: Individual Initiatives in developing Business Intelligence Tools; limited use of standardized Business Intelligence
tools and technology. Level 3: Increased automation and standardizing of Business Intelligence tools & technology. Level 4: Organizational structure fully supports the integration of Business Intelligence tools & technology across the all
Divisions. Quality Management:
Level 1: Quality management is reactionary. Periodic quality reviews follow program/project completion. Level 2: Quality management is in audits and appraisals. May have inspection points established within the critical sub-
processes. Level 3: Quality management is proactive and designed into the Agency’s critical process. Quality records track problems
and determine root causes. Level 4: Quality management is considered a strategic enabler of Agency goals. All stages of the Agency’s Business
Processes have a quality focus. Organizational Performance Measurement and Reporting:
Level 1: There is an informal performance measurement process with limited accountability. Limited reporting visibility. Manually reporting processes.
Level 2: There is a formal performance measurement process that is narrowly focused to specific functional areas. Stand-alone reporting process with internal focus.
Level 3: There is a formal performance measurement process focused on business goals that integrate multiple functional areas. Comprehensive reporting process within Divisions. Visible and externally benchmarked.
Level 4: Performance measurement process is balanced between operating, financial, and service-oriented metrics. Comprehensive reporting process across Divisions. Visible and externally benchmarked. Different metrics and different level of granularity of reporting depending on position in the organizational hierarchy.
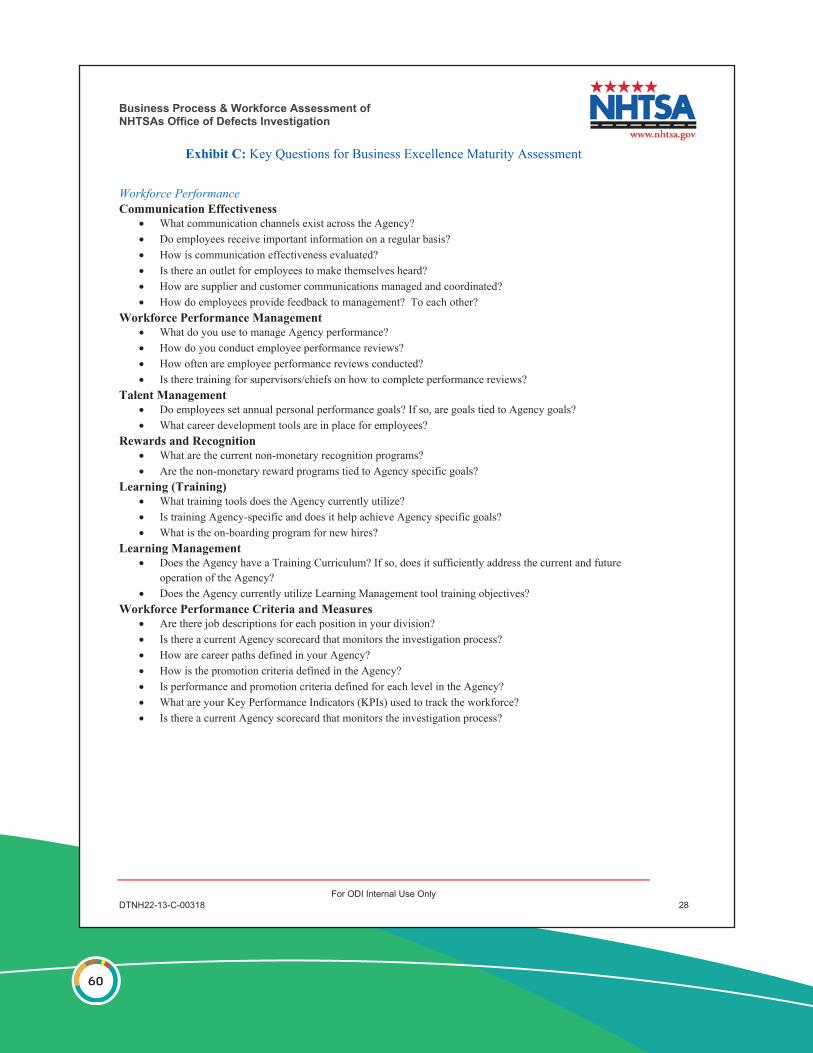
60
Business Process & Workforce Assessment of NHTSAs Office of Defects Investigation
For ODI Internal Use Only DTNH22-13-C-00318 28
Exhibit C: Key Questions for Business Excellence Maturity Assessment
Workforce Performance Communication Effectiveness
• What communication channels exist across the Agency? • Do employees receive important information on a regular basis? • How is communication effectiveness evaluated? • Is there an outlet for employees to make themselves heard? • How are supplier and customer communications managed and coordinated? • How do employees provide feedback to management? To each other?
Workforce Performance Management • What do you use to manage Agency performance? • How do you conduct employee performance reviews? • How often are employee performance reviews conducted? • Is there training for supervisors/chiefs on how to complete performance reviews?
Talent Management • Do employees set annual personal performance goals? If so, are goals tied to Agency goals? • What career development tools are in place for employees?
Rewards and Recognition • What are the current non-monetary recognition programs? • Are the non-monetary reward programs tied to Agency specific goals?
Learning (Training) • What training tools does the Agency currently utilize? • Is training Agency-specific and does it help achieve Agency specific goals? • What is the on-boarding program for new hires?
Learning Management • Does the Agency have a Training Curriculum? If so, does it sufficiently address the current and future
operation of the Agency? • Does the Agency currently utilize Learning Management tool training objectives?
Workforce Performance Criteria and Measures • Are there job descriptions for each position in your division? • Is there a current Agency scorecard that monitors the investigation process? • How are career paths defined in your Agency? • How is the promotion criteria defined in the Agency? • Is performance and promotion criteria defined for each level in the Agency? • What are your Key Performance Indicators (KPIs) used to track the workforce? • Is there a current Agency scorecard that monitors the investigation process?

61
Business Process & Workforce Assessment of NHTSAs Office of Defects Investigation
For ODI Internal Use Only DTNH22-13-C-00318 29
Operational Effectiveness Mission, Vision and Strategy
• How would our community be improved if we are successful at achieving our agency’s mission? • What staffing and benefits changes do we need to implement to better achieve our agency’s mission? • What areas has the agency been successful in the past? • Do staff members and leadership teams see business strategy(ies) as valuable and relevant? • What trends, motivations are currently changing our community? • How do we see our agency in 3, 5 or 10 years? • Does business strategy unify the entire agency?
Decision Making and Risk Management • What are the implications of having a hierarchical based decision making system? • Does a hierarchical based decision making system promote single points of failure, and how? • What are the benefits of having a cross-functional team in the decision making process? • What are likely risk measures that exist across various divisions with the agency?
Customer Interaction and Collaboration • What are the modes of obtaining feedback from customers? • What are the necessary actionable plans associated with customer feedback? • Is there a customer feedback metric utilized across the entire agency or is it limited to certain divisions?
Function of Organizational Units • How do divisions share/supply information with one another? • How do divisions determine functions that are within scope? • What are the benefits of cascading repetitive functions across multiple divisions?
Workforce Collaboration and Teamwork • How do employees resolve disagreements? • How do employees share information across business units/departments? • Do employees work independently from others? • How do employees take ownership for resolving problems outside of their regular responsibilities? • How do employees solve their own problems? • To what level does the interaction among co-workers enable social learning and combined understanding?
Technology Drivers of Organizational Success • To what level is automation used to enhance and enable the workforce? • Is the workforce knowledgeable of the available technology? • Is the current automation reliable? • Does the agency enable the development of technology to enhance success?
Quality Management • Is the workforce conscious of methods available to measure the quality of the work product? • Are the downstream effects of process quality understood by the Agency? • Is the cost of quality and risk (Prevention, Appraisal, and Failure) used to manage Agency success?
Performance Measurement and Reporting • How are metrics tracked? Are performance scorecards used? • How do metrics link with organizational performance initiatives? • Does the scorecard measure organizational performance across its operations, service and finance? • Are reported metrics benchmarked internally and externally? • Are different metrics reported to different stakeholders?

62
Business Process & Workforce Assessment of NHTSAs Office of Defects Investigation
For ODI Internal Use Only DTNH22-13-C-00318 30
Exhibit D: Results of Maturity Model Assessment
Survey Results ProSource360 Analysis

63
Business Process & Workforce Assessment of NHTSAs Office of Defects Investigation
For ODI Internal Use Only DTNH22-13-C-00318 31
Exhibit E: Observations from the Maturity Model Assessment Workforce Performance Communication Effectiveness
• Groups communicate through phone, email, and meetings/briefings • ODI does not have a formal system of measuring communication effectiveness • ODI does not currently document and communicate/shared best practice(s)
Workforce Performance Management • ODI’s utilizes NHTSA’s Annual Performance Appraisal Plan as the basis of the Performance Management
process • ODI divisions have implemented specific metrics for workforce performance which cascade down from
ODI’s strategic goals
Talent Management • The requisite employee experience skills and competencies to support ODI’s mission are generally and
anecdotally known throughout the agency • The agency is creating a skills and competencies development-tracking matrix based on
project/investigation experience Rewards and Recognition
• ODI actively participates in NHTSA award programs, including the Administrator and Secretary Awards • ODI employees have been nominated for, and have won, the Administrator's Commendation Award, the
Administrator’s Superior Performance Awards, and NHTSA’s Employee of the Year Award (3 times) • ODI has monthly employee recognition events for superior performance, with nominations originating
within each division Learning (Training)
• Coursework for the identified curriculum has not been developed • Training is limited for the administrative staff and lower level employees • ODI does not have a formal new employee orientation program
Learning Management • ODI has developed a training plan that outlines some curriculum; the Training Plan curriculum should be
developed and outlined for all divisions • Course documents and materials have not been created for the ODI Training Plan • DOT has a designated a system, TMS, that aids in the training and development plan process. ODI does not
currently use the TMS system for ODI-specific training Workforce Performance Criteria and Measures
• ODI’s formal Workforce Measurement process is tied to the Annual Performance Appraisal process • Performance and promotion criteria are not well-defined within ODI.
Operational Effectiveness Mission, Vision and Strategy
• ODI’s primary business processes of defect screening, early warning screening, defect investigations and recall management, and public correspondence are aligned with the primary mission
• Business strategy review and realignment is often done ad-hoc in response to outside crises, such as highly publicized defect related accidents. These crises often impact the quality and timeliness of the other investigative processes

64
Business Process & Workforce Assessment of NHTSAs Office of Defects Investigation
For ODI Internal Use Only DTNH22-13-C-00318 32
Decision Making and Risk Management • Review panels, comprised of cross-functional teams, are key steps within the investigation process • Decision-making during panel meeting is made on organizational hierarchal format-IE Review panel,
PE/EA briefings • The NCC is represented in the IE review panel and PE, and EA briefings
Customer Interaction and Collaboration • ODI does not currently monitor customer satisfaction for Vehicle Owner Questionnaires complaints • Feedback from customers or MFRs are not business metrics
Function of Organizational Units • Information is shared between divisions as needed, for example, EWR sends quarterly analyses to DAD • DAD Screeners lead Defect Positions (DP), providing collaborative support the Investigator workload • 20% of letters (public and Congressional) received by Correspondence Research Division (CRD) are safety
related Workforce Collaboration and Teamwork
• ODI’s investigations are worked independently, however, investigators are encouraged to collaborate on more difficult investigations
• Teamwork is 1 of 5 criteria NHTSA has outlined in the Performance Appraisal Plan and employees are rated annually on performance
• MHDVD Investigators rely heavily on the network of outside contacts. (benchmark with TC’s ‘investigative teams’). However, there is limited sharing of contacts between investigators
Technology Drivers of Organizational Success • The creation and use of Artemis indicates previous efforts to integrate Business Intelligence tools across all
Divisions • Current Business Intelligence technology initiatives include:
RMD is developing an online portal to assist with managing 573 reports DAD is working on IBM tools to increase the speed of data searches, produce reports, and send event-
based alerts Quality Management
• Quality inspection points include: Telesis completes daily audits of VOQ information that is entered in the Artemis database Administrative Assistant checks IR letter for correct date, address, etc. before sending the letter out
• Documentation checklists are available within some divisions to verify accurate process completions Performance Measurement and Reporting
• PEs target processing time is 120 days and EA target processing time is 360 days • Division Chiefs set performance measures based on the needs of their respective divisions
Exhibit F: Recommendations from the Maturity Model Assessment (Continued) Workforce Performance Communication Effectiveness
• Create and solicit quarterly surveys for communication effectiveness to provide quantitative data • Convene focus groups quarterly to provide a more qualitative perspective of communication effectiveness • Designate a centralized administrator responsible for managing the survey, running the focus groups,
analyzing the results and making recommendations to the Director. Locate the administrator in the Program Management Office

65
Business Process & Workforce Assessment of NHTSAs Office of Defects Investigation
For ODI Internal Use Only DTNH22-13-C-00318 33
Workforce Performance Management • Benchmark the best practices within ODI for developing performance goals and apply across all ODI’s
Divisions to develop an ODI specific performance management processes with formal, standardized metrics cascading down from ODI’s strategic goals
• Review and update the plan yearly within the first month of the fiscal year, and provide training of the process at that time
• Designate the appropriate personnel to manage the Workforce Performance Management process Talent Management
• Define skills and competencies for Screening, Investigating and Correspondence roles • Expand the skills and competencies development tracking matrix to include non-project experience,
including education, work experience and training • Develop a specific talent management strategy, to include career development guidelines • Use DOT’s Training Management System (TMS) to link individual skills and competency development
goals to agency goals and to track career development criteria • Perform a quarterly review of new and emerging transportation technology to determine talent capabilities
to support ODI’s defect identification and investigation mission Rewards and Recognition
• In addition to the current rewards and recognition programs, implement an ODI specific team based reward program based on one or more Agency level strategic goal, such as a goal related to a quantifiable public safety metric
Learning (Training) • Implement revised training plan, including:
A matrix to identify the training requirements for each position and tie to career advancement Tracking employee training completion rates using DOT’s TMS
• Review the training plan annually, to include an evaluation of the training needs associated with new transportation technologies
• Implement a new employee orientation program to assist in the on-boarding process • Implement a program of ODI wide quarterly seminars to present recent case studies (Screening,
Investigation, Recall Management, etc.) to teach best practices Learning Management
• Designate an overall Training Manager focused on incorporating adult learning methods into the Training Plan. Locate the Training Manager in a Program Management Office
• Develop course material of the ODI instructed courses identified in the revised training plan. Empower the Training Manager to create a similar look and feel for all the courses, consistent with the ODI brand
Workforce Performance Criteria and Measures • To augment the annual Performance Management process, implement a system for the monthly tracking
relevant Key Performance Indicators (KPIs) for each focus area within ODI (screening, investigations, recall management and correspondence, and early warning reporting)
• Develop the appropriate technology to automate the collection of these KPIs and create a scorecard • Designate a Performance Manager to be responsible manage the Performance Measurement function.
Locate the Performance Manager in the Program Management Office
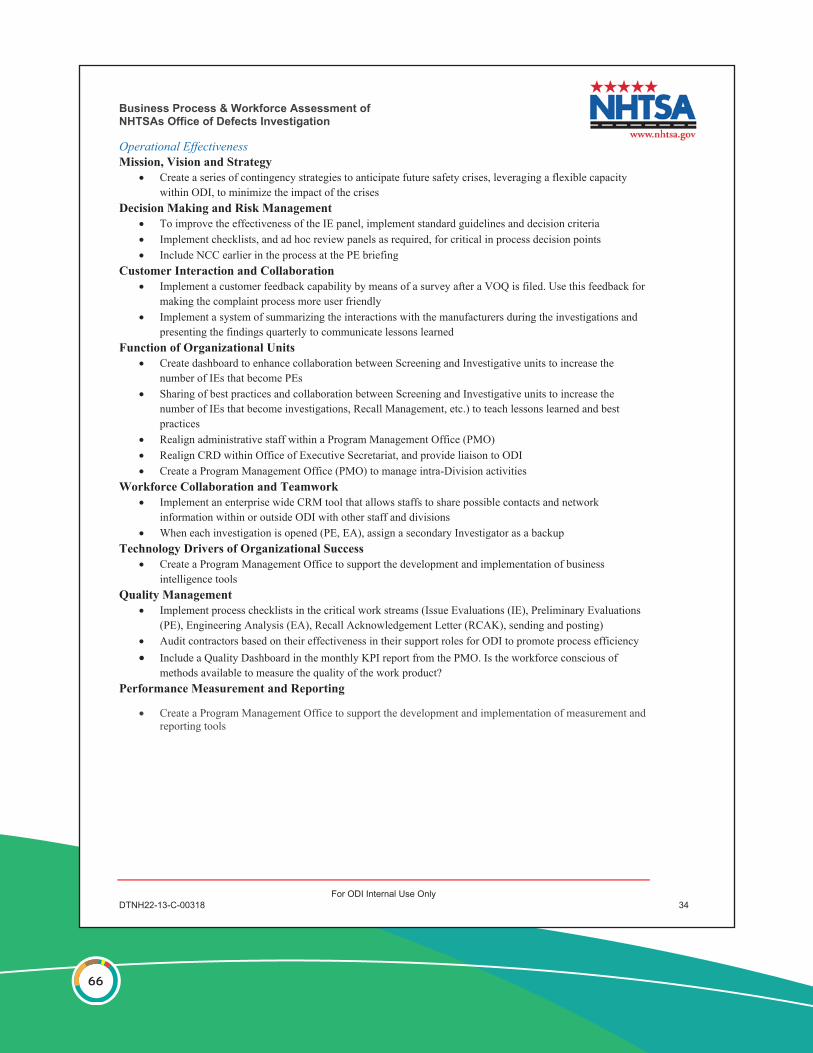
66
Business Process & Workforce Assessment of NHTSAs Office of Defects Investigation
For ODI Internal Use Only DTNH22-13-C-00318 34
Operational Effectiveness Mission, Vision and Strategy
• Create a series of contingency strategies to anticipate future safety crises, leveraging a flexible capacity within ODI, to minimize the impact of the crises
Decision Making and Risk Management • To improve the effectiveness of the IE panel, implement standard guidelines and decision criteria • Implement checklists, and ad hoc review panels as required, for critical in process decision points • Include NCC earlier in the process at the PE briefing
Customer Interaction and Collaboration • Implement a customer feedback capability by means of a survey after a VOQ is filed. Use this feedback for
making the complaint process more user friendly • Implement a system of summarizing the interactions with the manufacturers during the investigations and
presenting the findings quarterly to communicate lessons learned Function of Organizational Units
• Create dashboard to enhance collaboration between Screening and Investigative units to increase the number of IEs that become PEs
• Sharing of best practices and collaboration between Screening and Investigative units to increase the number of IEs that become investigations, Recall Management, etc.) to teach lessons learned and best practices
• Realign administrative staff within a Program Management Office (PMO) • Realign CRD within Office of Executive Secretariat, and provide liaison to ODI • Create a Program Management Office (PMO) to manage intra-Division activities
Workforce Collaboration and Teamwork • Implement an enterprise wide CRM tool that allows staffs to share possible contacts and network
information within or outside ODI with other staff and divisions • When each investigation is opened (PE, EA), assign a secondary Investigator as a backup
Technology Drivers of Organizational Success • Create a Program Management Office to support the development and implementation of business
intelligence tools Quality Management
• Implement process checklists in the critical work streams (Issue Evaluations (IE), Preliminary Evaluations (PE), Engineering Analysis (EA), Recall Acknowledgement Letter (RCAK), sending and posting)
• Audit contractors based on their effectiveness in their support roles for ODI to promote process efficiency • Include a Quality Dashboard in the monthly KPI report from the PMO. Is the workforce conscious of
methods available to measure the quality of the work product? Performance Measurement and Reporting
• Create a Program Management Office to support the development and implementation of measurement and reporting tools
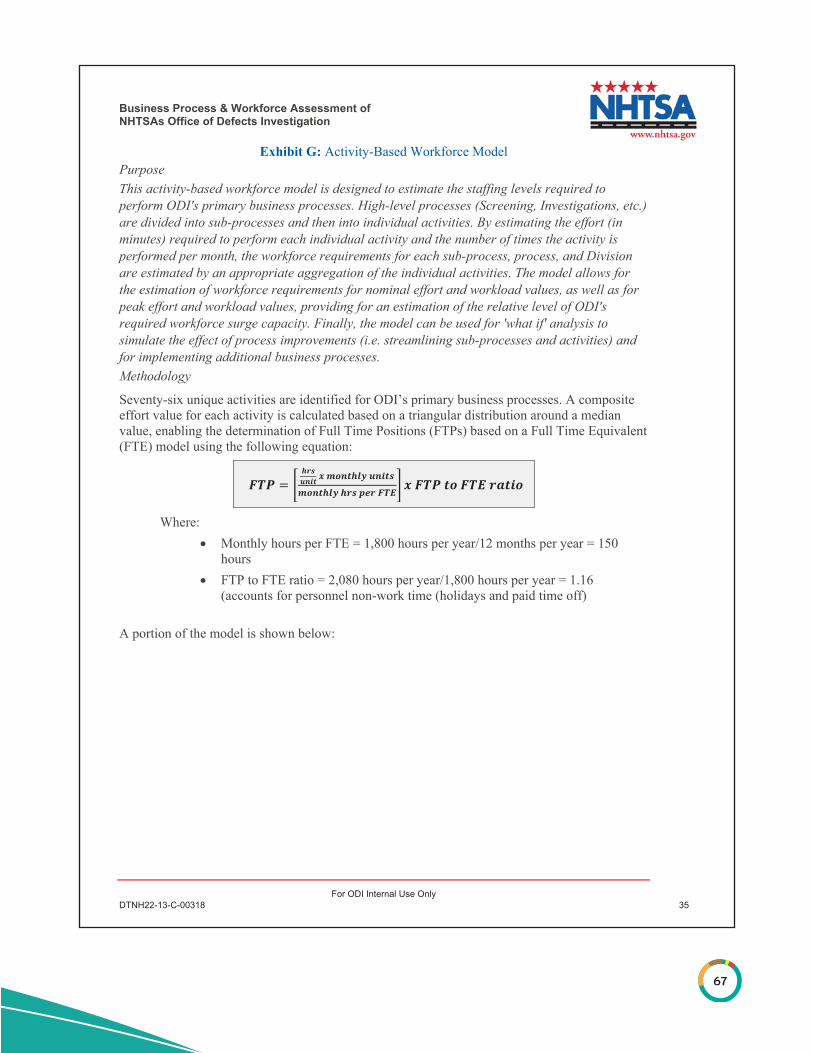
67
Business Process & Workforce Assessment of NHTSAs Office of Defects Investigation
For ODI Internal Use Only DTNH22-13-C-00318 35
Exhibit G: Activity-Based Workforce Model Purpose This activity-based workforce model is designed to estimate the staffing levels required to perform ODI's primary business processes. High-level processes (Screening, Investigations, etc.) are divided into sub-processes and then into individual activities. By estimating the effort (in minutes) required to perform each individual activity and the number of times the activity is performed per month, the workforce requirements for each sub-process, process, and Division are estimated by an appropriate aggregation of the individual activities. The model allows for the estimation of workforce requirements for nominal effort and workload values, as well as for peak effort and workload values, providing for an estimation of the relative level of ODI's required workforce surge capacity. Finally, the model can be used for 'what if' analysis to simulate the effect of process improvements (i.e. streamlining sub-processes and activities) and for implementing additional business processes. Methodology
Seventy-six unique activities are identified for ODI’s primary business processes. A composite effort value for each activity is calculated based on a triangular distribution around a median value, enabling the determination of Full Time Positions (FTPs) based on a Full Time Equivalent (FTE) model using the following equation:
Where:
• Monthly hours per FTE = 1,800 hours per year/12 months per year = 150 hours
• FTP to FTE ratio = 2,080 hours per year/1,800 hours per year = 1.16 (accounts for personnel non-work time (holidays and paid time off)
A portion of the model is shown below:
𝑭𝑭𝑭𝑭𝑭𝑭 = �𝒉𝒉𝒉𝒉𝒉𝒉𝒖𝒖𝒖𝒖𝒖𝒖𝒖𝒖 𝒙𝒙 𝒎𝒎𝒎𝒎𝒖𝒖𝒖𝒖𝒉𝒉𝒎𝒎𝒎𝒎 𝒖𝒖𝒖𝒖𝒖𝒖𝒖𝒖𝒉𝒉
𝒎𝒎𝒎𝒎𝒖𝒖𝒖𝒖𝒉𝒉𝒎𝒎𝒎𝒎 𝒉𝒉𝒉𝒉𝒉𝒉 𝒑𝒑𝒆𝒆𝒉𝒉 𝑭𝑭𝑭𝑭𝑭𝑭� 𝒙𝒙 𝑭𝑭𝑭𝑭𝑭𝑭 𝒖𝒖𝒎𝒎 𝑭𝑭𝑭𝑭𝑭𝑭 𝒉𝒉𝒓𝒓𝒖𝒖𝒖𝒖𝒎𝒎

68
Business Process & Workforce Assessment of NHTSAs Office of Defects Investigation
For ODI Internal Use Only DTNH22-13-C-00318 36
Results:
• By assigning a Risk to each of the activities, the proportion of resources involved in the various levels of critical processes are shown below:
• For example, in the above analysis, of the 6.0 estimated DAD resources required to
perform the nominal level of workload, 2.9 (48%) are involved in critical activities, and 3.1 (52%) are involved in highly critical activities. This information is useful for contingency planning.
• The model can also be used to estimate the proportion of resources currently required in the various sub processes within the Divisions. This can facilitate effective staffing, process optimization and training plans. In the table on the following page, the model output is compared to the current adjusted FTPs, which include the following considerations: The model includes only primary activities, so those positions which do not
contribute significantly to the listed activities are not included in the actual adjusted FTP calculation. The positions not currently tracked in the activity-based model include the Division Chiefs and the Director’s Administrative Staff Assistant.
Activity Number Process Subprocess Division Activity
Risk Metric Labor Cat.
Nominal FTP
PeakFTP
1 Input VOQs DAD Process Online VOQ 2 Telesis 8.2 9.62 Input VOQs DAD Process Paper VOQ 2 Telesis 1.6 2.33 Screening Level I Screening DAD Review VOQs 3 Screener 1.1 1.64 Screening Level II Screening DAD Review Level I screens 3 Screener 1.5 1.95 Screening TSB Review DAD Review TSBs 3 Screener 0.1 0.16 Screening TSB Review DAD Maintenance of TSB database 2 Screener 1.5 1.97 Screening Issue Evaluation DAD Analyze complaints trends 2 Screener 0.4 0.98 Screening Issue Evaluation DAD Chief Analyzes complaint trends 2 Screener 0.3 0.4
15 Investigation Preliminary Evaluation VID/VCD Evaluate IE package 2 Investigator 0.3 0.416 Investigation Preliminary Evaluation VID/VCD Participates in IE review panel 2 Investigator 0.1 0.117 Investigation Preliminary Evaluation VID/VCD Create Resume package 1 Investigator 0.1 0.218 Investigation Preliminary Evaluation VID/VCD Publish Resume 2 Investigator 0.0 0.019 Investigation Preliminary Evaluation VID/VCD Develop Information Request Letter 1 Investigator 0.2 0.450 Investigation Screening MHDVD Conduct complaints screening 2 Investigator 0.2 0.451 Investigation Screening MHDVD Conduct complaint analysis 2 Investigator 0.8 1.652 Investigation Preliminary Evaluation MHDVD Create Resume package 1 Investigator 0.1 0.253 Investigation Preliminary Evaluation MHDVD Publish Resume 2 Investigator 0.0 0.080 Recall Mgt. Recall Processing RMD Review and process recall request letter from OEMs 2 RMD Analyst 0.2 0.481 Recall Mgt. Recall Processing RMD Stamped received and assignment of recall number 2 RMD Analyst 0.1 0.182 Recall Mgt. Recall Processing RMD Send notification to media relations 2 RMD Analyst 0.1 0.283 Recall Mgt. Recall Processing RMD Upload in ARTEMIS 2 RMD Analyst 0.1 0.284 Recall Mgt. Recall Processing RMD Generate acknowledgement letter 1 RMD Analyst 0.5 0.8
Dvision Non-Critical Critical Highly Critical TotalCRD 3.7 3.7DAD 2.9 3.1 6.0EWD 0.8 3.1 3.8
MHDVD 2.2 2.2 4.4OTHERS 1.3 1.3
RMD 1.1 1.5 0.7 3.3VID/VCD 6.2 2.5 8.7
Totals: 10.2 17.2 3.8 31.2
Risk Level of Activities
69
Business Process & Workforce Assessment of NHTSAs Office of Defects Investigation
For ODI Internal Use Only DTNH22-13-C-00318 37
Availability factors ranging from 50% to 90% are applied to account for time spent on ancillary activities, such as responding to media inquiries, FOIA requests, training, and working on special projects. A lower availability factor indicates that collectively a Division’s resources have less time available to perform the activities listed in the model due to these ancillary activities.
Note that the above-referenced availability factors are nominal values, which are exposed to the risk of decreasing in value when the demand for ancillary activities increases, thus, effectively increasing the FTP results. For example, when high profile investigations are active, such as the Toyota UA investigation, the number of ODI staff involved in responding to media inquiries and FOIA requests goes up, effectively lowering the availability factor in the activity-based model .

70
Business Process & Workforce Assessment of NHTSAs Office of Defects Investigation
For ODI Internal Use Only DTNH22-13-C-00318 38
Division/Sub Process FTPAdjustment
FactorAdjusted
FTP
WF Model: Nominal
Workload
WF Model: Peak
WorkloadCRD 4 90% 3.6 3.7 7.2
Research 1.0 1.6Response 2.8 5.5
DAD 8 80% 6.4 6.0 8.7Evaluation 0.0 0.0IE Panel 0.2 0.2IE Pre-Panel 0.5 0.8Issue Evaluation (IE) 1.2 2.1Level II Screening 1.5 1.9Level I Screening 1.1 1.6TSB 1.6 2.0
EWD 4 80% 3.2 3.8 6.1Comprehensive enquiry 0.3 0.4Referral 0.8 1.2Research 2.8 4.5
MHDVD 6 80% 4.8 4.4 8.7Engineering Analysis 1.4 2.9Preliminary Evaluation (PE) 1.9 3.8Screening (MHDVD) 1.0 2.0
DIR 3 50% 1.5 1.3 2.6Channeling 0.7 1.4Collaboration 0.0 0.0Data gathering 0.4 0.8Quality control 0.0 0.1Research 0.1 0.3
RMD 5 60% 3.0 3.3 5.5Quarterly Reports 0.5 0.6Recall Processing 2.1 3.4TSB Review 0.7 1.4
VID/VCD 12 80% 9.6 8.7 15.0Engineering Analysis 3.8 7.6Preliminary Evaluation (PE) 4.9 7.3
Totals: 42 32.1 31.2 53.7
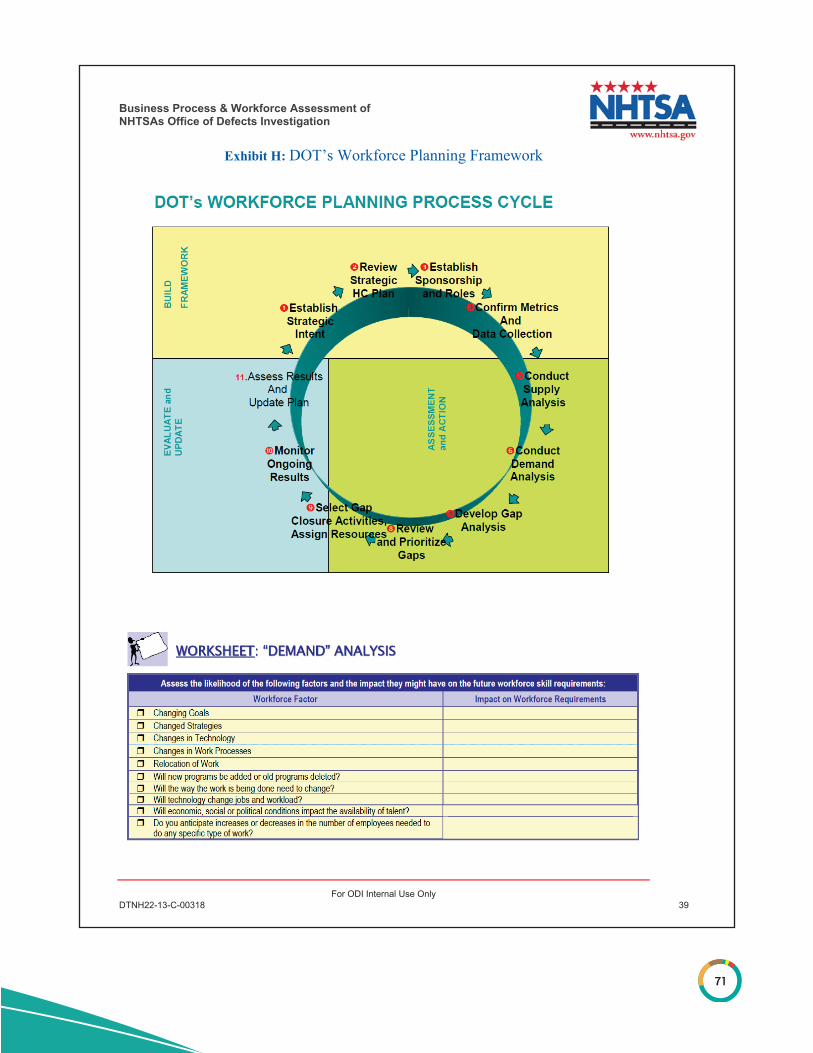
71
Business Process & Workforce Assessment of NHTSAs Office of Defects Investigation
For ODI Internal Use Only DTNH22-13-C-00318 39
Exhibit H: DOT’s Workforce Planning Framework
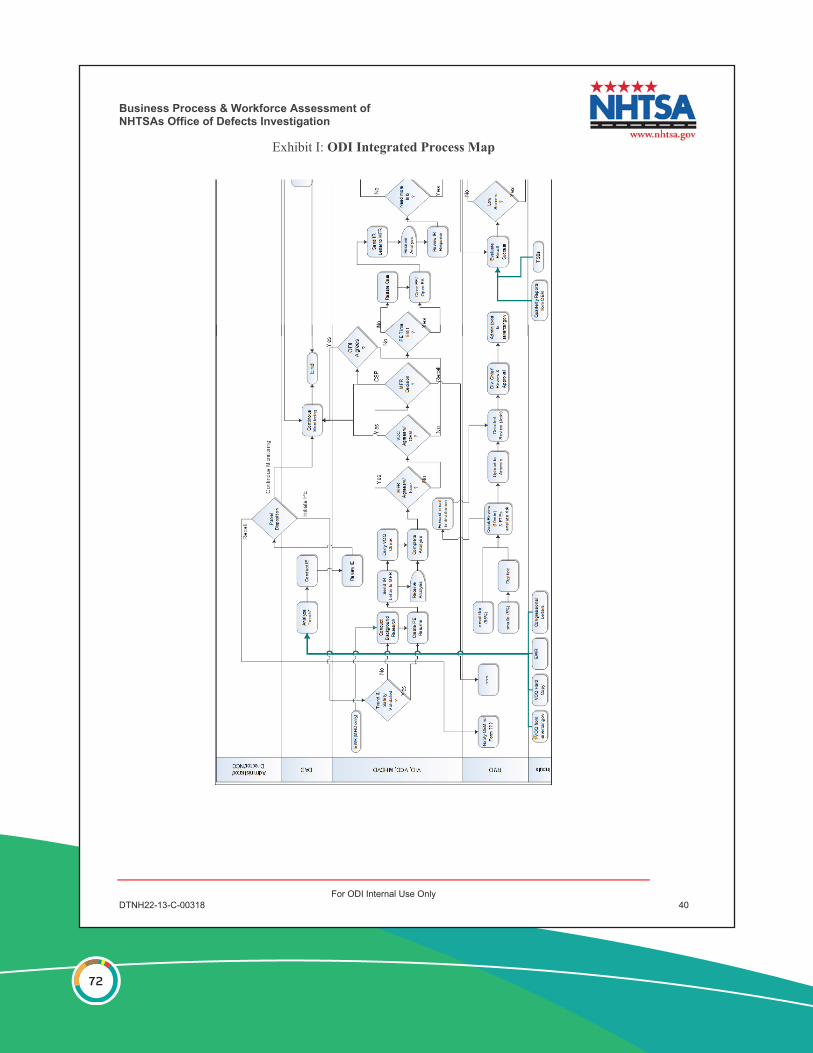
72
Business Process & Workforce Assessment of NHTSAs Office of Defects Investigation
For ODI Internal Use Only DTNH22-13-C-00318 40
Exhibit I: ODI Integrated Process Map
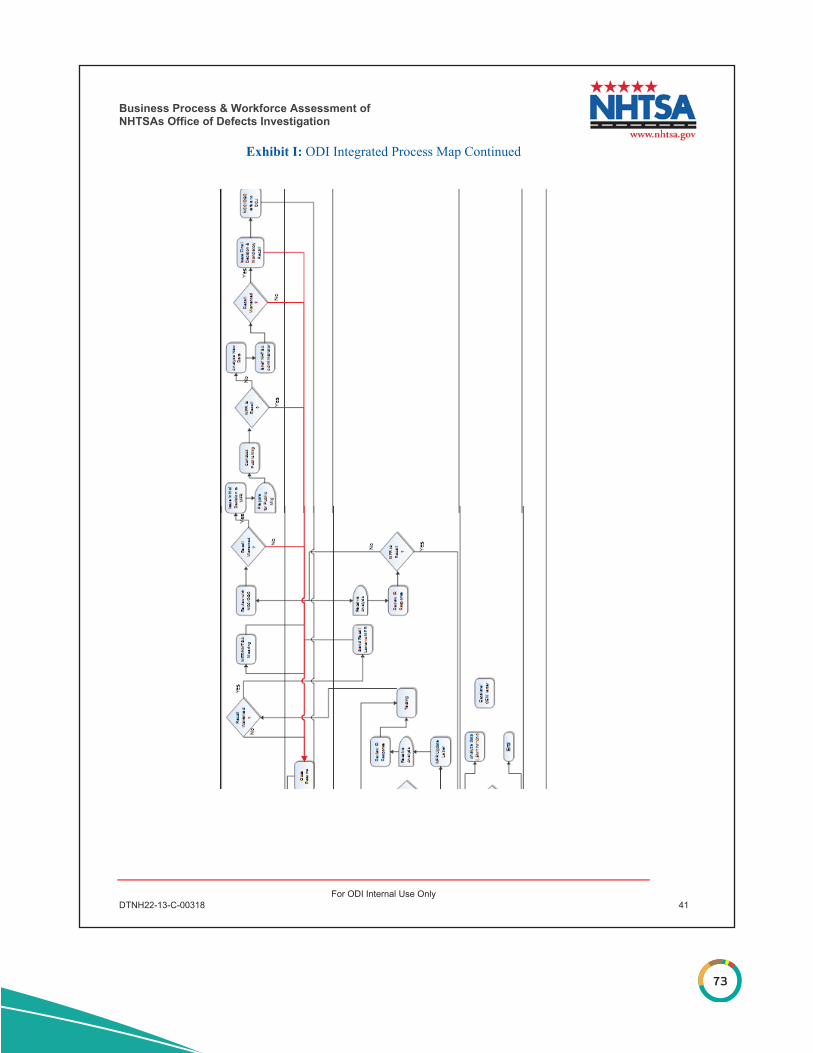
73
Business Process & Workforce Assessment of NHTSAs Office of Defects Investigation
For ODI Internal Use Only DTNH22-13-C-00318 41
Exhibit I: ODI Integrated Process Map Continued

74
Business Process & Workforce Assessment of NHTSAs Office of Defects Investigation
For ODI Internal Use Only DTNH22-13-C-00318 42
Exhibit J: Summary of PEs in Process in CY13
1. For the PEs closed in CY13, the processing time is the date opened to the date closed. For the PEs which were still open at
the end of CY13, the processing time is the date opened to 12/31/13. 2. PE Type, as determined from manufacturer’s response letter (LNF = letter not archived; LNS = letter not sent): • RI = Recall Initiated. Manufacturer believes that the concept of submitting a recall seems likely. • ES = Evaluating the safety-related consequence. Manufacturer agrees that a defect is likely present, but is still investigating
the safety consequence. • DS = Disputes the safety-related consequence. Manufacturer agrees that a defect is likely present, but does not believe that
it will have a safety-related consequence. • Disputes the defect or DD, which indicates that the manufacturer disputes the presence of a defect.
3. Results identified in closing resume: EA = upgraded to and EA; RI = No Recall; RI = Recall Initiated; N/A = not available; PE not closed).
Pursuit Number Investigator Division
Status as of 12/31/13
Date Opened
Date Closed Parent
Parent Date
Parent to Open (days)
Processing Time1
(days) Subject Make PE Type2 Results3
PE10-019 MCHENRY,STEVE VCD Closed 5/28/10 1/11/13 IE10-038 5/27/10 1 959 Accel Pedal Interference Ford, Mercury DS EAPE11-018 MCHENRY,STEVE VCD Closed 5/11/11 2/7/13 IE11-025 4/4/11 37 638 Idle Instabiltiy ford DS NRPE11-041 KIVETT,PETER MHDVD Closed 1/20/12 1/11/13 IE11-061 12/7/11 44 357 Collapse fo Squad Seat Base Medtec LNA RIPE12-001 ABBOTT,JOHN VID Closed 1/23/12 3/18/13 IE11-030 4/19/11 279 420 Fuel Tank Leak Mercedes DS EAPE12-015 YOUNG,ROBERT MHDVD Closed 6/14/12 1/9/13 IE12-036 5/24/12 21 209 Wheelchair restraint failure Ricon DS NRPE12-017 LASH,CHRIS VID Open 6/19/12 IE12-040 6/14/12 5 560 Loss of electric power assisted steering Ford DS N/APE12-019 RINEHARDT,DEREK VCD Closed 7/17/12 2/21/13 IE12-050 7/12/12 5 219 Stuck Throttle Ford, Mazda DS RIPE12-021 RINEHARDT,DEREK VCD Closed 7/19/12 3/5/13 IE12-052 7/16/12 3 229 Rear differential failure Dodge ES RIPE12-023 REICHARD,EMILY VID Closed 8/15/12 1/22/13 IE12-055 7/19/12 27 160 SRS Warning Light Illumination Nissan DD NRPE12-025 RINEHARDT,DEREK VCD Closed 9/14/12 4/26/13 IE12-070 9/12/12 2 224 Loss of Steering Control Ford ES EAPE12-026 MCHENRY,STEVE VCD Closed 10/2/12 1/14/13 IE12-063 8/16/12 47 104 Ignition Interlock Failure - Rollaway Honda RI RIPE12-027 REICHARD,EMILY VID Closed 10/2/12 2/21/13 IE12-054 7/18/12 76 142 Panoramic Sunroof Shatters Hyundai DS RIPE12-028 MCHENRY,STEVE VCD Closed 10/9/12 3/15/13 DP12-002 10/11/12 -2 157 Vehicle Stability Assist Malfuntion Honda ES EAPE12-029 BRESSANT,KERRIN VCD Closed 10/9/12 6/26/13 IE12-073 9/20/12 19 260 Steering Shaft Universal Joint Failure Hyundai DS NRPE12-030 SEYMOUR,NATE MHDVD Closed 10/11/12 5/22/13 IE12-081 10/10/12 1 223 Aftermarket Fuel Regulator Leak Mr.Gasket LNA NRPE12-031 ABBOTT,JOHN VID Closed 10/15/12 3/4/13 IE12-077 10/3/12 12 140 Difficulity in unlatching the harness buckle Graco DD EAPE12-032 HABIB,KAREEM VCD Closed 10/15/12 5/3/13 IE12-075 9/28/12 17 200 Engine Stall Jeep ES RIPE12-033 MCHENRY,STEVE VCD Closed 10/24/12 6/26/13 PE12-005 8/1/12 84 245 Stuck Throttle Ford,etc DS NRPE12-034 YOUNG,ROBERT MHDVD Closed 11/9/12 2/11/13 IE12-091 11/6/12 3 94 Motorscooter stalling Yamaha LNA RIPE12-035 YOUNG,ROBERT MHDVD Closed 11/16/12 4/16/13 IE12-033 5/24/12 176 151 Motorcycle stalling Buell LNA NRPE12-036 YOUNG,ROBERT MHDVD Closed 11/16/12 7/22/13 IE12-092 11/6/12 10 248 Fuel Leak - Motorcycle BMW LNA EAPE12-037 KIVETT,PETER MHDVD Closed 12/7/12 6/6/13 IE12-026 4/26/12 225 181 Loss of Emergency Power & Accessories Road Rescue LNA RIPE13-001 BOWKER,KYLE MHDVD Closed 1/15/13 4/11/13 IE12-106 2/8/12 342 86 SmartPlex Multiplexer Module Failure Freightliner RI RIPE13-002 BOWKER,KYLE MHDVD Closed 2/7/13 7/3/13 IE12-068 9/6/12 154 146 I-Shift Transmission Disengagement Volvo LNF RIPE13-003 HABIB,KAREEM VCD Open 2/21/13 DP12-006 2/21/13 0 313 Electronic Throttle Body Malfunction Ford DS N/APE13-004 WILLARD,RIC MHDVD Closed 3/5/13 7/12/13 129 Coolant Leak Resulting in Occupant Burns Orion LNA NRPE13-005 SEYMOUR,NATE MHDVD Closed 3/18/13 8/29/13 IE13-022 2/22/13 24 164 Windshield Wiper Failures Volvo ES RIPE13-006 WILLARD,RIC MHDVD Closed 3/18/13 8/26/13 IE13-003 1/16/13 61 161 Blocked Fuel Delivery Resulting in Stall Thomas LNA RIPE13-007 BRESSANT,KERRIN VCD Closed 3/25/13 8/20/13 IE13-007 1/23/13 61 148 Rear Control Arm Failure Hyundai ES RIPE13-008 KIVETT,PETER MHDVD Closed 3/29/13 9/3/13 IE13-026 3/12/13 17 158 High exhaust temperature causing fire Ford RI RIPE13-009 MCHENRY,STEVE VCD Open 4/26/13 IE13-030 3/16/13 41 249 Rapid coolant loss Posrche DS N/APE13-010 MCHENRY,STEVE VCD Closed 4/26/13 12/11/13 IE13-031 3/16/13 41 229 Rear suspension knuckle failure Dodge DS NRPE13-011 SEYMOUR,NATE MHDVD Closed 4/26/13 12/9/13 227 Throttle return delay Autocar DD NRPE13-012 BOWKER,KYLE MHDVD Closed 4/26/13 12/2/13 IE13-019 2/15/13 70 220 Single Wheel End Thermal Overload Various LNA NRPE13-013 HERSHMAN,LAWRENCE VID Closed 5/6/13 8/26/13 IE12-074 9/20/12 228 112 Loss of Low Beam Headlights Chevy DS EAPE13-014 RINEHARDT,DEREK VCD Open 5/7/13 IE13-033 4/10/13 27 238 Loss of Steering Capability Ford DD N/APE13-015 REICHARD,EMILY VID Closed 5/9/13 9/30/13 IE13-039 4/17/13 22 144 Door Latch Failiure Mazda DS RIPE13-016 HABIB,KAREEM VCD Open 5/9/13 IE13-034 4/10/13 29 236 Engine Stall Chyrsler, etc ES N/APE13-017 KIVETT,PETER MHDVD Closed 5/22/13 11/19/13 181 Aerial ladder bucket failure Sutphen DS RIPE13-018 RINEHARDT,DEREK VCD Open 5/22/13 IE13-041 4/24/13 28 223 Reduced power during hard acceleration Ford DS N/APE13-019 BOWKER,KYLE MHDVD Open 6/6/13 IE13-025 3/1/13 97 208 CNG Fuel Container Manual Valve Agility DS N/APE13-020 ONG,PETER VID Open 6/6/13 1/6/14 IE13-012 1/29/13 128 208 Inadvertent Air Bag Deployment Honda RI RIPE13-021 LEE,MICHAEL VID Closed 6/14/13 9/30/13 IE12-089 11/2/12 224 108 Occupant Classification System Failure Suzuki ES RIPE13-022 KIVETT,PETER MHDVD Closed 6/20/13 10/30/13 IE13-052 5/22/13 29 132 Parking break failure Pierce RI RIPE13-023 YOUNG,ROBERT MHDVD Closed 6/20/13 9/20/13 92 Motorcycle stalling Kawasaki RI RIPE13-024 SIMMONS,PAUL VCD Closed 6/25/13 11/4/13 IE13-044 5/2/13 54 132 Inappropriate autonomous braking Honda ES RIPE13-025 RINEHARDT,DEREK VCD Closed 7/5/13 9/20/13 IE13-045 5/3/13 63 77 Front axle shaft failure Hyundai RI RIPE13-026 FRINGS,EVAN VID Closed 7/11/13 12/30/13 IE13-035 4/10/13 92 172 Rear Lamp Failures Mercedes DS EAPE13-027 FRINGS,EVAN VID Open 8/19/13 1/14/14 IE13-063 7/3/13 47 134 Headliner Fires Jeep DS EAPE13-028 KIVETT,PETER MHDVD Open 8/26/13 IE13-047 5/8/13 110 127 Sway Bar End Link Failure Sparatan LNA N/APE13-029 MCHENRY,STEVE VCD Open 8/29/13 IE13-073 8/6/13 23 124 Sudden loss of transmission fluid Nissan ES N/APE13-030 SIMMONS,PAUL VCD Closed 9/6/13 10/25/13 IE13-071 7/11/13 57 49 Loss of brake power assist BMW RI RIPE13-031 HABIB,KAREEM VCD Closed 9/6/13 11/15/13 IE13-076 8/23/13 14 70 Electric powertrain propulsion failure Ford RI RIPE13-032 SEYMOUR,NATE MHDVD Open 9/20/13 IE13-082 9/6/13 14 102 Trailer Structural Cracks Cornhusker LNA N/APE13-033 MCHENRY,STEVE VCD Open 10/17/13 IE13-089 9/27/13 20 75 Reduced brake effectiveness Hyundai DS N/APE13-034 FRINGS,EVAN VID Open 10/21/13 IE13-036 4/11/13 193 71 Driver's Side Door Fires Jeep DS N/APE13-035 REICHARD,EMILY VID Open 10/21/13 IE13-074 8/14/13 68 71 Sunroof Implosion Kia LNS N/APE13-036 LEE,MICHAEL VID Open 11/4/13 IE13-088 9/26/13 39 57 Loss of Exterior Lights VW LNS N/APE13-037 GODFREY,WILL Open 11/15/13 IE13-093 10/24/13 22 46 Fire - Propulsion Battery - Road Debris Tesla LNS N/APE13-038 BOWKER,KYLE MHDVD Open 11/15/13 IE13-079 8/28/13 79 46 CNG Fuel Container Securement Ford LNS N/APE13-039 KIVETT,PETER MHDVD Open 12/9/13 IE13-096 10/30/13 40 22 Safety Chain Failures Utility Trailer LNS N/A

75
Business Process & Workforce Assessment of NHTSAs Office of Defects Investigation
For ODI Internal Use Only DTNH22-13-C-00318 43
Exhibit K: Propose Draft Templates
PE Type Activity Notes Dur w
k1
wk2
wk3
wk4
wk5
wk6
wk7
wk8
wk9
wk1
0
wk1
1
wk1
2
wk1
3
wk1
4
wk1
5
wk1
6
wk1
7
wk1
8
wk1
9
wk2
0
wk2
1
wk2
2
--- Draft and send IR Letter 2 wks--- Await Mfg Response 5 wksRI Review response; confirm scope 2 wksRI Chart complaints to confirm scope 3 wksRI Categorize VOQs & response 2 wksRI Negotiate scope As required 4 wksRI Review 573 for completeness 2 wksRI Draft & Approve Closing Resume 2 wksES Assess concequence; contact VOQs 2 wksES Assess concequence; work with Mfg 5 wksES VRTC Testing As required 5 wksES Prepare panel/NCC briefing As required 2 wksES Determine disposition 2 wksES Draft & Approve Closing Resume 2 wksDS Assess concequence; contact VOQs 2 wksDS Assess concequence; work with Mfg 5 wksDS VRTC Testing As required 5 wksDS Prepare panel/NCC briefing 2 wksDS Determine disposition 2 wksDS Draft & Approve Closing Resume 2 wksDD Assess concequence; contact VOQs 4 wksDD Assess concequence; work with Mfg 6 wksDD VRTC Testing 5 wksDD Analyze Data; determine disposition 4 wksDD Prepare panel/NCC briefing 2 wksDD Draft & Approve Closing Resume 2 wks
Planning Range:17 to 21 weeks
Planning Range:18 to 22 weeks
Planning Range:19 to 22 weeks
Planning Time:22 weeks
Targ
et: 1
50 d
ays
(22
wee
ks)
PE Type Activity Notes Dur w
k1
wk2
wk3
wk4
wk5
wk6
wk7
wk8
wk9
wk1
0
wk1
1
wk1
2
wk1
3
wk1
4
wk1
5
wk1
6
wk1
7
wk1
8
wk1
9
wk2
0
wk2
1
wk2
2
wk2
3
wk2
4
--- Draft and send IR Letter 2 wks--- Await Mfg Response 6 wksRI Review response; confirm scope 2 wksRI Chart complaints to confirm scope 4 wksRI Categorize VOQs & response 3 wksRI Negotiate scope As required 4 wksRI Review 573 for completeness 2 wksRI Draft & Approve Closing Resume 2 wksES Assess concequence; contact VOQs 4 wksES Assess concequence; work with Mfg 7 wksES VRTC Testing As required 5 wksES Prepare panel/NCC briefing As required 2 wksES Determine disposition 2 wksES Draft & Approve Closing Resume 2 wksDS Assess concequence; contact VOQs 4 wksDS Assess concequence; work with Mfg 7 wksDS VRTC Testing As required 5 wksDS Prepare panel/NCC briefing 2 wksDS Determine disposition 2 wksDS Draft & Approve Closing Resume 2 wksDD Assess concequence; contact VOQs 4 wksDD Assess concequence; work with Mfg 4 wksDD VRTC Testing 5 wksDD Analyze Data; determine disposition 3 wksDD Prepare panel/NCC briefing 2 wksDD Draft & Approve Closing Resume 2 wks
Planning Range:19 to 23 weeks
Planning Range:20 to 24 weeks
Planning Time:21 weeks
Planning Range:21 to 24 weeks
PE Type Activity Notes Dur w
k1
wk2
wk3
wk4
wk5
wk6
wk7
wk8
wk9
wk1
0
wk1
1
wk1
2
wk1
3
wk1
4
wk1
5
wk1
6
wk1
7
wk1
8
wk1
9
wk2
0
wk2
1
wk2
2
wk2
3
wk2
4
--- Draft and send IR Letter 2 wks--- Await Mfg Response 6 wksRI Review response; confirm scope 2 wksRI Chart complaints to confirm scope 4 wksRI Categorize VOQs & response 3 wksRI Negotiate scope As required 4 wksRI Review 573 for completeness 2 wksRI Draft & Approve Closing Resume 2 wksES Assess concequence; contact VOQs 4 wksES Assess concequence; work with Mfg 7 wksES VRTC Testing As required 5 wksES Prepare panel/NCC briefing As required 2 wksES Determine disposition 2 wksES Draft & Approve Closing Resume 2 wksDS Assess concequence; contact VOQs 4 wksDS Assess concequence; work with Mfg 7 wksDS VRTC Testing As required 5 wksDS Prepare panel/NCC briefing 2 wksDS Determine disposition 2 wksDS Draft & Approve Closing Resume 2 wksDD Assess concequence; contact VOQs 4 wksDD Assess concequence; work with Mfg 6 wksDD VRTC Testing 5 wksDD Analyze Data; determine disposition 4 wksDD Prepare panel/NCC briefing 2 wksDD Draft & Approve Closing Resume 2 wks
Planning Range:19 to 23 weeks
Planning Range:20 to 24 weeks
Planning Range:21 to 24 weeks
Planning Time:22 weeks

76
Business Process & Workforce Assessment of NHTSAs Office of Defects Investigation
For ODI Internal Use Only DTNH22-13-C-00318 44
Exhibit L: Summary of “DS” and “DD” PEs In Process in CY13
(Ranked by increasing completion times within divisions)
Observations and Comments:
• The proposed target completion is within 13 weeks after the receipt of the manufactures response to the IR letter, as shown in the proposed investigation templates in exhibit K located on page 44.
• PE12-001 completed in 47 weeks after the manufacturer’s response. This was partially due to longer testing time by VRTC. The PE was eventually upgraded to an Engineering Analysis. It is possible that this PE could have been upgraded sooner.
• In the VID group, 5 of the 7 PEs were handled by only 2 investigators. • PE12-019 was actually a PE and a TQ combined which resulted in a civil penalty to Ford
for approximately $17 million. The investigation workload included data analysis for the PE and development of a timeline of failure experience and engineering documents to support the TQ analysis in cooperation with NCC. This was a unique situation, as ordinarily TQ work would be conducted under a separate investigation with a TQ number assigned.
• PE12-033 and 13-003 are examples of investigations that were resolved by non-safety recall field actions. The time to complete these investigations included the times required to complete the PE assessment and internal review, negotiate appropriate resolution with the manufacturer and lead times for the manufacturer to develop and validate the remedies.
Pursuit Number Investigator Division
Status as of 12/31/13 PE Type Subject Make Est. Pop. VOQs Cr
ashe
s/ F
ires
Num
ber o
f In
jurie
s/Fa
talit
ies
Com
plet
ion
Tim
e Po
st R
espo
nse
(wks
)
ResultPE12-015 YOUNG,ROBERT MHDVD Closed DS Wheelchair restraint failure Ricon 3,000 1 0 1 9 No RecallPE13-017 KIVETT,PETER MHDVD Closed DS Aerial ladder bucket failure Sutphen 2,000 1 0 5 17 RecallPE13-019 BOWKER,KYLE MHDVD Open DS CNG Fuel Container Manual Valve Agility 1,000 0 0 0 22 N/APE13-009 MCHENRY,STEVE VCD Open DS Rapid coolant loss Posrche 10,000 10 0 0 15 N/APE13-018 RINEHARDT,DEREK VCD Open DS Reduced power during hard acceleration Ford 400,000 95 0 0 20 N/APE12-033 MCHENRY,STEVE VCD Closed DS Stuck Throttle Ford,etc 310,000 50 0 0 22 No RecallPE12-019 RINEHARDT,DEREK VCD Closed DS Stuck Throttle Ford, Mazda 730,000 99 13 10 24 RecallPE13-010 MCHENRY,STEVE VCD Closed DS Rear suspension knuckle failure Dodge 2,500 2 2 1 25 No RecallPE13-014 RINEHARDT,DEREK VCD Open DD Loss of Steering Capability Ford 340,000 5 1 0 25 N/APE13-003 HABIB,KAREEM VCD Open DS Electronic Throttle Body Malfunction Ford 724,982 1448 3 1 34 N/APE12-017 LASH,CHRIS VCD Open DS Loss of electric power assisted steering Ford 83,000 15 0 0 73 N/APE11-018 MCHENRY,STEVE VCD Closed DS Idle Instabiltiy ford 170,000 245 18 1 78 No RecallPE10-019 MCHENRY,STEVE VCD Closed DS Accel Pedal Interference Ford, Mecury 247,301 3 0 0 128 Upgraded to EAPE13-013 HERSHMAN,LAWRENCE VID Closed DS Loss of Low Beam Headlights Chevy 103,374 30 0 0 9 Upgraded to EAPE12-031 ABBOTT,JOHN VID Closed DD Difficulity in unlatching the harness buckle Graco Confidential 25 0 0 10 Upgraded to EAPE12-027 REICHARD,EMILY VID Closed DS Panoramic Sunroof Shatters Hyundai 18,361 11 0 0 11 RecallPE13-015 REICHARD,EMILY VID Closed DS Door Latch Failiure Mazda 39,000 4 0 0 12 RecallPE12-023 REICHARD,EMILY VID Closed DD SRS Warning Light Illumination Nissan 100,000 0 0 0 14 No RecallPE12-001 ABBOTT,JOHN VID Closed DS Fuel Tank Leak Mercedes 8,130 20 0 0 47 Upgraded to EA

77
Business Process & Workforce Assessment of NHTSAs Office of Defects Investigation
For ODI Internal Use Only DTNH22-13-C-00318 45
Exhibit M: Map of Recall Processing Process from Receipt of 573 Reports from Manufacturer to the Posting of the Recall Acknowledgment Letter (RCAK) to safercar.gov
Mfg
Jenn
ifer
Josh
Kelly
Krist
in
Y ??%
Triage:Risk
AnalysisAvg: 14/wkPeak: 95/wk
More Data
?
• Mfg• Model• Consequence
(non-compliance or defect)
Generate Number
N90%
Supply Data
Y 10%
• Names of Products• Problem Description• Consequence
Description• Notification Schedule• Population
Generate RCAK Letter
Hours:10%: 0.550%: 1.090%: 3.0
Supply Data
N 60%
More Data
?
Y 40% Review Letter
PassTech
?
Explain Data
Review & Approve
Send Letter
N ??%
Post Letter
Note the inherent variability within the process
Implement Web Portal
Get ‘surge capacity’ per
WF model
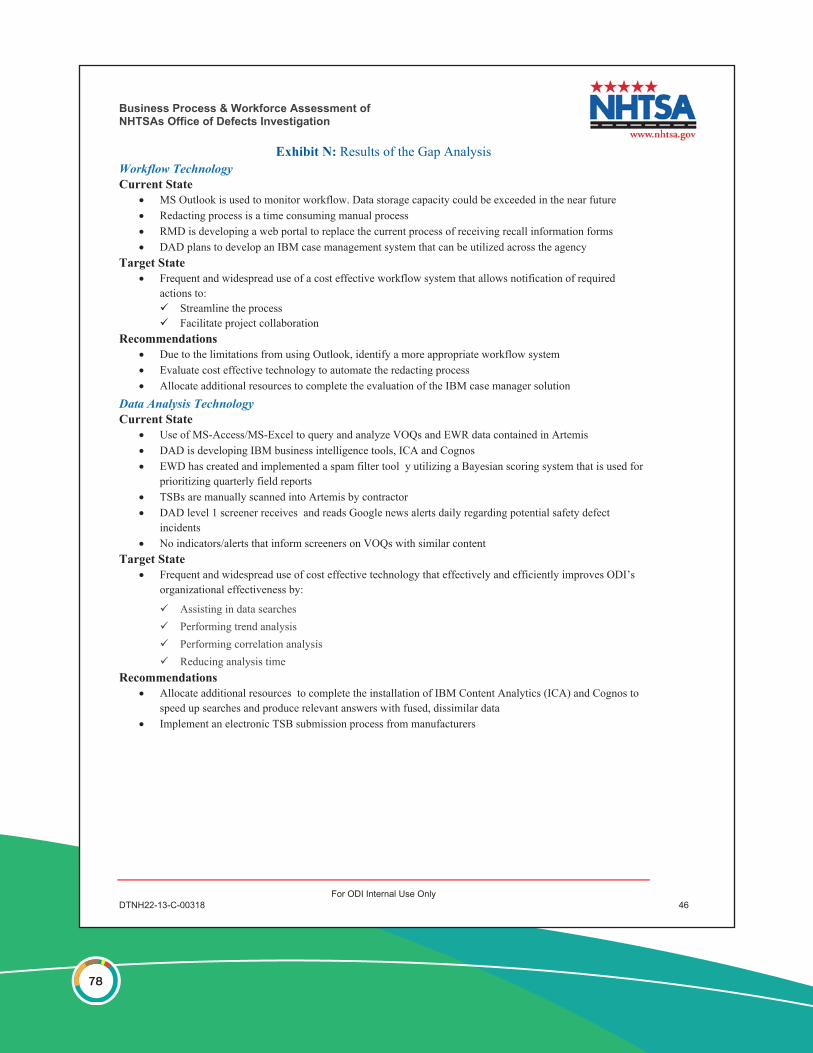
78
Business Process & Workforce Assessment of NHTSAs Office of Defects Investigation
For ODI Internal Use Only DTNH22-13-C-00318 46
Exhibit N: Results of the Gap Analysis Workflow Technology Current State
• MS Outlook is used to monitor workflow. Data storage capacity could be exceeded in the near future • Redacting process is a time consuming manual process • RMD is developing a web portal to replace the current process of receiving recall information forms • DAD plans to develop an IBM case management system that can be utilized across the agency
Target State • Frequent and widespread use of a cost effective workflow system that allows notification of required
actions to: Streamline the process Facilitate project collaboration
Recommendations • Due to the limitations from using Outlook, identify a more appropriate workflow system • Evaluate cost effective technology to automate the redacting process • Allocate additional resources to complete the evaluation of the IBM case manager solution
Data Analysis Technology Current State
• Use of MS-Access/MS-Excel to query and analyze VOQs and EWR data contained in Artemis • DAD is developing IBM business intelligence tools, ICA and Cognos • EWD has created and implemented a spam filter tool y utilizing a Bayesian scoring system that is used for
prioritizing quarterly field reports • TSBs are manually scanned into Artemis by contractor • DAD level 1 screener receives and reads Google news alerts daily regarding potential safety defect
incidents • No indicators/alerts that inform screeners on VOQs with similar content
Target State • Frequent and widespread use of cost effective technology that effectively and efficiently improves ODI’s
organizational effectiveness by:
Assisting in data searches Performing trend analysis Performing correlation analysis Reducing analysis time
Recommendations • Allocate additional resources to complete the installation of IBM Content Analytics (ICA) and Cognos to
speed up searches and produce relevant answers with fused, dissimilar data • Implement an electronic TSB submission process from manufacturers

79
Business Process & Workforce Assessment of NHTSAs Office of Defects Investigation
For ODI Internal Use Only DTNH22-13-C-00318 47
Archiving Technology Current State
• Documents are stored in Artemis’s Private ACMS with less than 100% compliance; of the 61 PEs in process in CY13:
9.8% of the archives were missing IR letters 37.5% of the archives were missing manufacturers response letters
• Uploading documents within Artemis is labor intensive, contributing to the backlog of the 61 PEs in process in CY13: IR letters are electronically archived with reasonable timeliness – only 20% were uploaded after more
than 7 days Archiving of the response letters was much worse – 20% were uploaded after more than 40 days
• Majority of critical documents are uploaded by a particular employee in CRD • Physical files are archived at an off-site physical location by a Program Analyst and a contractor
Target State • Frequent and widespread use of cost effective technology that assures efficient and timely electronic
storage and recovery of critical documents Recommendations
• Continue to use Artemis in the near time for archiving of critical documents • Implement a fail-safe mechanism within Artemis to assure the timely uploading of critical documents by
notification to the appropriate personnel • Create a document management team to mitigate the risk of a single point of failure for the document
uploading process • Streamline the physical scanning process by creating a flexible workcell to increase productivity and
timeliness of the document uploading process Performance Tracking Technology Current State
• Tracking process performance is a lengthy process of manually retrieving data from Artemis and/or developing an additional database tool to extract data from Artemis
• Tracking contractor performance is a qualitative, manual process performed by the COTR Target State
• Fully developed performance tracking tools that use a scorecard and dashboard for process performance to assist in: Information sharing and collaboration to promote data driven decision making Highlighting division accomplishments and effectiveness improvements Eliminating the need to gather information for last minute reports
Recommendations • Implement the capability to produce performance scorecards and dashboards:
Complete the development and evaluation of the IBM tool Cognos Investigate other capabilities to produce performance dashboards
• Create dashboards to quantify and measure contractor performance

80
Business Process & Workforce Assessment of NHTSAs Office of Defects Investigation
For ODI Internal Use Only DTNH22-13-C-00318 48
Business Process Current State
• Investigations are primarily run by a single Investigator: • Defect Petitions (DPs) are assigned to individual Screeners • Manual process of obtaining information from manufacturers • Non-standardized format for submission of EWR data from manufacturers • VOQ portable form process not user-friendly • No formal process of communicating decisions on manufacturers confidentiality requests from NCC to
ODI • Limited electronic standard policies and procedures without actual storage location
Target State • Discrete, value-added procedures are connected in a logical flow to optimize time and resources, yielding
effective business outcomes: Procedures are standardized and documented (SOPs) Clearly defined business rules are understood and used by employees Process uses a minimal number of non-value added procedures Effective use of collaboration and teamwork Effective use of employee skillsets Process is aligned with strategic objectives
• Best Practices are shared and used as a guide to successful team projects Recommendations
• Assign an Investigator to support the assigned Screeners for each DP • Provide training for screeners on formats for Information Request Letters • Implement automated correspondence processes (IRL, CRD) • Implement IE template and checklists • Create a centralized accessible storage location for policies and procedures (SharePoint)
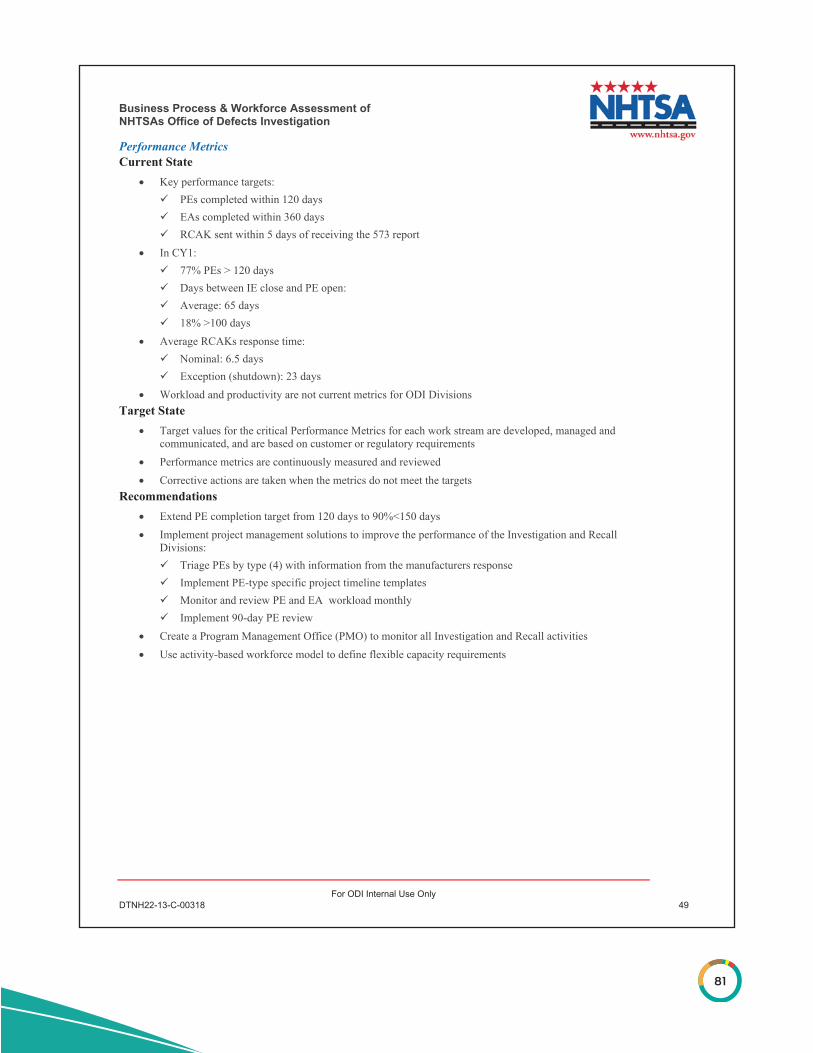
81
Business Process & Workforce Assessment of NHTSAs Office of Defects Investigation
For ODI Internal Use Only DTNH22-13-C-00318 49
Performance Metrics Current State
• Key performance targets: PEs completed within 120 days EAs completed within 360 days RCAK sent within 5 days of receiving the 573 report
• In CY1: 77% PEs > 120 days Days between IE close and PE open: Average: 65 days 18% >100 days
• Average RCAKs response time: Nominal: 6.5 days Exception (shutdown): 23 days
• Workload and productivity are not current metrics for ODI Divisions Target State
• Target values for the critical Performance Metrics for each work stream are developed, managed and communicated, and are based on customer or regulatory requirements
• Performance metrics are continuously measured and reviewed • Corrective actions are taken when the metrics do not meet the targets
Recommendations • Extend PE completion target from 120 days to 90%<150 days • Implement project management solutions to improve the performance of the Investigation and Recall
Divisions: Triage PEs by type (4) with information from the manufacturers response Implement PE-type specific project timeline templates Monitor and review PE and EA workload monthly Implement 90-day PE review
• Create a Program Management Office (PMO) to monitor all Investigation and Recall activities • Use activity-based workforce model to define flexible capacity requirements

82
Business Process & Workforce Assessment of NHTSAs Office of Defects Investigation
For ODI Internal Use Only DTNH22-13-C-00318 50
Exhibit O: Benchmarking; Business Process and Performance Comparison between ODI and DIR
ODI DIR
Pre-
Inve
stig
atio
n an
d Sa
fety
Def
ect S
cree
ning
Trend analysis of approx. 50,000 individual vehicle owner questionnaires (VOQs) per year
Trend analysis of quarterly reports from manufacturers
Screeners produce and transmit approx. 100 Issue Evaluations (IEs) per year and the IE Panel determines if a Preliminary Investigation should be opened
Approximately 1,800 complaints are received per year; 39% via phone, 54% online, 7% ‘other’
Each complaint is triaged by the Head of Defect Investigations:
Approximately 250 (14%) of the complaints are assigned to the six contract investigation field teams (Universities & Engineering firms)
Def
ect I
nves
tigat
ions
Approx. 40 (40%) of the IEs are elevated to Preliminary Evaluations (PEs)
Approx. 10 (25%) of the PEs are elevated to an Engineering Analysis (EA)
The average PE processing time is currently 6.5 months, with 20% exceeding 8 months (see Appendix A)
The average EA processing time is currently more than, 16 months, with 20% exceeding 25 months
Each investigator had 1 to 6 investigations (PE + EA) ongoing at a time in CY13, with an average of 2.2 simultaneous investigations. Two senior investigators averaged higher simultaneous investigations (3.4 and 4.4)
A majority (~95%) of the complaints are categorized as low level. Calculations suggest the average processing time is 3.5 months. The variability in processing times is unknown
The remaining 5% are considered ‘higher level’ investigations (equivalent to a PE or EA). Target completions are 6 to 12 months, “but that does not always happen”1. Calculations suggest the average processing time is 9 months. The variability in processing times is unknown
Each investigator has approx. 40 to 80 files ongoing at a time, 1 to 4 of which are higher level investigations
Each investigation is complete – there is no follow on work. (i.e. no EA following a PE)


DOT HS 812 167June 2015
11497b-060515-v4c