Workers Of The World Untied - ETF To Use Own Indexes ... Workers Of The World Untied By Tyler Mordy...
68
Workers Of The World Untied Tyler Mordy Navigating The New Normal Jeremy Siegel, Vineer Bhansali, Dennis Gartman, Robert Whitelaw and more The Case For A Global Portfolio Approach Michael Branch Using VIX-Based Instruments Nick Cherney, William Lloyd and Geremy Kawaller Plus Blitzer on the survival of indexing, Clark on a different kind of volatility index and Arnuk and Saluzzi on phantom indexes
Transcript of Workers Of The World Untied - ETF To Use Own Indexes ... Workers Of The World Untied By Tyler Mordy...

Workers Of The World Untied
Tyler Mordy
Navigating The New Normal
Jeremy Siegel, Vineer Bhansali, Dennis Gartman, Robert Whitelaw and more
The Case For A Global Portfolio Approach
Michael Branch
Using VIX-Based Instruments
Nick Cherney, William Lloyd and Geremy Kawaller
Plus Blitzer on the survival of indexing, Clark on a different kind
of volatility index and Arnuk and Saluzzi on phantom indexes

www.journalofindexes.com
POSTMASTER: Send all address changes to Charter Financial Publishing Network, Inc., P.O. Box 7550, Shrewsbury, N.J. 07702. Reproduction, photocopying or incorporation into any information-retrieval system for external or internal use is prohibited unless permission is obtained in writing beforehand from the Journal of Indexes in each case for a specific article. The subscription fee entitles the subscriber to one copy only. Unauthorized copying is considered theft.
www.journalofindexes.com
f e a t u r e s
V o l . 1 4 N o . 6
1November / December 2011
44
32
14
d a t a
n e w s
Selected Major Indexes . . . . . . . . . . . . . . . . . . . . . . . . . . . . . 59
Returns Of Largest U.S. Index Mutual Funds . . . . . . . . . . 60
U.S. Market Overview In Style . . . . . . . . . . . . . . . . . . . . . . . 61
U.S. Industry Review . . . . . . . . . . . . . . . . . . . . . . . . . . . . . . . . 62
Exchange-Traded Funds Corner . . . . . . . . . . . . . . . . . . . . . 63
BlackRock To Use Own Indexes . . . . . . . . . . . . . . . . . . . . . 50MSCI Focuses On Enhanced Beta. . . . . . . . . . . . . . . . . . . . 50Six HOLDRS To Become Van Eck Sector ETFs . . . . . . . . 50Case-Shiller Indexes Up In Q2 . . . . . . . . . . . . . . . . . . . . . . . 50Indexing Developments. . . . . . . . . . . . . . . . . . . . . . . . . . . . . 52Around The World Of ETFs. . . . . . . . . . . . . . . . . . . . . . . . . . 56Back To The Futures. . . . . . . . . . . . . . . . . . . . . . . . . . . . . . . . 57 Know Your Options . . . . . . . . . . . . . . . . . . . . . . . . . . . . . . . . 57From The Exchanges . . . . . . . . . . . . . . . . . . . . . . . . . . . . . . . 57On The Move . . . . . . . . . . . . . . . . . . . . . . . . . . . . . . . . . . . . . . 58
Workers Of The World UntiedBy Tyler Mordy . . . . . . . . . . . . . . . . . . . . . . . . . . . . . . . . . . . . . 10
Examining some unsettling economic developments.
Navigating The New NormalFeaturing Jeremy Siegel, Vineer Bhansali, Dennis Gartman,
Robert Whitelaw, Bill Witherell and Jeremy Held . . . . . . . 14
Experts tell investors how to keep up with the times.
Indexing In A Time Of Market Turmoil By David Blitzer . . . . . . . . . . . . . . . . . . . . . . . . . . . . . . . . . . . . 22
How did indexing weather the financial meltdown?
The Case For Global Stock PortfoliosBy Michael Branch. . . . . . . . . . . . . . . . . . . . . . . . . . . . . . . . . . 24
Investors should take a “big picture” approach.
Portfolio Applications For VIX-Based InstrumentsBy Nick Cherney, William Lloyd and Geremy Kawaller . . 32
Harnessing volatility to improve diversification.
Realized Volatility IndexesBy Andrew Clark. . . . . . . . . . . . . . . . . . . . . . . . . . . . . . . . . . . . 40
Looking beyond the VIX—a different kind of volatility index.
Phantom IndexesBy Joseph Saluzzi and Sal Arnuk . . . . . . . . . . . . . . . . . . . . . 44
Your index may not be measuring what you think.
Modern Portfolio TheoryBy Bruce Greig. . . . . . . . . . . . . . . . . . . . . . . . . . . . . . . . . . . . . . 64
Test your knowledge with an MPT-focused crossword puzzle.

Contributors
2 November / December 2011
Jose
ph
Sa
luz
zi
Ty
ler
Mo
rdy
Bru
ce
Gre
ig
An
dre
w C
lark
Nic
k C
he
rne
y
Mic
ha
el
Bra
nc
h
Da
vid
Bli
tze
rDavid Blitzer is managing director and chairman of the Standard & Poor’s Index Committee. He has overall responsibility for security selection for S&P’s indexes and index analysis and management. Blitzer previously served as chief economist for S&P and corporate economist at The McGraw-Hill Companies, S&P’s parent corporation. A graduate of Cornell University, he received his M.A. in economics from George Washington University and his Ph.D. in economics from Columbia University.
Michael Branch is a research analyst for asset management firm Aperio Group LLC. His research is focused on the areas of after-tax indexing, customized beta and global equities, and he has authored several research papers on topics of concern to institutional and high-net-worth audiences. Branch received his B.S. in finance from the University of Arizona. He holds the Chartered Financial Analyst designation and is a member of the CFA Society of San Francisco.
Nick Cherney is the chief investment officer, co-founder and member of the board of directors of VelocityShares. Previously, he had product development and management responsibilities for iPath ETNs at Barclays Capital. Prior to that, Cherney was a portfolio manager for iShares at Barclays Global Investors, where he managed over $25 billion of ETF assets. Cherney holds a B.A. with highest honors in economics from UC Berkeley and is a Chartered Financial Analyst.
Andrew Clark is chief index strategist for Thomson Reuters Indices. In this role, he is responsible for vetting index methodologies proposed by the firm’s partners. Clark is the chief “evangelist” for the Thomson Reuters index busi-ness, and has won several awards for his research. His work has appeared in several peer-reviewed journals, and more of his research will appear in the Journal of Index Investing and the Journal of Investing by the end of 2011.
Bruce Greig, CFA, CAIA, CMT, is the portfolio manager for Altin Holdings LLC. Altin Holdings is a commodity pool operator and registered invest-ment advisor specializing in managed futures and alternative invest-ments. Previously, he was co-founder and managing director of Symphony Investment Group LLC. Greig obtained his B.S. in mathematics and statis-tics from the University of Michigan and his MBA in finance from the Ross School of Business at the University of Michigan.
Tyler Mordy is the director of research for Hahn Investment Stewards, which delivers separate-account, ETF-only solutions. He is also a member of Hahn’s investment committee and writes the market commentary publi-cation ETFocus. Prior to joining Hahn Investment, Mordy was employed by Deutsche Asset Management in London. He earned his bachelor’s degree in both mathematics and English literature at the University of British Columbia; he is also a Chartered Financial Analyst.
Joseph Saluzzi is a partner, co-founder and co-head of equity trading of Themis Trading LLC, an independent agency brokerage firm that trades equities for institutional money managers and hedge funds. Prior to join-ing Themis, he headed an institutional equity sales and trading team at Instinet Corp. Saluzzi graduated from the University of North Carolina at Chapel Hill with an MBA in finance and received his bachelor’s degree in finance from New York University.

To download a copy of a prospectus, visit PowerShares.com/DBOpro
T H E P O W E R S H A R E S D B
OIL FUND
DBO

Copyright © 2011 by IndexUniverse LLC
and Charter Financial Publishing Network
Inc. All rights reserved.
Jim Wiandt
Editor
Heather Bell
Managing Editor
Matt Hougan
Senior Editor
Lisa Barr
Copy Editor
Laura Zavetz
Creative Director
Jodie Battaglia
Art Director
Jennifer Van Sickle
Graphics Manager
Andres Fonseca
Online Art Director
Aimee Melli
Production Manager
Editorial Board
Rolf Agather: Russell Investments
David Blitzer: Standard & Poor’s
Lisa Dallmer: NYSE Euronext
Henry Fernandez: MSCI
Deborah Fuhr
Gary Gastineau: ETF Consultants
Joanne Hill: ProShare and ProFund Advisors LLC
John Jacobs: The Nasdaq Stock Market
Mark Makepeace: FTSE
Kathleen Moriarty: Katten Muchin Rosenman
Don Phillips: Morningstar
John Prestbo: Dow Jones Indexes
James Ross: State Street Global Advisors
Gus Sauter: The Vanguard Group
Steven Schoenfeld: Global Index Strategies
Cliff Weber: NYSE Euronext
Review Board
Jan Altmann, Sanjay Arya, Jay Baker, William
Bernstein, Herb Blank, Srikant Dash, Fred
Delva, Gary Eisenreich, Richard Evans,
Gus Fleites, Bill Fouse, Christian Gast,
Thomas Jardine, Paul Kaplan, Joe Keenan,
Steve Kim, David Krein, Ananth Madhavan,
Brian Mattes, Daniel McCabe, Kris
Monaco, Matthew Moran, Ranga Nathan,
Jim Novakoff, Rick Redding, Anthony
Scamardella, Larry Swedroe, Jason Toussaint,
Mike Traynor, Jeff Troutner, Peter Vann,
Wayne Wagner, Peter Wall, Brad Zigler
4 November / December 2011

This information does not constitute an offer of services in jurisdictions where Standard & Poor’s does not have necessary licenses. Standard & Poor’s receives compensationThiss innforrmaatioon dooes noot cconnstitutte aan offfer of seerviicees in juurisdiictiions wwheree Stanndaardd & Pooorr’s ddoees not have nneccessary licensess. SStaandardd && PPoor’s receivees ccommpensationin connection with licensing its indices to third parties. It is not possible to invest directly in an index. Exposure to an asset class is available through investable instrumentsin coonnnecctioon with licensinng iits inddices to third paartiies. It is noot pposssibblee too innvest dirrectly in ann inndeex. Exxposure to ann assseet cclass is avvailable tthrrough investaablee innsttrummentsbased on an index. There is no assurance that investment products based on an index will accurately track index performance or provide positive investment returns. Standard &baaseed oon an inddexx. TTheere is no asssuuranncee thhatt investmmennt pprooduuctss baseed onn ann inndeex wwill acccuuraatelly tracck iinddex peerfoormmanncee or provvide ppospossitivve invvestmentt reeturnss. SStandardd &&Poor’s does not sponsor, endorse, sell, promote or manage any investment fund or other vehicle that is offered by third parties and that seeks to provide an investment returnPooor’s ddoees nott sponnsoor, endorsee, sselll, pprommoote or managee aanyy investmmennt ffunnd or othherr veehiclee thhat is offfered byy thy thhirdd parttiess and that seeekss too provvide aan invvesstment retuurnbased on the returns of any of our indices. For more information on any S&P Index and any further disclosures please go to www.standardandpoors.com. Copyright © 2010basedd oon tthee reeturns oof aanyy off ouur inddicees. Foor mmoore infformaatioon on anny S&&P Inddexx and anny ffurrtheer ddiscloosuures ppleasee ggo tto wwwww.sttandardaanddpooorrs.ccomm. Copyright © 2010Standard & Poor’s Financial Services LLC, a subsidiary of The McGraw-Hill Companies, Inc. All rights reserved. STANDARD & POOR’S and S&P are registered trademarksStaanddard && PPooor’ss Fiinaanccial Seervvicees LLC, a subbsidiaary of Thhe McGraww-HHill Commpaaniees, Innc. All rights resserrveed. STTANNDAARRD & POOORR’S and S&&P arre reggisttered traadeemarkksof Standard & Poor’s Financial Services LLC.o Sof SStandard && Poor’s Finnanncialal Services LLC
There’s nothing passive
about tactical precision.
Opportunities abound. With almost countless combinations
of sectors, industries and regions, your role is about seizing
those opportunities quickly. But where do you start?
Look to S&P Indices. With the vast number of ETFs that
track to and actively trade on our wide-ranging menu of
indices, you can make timely tactical moves.
• Act with speed to implement rotation strategies that move
between sectors such as materials or utilities.
• Consider fi ner-tuned, narrow industry positions in more
than a dozen specialized industries including biotech,
semiconductors, pharmaceuticals, or oil & gas services.
• Plan precise exposures that leverage macro and micro
trends in regions such as Latin America, Emerging Asia,
Europe, the BRIC countries and more.
Achieve more focus and agility with tactical solutions from
S&P Indices.
www.spindices.com/fi nancialadvisors
Project1 1/26/11 9:18 AM Page 1

Charter Financial Publishing Network Inc. also publishes: Financial Advisor magazine, Private Wealth magazine, Nick Murray Interactive and Exchange-Traded Funds Report.
Foster Wright
Publisher
�������������r�'BY��������������
Don Friedman
Director of Business Development
�������������r�'BY��������������
Fernando Rivera
Reprint Sales Director
�������������r�'BY��������������
Ivana Zivkovic
Subscriptions
�������������r�'BY��������������
Dan Benveniste
Executive Vice President, Analytics & Data
������������
Charter Financial
Publishing Network Inc.
����#SPBE�4USFFU �4VJUF����
4ISFXTCVSZ �/+������
�������������r�'BY�������������
Charlie Stroller, President/CEO/CFO
IndexUniverse LLC
����4BDSBNFOUP�4USFFU �4VJUF�����
4BO�'SBODJTDP �$"�������
�������*/%&9��r�'BY�������������
Jim Wiandt, President
6
For a free subscription to the Journal of Indexes, IndexUniverse.com or Financial Advisor magazine,
or a paid subscription to ETFR, please visit www.indexuniverse.com/subscriptions.
November / December 2011
The Journal of Indexes is the premier source for financial index research, news and data. Written by and for industry experts and
financial practioners, it is the book of record for the index industry.To order your FREE subscription, complete and fax this form
to 732.450.8877 or subscribe online at www.indexuniverse.com/subscriptions.
All questions must be answered to qualify for free subscription. Publisher reserves the right to reject unqualified applications.
� Q�Yes! Send me a free
subscription to Journal
of Indexes magazine
Name
Company
Address
City State ZIP
Phone Fax
Signature Date
Title
The following best describes my primary business activity (check one):
(1) Q�Plan Sponsor (2) Q�Financial Advisor
(3) Q�Investment Management (4) Q�Mutual Fund Management
(5) Q�Pension Fund Consulting (6) Q�Pension Fund Management
(7) Q�Brokerage (8) Q�Academic
(9) Q�Ordinary Investor (10) Q�Other:__________________
Do you personally sell, recommend or manage investments, work in the index
industry or advise clients on investment and/or asset management?
�������������������������������Q�Yes Q�No
If you advise clients as to their investments, how do you charge them?
���Q�Commission only Q�Fee only Q�Fee and commission
If you manage investments, what are your total assets under management?
(1) Q�Over $500 million (2) Q�$100 million - $500 million
(3) Q�$50 million - $99.9 million (4) Q�$25 million - $49.9 million
(5) Q�$10 million - $24.9 million (6) Q�Under $10 million
FREE SUBSCRIPTION OFFER!

����������������"���"
� � ,-' (-��&&$�(� ���-���, ���.".,-�������,,. ���2� �+�&�2,� �(%�������.-#)+$3 ���(��+ ".&�- ���2�-# ��$(�(�$�&�� +/$� ,��.-#)+$-2��(����' '� +�)!�-# ��)(�)(��-)�%��1�#�(" �� �+�&�2,���*$-�&�$,�-# �$(/ ,-' (-���(%$("��$/$,$)(�)!� �+�&�2,� �(%������0#$�#�.(� +-�% ,����, �.+$-$ ,��.,$( ,,�$(�-# �(�' �)!�$-,�0#)&&2�)0( ��,.�,$�$�+2� �+�&�2,���*$-�&��(�����(�������(��������' '� +��4���� �+�&�2,� �(%�������&&�+$"#-,�+ , +/ ��� �+�&�2,���*$-�&�$,���-+�� '�+%�)!� �+�&�2,� �(%�������&&�)-# +�-+�� '�+%,��, +/$� '�+%,�)+�+ "$,- + ��-+�� '�+%,��+ �-# �*+)* +-2���(��., ��0$-#�-# �* +'$,,$)(��)!�-# $+�+ ,* �-$/ �)0( +,�
INDICES CLEARLY FOCUSED
ON YOUR WORLD.
��������"��#����������������� ������������������������������������������ �������!�����!�������
���������"�� �����������"����"������������� ����������"�������������������+�0$("�)(�( �+&2���2 �+,��
)!� 1* +$ (� �$(�-# �$(� 1��.,$( ,,��0 �)!! +�2).���!.&&�,* �-+.'�)!�$(�$� ,��!+)'�� -��-)��&*#����&)("�0$-#��
�.,-)'$3�-$)(��(��$(()/�-$/ �,-+�- "$ ,�-)�' -��(2�$(/ ,-' (-�( ����)( 2�'�(�" +,��+).(��-# �0)+&��., ��
).+�51 ��$(�)' �$(�$� ,��(��+$,%��(�&2-$�,�-)�� (�#'�+%�-# �* +!)+'�(� �)!�-+$&&$)(,�)!��)&&�+,�)!�!.(�,���0#$�#��
$,�0#2�).+��)(��$(�$� ,��+ �-# �'),-�0$� &2�., ���2�����*+)/$� +,��0$-#�)/ +������$&&$)(�$(������ (�#'�+% ���
-)�-# '�"&)��&&2���)(( �-�2).+�0)+&��-)��� �+�&�2,���*$-�&��(� 1��(���& �+&2�!)�.,�)(�2).+�,.�� ,,���
�)+�$(� 1��(��+$,%�'�(�" ' (-�,)&.-$)(,��*& �, � '�$&�$(� 1���+��*��)'�
����������������� ���������������

8
Editor’s Note
Jim Wiandt
Editor
November / December 2011
A few years ago, investors around the globe found out that the choo-choo train ride they thought they were on was actually one of those amped-up roller coasters. You know, the kind that go through a lot of loops and dives and seem like they last
forever. Some people cry, some folks bargain with God and others throw up. The dismal state of the global economy, the sequential crises in various markets and
the dubious health of entitlements, pensions and retirement funds have all contrib-uted to the wild ride we’ve been experiencing. It appears that there’s no end in sight, and it looks like stomach-churning twists and turns are all that lie in our foreseeable future. So what’s an index investor to do? (Hint: The answer isn’t sewing your retire-ment money into the sofa cushions.)
First, Tyler Mordy pragmatically sums up the new (economic) world order in a thought-provoking piece that concludes with some practical suggestions for investors using passive vehicles. Fast on his heels is a group of experts—including Wharton’s Jeremy Siegel, Pimco’s Vineer Bhansali, Dennis Gartman of “The Gartman Letter,” and more—brimming with opinions on what you should be doing to navigate these murky waters. What’s probably the most surprising in this par-ticular roundtable is the unusual degree of consensus.
Then David Blitzer argues that what doesn’t kill indexing makes it stronger, offering examples of how the philosophy has demonstrated comparatively strong returns and some of the innovations that have flourished in the market turmoil.
Michael Branch of Aperio Group follows with an argument for taking a big-picture approach to international markets, in light of the globalization trend; he offers stats and examples to support his thesis that it results in greater efficiency and lower turnover.
Globalization isn’t the only trend that’s been growing over time—volatility had its big moment in the spotlight with the 2008 market meltdown, and it hasn’t conceded center stage since. An article from Nick Cherney, William Lloyd and Geremy Kawaller of VelocityShares discusses strategies investors can use to harness the VIX as a diversi-fication tool; Andrew Clark follows their lead with a discussion of the Thomson Reuters Realized Volatility Index and how it measures a different type of volatility than the VIX.
Joseph Saluzzi and Sal Arnuk of Themis Trading are up next, raising a very interest-ing point about the indexes we’re using today: Most of them rely on prices from com-ponent stocks’ primary exchanges, but that leaves out an awful lot of data. Can they really be considered accurate measures?
Bruce Greig of Altin Holdings LLC closes out the issue with a crossword puzzle built around a theory that has weathered the market gyrations fairly well. You’ll have fun with this one.
Wishing you solid footing in a rapidly evolving marketplace!
Our New Normal
Jim Wiandt
Editor


November / December 201110
By Tyler Mordy
Has capitalism come undone?
Workers Of The World Untied
www.journalofindexes.com 11November / December 2011
“In the long run, the workman may be as necessary to his master as his master is to him; but the necessity is not so immediate.” —Adam Smith, “The Wealth of Nations” (Book 1, Chapter 8)
In recent years, the most conspicuous feature of the financial landscape has been the growing divergence between U.S. labor and corporate profit trends.
While household incomes have languished, corporate earnings have soared—despite the most difficult eco-nomic cycle in the postwar period. These trends are having a significant impact on current and future equity market index returns.
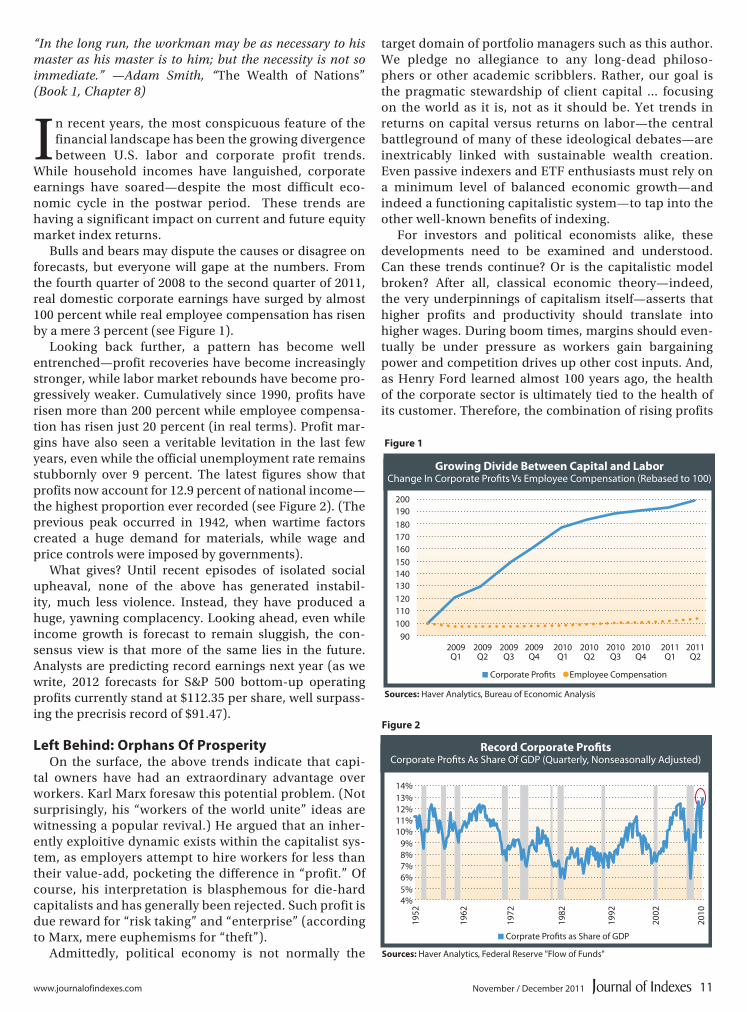
Bulls and bears may dispute the causes or disagree on forecasts, but everyone will gape at the numbers. From the fourth quarter of 2008 to the second quarter of 2011, real domestic corporate earnings have surged by almost 100 percent while real employee compensation has risen by a mere 3 percent (see Figure 1).
Looking back further, a pattern has become well entrenched—profit recoveries have become increasingly stronger, while labor market rebounds have become pro-gressively weaker. Cumulatively since 1990, profits have risen more than 200 percent while employee compensa-tion has risen just 20 percent (in real terms). Profit mar-gins have also seen a veritable levitation in the last few years, even while the official unemployment rate remains stubbornly over 9 percent. The latest figures show that profits now account for 12.9 percent of national income—the highest proportion ever recorded (see Figure 2). (The previous peak occurred in 1942, when wartime factors created a huge demand for materials, while wage and price controls were imposed by governments).
What gives? Until recent episodes of isolated social upheaval, none of the above has generated instabil-ity, much less violence. Instead, they have produced a huge, yawning complacency. Looking ahead, even while income growth is forecast to remain sluggish, the con-sensus view is that more of the same lies in the future. Analysts are predicting record earnings next year (as we write, 2012 forecasts for S&P 500 bottom-up operating profits currently stand at $112.35 per share, well surpass-ing the precrisis record of $91.47).
Left Behind: Orphans Of ProsperityOn the surface, the above trends indicate that capi-
tal owners have had an extraordinary advantage over workers. Karl Marx foresaw this potential problem. (Not surprisingly, his “workers of the world unite” ideas are witnessing a popular revival.) He argued that an inher-ently exploitive dynamic exists within the capitalist sys-tem, as employers attempt to hire workers for less than their value-add, pocketing the difference in “profit.” Of course, his interpretation is blasphemous for die-hard capitalists and has generally been rejected. Such profit is due reward for “risk taking” and “enterprise” (according to Marx, mere euphemisms for “theft”).
Admittedly, political economy is not normally the
target domain of portfolio managers such as this author. We pledge no allegiance to any long-dead philoso-phers or other academic scribblers. Rather, our goal is the pragmatic stewardship of client capital ... focusing on the world as it is, not as it should be. Yet trends in returns on capital versus returns on labor—the central battleground of many of these ideological debates—are inextricably linked with sustainable wealth creation. Even passive indexers and ETF enthusiasts must rely on a minimum level of balanced economic growth—and indeed a functioning capitalistic system—to tap into the other well-known benefits of indexing.
For investors and political economists alike, these developments need to be examined and understood. Can these trends continue? Or is the capitalistic model broken? After all, classical economic theory—indeed, the very underpinnings of capitalism itself—asserts that higher profits and productivity should translate into higher wages. During boom times, margins should even-tually be under pressure as workers gain bargaining power and competition drives up other cost inputs. And, as Henry Ford learned almost 100 years ago, the health of the corporate sector is ultimately tied to the health of its customer. Therefore, the combination of rising profits
2009Q1
2009Q2
2009Q3
2009Q4
2010Q1
2010Q2
2010Q3
2010Q4
2011Q1
2011Q2
200
190
180
170
160
150
140
130
120
110
100
90
� Corporate Profits Employee Compensation
Growing Divide Between Capital and LaborChange In Corporate Profits Vs Employee Compensation (Rebased to 100)
Sources: Haver Analytics, Bureau of Economic Analysis
Figure 1
Record Corporate Profits�������������������� ���������������������������������������������
Sources: +�/���������.-���*�������,����/���*��0����*�����
!$�
!#�
!"�
!!�
! �
)�
(�
'�
&�
%�
$�
!)%"
!)&"
!)'"
!)("
!))"
" "
" !
� ������������������� �����������
Figure 2

November / December 201112
and stagnant income growth (and thus weak aggregate demand) cannot possibly last forever.
Or can it? In a globalized era, a new investment class has emerged—the multinational corporation. Rising out of a more interconnected world, these companies transcend the restrictions of individual nation states, roving the globe for arbitrage and profit opportunities. They can seamlessly shift production from country to country, accessing better tax regimes and, importantly, cheaper labor. The same advantages are now also available to global portfolio man-agers, as client capital can be invested in profitable econo-mies or enterprises anywhere around the world.
A Crisis Of Capitalism?To be sure, predicting the demise of capitalism is noth-
ing new. Time magazine’s April 1980 cover story, titled “Is Capitalism Working?”, bemoaned the decline of free enter-prise and the “vitality and élan” of capitalists.1 That article printed immediately before profit margins made a secular trough and a generational stock market upswing began.
Also, on one point, let’s be clear. Capitalism, in its pure form, hardly exists today. If it did, governments would also allow market discipline to work on the downside. Clearly, that has not been the observable case recently. Witness banking bailouts, sovereign bond guarantees and numerous other government interventions. Clearly, the “socialization of losses” and “privatization of gains” is today’s status quo.
Still, looking beyond this asymmetric form of capitalism, perhaps the largest threat to the long-term health of the domestic economy remains the disparity between labor and capital trends. To understand forward risks, a look back at historical trends in profit margins is instructive.
Beyond cyclical influences, secular forces also have been at work. Two major margin troughs have occurred since the 1930s. The first occurred immediately after the Great Depression, where the combination of World War II military spending and the 1950s reconstruction boom restored profit margins from the difficult 1930s. For the next two decades, however, the environment was less hos-pitable, as rapid unionization and high inflation initiated a structural decline in margins to the end of the 1960s.
The second significant trough happened in the early 1980s. So-called Reaganomics—supply-side reforms aimed at reducing both government regulation and mar-ginal income taxes—swept across Western economies. This also led to the systematic dismantlement of unions, increasing labor mobility and competition. Meanwhile, free-market capitalism was taking hold in developing parts of the world, creating a boom in international trade, cross-border capital flows and, of course, global labor arbitrage. The net result was a marked improvement in labor productivity and, consequently, profit margins.
Why is the above important? Because these trends have contributed to an income distribution progres-sively skewed toward capital at the expense of labor in many Western countries. Statistical measures of income inequality (such as the Gini coefficient) have steadily drifted higher over the last few years. Until recently, households did not take notice. Aided and abetted by easy monetary policy, they relied on lower savings, asset bubbles and housing-financed debt growth to plug the gap between subdued increases in wage growth and con-tinuing increases in consumption.
Capitalism (as it has been sold in the West) is hardly supposed to work this way. Having a more egalitarian income distribution (i.e., a middle class) results in not only a more stable, equitable society but also generates greater prosperity over the long run. A prosperous middle class buys houses and cars, and sees its children, properly edu-cated, become leaders and entrepreneurs of tomorrow.
In a globalized world, the same trends that favor the multinational corporation also place workers in a weak negotiating position. It has become increasingly difficult for workers to overcome the pressures of mobile capital and regain a greater share of any prosperity. However, if a country cannot sell its products internally, which country ultimately wins? It should not come as a surprise that the most income-skewed nations including the United States are now facing weak domestic demand.
Shareholder-Driven Capitalism
Restrained wage growth has not been the only corporate cost-cutting measure supporting record margins. In fact, other structural trends, in place for some time now, have acted to bolster short-term profits while simultaneously undermining both labor growth and longer-term profits. Importantly, maximizing shareholder value has often been placed ahead of productive wealth accumulation. This is primarily an outgrowth of changing incentive structures since the early 1980s. Facing short-term quarterly earnings pressures, option-laden managers (whether consciously or not) favor measures that immediately boost share prices rather than securing long-term profit growth. For example, since the late 1990s, spending on capital equipment and software has significantly lagged earnings growth (see Figure 3). Over time, these actions deplete productive capital formation, reduce macroeconomic growth and ulti-mately contribute to a reduction in employment.
Does all this matter to investors? After all, many of
Capital Formation DecliningEquipment and Software Spending, % of GDP
(Quarterly, Seasonally Adjusted)
Source: Haver Analytics
14%
13%12%11%10%
9%8%
7%6%5%4%
19
47
19
57
19
67
19
77
19
87
19
97
20
07
20
10
� Corporate Profits as Share of GDP� Capital Equipment and Software as Share of GDP
Figure 3

www.journalofindexes.com 13November / December 2011
these trends in labor arbitrage and other short-term performance enhancers can persist for some time. And, much of the above may only be important over the very long run (as Keynes once said, “... the long run is a mis-leading guide to current affairs. In the long run we are all dead.”). Yet looking at the current economic cycle, many of these factors do indeed have a finite life, even for the indomitable multinational corporation.
In fact, profit margins will likely confront trouble in the period immediately ahead. Many factors that contributed to record margins, both on a cyclical and a structural basis, have either run their course or have simply been “one-off” profit boosters. Of course, subdued labor costs have been a key prop here. But other factors have been similarly important. For example, the Bernanke Fed has lowered interest rates to nearly zero. Correspondingly, corporate net interest payments have fallen dramatically since the onset of the financial crisis (see Figure 4). How likely is this to be repeated? Rates cannot fall much lower, certainly not to the extent that they already have.
There are many more notable examples, not least of which is fading government stimulus and a shift toward austerity measures. But the important point is that
further productivity gains will be more difficult in the period directly ahead without either employee hiring or renewed capital spending. In fact, a productivity down-turn may have already begun. Labor costs and tensions have been rising this year. Figures from the Bureau of Labor Statistics show nonfarm business productivity contracting in the first and second quarters of 2011 by 0.6 percent and 0.3 percent, respectively.
So far, our profit discussion has centered on “bot-tom line” factors. However, “top line” factors are equal-ly crucial. Most of recent earnings growth has come from government-sponsored growth rather than organic expansion in aggregate demand or consumer incomes. Ultimately, however, growth in top-line revenue depends on the financial health of its customers (whether they are domiciled domestically or internationally). In a postcred-it-driven world, consumer spending—certainly in most slow-growth Western regions—will rely more on income growth than rising debt burdens. Yet it’s highly unlikely there will be wage growth acceleration given the high level of unemployment and corresponding weakness of labor’s bargaining position. That makes the revenue out-look, which has already been anemic, less than rosy (see Figure 5). Margins and, importantly, earnings will have little protection during the next economic downturn.
Undoubtedly, however, corporations will remain focused on cost control and productivity gains. As part of that equation, financial engineering will remain key. Consider that companies have a number of options when utilizing their capital. They can reinvest in the underlying business, retire debt, buy back shares or pay out divi-dends. Why would corporate executives pursue the first two options when aggregate demand is weak and interest rates are at historic lows (and pledged to remain there until at least mid-2013)?
A more rational approach, even if not beneficial to labor, attempts to boost stock prices by reducing share count or increasing dividends. That has been the observ-able case, as corporations have been actively increasing dividends or share buybacks. For the first half of 2011, the net domestic common stock dividend increase of $30.2 billion already surpasses all of 2010, representing an 11.1 percent increase (4.1 percent for Q2 and 6.7 percent Q1). From a capital allocation standpoint, these trends are completely logical and likely to continue for some time.
Investment OutlookMany are predicting that high corporate cash positions and
healthy balance sheets will lead to stronger domestic employ-ment growth and higher incomes. However, a more likely scenario is that corporations will emphasize overseas expan-sion instead of domestic hiring and investment. This would be consistent with recent trends. In the past five years, U.S. direct investment overseas has been 20 percent higher than domestic nonresidential investment. During the 1960s and 1970s, that ratio averaged 6 percent before climbing to a 13.5 percent average between the mid-1990s and mid-2000s.2
2009Q1
2009Q2
2009Q3
2009Q4
2010Q1
2010Q2
2010Q3
2010Q4
2011Q1
2011Q2
0$100
-$100-$200-$300-$400
$200$300$400$500$600$700$800$900$1,00
� Corporate Profits GDP Net Interest Payments
Enormous Interest Rate Relief
Change In Corporate Net Interest Payments (With IVA and CCA)
Sources: Haver Analytics, Bureau of Economic Analysis
Bill
ion
s
Business Cycle Will Not Be Repealed����������������������������������� ���
Sources: &�������*��)������
� �
��
�
!�
#�
$�
���
� "�
� ����"�����
�"���
���
��
�%%!
�%%#
�%%$
���
��
��!
��#
��$
���
���
"�
�"�
▲▲▲▲▲▲▲▲▲▲
� ���������������"���������(&���
� ����"����������� �����'&����
Figure 4
Figure 5
continued on page 48

November / Dece,mber 201114
A roundtable
Navigating The New Normal
www.journalofindexes.com November / December 2011 15
We’ve been through an unprecedented few years, such
that it seems almost as if the markets and the accepted
rules that governed them have evolved at a fundamental
level. Journal of Indexes sat down with a group of experts
to discuss the changed market environment and what it
means for investors.
Jeremy Siegel, Senior Investment
Strategy Advisor, WisdomTree;
Russell E. Palmer Professor of Finance,
Wharton, University of Pennsylvania
JOI: Has the nature of investing changed
in the last few years?
Siegel: What’s difficult is that what people are doing
and what people should be doing, in my opinion, is not
the same thing. The last 10 years have not been good for
stocks—we all know that. And we know there are quite
a few economic problems facing this country and the
world. But it’s my feeling that investors are overreacting
to all this negative sentiment in the market and are taking
too cautious a position with regard to investments, and
are ignoring the long-term data.
This is something that has occurred throughout history,
where stocks don’t do well and people are down on stocks.
Then when stocks do perform well, they get up—in fact, too
far up—on stocks. Right now, we see a very risk-averse invest-
ment strategy—a fearful investment strategy—where people
are willing to lock in yields on bonds that, to me, are extremely
poor compared to any historical calculation of stock returns.
JOI: Given a decade of negative returns and massive vol-
atility, does traditional index investing still make sense?
Siegel: There are several types of index investment. There
is the original capitalization-weighted indexing. There
are newer forms of indexing, called fundamental index-
ing, which tilt portfolios towards value stocks, towards
high-dividend stocks and high-earning stocks. My feeling
is the next 10 years will be good for straight capitalization-
weighted indexing, but will be even better for those who
invest with an index tilted towards high-dividend and high-
earning stocks. In fact, what is interesting is that had inves-
tors in 2000 invested in value stocks, the returns through
this last decade would have been much, much better. One
of the major reasons for the very poor performance of the
market over the last 10 years was the bust in technology
stocks from the very overvalued position that they achieved
when we reached the turn of the century.
JOI: What have been the biggest paradigm shifts in the
global economy in the last five years?
Siegel: I think the greatest paradigm shift has definitely
been the rise of the emerging markets—India, China,
Brazil. Their economic growth has been excellent. They
have come through the financial crisis in a Great Recession
much better than the developed world. And I think that any
investment policy has to be a global policy with a signifi-
cant weight given to emerging markets.
JOI: Is program trading driving short-term stock move-
ments? Are ETFs to blame?
Siegel: One has to realize that in bear markets in reces-
sions, stock volatility has always been higher. We are in
unusual economic times, clearly, with debt building up
rapidly in the developed world, the downgrading of U.S.
Treasury bonds and a very weak recovery in the United
States, Europe and Japan. Whenever it is unusual times,
that brings about volatility. But we had extreme volatility in
the 1970s, high inflation and severe recessions. The great-
est volatility was in the 1930s, and we’re nowhere near that,
even today. That was the Great Depression.
I do not believe that program trading is responsible
for that. I don’t believe ETFs are responsible for that. The
main difference as time goes on in the markets is that
the speed of information travels faster and faster, and
rumors travel faster and faster, and your ability to get a
trade in and out is faster than ever—and at the lowest
cost. So you will see a lot of short-term volatility.
I don’t think investors should be scared off by that,
because if they’re going in for long-term value, they can
sometimes pick up some good values when the short-
term volatility drives prices downward. I would advocate
that investors use those opportunities to accumulate
equities and actually thank program traders for giving
them bargains in the market.
JOI: When rates finally start to rise, will fixed-income
index investors suffer? Are they prepared for that?
Siegel: It will happen by necessity, because I believe that
the expectations of interest rate increases that are built
into bonds are too low. I myself do not believe that the
Fed absolutely will be able to keep interest rates as low as
they claim they intend to over the next two years, because
I believe that we will resume economic growth in the next
six to 12 months, and that would force the Fed to raise
rates. If they do raise it before the summer of 2013, you
can be sure that the bondholders will suffer some severe
capital losses, and I do not believe that most investors in
bond funds are recognizing those real risks.
JOI: Are investors in danger of overweighting emerging markets?
Siegel: I think most investors are still underweight in
international stocks. International stocks in developed
and emerging markets are approximately 60 percent
of the value of total equities outstanding, and very few
investors have that much in foreign stocks. An aggressive
position in emerging markets would be an allocation of
one-third of your total equities, and that would be diversi-
fied across all emerging markets. Anything above a third
is certainly taking on extra risk. It may be rewarded, but it
is extra risk. Also, it’s dangerous to put all your eggs in one
basket. Clearly, any one country can go south and disap-
point. That’s why diversification is the key.
But I would overweight emerging markets in the portfolio
compared to their market value weight, which is probably
around 10 or 15 percent. Up to a third, although aggressive, I
would say, is not uncalled for in the long run.

JOI: At what price is gold too expensive?Siegel: I believe that five years from now, investors in gold will be disappointed in their returns compared to stocks. It doesn’t mean it might not go up in the short run—it might go up to $2,500 or $3,000. In the short run, there is no way to predict. But in terms of long-run value, I think that as our world economy improves, fewer and fewer investors will be fleeing to gold as a safe haven, and that will cut its return.
JOI: What key wisdom would you offer investors faced with extreme volatility and fear in the market? Siegel: Again, buy good dividend-paying stocks with good yields, companies that have been around for a while and have earnings that cover their dividends quite adequately. Diversify on a worldwide basis. If you pick those with high earnings and high dividends and diversify them, I think you’re going to get extraordinary values that are going to please you very much with their returns over the next five to 10 years.
Vineer Bhansali, Managing Director and Portfolio Manager, Pimco
JOI: Has the nature of investing changed in the last few years?Bhansali: Market realities have altered.
Investors are now faced with greater volatility, intercon-nectivity and unthinkables becoming possible. Who could have envisioned S&P downgrading the AAA rating of the U.S., or that the institutional integrity of the eurozone would be threatened as policymakers dithered?
The changing global paradigm influences investment positioning, asset allocations, return expectations and risk management.
JOI: Given a decade of negative returns and massive vol-atility, does traditional index investing still make sense?Bhansali: In fixed income in particular, many indexes are structured to represent markets rather than investable strategies. In addition, the performance characteristics of fixed income make negative events, such as defaults, much harder to overcome. As a result, and given increased vola-tility, indexation in fixed income should be approached very carefully, particularly in credit-sensitive sectors.
For investors that value index strategies, we suggest that they seek strategies based on indexes that are thoughtfully constructed for investment purposes, that are optimized based on factor exposures and recognition of default risk, and that use trading strategies based on preserving value. In particular, indexes that are based on forward-looking dynamics, rather than backward-looking market data, may be of particular value in this environment.
JOI: What have been the biggest paradigm shifts in the global economy in the last five years?Bhansali: The importance of structural issues vs. cyclical ones is the ultimate paradigm shift, and, unfortunately, policymakers have been slow to recognize this.
The cyclical rebound many expected and hoped for has
not occurred, and we have long argued it would not occur, as the U.S., U.K. and other finance-dependent major econ-omies come off a “great age” of leverage, debt and entitle-ment. The challenges facing the global economy, including head winds to growth in developed nations and potential overheating in certain emerging markets, are compounded by policymakers’ disagreements over not just how to address them, but the analysis and underlying causes.
Despite the structural impediments to growth, policy-makers in the U.S. and Europe have yet to deploy structural solutions, preferring cyclical instruments (such as the Fed’s quantitative easing) that haven’t proven effective. The politi-cal system must enable that shift to a structural approach.
President Obama’s jobs proposal and related speech on Sept. 8, for example, at long last recognized the severity of America’s unemployment crisis and the need for a com-prehensive policy response.
JOI: Is program trading driving short-term stock move-ments? Are ETFs to blame?Bhansali: High-frequency [HFT] and algorithm-driven trading was estimated to account for about one-third of all U.S. equity trading volume in 2006. It has grown now closer to 75 percent. It is hard to reasonably argue that HFT does not have some effect on intraday price movements. The real question, however, is whether the overall change in equity market structure has increasingly driven short-term stock movements. The elimination of the floor specialists, the increased number of market makers and the growth of electronic trading have all expanded the number of par-ticipants showing two-sided markets at any given time. But the depth of those markets has been shown to be relatively shallow, particularly in times of market stress.
While ETFs are certainly used with increasing frequency to access broad market sectors on the long and short sides, and to manage risks—particularly at times of greater mar-ket volatility—ETFs have not been the drivers of this vola-tility but have certainly been impacted by it. For example, several detailed studies of the “flash crash” point to various potential causes of this event, but most concluded that the structure of the equity market as a whole was the dominant driver, not ETFs. ETFs represent about 25 percent of all equity trading volume, on average, rising to as much as 35 to 40 percent during strong market sell-offs. So while many equity ETFs were impacted by the flash crash, as they rep-resented a significant portion of the trading volume on that day, they were not the unique cause of it.
JOI: When rates finally start to rise, will fixed-income index investors suffer? If so, are they prepared?Bhansali: Investors are navigating a multispeed world, with the potential for their portfolios to be affected by com-plex risks and cross currents, including interest rate risk. The Fed’s pledge to maintain the federal funds rate near zero through mid-2013, coupled with signs of economic slowing in the U.S. and abroad, suggest interest rate risk is likely to be modest in the near term. Over a longer time frame, perhaps three to five years, we expect gradually ris-
November / December 201116

ing inflation. However, we also see heightened volatility as characteristic of the New Normal, with the potential for surprises in inflation and interest rates. Investors may want to actively manage duration exposure, lowering duration if they anticipate substantial inflation and raising—or simply maintaining—duration if inflation is less of a concern.
JOI: What impact will the recent spike in volatility have on investor allocations? Bhansali: Investors may reconsider their approach to risk management across all assets. They arguably need to eval-uate the full spectrum of global developments—economic, financial, institutional, legal, demographic, regulatory and geopolitical—all in a risk-factor framework.
We also believe investors should consider tail risk hedg-ing, since policy mistakes and market accidents are vir-tually inevitable in this New Normal, where traditional market linkages are in flux, and both market and policy infrastructure are increasingly stressed.
JOI: Are investors in danger of overweighting emerging markets?Bhansali: Generally speaking, no. Emerging markets have become centers of global growth, with tail winds pushing these nations up the development curve, and slowly narrow-ing the wealth and production gap with developed nations. We believe global investors remain significantly underweight emerging market assets in relation to both their current and future share of the world economy, as well as in relation to the trends in their relative credit fundamentals. As markets reorient to a New Normal view of the world, we anticipate this under-allocation to emerging markets will decrease, providing multiyear support for the asset class.
To be sure, emerging nations now are confronting chal-lenges from de-leveraging and economic sluggishness in the developed world. Emerging markets are also faced with potential consequences of their own success, includ-ing rapidly appreciating currencies and inflation. Whether emerging markets can continue to manage success is becoming a country-by-country question. For example, we have been anticipating a “soft landing” for China, but the risks of a “hard landing” are becoming greater, in part due to China’s exposure to and reliance on trade with the developed markets, but also due to tighter monetary measures from Chinese authorities intended to curb credit expansion and real estate inflation.
Dennis Gartman, Publisher, The Gartman Letter
JOI: Has the nature of investing changed in the last few years?Gartman: The nature of investing changes
all the time. It’s never the same. But if there’s one major change that I’ve noticed amongst the public, it’s that buy-and-hold has probably died a much-needed and impera-tive death. The idea of buying something and holding it forever is probably not going to survive much longer.
JOI: Given a decade of negative returns and massive vol-atility, does traditional index investing still make sense?Gartman: Oh sure, absolutely. Why would you not? It’s by far the easiest way for the public to get diversification, and it’s clearly the most cost efficient, because the cost of bro-kerage is so much less for the indices than it is for mutual funds. Is the idea of holding an index forever going to stay with us? No; that’s died a much-needed death, as I said.
JOI: What have been the biggest paradigm shifts in the global economy in the last five years?Gartman: The understanding that China is now a major force in the world market, that soon it will surpass the United States as far as gross domestic product is concerned. It will be decades before China comes even close to our GDP in per capita terms, but because of its sheer size and population, it’s going to surpass the United States as far as gross domestic product is concerned. China’s citizenry are moving up the income scale rather rapidly, and in the not-too-distant future, the world will understand that China’s going to be a net importer, not a net exporter. That, I think, is the next tectonic and tidal shift in the understanding of how the global economy is changing.
JOI: Is program trading driving short-term stock move-ments? Are ETFs to blame?Gartman: No, ETFs are not to blame. No, I am not a believer that program trading is discouraging or distorting invest-ment. And in fact, I’m of the opinion that program trading and high-frequency trading do, in fact, create liquidity. They don’t inhibit liquidity—they create liquidity. I’m not one of the people who fear either program trading or high-frequen-cy trading at all. In fact, I would encourage them.
JOI: When rates finally start to rise, will fixed-income investors suffer? Are they prepared for that?Gartman: When rates rise, fixed-income investors will suffer. By definition, that’s the math of the situation. The question is, when will rates rise? And I suspect that they will rise far more distant into the future than almost any-body wants to anticipate now. Some of the saddest people I can ever remember are my friends who bet on rising interest rates in Japan 15 years ago, and or any time since then. And they’re still waiting for rates to rise. The sums of money they have lost trying to be short the Japanese bond market is mind-numbing.
JOI: What impact do you think the recent spike in volatil-ity will have on investor allocations? Gartman: I think it will absolutely have an effect upon investor allocations. The public does not like volatility. The public would much prefer stability. And in fact, most pro-fessionals would much prefer stability rather than volatil-ity. I’m a pro—I’ve been at this 35 years—and I much prefer stable circumstances over volatile circumstances. I think that volatility begets the propensity not to be involved in investment: It makes people hunker down and go to the sidelines, and that’s not a good thing.
www.journalofindexes.com November / December 2011 17

JOI: Are investors in danger of overweighting emerging markets?Gartman: Investors are in danger of doing everything wrong at the wrong time all the time. So are they in danger of over-investing in emerging markets? Probably. Should they be investing in emerging markets? Absolutely. When will I know that they’re over-invested? When prices start to tumble. And so, I would tell them a reasonable portion would be 5 or 10 percent. If you’re a reasonably adept investor, 5 to 10 percent of what you invest should prob-ably be within an emerging market exposure. Beyond 30 percent, you’re probably too exposed.
JOI: At what price is gold too expensive?Gartman: Today’s [Aug. 23, 2011] high. I think today’s high may well be the high for gold for a while. It traded at $1,910 there one time this morning. And the bullish consensus from Market Vane was 95 percent bullish, and I saw some-thing really interesting: GLD, the gold ETF, had a higher capitalization as of Aug. 19 than did SPY, which is the most actively traded ETF. It’s the ETF for the S&P itself. How can gold have a higher capitalization than stocks generally? That’s what happens at the end of manias.
JOI: What key wisdom would you offer investors faced with extreme volatility and fear in the market?Gartman: Get smaller. That’s what every pro tells himself when markets get volatile and confusion reigns—and the great pros follow their own advice. Get smaller, trade smaller, invest smaller and wait until the smoke clears. It will eventually clear. The volatility that we had two weeks ago when we were up 400, down 400, up 400, down 400, as Herb Stein said, “That which cannot continue, won’t.” That couldn’t continue. It won’t.
Trade smaller amounts, invest smaller amounts of money. And trade bigger and better names than you did previously.
Robert Whitelaw, Chief Investment Strategist, IndexIQ; Edward C. Johnson 3D Professor of Entrepreneurial Finance, Stern School of Business, NYU
JOI: Has the nature of investing changed in the last few years?Whitelaw: I don’t think the fundamental principles of investing have changed, but what I think is that inves-tors may have learned some things from the crisis and, of course, the aftermath, which we’re going through right now. As a result, they’ve changed the way that they invest. There are three things that people have learned. One is the reason that risky assets tend to pay higher returns on average—it’s because they’re really risky. And what risk means is that these assets won’t always out-perform even over relatively long periods. I think we’ve gained an appreciation for risk.
I think we’ve also learned that diversification is not just picking a few bonds and adding them to your U.S.-centric stock portfolio. There’s now—certainly I hope—more inter-
est and a greater awareness of non-U.S. assets and alterna-tive asset classes, like emerging markets, commodities, etc.
Finally, I think one thing that people have talked about for a long time but maybe didn’t take as seriously as they should is the notion of liquidity and transparency. We learned from the crisis that liquidity and transparency are really important, and investors are now asking, “Do I understand what I’m holding?” You want to know what’s in your portfolio, and you want to know that you can sell it if the need arises.
JOI: Given a decade of negative returns and massive vol-atility, does traditional index investing still make sense?Whitelaw: I strongly believe that indexing makes sense in terms of passive vs. active management. I really don’t think the past decade has challenged the fundamental idea that indexing provides inexpensive and broad exposure to a market, either the U.S. market or another asset class. And even though the indices have performed badly—horribly you might say in many cases—it’s also the case that in many situations, active managers have still underper-formed because of the fees that they charged and the trans-action costs that they incurred.
However, if you believe “index investing” means invest-ing solely in an S&P 500 index fund, then that, I think, may not make sense going forward. But if you think of indexing in a broader context, considering alternative assets and alternative markets that provide better diversification, then I definitely think that index investing makes sense.
JOI: What have been the biggest paradigm shifts in the global economy in the last five years?Whitelaw: What has the global economy learned? That risk and risk management matter, both from an individual investor perspective and from an institutional perspective.
What else? For better or worse, I think capital markets are truly global. It hasn’t been something that happened just over the past five years; it’s been a gradual process that has come in fits and starts for quite a while now. But what we’ve seen is that shocks can be transmitted around the world. It can be through capital flows: peo-ple, investors, hedge funds pulling money out or putting money into various economies—and also multinational financial institutions. Shocks in the banking sector in one country affect other countries.
There’s a good side and a bad side to that, I think. The bright side is that global capital markets really open up new investment opportunities for investors. The bad side is, as a result, that these markets don’t offer quite the same diver-sification benefits that they used to, because of these strong linkages between various international markets.
One other thing is the rise of ETFs, at least in the U.S. I’ve seen some estimates that say 40 percent of daily trading on the New York Stock Exchange is actually ETF volume. There’s no doubt this kind of shift is going to challenge the traditional asset management business—obviously money invested in ETFs is money that isn’t invested elsewhere. But I think it also offers new opportunities for investors
November / December 201118

because of the huge expansion of the ETF market and the accompanying ability to get, perhaps, better diversification and better risk management in your portfolio.
JOI: When rates finally start to rise, will fixed-income index investors suffer? Are they prepared for that?Whitelaw: Ten-year Treasury yields are at or near record lows, with short-term yields close to zero. Is there anywhere to go but up? No, I don’t think so. But the thing to keep in mind is that it’s not clear what the time frame associated with this rise in rates will be. It’s very difficult to guess. And in fact, without naming any names, there are some people who’ve been predicting it for a while now—and it clearly hasn’t happened. I don’t know what the time frame is for this sort of eventual rise, but when it happens, when rates go up, prices go down. There’s no way around that.
My guess is that many retail investors may well be unprepared for a rising rate environment. I hope they do, but I don’t think they fully understand the interest rate risk of long maturity bonds, how much the prices can move on these securities when interest rates move. That said, there are actually some interesting new assets out there that do a nice job of providing some fixed-income exposure without that kind of duration risk, like the new bank-loan ETF. That may be a way for investors to get fixed-income exposure without this sort of long-term interest rate risk that I suspect they’re taking and that will come back to bite them when rates eventually rise, which I think they will.
JOI: What impact will the recent spike in volatility have on investor allocations?Whitelaw: Have people been whipsawed just once too often to stomach any more of this exposure to U.S. equity mar-kets? I may be the exception here, but I don’t think so. I’m an optimist. I think investors are smarter than that. I think you’re going to see investors looking maybe more broadly—commodities, emerging markets, alternative asset classes. But I really don’t see these major allocation shifts.
Traditionally, which is perhaps a little surprising, retail investors have actually stuck to it better than institutions. Maybe not individual by individual, but as a group their persistence has been good. I don’t see this recent spell of volatility as having a dramatic impact. I don’t think we’re going to see a dramatic bailout from the markets. I certainly hope not.
JOI: Are investors in danger of overweighting emerging markets?Whitelaw: Unfortunately, I think that’s a real possibility. I’m not sure we’re there yet. Emerging markets have been getting a lot of press, and investors are notorious for liking the latest hot thing. There are a lot of trend chasers out there. It wouldn’t surprise me to see an overreaction in terms of portfolio weights, if you will. But in the long run, emerging markets are where the growth is. I think it’s just a fact both in terms of economic growth and in terms of the growth in financial markets.
JOI: At what price is gold too expensive?Whitelaw: It depends on whether you’re buying it or sell-ing it, I guess. Market timing is notoriously difficult, and that applies to commodities as well as to stock markets. At least in stock markets we have some notion of fundamen-tal value. I can look at these valuation ratios, price to cash flow, price to earnings, whatever. But in the case of gold markets, this is not really about fundamental valuation. Are investors going to continue to flock to gold if and perhaps when things get worse in the global economy? It’s certainly possible, and if they do, then gold prices will still go up.
That said, I’m not sure I’d be buying gold at $1,800 an ounce.
Bill Witherell, Portfolio Manager and Chief Global Economist, Cumberland Advisors
JOI: Has the nature of investing changed in the last few years?
Witherell: I think it has. I think more individuals are invest-ing by themselves. It’s a lot easier for an individual to invest these days, particularly using ETFs, and being able to do it over the Internet. That is a major change. It is a dramatic change for some markets, like commodities markets and also currency markets, where individual investors really were not able to—unless they were quite sophisticated—get in these markets in the past.
And then generally, the high-speed trading that profes-sionals do, I think, has changed the nature of the markets, caused them to be more volatile.
JOI: Given a decade of negative returns and massive vol-atility, does traditional index investing still make sense?Witherell: For some people, it’s probably the best they can do—if they’re investing on their own—rather than to try to time the market when they don’t have the time or background to really study the market. For most individual investors, it would be helpful if they had a financial advi-sor. I think indexes will always be an important investment vehicle. In my firm, because we invest on the equity side solely in ETFs, we are, in effect, saying we’re really com-mitted to investing in indexes. But we actively manage the portfolios of those indexes. We don’t just buy and hold.
JOI: What have been the biggest paradigm shifts in the global economy in the last five years?Witherell: The biggest in the global economy, I think, has been the increased importance of emerging markets—in particular, China, but the others as well. In terms of eco-nomic growth, they’re going to account for, this year and next year, something like 80 percent of the total growth in the global economy. And they are now bigger players in terms of international economic policy as well. They have a seat at the table. China is the largest holder of reserves. That’s a very important change. And then we had a huge financial crisis, which we’re still recovering from, and that has affected investment around the world.
www.journalofindexes.com November / December 2011 19

JOI: When rates finally start to rise, will fixed-income investors suffer? Are they prepared for that?Witherell: By definition, when interest rates rise, fixed-income investors will suffer capital losses because when rates go up, the prices of bonds go down. So there will be capital losses unless the investments are hedged. That’s a concern that must be affecting bond investment because I don’t really expect our rates to go much lower; there’s not much room for it. However, I also do not expect rates to go up until 2013. I think we’re in for a period of prolonged, very low interest rates, both short term and long term. But when rates eventually go up, that will have a negative effect on fixed-income investors (except for bonds held to maturity).
JOI: What impact will the recent spike in volatility have on investor allocations?Witherell: We don’t really know how it will affect allocations. It adds to the risk avoidance that is affecting many investors right now. There’s a lot of cash on the sidelines and when the market’s this volatile, they’re not eager to get back in.
JOI: Are investors in danger of overweighting emerging markets?Witherell: They were in danger last year of doing it. In the first three quarters of this year, the emerging markets have underperformed the global market. And people who were overinvested in emerging markets got hurt by that. But then because emerging markets equity markets haven’t done that well, there’s been a lot of withdrawal—reduced emerging positions on the part of investors. Right now, I wouldn’t say that they face a danger.
Jeremy Held, Director of Research, ALPS Advisors
JOI: Has the nature of investing changed in the last few years?Held: It definitely has. For a long time,
people have realized that how they invest, in terms of which asset class, is a lot more important than whether or not they choose active or passive management inside a certain asset class. I think what’s really changed is that ETFs have actu-ally allowed people to implement in practice what they’ve known about in theory. I think that’s probably one of the big-gest ways that investing has changed within the last decade.
JOI: Given a decade of negative returns and asset volatil-ity, does traditional index investing still make sense?Held: Traditional index investing still does make sense. There are some negative returns in the asset classes that people are most familiar with, particularly U.S. large-cap equities, but if you broaden your perspective a little bit and you go into emerging markets or you look at places like master limited partnerships or high-yield bonds or commodities or even global real estate, certain areas of the globe have had positive returns with even lower volatility in some cases. I think that investing has changed, and ETFs are allowing people to broaden their asset class exposure.
The poor returns that the U.S. equities have had in the last decade are also forcing people to really look beyond the U.S. and also beyond equities. And I think that in those asset classes, as long as you have broad enough exposure and you have diversified exposure, traditional indexing still makes a lot of sense.
JOI: What have been the biggest paradigm shifts in the global economy in the last five years?Held: There are so many. But if I had to put my finger on it, it would be really the change in leadership between the developed world and the emerging world. The emerging markets have really proven themselves to be the developed markets of tomorrow. If you look at just about every metric, whether it’s growth or employment or capital reserves, they continue to show much better fundamentals than the developed markets.
In my opinion, the hardest challenge for the developed markets—which is where most of the investing capital is located—is going to be how they can continue to grow or compete with emerging markets. From an investing perspective, how are people going to create portfolios and create an asset allocation model that adapts and shifts to a world where emerging economies are growing faster with lower debt and much better fundamentals than the developed markets, considering the developed markets are where most of their money is held?
JOI: Is program trading driving short-term stock move-ments? Are ETFs to blame?Held: I think it’s difficult to say with any kind of certainty. There’s been a lot of volatility in recent years and there’s been a really rapid increase in high-frequency trading and algorithmic trading. So it’s easier to connect the two dots and say that they’re related. I think that a lot of the fast trading may exacerbate volatility. But ultimately, the market does set a fair mechanism for buyers and sellers to find an agreed-upon price and a price that’s fair. Also, access to these markets has increased. As information gets processed more rapidly, you’re going to see that informa-tion get executed into pricing better than you did in the past. So I think you just have better price discovery, better visibility and sometimes that leads to more volatility.
But I don’t think ETFs are necessarily to blame for that. ETFs are a vehicle that people use to get access and expo-sure, but the more rapidly information gets processed, sometimes that leads to an increase in volatility in the short term, but better price discovery and better execution and fair value in the long run.
JOI: When rates finally start to rise, will fixed-income index investors suffer? Are they prepared for that?Held: It really depends on how the indexes are construct-ed, and that just sort of speaks to the evolution of indexing and the evolution of ETFs. Asset classes used to be stocks, bonds and cash, and now they’ve obviously expanded quite a bit. Even within the fixed-income spectrum, you have so many different asset classes to choose from. If rates
November / December 201120

rise, it’s not only going to depend on which asset classes are affected, but also why rates are rising.
You could have a scenario where emerging market debt could do very well if rates rise because they’re not necessarily tied to what’s happening in the U.S., and those economies are growing very fast. If you have anoth-er index tied to bank loans, and rates rise, then they could obviously do very well. So it really depends.
JOI: What impact will the recent spike in volatility have on investor allocations?Held: When you get these spikes in volatility, it just increas-es the fear that people have. And when they have a lot more fear, they’re much more reluctant to invest into risky assets. It may force investors to be a little more reluctant to add allocations to risky assets, probably at the time that they should be allocating the most. I think on one hand, it’s going to cause investors to be a little bit more conservative, and people just seem to have a lot more fear, especially U.S. equity investors, who lost half their money twice in the same decade. When you have months like you did in August 2011, people say, “You know, we got fooled twice. We can’t afford to be fooled a third time.”
So really the first ramification of increased volatility is going to be just an overall level of conservatism, particu-larly towards risky assets. I think the second thing is that it’s going to force investors to look at more innovative and creative ways to try and access volatility or harness volatility, and gold has obviously been a very popular way for people to play the fear trade.
JOI: Are investors in danger of overweighting emerging markets?Held: They may be. When you look at the long-term picture, it’s hard to imagine a scenario over the next 10 years where emerging markets from an investment perspective don’t play out well, particularly relative to developed markets. But along the way, there is going to be a lot of volatility. I guess the perfect storm that we’ve had in the developed markets, where everything has gone wrong, has really been the oppo-site in the emerging markets, where everything has gone right. And you still have some emerging economies that are a little bit more fragile than people expect.
I believe that we’re going to end up in a good spot in emerging markets five years, 10 years, 20 years down the road, but there’s going to be a lot of volatility. Where the
risk lies for investors should be viewed more from a timing perspective than from an allocation perspective.
It really depends on which emerging markets, too. Emerging markets get painted with a pretty broad brush, but what’s happening in China and India and Brazil and Russia is quite different, and these are quite distinct markets. So I think you’re going to start to see people pay a little bit more attention to the regional differences among those emerging economies.
JOI: At what price is gold too expensive?Held: It’s hard to say. I had always said $1,000, but I would have been wrong by a long shot. It’s hard to say because it’s something that trades on sentiment and doesn’t nec-essarily trade on fundamentals. It gets lumped in with commodities, but doesn’t really move with commodities. It moves much more with people’s perceptions about what’s happening from a currency perspective and from a global growth perspective and a fear perspective.
The price of gold is going to be so dependent on where everything else is. If we have a strong equity market, if we have a strong dollar, if the developed world gets the bank-ing and debt problems figured out, then $1,800 an ounce
may seem expensive. If all of those things don’t happen and the developed markets and the currency markets and the equity markets continue to struggle, then $1,800 is going to seem cheap. Gold seems to be priced so much more in its value in terms of other asset classes than any-thing else. So a fair price for gold is going to be dependent upon what’s happening in those other areas.
JOI: What key wisdom would you offer investors faced with extreme volatility and fear in the market?Held: Know what you own and really understand what you’re investing in. It sounds like a cliché and it sounds oversimplified, but a lot of people don’t understand what their exposures are. I would think back to the late ’90s when people thought they were diversified because they owned some stocks and some index funds and some mutual funds. Then they found out that the stocks they owned were IBM, Cisco, Microsoft and Intel, and the indexes and the actively managed funds they owned were 40 percent technology. The best thing people can do is to understand what they own, understand where their risks lie, make sure that they’re diversified by sec-tor and by region and by asset class.
www.journalofindexes.com November / December 2011 21
“When you look at the long-term picture, it’s hard to imagine a scenario over the next 10 years where emerging markets from an investment
perspective don’t play out well, particularly relative to developed markets. But along the way, there is going to be a lot of volatility.”
—Jeremy Held

Talking Indexes
November / December 2011
By David Blitzer
22
How have the last few years of market turmoil
changed indexing? For the better!
Indexing In A Time
Of Market Turmoil
The last few years saw more volatile markets than almost any time since the 1930s, as the financial crisis sent the stock market into its second major
bear market in a decade with a loss of over 50 percent. The economy dropped into the worst recession since the Great Depression and home prices plunged slightly more than in the 1930s. The financial horror stories our parents and grandparents told seem to be coming true, again. Yet out of this adversity has emerged some good things for indexing.
First, new demands are being placed on financial market participants—demands that indexing is well-positioned to meet. Second, indexing has demonstrated that it has something to offer even in the worst of finan-cial times. Third, turmoil and adversity have encouraged innovation and invention in many areas, including index design and development.
Demands On Market ParticipantsIn the halcyon days before housing collapsed and
Lehman Brothers failed, complicated opaque investments were all the rage. Almost no one wanted something as simple as a diversified portfolio of blue-chip stocks when one could venture into frontier markets, and currencies offered a whiff of hyperinflation; simple Treasury bonds were boring and less rewarding than investment-grade col-lateralized debt securities. Things have certainly changed. Transparency is both demanded and expected. The idea that “if you don’t understand an investment, you shouldn’t buy it” has garnered new believers. Simplicity has become a positive attribute rather than an embarrassment.
Indexing, index funds and exchange-traded funds offer the transparency and simplicity that investors and their advisors increasingly seek. ETFs publish their holdings
every day, so there is no secrecy about what the investor owns. Further, ETFs track indexes, and good index pro-viders will provide materials explaining their products’ construction and calculation, in addition to disseminating any changes to them. The funds themselves are generally pretty simple: They track an index by holding the stocks in the index in the same proportions prescribed by the index. Cryptic tales of analyzing stocks or switching from growth to value, and back to growth, are all but unheard of.
Additionally, indexes are published and followed by analysts, and depending on the index, investors can have access to a wide range of professional opinions and advice. For widely followed indexes like the S&P 500, there are numerous commentaries and analyses of each index change, so investors can find explanations of changes in the markets and their holdings.
Indexing In Difficult Financial TimesThe risks in the midst of financial turmoil are as fright-
ening for those investing in index funds as for those plain old stock pickers. However, indexing as a strategy has proved itself in bad times as well as good. Looking at S&P’s SPIVA reports, the S&P 500 outperformed 64 per-cent of active large-cap equity funds in 2008, 51 percent in 2009 and 66 percent in 2010.1 While this is certainly not an argument that index funds always make money, it does question the idea that an active manager can always see the tsunami coming and get out of the market in time while the index fund gets washed away. These figures sug-gest that, at worst, it was breakeven for the index funds, and that about two-thirds of the active funds failed to get back in the market as fast as they should have in 2010. The SPIVA reports show that while there are good and bad

www.journalofindexes.com November / December 2011 23
active money managers, in bad markets, a majority of the active managers rarely do better than the index.
Innovation And Invention
That two current targets of innovation are income and risk management should come as no surprise. In both areas, indexes have seen some successes.
Index providers have focused significant effort on designing indexes that generate dividend income, mostly by making changes to the stock selection and weighting methodologies. Stock selection for such indexes usually starts with eliminating nondividend payers, but it often also involves measures of earnings and payout ratios, as well as how long a company has paid or increased its divi-dends or even measures designed to identify stocks that are about to cut their dividend. On top of this, income-oriented indexes utilize weighting schemes based on dividend dollars paid, dividend yield or other measures of income generation. The result is an index offering a yield that is substantially higher than the yield in the overall market while still based on a diversified portfolio.
Sometimes innovation connects with a long-recog-nized idea to yield a better way to manage risk. Investors understand that one successful way to reduce portfolio volatility is to hold more in cash and less in stocks. Doing this requires making the decision to rebalance a port-folio away from stocks and the potential growth it could offer. Such decisions often involve as much or more hope, fear and emotion as hard analysis. S&P created a series of risk control indexes that target a level of volatil-
ity and adjust the cash/stock ratio by formula on a given schedule. The formula uses the difference between the realized volatility of the portfolio’s stock portion and target volatility level. While the results are not perfect, replacing emotion with mathematics may help to move the portfolio volatility toward the target.
Innovations using indexes in risk management could fill several books, not just a few paragraphs in a column. For those who argue that “if you can’t measure risk, you certainly can’t manage risk,” there is the CBOE Volatility Index, better known as VIX. VIX as an indicator or, as it is also commonly known, a “fear gauge,” goes back a couple of decades and was already a staple of financial news and commentary. The stock market’s gyrations put the VIX front and center in the news and in investors’ minds.
VIX provides a way to measure risk. But to manage risk through the VIX, one needs a way to invest in it. The devel-opment of VIX futures and indexes linked to VIX futures completed the picture by making it possible to both mea-sure and manage risk in equity markets. The response has been the spread of VIX measures to other markets, both equities and commodities.
The most encouraging part of the innovation story is how big it actually is. From 2005 to mid-2011, assets track-ing U.S. ETFs and ETPs tripled while the stock market barely moved.2 The range of index-based financial prod-ucts covers most asset classes including stocks, bonds, cur-rencies, commodities and even real estate. While market turmoil drove gold to new heights, the adversity of that turmoil sparked a golden period of index innovation.
Endnotes
1. S&P SPIVA reports for large-cap stocks vs. S&P 500 for full years 2008, 2009 and 2010 − see www.SPIVA.standardandpoors.com.
2. Asset levels of ETFs and ETPs based on “ETF Landscape Industry Highlights, End July 2011,” BlackRock Investment Institute. Market level based on S&P 500.
Why advertise in the Journal of Indexes?
JOURNAL OF INDEXES ADVERTISING INFORMATION AT WWW.JOURNALOFINDEXES.COM/ADVERTISE
*OEFY6OJWFSTF�--$ �����4BDSBNFOUP�4U� �4VJUF����� �4BO�'SBODJTDP �$"��������t�"EWFSUJTJOH�BOE�3FQSJOUT�*ORVJSJFT���������������

November / December 2011
By Michael Branch
Looking at the big picture
The Case For
Global Stock Portfolios
24

‘The whole is greater than the sum of its parts.’—Aristotle
When investors choose their asset allocation for international stocks, they have tended to carve up the world between developed markets and
emerging markets, based on the assumption that these two are sufficiently distinct asset classes to justify treating them separately. However, trends in globalization and the increasing size and importance of emerging markets have brought into question a number of old assumptions about the best way to categorize and invest in global stocks.
Traditionally, investors or wealth managers have justified treating emerging markets separately for two reasons: 1) they believe that while indexing may work with developed mar-kets, they’re presuming that active managers will succeed in tilling the less-well-plowed terrain of emerging markets; or 2) they want to overweight or underweight emerging market exposure, thus actively managing their asset class exposure. Updated research suggests that on the first issue, successful stock picking in emerging markets can be as challenging as it is in developed markets. As for the second issue of incor-porating active weightings, investors now have access to much more flexible ways to manage their asset allocation to emerging markets while avoiding the drag on performance from taxes and transaction costs that results when foreign stocks are divided into two distinct baskets.
In this paper, we analyze the trade-offs of managing portfolios with distinct mandates for developed versus emerging markets as well as U.S. versus foreign markets. We begin in the first section with research on the perhaps surprising failure of most active stock pickers in emerging markets and yet how investors still justifiably desire to con-trol the overall allocation to emerging markets. In the sec-tion after that, we turn to the evidence for global portfolios that combine developed, emerging, domestic and foreign into a single asset class. Finally, we weigh the advantages and disadvantages of various means of implementing glob-al portfolios among ETFs, traditional open-end mutual funds and separately managed accounts.
THE RATIONALE FOR DISTINCT MANDATESThe division of foreign markets into developed and
emerging segments dates back to 1981, when Antoine van Agtmael, an economist at the World Bank, referred (in a flash of marketing brilliance) to what were then called third-world countries as emerging markets.1 In the 30 years that followed, investment practitioners have used this clas-sification system for defining asset class boundaries and constructing their international equity asset allocations. A typical example of this “building block” approach is a stand-alone developed-market portfolio benchmarked to the MSCI EAFE (Europe, Australasia, Far East) Index com-bined with an emerging market portfolio benchmarked to the MSCI Emerging Markets (EM) Index.2
Historically, investors have relied on two fundamental justi-fications for partitioning their equity allocation into developed and emerging market segments. The first justification rests on
the premise that specialist active managers will successfully outperform a passive index. The second justification is based on strategic or tactical asset allocation decision-making.
Do Specialist EM Managers Outperform?One of the more persistent myths about active invest-
ing is that it may not work in efficient markets such as U.S. large-caps, but still adds value in less efficient markets such as emerging markets. Unfortunately, the empirical evidence does not support the proposition that specialist EM invest-ment managers can successfully exploit market inefficiencies and earn outsized returns. In a recent performance study, Aperio Group examined 10 years of return data for all active emerging markets mutual funds listed in the Morningstar Principia database, adjusting for taxes and survivorship bias.3 On a pretax basis, only 28 percent of active mutual funds out-performed their representative benchmark. After taxes, the number of winners dropped to 20 percent. (See Figure 1.)
This finding is consistent with research by Gottesman and Morey (2007), who find that emerging market mutual funds underperform passive indexes and that the only pre-dictor for fund performance is the expense ratio.4 Lower ratios predicted better fund performance.
Emerging market hedge funds have delivered slightly better results than mutual funds. Abugri and Dutta (2009) find that emerging market hedge funds slightly outperform benchmark indexes on a pretax, risk-adjusted basis.5 The margin of superiority (0.05 percent), however, was not proven to be statistically significant. Given the notorious reputation of hedge funds as tax-inefficient investments, these findings (based on pretax returns) are likely to overstate the actual after-tax results experienced by U.S. taxable investors.
Since neither active mutual funds nor hedge funds were able to consistently outperform the market, the justifica-tion for distinct emerging market mandates based on the premise of superior investment returns is unfounded. The supporting empirical evidence favors a passively managed and low-cost index approach.
� Pre-Tax Return � Aftertax Return
BeatBenchmark
BeatBy >1%
BeatBy >2%
BeatBy >3%
20%
0%
28%20% 18%
11%5%
9%2%
7%
40%
60%
80%
100%
Percentage Of Active EM ManagersThat Beat Their Benchmark
Sources: MSCI and Aperio Group. Analysis period = 12/31/00 to 12/31/2010Manager universe = Morningstar Emerging Market Category. Benchmark = MSCI EM
Figure 1
25November / December 2011www.journalofindexes.com

November / December 201126
Equity Asset Allocation Regardless of active or passive bias, many investors
prefer distinct developed/emerging mandates to execute strategic or tactical asset allocation decisions. For these investors, the global market capitalization weights may be inconsistent with the stated risk/return objectives of the overall portfolio. In such cases, separate developed/emerging market portfolios provide an easy way to struc-ture the equity asset class mixture or reflect what can be a justifiable home country bias.
Distinct developed/emerging mandates are not the only way to achieve asset allocation flexibility. As will be discussed in greater detail later, separately managed accounts (SMAs) can provide an alternative and novel approach to fulfill asset allocation objectives within a single portfolio. SMA portfolios facilitate geographic cus-tomization, allowing investors to deviate from benchmark weights and “tilt” the portfolio to express their investment views. For example, an investor might decide to over/underweight an entire class like emerging markets, a country grouping like BRIC (Brazil, Russia, India, China) or a single country like Japan.
If asset allocation tactics can be executed through either distinct mandates or a single integrated portfolio, then why should investors opt for a global investment approach? In the next section, we demonstrate how global portfolios can produce higher returns for investors and lower operating costs for financial advisors.
THE CASE FOR GLOBAL PORTFOLIOSThe world is converging. Economies and financial markets
are becoming increasingly integrated as corporations pursue global strategies. Many large companies in emerging markets have become global players, competing with their peers in devel-oped markets. Conversely, U.S. companies are increasingly look-ing outside their own borders for new sources of revenue growth. Coca-Cola, for example, is headquartered in Atlanta, but derives approximately 80 percent of its revenue from non-U.S. markets.6 Is Coke an American or foreign company?
The distinction between domestic, international and emerging markets is becoming increasingly outdated and artificial. The world, it would seem, is heading toward a single, all-encompassing global equity asset class. This is best illus-trated by Figure 2, which displays the long-term rise in cor-relation between emerging markets and the rest of the world, and the corresponding decline in diversification potential.7
The trend toward international and global investing is a natural consequence of the overall globalization of the economy and international financial system. Institutional investors are at the forefront of this movement as they deploy assets to broader global investment strategies. Figure 3 highlights the dramatic increase in the initial funding of global equity mandates for institutional investors: From a mere 6 percent in 2000, it has grown to represent 38 percent of all global and international initial funding in 2009.
Aside from the secular trend toward a single equity asset class, we have identified several clear and concrete advan-
� Countries (EM) � Industries (EM)
0
0.5
1.5
1
2
Va
lue
������� �������������������������������������������������������������������
"��� ��!�MSCI. Analysis period = 1/01/96 to 9/30/10
‘97 ‘99 ‘01
DiversificationPotential
Correlation
‘03 ‘05 ‘07 ‘09 ‘110%
‘00 ‘01 ‘02 ‘03 ‘04 ‘05 ‘06 ‘07 ‘08 ‘09
5%
10%
15%
20%
25%
30%
35%
40%
Share Of Global Equity Mandates InGlobal & International Equity Initial Funding
Sources: InterSec Research. Analysis period = 1/01/00 to 12/31/09
6%8%
7% 8%
22%
14%
24%
33%
27%
38%
Figure 2 Figure 3
Historical MSCI Reclassifications
Figure 4
Country Market Reclassification DateIndex Turnover
MSCI EM
Israel From Emerging to Developed May 2010 5.6%
Greece From Emerging to Developed May 2001 9.2%
Portugal From Emerging to Developed Nov 1997 8.0%
Sources: MSCI and Aperio Group as of 3/31/11

www.journalofindexes.com November / December 2011 27
tages of global portfolios compared to distinct developed/emerging mandates. As will be discussed in the following section, these advantages include reduced portfolio turn-over and lower operating costs for financial advisors.
Reduced Portfolio Turnover CostsInvestors tracking regional indexes such as the MSCI
EAFE or MSCI EM pay recurring costs due to changes in market classification. As countries “graduate” from emerg-ing to developed status, indexers systematically rebalance their portfolios, paying commissions, fees, taxes, bid/ask spreads and market impact costs. For all this activity, investors receive nothing in return. They still hold the same securities in aggregate, only in different accounts.
Since reclassifications are announced in advance of effec-tive index changes, arbitrageurs are able to front-run index fund managers. Realizing that index funds are constrained by tracking error minimization, arbitrageurs buy the stocks to be added to the MSCI EAFE when the additions are announced with the expectation of selling the stocks to index funds at a higher price on the effective date. Similarly, upon announcement, arbitrageurs sell short stocks that are to be deleted from the index and expect to repurchase them from indexers at a lower price. Not surprisingly, arbitrage returns are realized at the expense of index fund investors. While no data currently exist for the MSCI EAFE, Petajisto (2011) estimates the drag from index arbitrage costs inves-tors 21-28 basis points annually for the S&P 500 and 38-77 basis points annually for the Russell 2000.8
Since index turnover costs are not widely publicized, they are often overlooked or ignored. The magnitude of the expense, however, is nontrivial. Figure 4 details the histori-cal market reclassifications and corresponding index turn-over for the MSCI Emerging Markets (EM) Index.
Of the 21 countries in the MSCI EM Index, currently two are on the “watch list” for possible promotion to developed market status in 2012. Korea and Taiwan, currently the third- and fourth-largest countries in the MSCI EM, represent sig-nificant market-cap weights in the index.9 If these two coun-tries are reclassified, the event will represent the single larg-est change in the index’s history. Using current market-cap weights, we are able to simulate the index reconstitution and quantify the magnitude of this change. As shown in Figure 5, index funds could systematically turn over 50.5 percent of the MSCI EM and 16.4 percent of the MSCI EAFE portfolios.
In addition to transaction charges and index arbitrage costs, taxable investors may also be exposed to tax liabilities in their current EM portfolios. If Korea and Taiwan are pro-moted, the sale of appreciated assets may trigger a significant capital gains tax bill, thereby reducing after-tax returns. Figure 6 shows the performance of the MSCI Korea and Taiwan country indexes over the last decade, highlighting the poten-tially adverse tax consequences of a market reclassification.
How likely are Korea’s and Taiwan’s reclassification? Given the size of the markets and recent economic devel-opments, analysts remain optimistic for a near-term pro-motion by MSCI.10 Many of the competing index providers have already upgraded Korea, including FTSE, S&P and
Dow Jones. Taiwan has been upgraded by Dow Jones, and is currently being evaluated by FTSE for possible promo-tion. The International Monetary Fund (IMF) reclassified both Korea and Taiwan as developed countries recently based on level of per capita income, export diversification and degree of integration into the global financial system.
By investing in broadly defined global portfolios that hold both developed and emerging market securities, investors can easily sidestep the whole issue while still achieving their targeted exposure.
Lower Operating Costs For Financial AdvisorsSeveral additional benefits accrue to financial advisors
who implement global mandates. By consolidating to fewer accounts, advisors save on monitoring, rebalanc-ing, operational and administrative costs. Fewer accounts can mean less frequent rebalancing, simpler client report-ing and less paperwork. If the number of managers is reduced, there may also be a corresponding reduction in due diligence costs.
Furthermore, global strategies transfer the responsibility of portfolio monitoring and rebalancing from financial advisors to fund managers. Given the sophisticated trading and tax-management systems employed by professional fund manag-ers, they are often better suited to make optimal rebalancing decisions. Delegating the portfolio monitoring and rebalanc-ing activities leaves more time for financial advisors to con-centrate on their most productive activities such as building relationships, giving advice, strategic asset allocation, etc.
Simulated MSCI Index Turnover (Korea & Taiwan)
Sources: MSCI and Aperio Group as of 3/31/11
Note: See Appendix 1 for a detailed breakdown of the simulated index reconstitution
CountryMSCI EM MSCI EAFE
Index Turnover
Korea Only 27.6% 9.3%
Taiwan Only 22.9% 7.8%
Korea and Taiwan 50.5% 16.4%
Figure 5
� Korea � Taiwan
800
700
600
500
400
300
200
100
0
‘00 ‘01 ‘02 ‘03 ‘04 ‘06 ‘07‘05 ‘09 ‘10‘08
For Taxable Investors, Korea and Taiwan May Represent
Embedded Capital Gains in EM Portfolios
Performance Of MSCI Korea And Taiwan Indexes
Source: MSCI. Analysis period = 3/31/00 to 3/31/11
Figure 6

November / December 201128
Now that we’ve seen the merits of a global investment pro-cess, what is the best way to implement a global mandate? In the following section, we discuss the advantages, disadvan-tages and trade-offs among various investment vehicles.
IMPLEMENTATION OPTIONSThere are three main options for implementing global
mandates: mutual funds, ETFs and SMAs. The appropriate strategy for any given investor depends on a number of fac-tors, including overall portfolio size, tolerance for tracking error, tax sensitivity and customization requirements.
Mutual Funds And ETFsMutual funds and ETFs offer retail and nontaxable
investors a convenient and low-cost way to take advan-tage of the many benefits of global indexing. These invest-ment vehicles boast low fees, tight index tracking and low investment minimums.
Taxable investors may prefer ETFs over mutual funds due to a regulatory loophole that shields investors from capital gains distributions until final sale of the ETF. As shown in Figure 7, many popular international/global ETFs have not paid capital gains distributions over the life of the fund.
As the ETF industry has evolved, investors now have more options and greater flexibility if they want to customize their portfolio beyond traditional capitalization-weighted index-es. By introducing style, sector and factor bets (e.g., growth/value, size, leverage, etc.), investors can adjust and control the risk/return profile of the overall portfolio. However, in order to adjust geographic weightings, mutual fund and ETF investors currently must partition their equity allocation into distinct funds. As established earlier, this approach can increase portfolio turnover, often to the detriment of invest-ment returns, especially in the presence of taxes.
Separately Managed AccountsFor investors with sufficient assets to qualify, SMAs
offer several additional benefits that are not available with mutual funds and ETFs. These unique advantages include tax management strategies and portfolio customization. To achieve these benefits, however, there is an associated cost in the form of additional tracking error. In this section, we explore each of the benefits and drawbacks of SMAs.
Tax Management Strategies
SMAs allow investors to pass through tax losses gener-ated from inside the portfolio to offset capital gains anywhere outside the portfolio. A program of systematic “tax loss har-vesting” can consistently and predictably increase after-tax returns from 0.80 percent to 1.74 percent per year vs. ETFs.11
Moving to broader indexes makes tax-loss harvesting even more effective. Indexes that include both developed and emerging markets have two distinct advantages. First, they hold more securities and hence provide more replacement options for depreciated assets. For example, a developed mar-ket technology company like Sony can be sold and replaced with an emerging market company like Samsung Electronics while maintaining similar investment exposure. Second, broad indexes exhibit higher cross-sectional volatility. Cross-sectional volatility is a measure of the dispersion of stock returns within an index. As volatility increases, portfolio managers have more opportunities to harvest losses. As reported in Figure 8, the MSCI ACWI ex US exhibited 7.3 percent higher cross volatility than the MSCI EAFE (29.5 percent vs. 22.2 percent).
In addition to tax-loss harvesting, SMA managers can add value by providing tax management of asset class rebalancing and other liquidity events (e.g., redemp-tions). Since developed and emerging market securities reside in the same portfolio, all rebalancing and liquidity trades are executed to simultaneously maintain target asset allocation weights and minimize the impact of capi-tal gains taxes. By considering the entire equity allocation when making investment decisions, managers provide a more efficient solution while still conforming to the stated objectives of the portfolio.
Portfolio Customization
Because SMAs are built from the ground up using indi-vidual securities, flexibility around portfolio customization is virtually unlimited. Investors can customize or “tilt” their portfolios around dozens of styles and factors including, but not limited to, geography, size, growth/value, yield, profit-ability, volatility, social/ESG concerns, sectors, industries and individual securities. These factors can be isolated or com-bined in order to achieve a desired risk/return objective.
In the context of a global portfolio, geographic customiza-tion is one of the more compelling features of SMAs. Within
ETF Fees And Capital Gains Distributions
Figure 7
Ticker
BENCHMARKiShares Vanguard
MSCI ACWI Ex US FTSE All-World Ex USMSCI ACWI FTSE All-World
ACWX ACWI VEU VT
Markets Covered in Fund Developed & Emerging ex. US Developed & Emerging Developed & Emerging ex. US Developed & Emerging
Inception Date 3/26/08 3/26/08 3/2/07 6/24/08
Expense Ratio 0.35% 0.35% 0.22% 0.25%
Capital Gains Dist. N/A N/A N/A N/A
Sources: iShares, Vanguard and Aperio Group as of 3/31/11

www.journalofindexes.com November / December 2011 29
a single portfolio, investors can over/underweight an entire region (e.g., emerging markets), a country grouping (BRIC) or a single country (China). With SMA portfolios, investors need not sacrifice asset allocation flexibility or tax advan-tages in order to benefit from a global investment process.
ADR Coverage And Tracking ErrorDepending on the size of the portfolio, a potential draw-
back of SMAs relative to mutual funds and ETFs is higher tracking error. This tracking error stems from the pool of liquid securities (either American depositary receipts (ADRs) or foreign-listed shares) available to track a par-
ticular index. For smaller-sized portfolios, fund managers may be restricted from investing directly in foreign mar-kets due to trade size requirements and other investment minimums. For larger portfolios, however, managers have greater flexibility to choose where and how to invest.
For portfolios with less than $10 million to $20 million in assets, the preferred method of international investing is often through ADRs. ADRs provide U.S. investors with convenient and low-cost access to foreign markets. ADRs are particularly advantageous when investing in emerging markets, where local-market trading and operational costs can be prohibitively expensive. However, the universe of ADRs only covers a fraction of the opportunity set of for-eign equities, as shown in Figure 9.
Given the coverage constraints, how well do ADR portfolios match the risk and return characteristics of an international or global benchmark? Figure 10 compares the forecasted tracking error of optimized ADR portfolios tracking the best-known and most widely followed inter-national and global indexes.12
ADRs facilitate the effective tracking of developed market indexes. Coverage in terms of both holdings and market capitalization is sufficiently wide-ranging to sat-isfy the needs of most investors. Most importantly, ADR portfolios have low forecasted tracking error (0.67 percent for a 250-security World ex US portfolio).
ADRs are considerably less effective at tracking stand-alone emerging market indexes. Coverage is less robust and forecasted tracking error is higher than in developed markets. However, in the context of a global portfolio, the impact of emerging markets ADR coverage is negligible. The incremental tracking error from adding emerging market
international and Global index Characteristics
Figure 8
MSCi index eaFe World ex US aCWi ex US aCWi
Markets Covered in index Developed ex. US & Canada Developed ex. US Developed & Emerging ex. US Developed & Emerging
number of Securities 966 1,066 1,875 2,466
Cross-Sectional Volatility 22.2% 23.7% 29.5% 27.3%
Sources: MSCI and Aperio Group as of 3/31/11. See Appendix 2 for individual country weightings in the MSCI ACWI IMI.
σx = wi(ri –R)2
iΣ
where wi = 3/31/10 market cap weight of stock i
ri = Total return of stock i for 12 moth ending 3/31/11
R = Benchmark index return for 12 months ending 3/31/11
aDR Coverage by holdings and Market Capitalization
Figure 9
Coverage by # of holdings Coverage by Market Cap ($Trillion)
Sources: MSCI and Aperio Group as of 3/31/11. Index = MSCI ACWI ex US
Market Weight index index aDRs Coverage index aDRs Coverage
Developed 66.8% 1,066 335 31.4% 16.35 9.93 60.8%
emerging 33.2% 809 122 15.1% 8.13 2.92 36.0%
Total 100.0% 1,875 457 24.4% 24.47 12.85 52.5%
Forecasted Tracking Error Of ADRPortfolios Optimized To MSCI Indexes
Sources: MSCI and Aperio Group as of 3/31/11Number of securities: EAFE = 200, World ex US = 250, ACWI ex US = 350, ACWI = 500
2.00%
1.00%
1.75%
1.25%
1.50%
0.00%EAFE World Ex US ACWI Ex US ACWI
0.75%
0.25%
0.50%.50%
.73%.67%.77%
Emerging Markets Contribute 0.06%Additional Tracking Error
Figure 10
where wi = 3/31/10 market-cap weight of stock iri = Total return of stock i for 12 months ending 3/31/11R = Benchmark index return for 12 months ending 3/31/11

November / December 201130
securities to a diversified developed market portfolio is only 6 basis points (0.73 percent for ACWI ex US vs. 0.67 percent for World ex US). Such remarkably low tracking error differences are possible for two reasons. First, as demonstrated previ-ously in Figure 2, emerging markets and global equities are highly correlated. Second, portfolio optimizers can success-fully replicate emerging market risk/return characteristics using securities from outside the emerging markets universe. In other words, certain developed market securities may serve as suitable proxies for emerging markets exposure.
ADRs are not a viable option for investing in interna-tional small-cap securities. In most cases, ADR programs have not been developed yet. Given the trading, opera-tional and liquidity constraints of local-market small-cap investing, most investors find mutual funds or ETFs to be the most practical option for capturing this asset class.
SMA portfolios exceeding $20 million in assets can supplement ADRs with foreign-listed shares. At this port-folio size, fund managers can optimize the mix of ADRs and foreign shares to find the best combination of liquidity, tracking error and ongoing operational expense.
CONCLUSIONS
Our findings suggest that index-based global portfolios are a more efficient way to capture developed and emerg-ing markets exposure than distinct EAFE and EM port-folios. By consolidating these two market segments into
a single integrated portfolio, investors benefit from lower portfolio turnover and reduced operating costs.
The appropriate implementation strategy for any given investor depends on a number of factors, including portfolio size, tolerance for tracking error, tax sensitivity and customiza-tion requirements. Mutual funds and ETFs provide tight index tracking, low cost and low investment minimums. On the other hand, mutual funds and ETFs offer limited geographic cus-tomization unless investors partition their global allocation into regional market segments. Such a move can increase portfolio turnover, often to the detriment of investment returns.
For investors with sufficient assets to qualify, SMAs offer several additional benefits that are not available with mutual funds and ETFs. These advantages include tax management strategies and portfolio customization within a single portfolio. A potential drawback of SMAs, however, is higher tracking error resulting from limited ADR cover-age. Once a portfolio reaches a certain size, however, this limitation can be reduced and/or eliminated by supple-menting ADRs with foreign-listed shares.
When the Greek philosopher Aristotle, well over 2000 years ago, said: “The whole is greater than the sum of its parts,” he probably didn’t have portfolio allocation in mind. Even so, his words hold just as true for investors today as they did for scholars and philosophers back then. The simplicity, efficiency and flexibility of global portfolios (the whole) is greater than the sum of its regional parts.
Endnotes1 Thomas (1999).2 For detailed descriptions of MSCI indexes, see http://www.msci.com/.3 Survivorship bias is the tendency for failed funds to be excluded from performance studies because they no longer exist. It often causes the results of studies to skew higher
because only funds that were successful enough to survive until the end of the period are included. In this study, survivorship bias is corrected by dividing the number of
funds that beat their benchmarks by the number of funds in existence at the start of the return period.4 Sample period: January 1997 – December 2005. 5 Sample period: January 1997 – August 2008. Risk-adjusted returns calculated using modified Sharpe ratio.6 Source: The Coca-Cola Company, 2010 Annual Review.7 Menchero and Morozov (2011). Diversification potential measures the reduction in volatility that can be achieved by diversifying the portfolio across the world instead of
concentrating it within a single country or country grouping.8 Sample period: January 1990 – December 2005.9 As of March 31, 2011, Korea and Taiwan represent 13.8 percent and 11.5 percent, respectively, of the MSCI EM Index.10 Chris Lobello of CLSA Asia-Pacific Markets remarked in a June 11, 2010 report, “We remain convinced that it is only a matter of time until the promotion takes place.”11 Geddes (2010). Range based on various assumptions for state tax and disposition of assets (liquidation or bequest).12 Tracking error is a measure of how closely a portfolio follows the index to which it is benchmarked.
ReferencesAbugri, Benjamin and Sandip Dutta, 2009, “Emerging Market Hedge Funds: Do They Perform Like Regular Hedge Funds?”, Journal of International Financial Markets,
Institutions and Money, vol. 19, no. 5
Geddes, Patrick, “Indexed ETFs vs. Indexed Separately Managed Accounts: A User’s Guide,” 2010, Aperio Group Research
Gottesman, Aron and Matthew Morey, 2007, “Predicting Emerging Market Mutual Fund Performance,” Journal of Investing, vol. 16, No. 3
Honghui Chen, Gregory Noronha and Vijay Singal, “Index Changes and Losses to Index Fund Investors,” Financial Analysts Journal, 2006, vol. 62, No. 4
InterSec Research, “2009 Year-End Investment Industry Research Report,” 2009
Menchero, Jose and Andrei Morozov, “The Relative Strengths of Industry and Country Factors in Global Equity Markets,” 2011, MSCI Research Insight
Petajisto, Antti, “The Index Premium and its Hidden Cost for Index Funds”, 2011, Journal of Empirical Finance, 18 (2) pp. 271-288
Subramanian, Raman, Frank Nielsen and Giacomo Fachinotti, “Globalization of Equity Policy Portfolios,” October 2009, MSCI Barra Research Paper No. 2009-38. Available
at SSRN: http://ssrn.com/abstract=1509636
Thomas, Caroline, “Where is the Third World now?”, 1999, Review of International Studies, 25, (5), pp 225-244.
Zeiler, Brian and Gregory Allen, “International Small Cap: Implementation Issues,” 2004, Charter Investments Institute
Disclosure StatementThe information contained within this presentation was carefully compiled from sources Aperio believes to be reliable, but we cannot guarantee accuracy. We provide this
information with the understanding that we are not engaged in rendering legal, accounting or tax services. In particular, none of the examples should be considered advice
tailored to the needs of any specific investor. We recommend that all investors seek out the services of competent professionals in any of the aforementioned areas.

www.journalofindexes.com November / December 2011 31
continued on page 58
appendix 1
Market Reclassification Turnover (Korea & Taiwan)
Sources: MSCI and Aperio Group as of 3/31/11
Japan Developed 3,564,493,826,500 22.1% 20.3% 1.8% 0.0% 0.0% 0.0% United Kingdom Developed 3,438,444,827,700 21.3% 19.6% 1.7% 0.0% 0.0% 0.0% France Developed 1,532,314,942,700 9.5% 8.7% 0.8% 0.0% 0.0% 0.0% australia Developed 1,416,113,892,400 8.8% 8.1% 0.7% 0.0% 0.0% 0.0% Germany Developed 1,327,439,203,700 8.2% 7.6% 0.7% 0.0% 0.0% 0.0% Switzerland Developed 1,293,076,537,800 8.0% 7.4% 0.7% 0.0% 0.0% 0.0% Spain Developed 526,329,991,500 3.3% 3.0% 0.3% 0.0% 0.0% 0.0% Sweden Developed 521,446,442,800 3.2% 3.0% 0.3% 0.0% 0.0% 0.0% hong Kong Developed 459,572,352,600 2.9% 2.6% 0.2% 0.0% 0.0% 0.0% italy Developed 418,183,939,500 2.6% 2.4% 0.2% 0.0% 0.0% 0.0% netherlands Developed 403,423,041,900 2.5% 2.3% 0.2% 0.0% 0.0% 0.0% Singapore Developed 276,975,478,000 1.7% 1.6% 0.1% 0.0% 0.0% 0.0% Finland Developed 178,461,850,600 1.1% 1.0% 0.1% 0.0% 0.0% 0.0% Denmark Developed 160,484,217,300 1.0% 0.9% 0.1% 0.0% 0.0% 0.0% belgium Developed 146,503,852,900 0.9% 0.8% 0.1% 0.0% 0.0% 0.0% norway Developed 134,908,714,500 0.8% 0.8% 0.1% 0.0% 0.0% 0.0% israel Developed 128,389,887,100 0.8% 0.7% 0.1% 0.0% 0.0% 0.0% austria Developed 53,262,381,100 0.3% 0.3% 0.0% 0.0% 0.0% 0.0% Portugal Developed 42,022,892,700 0.3% 0.2% 0.0% 0.0% 0.0% 0.0% Greece Developed 39,634,110,200 0.2% 0.2% 0.0% 0.0% 0.0% 0.0% ireland Developed 37,513,250,700 0.2% 0.2% 0.0% 0.0% 0.0% 0.0% new Zealand Developed 16,648,213,600 0.1% 0.1% 0.0% 0.0% 0.0% 0.0% China Emerging 984,002,224,700 0.0% 0.0% 0.0% 17.3% 23.1% 5.8% brazil Emerging 902,903,592,300 0.0% 0.0% 0.0% 15.8% 21.2% 5.3% Korea Emerging 786,516,181,400 0.0% 4.5% 4.5% 13.8% 0.0% 13.8% Taiwan Emerging 653,082,228,900 0.0% 3.7% 3.7% 11.5% 0.0% 11.5% india Emerging 455,319,489,900 0.0% 0.0% 0.0% 8.0% 10.7% 2.7% South africa Emerging 445,635,851,700 0.0% 0.0% 0.0% 7.8% 10.5% 2.6% Russia Emerging 365,353,791,700 0.0% 0.0% 0.0% 6.4% 8.6% 2.2% Mexico Emerging 257,556,988,000 0.0% 0.0% 0.0% 4.5% 6.0% 1.5% Malaysia Emerging 162,053,819,300 0.0% 0.0% 0.0% 2.8% 3.8% 1.0% indonesia Emerging 130,584,958,900 0.0% 0.0% 0.0% 2.3% 3.1% 0.8% Thailand Emerging 96,435,920,100 0.0% 0.0% 0.0% 1.7% 2.3% 0.6% Chile Emerging 96,066,044,100 0.0% 0.0% 0.0% 1.7% 2.3% 0.6% Poland Emerging 91,502,106,200 0.0% 0.0% 0.0% 1.6% 2.1% 0.5% Turkey Emerging 85,870,269,900 0.0% 0.0% 0.0% 1.5% 2.0% 0.5% Colombia Emerging 45,447,802,200 0.0% 0.0% 0.0% 0.8% 1.1% 0.3% Peru Emerging 40,364,852,400 0.0% 0.0% 0.0% 0.7% 0.9% 0.2% Philippines Emerging 29,738,030,400 0.0% 0.0% 0.0% 0.5% 0.7% 0.2% egypt Emerging 26,735,633,100 0.0% 0.0% 0.0% 0.5% 0.6% 0.2% hungary Emerging 20,346,025,200 0.0% 0.0% 0.0% 0.4% 0.5% 0.1% Czech Republic Emerging 18,426,937,800 0.0% 0.0% 0.0% 0.3% 0.4% 0.1% Morocco Emerging 8,653,912,900 0.0% 0.0% 0.0% 0.2% 0.2% 0.1% 100.0% 100.0% 16.4% 100.0% 100.0% 50.5%
MSCi eMMSCi eaFe
Change in index
Simulated index Weight
original index Weight
Change in index
original index WeightMarket Cap ($)MarketCountry Simulated
index Weight
With respect to the description of any investment strategies, simulations or investment recommendations, we cannot provide any assurances that they will perform as expected and as described in our materials. Past performance is not indicative of future results. Every investment program has the potential for loss as well as gain. Actual after-tax returns achieved from tax management may vary and could be lower than described due to an investor’s specific tax situation. Investors who do not pay the highest U.S. federal marginal tax rate or those who do not have offsetting capital gains and income may not achieve the after-tax impact described.

November / December 201132
Portfolio Applications For VIX-Based Instruments
Taking advantage of volatility
By Nick Cherney, William Lloyd and Geremy Kawaller

www.journalofindexes.com November / December 2011 33
Diversification proved to be a relatively ineffective hedge against 2008’s stock market crash, and since that realization almost three years ago, investors
have been searching for an efficient means to insulate equity portfolios from a repeat performance.
One asset class that performed well in the face of the crash was volatility—the stock market plummeted in September 2008 and the CBOE Volatility Index (the VIX) soared (see Figure 1). The S&P 500 fell by 47 percent from its September 2008 peak to its trough in March 2009. During that same period, the VIX rallied 126 per-cent and at one point was up over 250 percent since the September high on the S&P 500. This negative correla-tion to the S&P 500 led many investors to investigate the VIX as a potential way to protect their portfolios from another collapse. Perhaps VIX, the so-called fear index,
would enable managers to develop the portfolio hedge that investors had been seeking.
The VIX was introduced in 1993, but it wasn’t until 2004, when futures were first listed, that investors could take posi-tions in exchange-traded VIX instruments. Trading in VIX futures accelerated dramatically after the launch of VIX-related exchange-traded products in early 2009. As shown in Figure 2, the 30-day average trading volume in VIX futures has increased almost twentyfold since the advent of VIX ETPs. In that period, investments in VIX-related ETPs have increased from zero to $3 billion.
Before looking at specific strategies or asset allocation con-cepts, it is important to understand the construction of the underlying volatility benchmarks and indexes. The VIX index and instruments related to the index have performance char-acteristics that differ from other futures-based instruments.
The Fear IndexThe VIX1 is a measure of the volatility implied by prices
of S&P 500 options for the next two expiries. The option expiries are weighted such that the index measures the 30-day expected volatility of the S&P 500. The components
of the VIX are near-term and next-near-term put and call options having at least eight days until expiry, and the square root of the variance of these options is used to cal-culate the index. As volatility rises and falls, the strike price range of options with nonzero bids tends to expand and contract. As a result, the number of options used in the VIX calculation may vary from month to month, day to day and possibly even minute to minute. It is the use of the square root in the index calculation and the potential for change in the components of the index that make it unrealistic to actually trade the index. The VIX is widely followed by the market and the media, but it is not an investable index.
The negative correlation of the VIX to the S&P 500 would make it an attractive addition to a portfolio. Figure 4 demonstrates that adding a holding in the VIX to a hold-ing in SPX improves the risk-adjusted return.
Unfortunately, it is not possible to own the VIX. Investors can gain exposure to equity volatility by investing in futures and options on the VIX as well as ETPs linked to VIX futures indexes, but each of these has specific performance characteristics that should be well understood before investing.
Investable InstrumentsIn 2004, CBOE introduced futures on the VIX. This
gave market participants the ability to gain exposure to
Figure 1
Figure 2
S&P 500 Vs. VIX: Performance
Sources: VelocityShares, Bloomberg; January 1990–August 2011
� S&P 500 � VIX
18001600140012001000
800600400200
0
9080706050403020100
VIX
SPX
Jan’00
Jan’01
Jan’02
Jan’03
Jan’04
Jan’05
Jan’06
Jan’07
Jan’08
Jan’09
Jan’10
Jan’11
VIX Futures Trading Volume And VIX ETP AUM
Sources: VelocityShares, Bloomberg; January 1990–August 2011
3,500
3,000
2,500
2,000
1,500
1,000
500
0Dec’05
Dec’06
Dec’07
Dec’08
Dec’09
Dec’10
2,500
2,000
1,500
1,00
500
0
Futures Trading Volume $M
M
� VIX ETP AUM � 30-Day Average Volume (VIX Futures)
ETP
AU
M $
MM
Performance Of VIX And S&P 500 Index
Sources: VelocityShares, BloombergStatistics based on daily returns, January 1990–August 2011
Index VIX S&P 500
Figure 3
Minimum -29.57 -9.03
Maximum 64.22 11.58
Median -0.31 0.05
Mean 0.20 0.03

November / December 201134
equity volatility in exchange-traded markets. One of the challenges with trading VIX futures is that they cannot be arbitraged. It is not possible to own spot VIX, and therefore if a trader believes the futures are mispriced relative to the spot price, it is not possible to buy spot and sell futures (or vice versa) to exploit mispricings. Unlike most futures mar-kets, there is no direct linkage between the VIX and a given futures contract. So while the level of the futures contracts is theoretically an indicator of market expectations about future VIX levels, it is in fact dictated solely by supply and demand; there is no market mechanism to connect the futures and spot price. This means that there is the poten-tial that the level of the futures does not accurately repre-sent the market’s expectation for future volatility.
This pricing dynamic leads directly to the single largest concern for investors looking to hedge their exposure to the equity market with VIX futures: the cost of implementing the hedge. The severe contango, or upward-sloping term struc-ture, that generally exists in the VIX futures market makes the cost of buying and holding long positions in VIX futures pro-
hibitively expensive. Since the inception date of VIX futures indexes in 2005, the average contango from the first to sec-ond nearby contracts has been 3.8 percent per month. This means that on average, VIX would have to rise by that amount per month for the holder of the contract to break even. VIX futures can be an effective hedge for short holding periods, but the cost of hedging with VIX futures can be very high.
S&P 500 VIX Futures IndexesWhile the CBOE has been publishing the VIX since
1993, it wasn’t until 2009 that an investable index emerged. Standard & Poor’s launched a pair of VIX futures indexes: the S&P 500 VIX Short-Term Futures Index (SPVXSP) and the S&P 500 VIX Mid-Term Futures Index (SPVXMP). The short-term index measures the return from daily rolling weighted long positions in the first- and second-month VIX futures contracts. The midterm index measures the return from daily rolling weighted long positions in the fourth- through seventh-month VIX futures contracts. To maintain a constant average maturity, the weighting of the positions in the futures contracts rolls on each trading day. The specifics of the indexes are presented in Figure 5.
Consequences Of Contango In The VIX Futures Market
Since the launch of the first VIX-related ETPs in January 2009, the futures contracts underlying the VIX futures indexes generally have been in contango. The contango in the futures market results in the index los-ing value every trading day if future prices do not move higher than discounted in the market—the value of the contracts is falling as they roll down the futures price curve. The 20-day rolling average spread between the first- and second-month futures contracts has averaged 3.8 percent per month since the inception date of the index in 2005, but has averaged a much steeper 6.2 per-cent per month since the introduction of the VIX ETPs in January 2009. At the same time, the supply/demand dynamic for VIX futures changed dramatically.
Figure 4
SPX/VIX Excess Return Vs. Volatility2
Sources: VelocityShares, Bloomberg; December 2005–August 2011
�
�
�
�
�
�
5% 10% 15% 20% 25% 30% 35%
0% VIX
10% VIX
20% VIX
30% VIX 40% VIX
50% VIX20%
15%
10%
5%
0%
-5%
Exce
ss R
etur
n
Annualized Volatility
VIX Index And VIX Futures Indexes
CVOESPX
Volatility Index
VIX SPVXSP SPVXMP
S&P VIX Shrt-TrmFutures
Index
S&P VIXMid-Trm Futures
Index
Investable No Yes Yes
Futures Contracts N/A 1st & 4th, 5th, 6th, 2nd mo. 7th mo.
Average Maturity N/A 1 mo. 5 mos.
Beta To Spot VIX 1.00 0.44 0.21
Correlation To Spot VIX 1.00 0.88 0.80
Correlation To SPX -0.86 -0.88 -0.85
Sources: VelocityShares, BloombergBased on daily returns, December 2005–August 2011
Figure 5
Figure 6
VIX And VIX Short-Term And Mid-Term Futures Indexes
Sources: VelocityShares, Bloomberg; December 2005–August 2011
Dec’05
Dec’06
Dec’07
Dec’08
Dec’09
Dec’10
800
700
600
500
400
300
200
100
0
� VIX � SPVXSP � SPVXMP

www.journalofindexes.com November / December 2011 35
Many futures markets are in contango from time to time, but the VIX futures market, with the exception of a handful of days, was in contango from mid-2009 through July 2011. A number of theories was put forth as to why: One theory is that the introduction of VIX-related prod-ucts created continued demand to buy the second month and sell the first month in line with the index. Another posits that after the 2008 stock market crash, investors were willing to pay a higher premium for longer-dated volatility exposure that would provide them “protection” from a sell-off in the equity market. In the fourth quarter of 2008 and again in August 2011, the VIX futures curves tend to go into backwardation when the market under-goes significant spikes in volatility.
The contango in the VIX futures market has had a sig-nificant impact on the performance of the S&P VIX Futures indexes. The degree of this impact is most evident when looking at the relative performance of the short- and mid-term indexes. Figure 6 depicts the level of the short-term and midterm indexes since inception against the level of VIX. The short-term index has lost 85 percent since incep-tion, and fell 44 percent in the first half of 2011. During those same periods, the midterm index posted returns of 29 percent and -23 percent, respectively. While the two indexes suffered double-digit negative returns during the first half of this year, the VIX was down only 7 percent. This relative performance clearly highlights the cost of a buy-and-hold position in the S&P 500 VIX Futures Index due to the contango in the futures market.
Clearly, the S&P 500 VIX Short-Term Futures Index is not the same as the VIX. Since the index’s inception through August 2011, the daily return of the short-term VIX futures index has a beta of almost 0.5 with spot VIX, and the beta on the midterm futures index is approximately 0.2.
As many market participants have learned the hard way, it is expensive to buy and hold a long position in VIX futures, options or exchange-traded products. Simply looking at the return of the index makes that painfully clear. The return on the indexes, especially the short-term index, has trended down since inception. The relative performance of the indexes is even clearer when looking at the numbers (see Figure 7).
The S&P 500 VIX futures short-term and midterm indexes are the reference indexes for almost all of the outstanding VIX-related ETPs. Some are leveraged, periodically resetting and/or comprise a combination
of indexes. It is important to understand how the index underlying the ETP behaves under different market conditions, and equally important to understand the instrument. One area that has received a great deal of attention is the performance of leveraged and inverse products that reset daily, and that is particularly inter-esting in the context of VIX futures indexes.
Daily Resetting Leveraged And Inverse ProductsDaily resetting leveraged and inverse products have
return characteristics that may not be immediately appar-ent to many investors. These instruments seek to repli-cate the performance of a leveraged or inverse position in an underlying index for a one-day holding period. In general, these types of instruments are suited for profes-sional traders who are interested in using them to express specific short-term market views or manage portfolio risk. They are not intended for buy-and-hold investors.
In most cases, the performance of a daily rebalancing leveraged or inverse instrument held for more than one day will be different than a similar instrument that is not rebal-anced. In fact, for holding periods longer than a day, it is possible for leveraged/inverse products to perform in the opposite direction than would be expected given the per-formance of the underlying index. For example, the under-lying index could have a positive return, while the leveraged instrument could have a negative return. This is especially true in choppy markets. This loss of value resulting from daily resetting is frequently referred to as “decay.”
The daily resetting instruments exhibit positive con-vexity—the returns of the instrument increase more rapidly and decrease less rapidly than an equivalent linear exposure. As an example, in Exhibit A of Figure 8, the exposure increased on day 2, and this is the reason the daily rebalanced position outperformed the nonre-balanced position by 2 percent.
Path Of Underlying Price ChangesIn addition to demonstrating the effects of the length
of the holding period on returns, the examples above also highlight that the return on the daily rebalanced instru-ment is dependent on the path of the changes in the price of the underlying asset or index. In Exhibit C in Figure 8, the price of the underlying instrument at the end of the third day is the same as the price at the beginning of the first day. Therefore, one might conclude that there would be no change in the value of the daily rebalanced lever-aged instrument over that time period, but, as the analysis shows, that is not the case. As a result of the level rising sig-nificantly and then falling significantly, the return on the daily rebalanced 2x leveraged instrument was -2.1 percent. Clearly, a trader who did not understand the effects of daily rebalancing would not have expected that outcome.
In certain scenarios, daily rebalancing could work in favor of the trader. If the underlying index consistently moves in one direction, then, as shown in Exhibit B, the daily rebalancing works in the trader’s favor—the daily rebalanced instrument outperforms the nonrebalanced
Index Performance (%)
1st Half2011
August2011Index 2010 2009
VIX 25.2 -6.9 -18.1 -45.8
Short-Term 66.2 -43.8 -72.0 -65.0
Mid-Term 28.8 -23.4 -13.3 -23.7
Sources: VelocityShares, Bloomberg
Figure 7
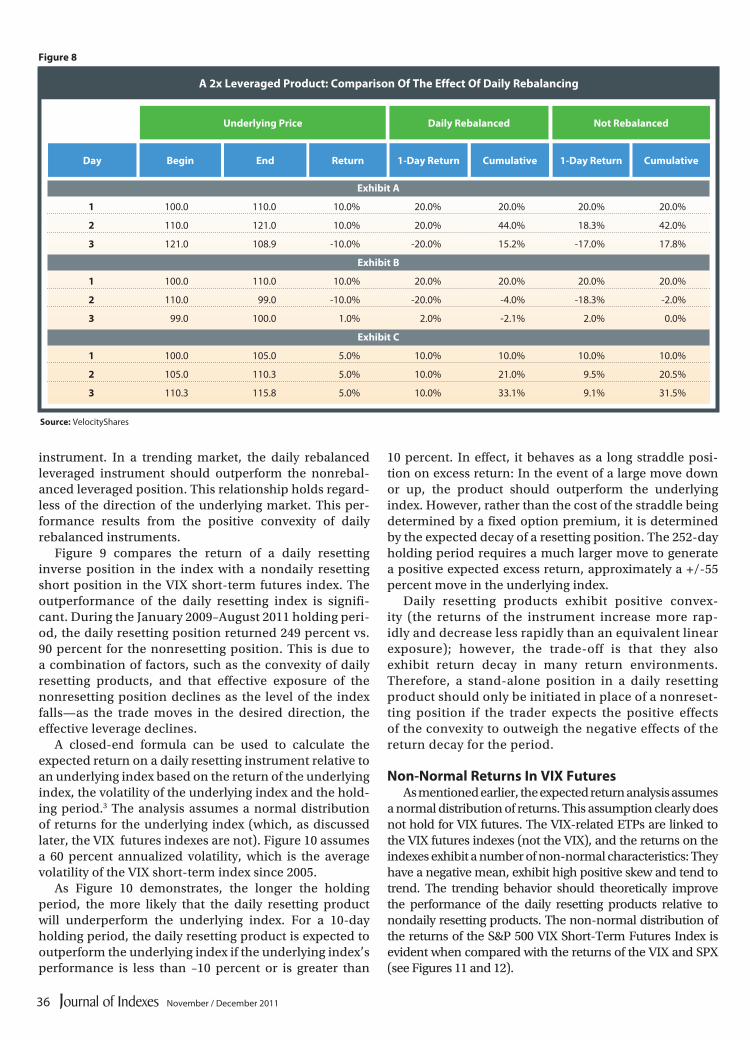
November / December 201136
instrument. In a trending market, the daily rebalanced leveraged instrument should outperform the nonrebal-anced leveraged position. This relationship holds regard-less of the direction of the underlying market. This per-formance results from the positive convexity of daily rebalanced instruments.
Figure 9 compares the return of a daily resetting inverse position in the index with a nondaily resetting short position in the VIX short-term futures index. The outperformance of the daily resetting index is signifi-cant. During the January 2009–August 2011 holding peri-od, the daily resetting position returned 249 percent vs. 90 percent for the nonresetting position. This is due to a combination of factors, such as the convexity of daily resetting products, and that effective exposure of the nonresetting position declines as the level of the index falls—as the trade moves in the desired direction, the effective leverage declines.
A closed-end formula can be used to calculate the expected return on a daily resetting instrument relative to an underlying index based on the return of the underlying index, the volatility of the underlying index and the hold-ing period.3 The analysis assumes a normal distribution of returns for the underlying index (which, as discussed later, the VIX futures indexes are not). Figure 10 assumes a 60 percent annualized volatility, which is the average volatility of the VIX short-term index since 2005.
As Figure 10 demonstrates, the longer the holding period, the more likely that the daily resetting product will underperform the underlying index. For a 10-day holding period, the daily resetting product is expected to outperform the underlying index if the underlying index’s performance is less than –10 percent or is greater than
10 percent. In effect, it behaves as a long straddle posi-tion on excess return: In the event of a large move down or up, the product should outperform the underlying index. However, rather than the cost of the straddle being determined by a fixed option premium, it is determined by the expected decay of a resetting position. The 252-day holding period requires a much larger move to generate a positive expected excess return, approximately a +/-55 percent move in the underlying index.
Daily resetting products exhibit positive convex-ity (the returns of the instrument increase more rap-idly and decrease less rapidly than an equivalent linear exposure); however, the trade-off is that they also exhibit return decay in many return environments. Therefore, a stand-alone position in a daily resetting product should only be initiated in place of a nonreset-ting position if the trader expects the positive effects of the convexity to outweigh the negative effects of the return decay for the period.
Non-Normal Returns In VIX FuturesAs mentioned earlier, the expected return analysis assumes
a normal distribution of returns. This assumption clearly does not hold for VIX futures. The VIX-related ETPs are linked to the VIX futures indexes (not the VIX), and the returns on the indexes exhibit a number of non-normal characteristics: They have a negative mean, exhibit high positive skew and tend to trend. The trending behavior should theoretically improve the performance of the daily resetting products relative to nondaily resetting products. The non-normal distribution of the returns of the S&P 500 VIX Short-Term Futures Index is evident when compared with the returns of the VIX and SPX (see Figures 11 and 12).
A 2x Leveraged Product: Comparison Of The Effect Of Daily Rebalancing
Figure 8
Day Begin End Return 1-Day Return Cumulative 1-Day Return Cumulative
Not RebalancedDaily RebalancedUnderlying Price
Source: VelocityShares
Exhibit A
1 100.0 110.0 10.0% 20.0% 20.0% 20.0% 20.0%
2 110.0 121.0 10.0% 20.0% 44.0% 18.3% 42.0%
3 121.0 108.9 -10.0% -20.0% 15.2% -17.0% 17.8%
Exhibit B
1 100.0 110.0 10.0% 20.0% 20.0% 20.0% 20.0%
2 110.0 99.0 -10.0% -20.0% -4.0% -18.3% -2.0%
3 99.0 100.0 1.0% 2.0% -2.1% 2.0% 0.0%
Exhibit C
1 100.0 105.0 5.0% 10.0% 10.0% 10.0% 10.0%
2 105.0 110.3 5.0% 10.0% 21.0% 9.5% 20.5%
3 110.3 115.8 5.0% 10.0% 33.1% 9.1% 31.5%

www.journalofindexes.com November / December 2011 37
Developing A Volatility StrategyThe dismal performance of the S&P 500 VIX Short-
Term Futures Index since its inception relative to the VIX and the usual shape of the VIX futures curve (con-tango) make it look attractive to be “short” the short-term index. That said, and as Figure 13 shows, there is a significant risk to being short volatility. While a daily resetting position in the inverse of the short-term index has produced a total return of 249 percent from January 2009 through August 2011, there have been periods when the inverse of the index sustained large losses, i.e., October 2008 and August 2011, when the inverse position would have suffered significant losses. There are a number of strategies a manager can employ to mitigate the exposure to a spike in volatility, such as buying out-of-the-money calls or taking a long expo-sure to VIX-related instruments.
One technique that can be used to mitigate the risk
of spikes in VIX to a short volatility strategy is to add a long position in the short-term VIX futures index. At first blush, it may seem odd to combine a long posi-tion with an inverse position on the same index, but there are a number of reasons specific to daily resetting instruments and the VIX futures index that make this strategy interesting:
• Daily resetting exposure has positive convexity• The VIX short-term futures index has a negative
mean return• Index returns are not normally distributed—positive skewThe positive convexity of daily resetting instruments
and the non-normal distribution of the index result in performance characteristics that may not be readily apparent. Figure 13 presents a combination of an inverse position (90 percent) and a 2 times long position (10 per-cent) in the index. The positions are rebalanced to their target weights on a quarterly basis.4 The performance of the combined positions results in a more balanced return profile than the 100 percent inverse position—the addition of the long volatility position provides a hedge against exposure to a spike in volatility.
A simple example is useful to more clearly explain why the combination performs as it does it. A portfolio consisting of notionally equally weighted holdings of
Figure 9 Figure 11
Outperformance Of Daily Reset InverseVs. Short, 2009–Present
Sources: VelocityShares, Bloomberg; December 2008–August 2011
� Short 1x SPVSXP � Long -1x SPVXSP (Daily Reset)
900
800
700
600
500
400
300
200
100
0Dec’08
Jun’09
Dec’09
Jun’10
Dec’10
Jun’11
Sources: VelocityShares, Bloomberg; December 2005–August 2011
Freq
uenc
y
Daily Return (%)� VIX Index � SPVXSP Index � SPX Index
-20% -15% -10% -5% 0% 5% 10% 15% 20%
Distribution Of Daily Returns
600
500
400
300
200
100
0
Sources: “The Dynamics of Leveraged and Inverse Exchange-Traded Funds”Cheng and Madhavan, 2009
Rese
ttin
g Le
vera
ged
Retu
rn
Underlying Index Return
� 10-Day Holding Period � 30-Day Holding Period � 90-Day Holding Period� 252-Day Holding Period � Nonrebalanced Return
Expected Total Returns Daily Resetting Products
-80% -60% -40% -20% 0% 20% 40% 60% 80%
300%
250%
200%
150%
100%
50%
0%
-50%
-100%
Daily Return Distribution Statistics
VIX SPX SPVXSP
Minimum -29.57% -9.03% -16.35%
Maximum 64.22% 11.58% 24.53%
Mid-Term -0.58% 0.08% -0.54%
Mean 0.34% 0.01% -0.07%
Sources: VelocityShares, Bloomberg; December 2005–August 2011
Figure 12
Figure 10

November / December 201138
a long position in the index and short position in the index would have a neutral position in the index on day 1—the value of the combined holding should be unchanged at the end of the day. On day 2, because of the resetting of the two positions, the strategy would no longer be neutral to the index. An increase in the index would result in the portfolio having a net long position to the index, and a decrease in the index would result in a net short position.
Rebalancing each of the underlying positions at the end of the day would result in a change in the weighting of the overall portfolio—since the exposure of each posi-tion resets, the net exposure responds in a nonlinear fash-ion, and the net exposure tends to be long as the index increases, and short as the index decreases. To be clear, it is the individual positions in the index that are reset every day, not weightings in the portfolio.
The concept behind the strategy is that the holding in the inverse position enables the investor to benefit from negative roll yield (from contango in the futures mar-
ket) in most market conditions, while the long position enables the strategy to benefit from a spike in volatility. The cost of the position is the expected decay.
A combination of a long and short position can result in an attractive return profile relative to the S&P 500 (see Figure 14). Determining the desired weight-ing of these positions and the frequency of rebalanc-ing the portfolio to the target weightings needs to be determined by the manager. It is likely that managers will want to adjust the portfolio weightings over time because of portfolio drift, changes in the shape of the VIX futures curve or because of their view on volatility.
Managing The StrategyThe exposure to the long and short positions can vary
significantly due to the performance of the VIX futures index, and therefore it is necessary to manage this strat-egy. The manager needs to determine how frequently to rebalance the positions to the target weights and what those target weights should be from time to time.
As mentioned earlier, the midterm futures index has a lower beta to VIX than the short-term index, and does not respond to the same degree as the short-term index to tem-porary spikes in volatility. By the same token, the contango (and therefore the negative roll yield) in the mid-term index is generally not as severe asfor the short-term index.
Given the differences in the characteristics of the indexes, another approach to the hedging strategies is to take a long position the midterm index and an inverse position in the short-term index (see Figure 15). Not sur-prisingly, substituting the midterm index for the short-term index results in a portfolio that is less responsive to spikes in VIX than those presented earlier, but that performs better when volatility is more restrained. For this reason, the manager will likely adjust target weights to reflect the differences in the expected performance of the short-term and midterm futures indexes.
The analysis assumes the portfolio weights are rebal-anced quarterly. While only three portfolios are consid-
Figure 13 Figure 15
Figure 14
� Short Vol Strategy � SPVXSP � SPX
90% Inverse SPVXSP/10% Long 2x SPVXSP
0
100
200
300
400
500
600
Dec’05
Dec‘06
Dec‘07
Dec‘08
Dec‘09
Dec‘10
Short Volatility Hedged Strategy4
Source: VelocityShares, Bloomberg, December 2005–August 2011
� Long/Short Vol MT � SPVXSP � SPX
55% Inverse SPVXSP/45% Long 2x SPVXMP
0
100
200
300
400
500
600
Dec’05
Dec‘06
Dec‘07
Dec‘08
Dec‘09
Dec‘10
Long/Short Volatility Strategy Mid-Term6
Source: VelocityShares, Bloomberg, December 2005–August 2011
� Tail Risk Strategy � SPVXSP � SPX
67% Inverse SPVXSP/33% Long 2x SPVXSP
0
100
200
300
400
500
600
Dec’05
Dec‘06
Dec‘07
Dec‘08
Dec‘09
Dec‘10
Long/Short Volatility Strategy Short Term5
Source: VelocityShares, Bloomberg, December 2005–August 2011
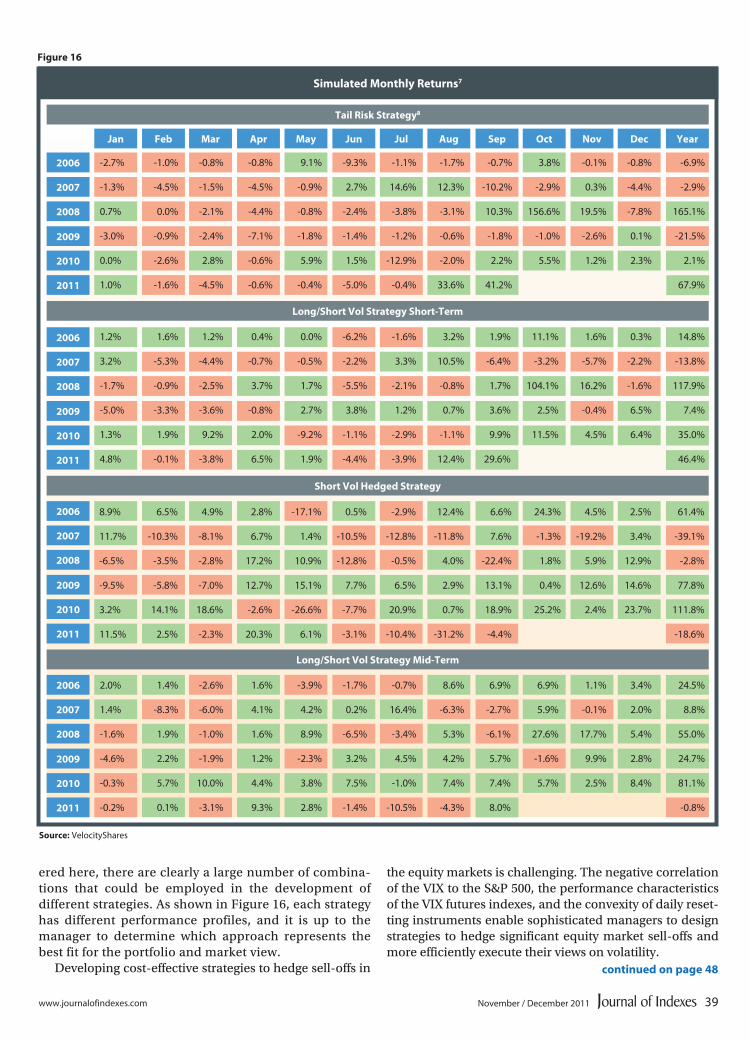
www.journalofindexes.com November / December 2011 39
ered here, there are clearly a large number of combina-tions that could be employed in the development of different strategies. As shown in Figure 16, each strategy has different performance profiles, and it is up to the manager to determine which approach represents the best fit for the portfolio and market view.
Developing cost-effective strategies to hedge sell-offs in
the equity markets is challenging. The negative correlation of the VIX to the S&P 500, the performance characteristics of the VIX futures indexes, and the convexity of daily reset-ting instruments enable sophisticated managers to design strategies to hedge significant equity market sell-offs and more efficiently execute their views on volatility.
Simulated Monthly Returns7
Figure 16
Source: VelocityShares
Tail Risk Strategy8
Long/Short Vol Strategy Short-Term
Short Vol Hedged Strategy
Long/Short Vol Strategy Mid-Term
Jan Feb Mar Apr May Jun Jul Aug Sep Oct Nov Dec Year
2006
2006
2006
2006
2009
2009
2009
2009
2007
2007
2007
2007
2010
2010
2010
2010
2008
2008
2008
2008
2011
2011
2011
2011
8.9% 6.5% 4.9% 2.8% -17.1% 0.5% -2.9% 12.4% 6.6% 24.3% 4.5% 2.5% 61.4%
11.7% -10.3% -8.1% 6.7% 1.4% -10.5% -12.8% -11.8% 7.6% -1.3% -19.2% 3.4% -39.1%
-6.5% -3.5% -2.8% 17.2% 10.9% -12.8% -0.5% 4.0% -22.4% 1.8% 5.9% 12.9% -2.8%
-9.5% -5.8% -7.0% 12.7% 15.1% 7.7% 6.5% 2.9% 13.1% 0.4% 12.6% 14.6% 77.8%
3.2% 14.1% 18.6% -2.6% -26.6% -7.7% 20.9% 0.7% 18.9% 25.2% 2.4% 23.7% 111.8%
11.5% 2.5% -2.3% 20.3% 6.1% -3.1% -10.4% -31.2% -4.4% -18.6%
-2.7% -1.0% -0.8% -0.8% 9.1% -9.3% -1.1% -1.7% -0.7% 3.8% -0.1% -0.8% -6.9%
-1.3% -4.5% -1.5% -4.5% -0.9% 2.7% 14.6% 12.3% -10.2% -2.9% 0.3% -4.4% -2.9%
0.7% 0.0% -2.1% -4.4% -0.8% -2.4% -3.8% -3.1% 10.3% 156.6% 19.5% -7.8% 165.1%
-3.0% -0.9% -2.4% -7.1% -1.8% -1.4% -1.2% -0.6% -1.8% -1.0% -2.6% 0.1% -21.5%
0.0% -2.6% 2.8% -0.6% 5.9% 1.5% -12.9% -2.0% 2.2% 5.5% 1.2% 2.3% 2.1%
1.0% -1.6% -4.5% -0.6% -0.4% -5.0% -0.4% 33.6% 41.2% 67.9%
2.0% 1.4% -2.6% 1.6% -3.9% -1.7% -0.7% 8.6% 6.9% 6.9% 1.1% 3.4% 24.5%
1.4% -8.3% -6.0% 4.1% 4.2% 0.2% 16.4% -6.3% -2.7% 5.9% -0.1% 2.0% 8.8%
-1.6% 1.9% -1.0% 1.6% 8.9% -6.5% -3.4% 5.3% -6.1% 27.6% 17.7% 5.4% 55.0%
-4.6% 2.2% -1.9% 1.2% -2.3% 3.2% 4.5% 4.2% 5.7% -1.6% 9.9% 2.8% 24.7%
-0.3% 5.7% 10.0% 4.4% 3.8% 7.5% -1.0% 7.4% 7.4% 5.7% 2.5% 8.4% 81.1%
-0.2% 0.1% -3.1% 9.3% 2.8% -1.4% -10.5% -4.3% 8.0% -0.8%
1.2% 1.6% 1.2% 0.4% 0.0% -6.2% -1.6% 3.2% 1.9% 11.1% 1.6% 0.3% 14.8%
3.2% -5.3% -4.4% -0.7% -0.5% -2.2% 3.3% 10.5% -6.4% -3.2% -5.7% -2.2% -13.8%
-1.7% -0.9% -2.5% 3.7% 1.7% -5.5% -2.1% -0.8% 1.7% 104.1% 16.2% -1.6% 117.9%
-5.0% -3.3% -3.6% -0.8% 2.7% 3.8% 1.2% 0.7% 3.6% 2.5% -0.4% 6.5% 7.4%
1.3% 1.9% 9.2% 2.0% -9.2% -1.1% -2.9% -1.1% 9.9% 11.5% 4.5% 6.4% 35.0%
4.8% -0.1% -3.8% 6.5% 1.9% -4.4% -3.9% 12.4% 29.6% 46.4%
continued on page 48

By Andrew Clark
Improving the forecasting of volatility
Realized Volatility Indexes
40 November / December 2011

Entering The RealmFirst and foremost, we will, to use one of Richard
Feynman’s memorable quotes, “Learn by trying to under-stand simple things in terms of other ideas.” The things we will try to understand for the purposes of this article are the following: Do people invest (or trade) at different time horizons? Are there different views of risk among investors? And are there different views of where the same stock’s price will be one week, one month or one year from now? These are the questions we will attempt to answer in a direct way. From there we will be able to ask subtler questions that will hopefully illuminate the Realized Volatility Index (RVI).
To the question, “Do people invest (or trade) at different time horizons?” the answer is clearly yes. And though mod-ern portfolio theory (MPT) assumed this fact away, keep in mind that MPT is the grandfather of much of what fol-lowed in financial economics and financial mathematics, including steps forward like the RVI. So though grandfather may have gotten some things wrong, he made some terrific pioneering efforts.
It is accepted by many, if not all, practitioners and by a growing number of academics, that different market
participants have different time horizons when it comes to their analysis of past events. These different time horizons and resolutions affect their trading or investing goals. The existence of heterogeneous trading behaviors has given rise to the hypothesis that the market itself is fractal. By fractal, we mean there is no single preferred time period or investment horizon in the market. Not one day, two weeks, one month … nothing. Why no one investment horizon? Because the heterogeneous trading behaviors that make up the market can be characterized as different actor groups or components, each with their own frame of reference. In other words, the differing time horizons of investors and traders are a key aspect of the market. To state it another way, it’s the variety of time horizons and their interaction that is probably one of the most important factors that make up a market. Given the variety of time scales and frames of reference, each component could be modeled in the form of an intrinsic or individual time for that component (this statement will be key in understanding the RVI later).
The fractal approach to analyzing objects of different kinds, including financial data, can be stated as follows:
Objects are analyzed on different scales, with different
degrees of resolution, and the results are compared and
interrelated.
Rather sounds like the market as we know it, doesn’t it? As to our next question, “Are there different views of risk
among investors?” the answer is also clearly yes. Studies by folks such as Olsen and Associates1 and Lynch and Zumbach2 have demonstrated that this difference in risk is also fractal, meaning that, as we noted in bold above, risk (or volatility) is analyzed at different time scales with different degrees of resolution. An obvious example of this is people who trade volatility on a short-term basis, e.g., over a few days. There are also other actors whose horizons are typically a month, if not more (such as port-folio managers). The sudden movement in the price of a stock could move volatility enough for a short-term trader that he will adjust his position accordingly that day or the next. The portfolio manager, however, will more than likely view a one-day or even a few-day unexpected move-ment in price as a bump in the road and will probably not adjust her position, or will adjust it minimally. What is also of interest in the work of Lynch and Zumbach is that risk (volatility) can cascade. What the authors mean by this is that when the typical time horizons (or differ-ent scales and resolutions) collapse, it is a one-way flow,
always from the telescopic to the microscopic. In other words, if enough of those participants with longer-term views of volatility begin to act like those with the shorter-term views, a cascade or a volatility cluster occurs, such as during that period of wretched months for the equity market in late 2008 and early 2009.
As to our final question, “Are there different views of where the same stock’s price will be one week, one month or one year from now?” the answer is yes. To restate our fractal argument above, there is no privileged time scale in the market. The interaction of what we call components and their different time scales gives rise to endogenous events such as volatility clusters, trend persistence and the empirically demonstrated time lag between interest rate changes and foreign exchange rate adjustments. As a result of such relationships, there can clearly be differing views on price. And such differences in views are not a list of inefficiencies, as is often stated in economic texts. It is, as we have demonstrated, a con-sequence of different time scales in the market.
The Subtler QuestionsSo if there is no privileged time scale in the market and if
we want to model the individual time frame of each inves-tor and trader, how do we do that? This is where wavelets
www.journalofindexes.com 41November / December 2011
To the question, ÒDo people invest (or trade) at different time
horizons?Ó the answer is clearly yes. And though MPT assumed this
fact away, keep in mind that MPT is the grandfather of much of what
followed in financial economics and financial mathematics.

come in. Wavelets allow us to take the original data—in our case, a time series of daily volatility observations—and decompose it into the components or actor groups noted above. Wavelets allow us to isolate the different time scales so we can examine separately the dynamics—the inner workings—of each component. This is of great benefit to us, as we will be able to say more about what is happening on the different scales and different resolutions and their effect on volatility.
While the mathematics of wavelets can be difficult to understand, there is a simple way to explain their ability to let us see or generate the time scales the mar-ket works on. Multiresolution analysis (MRA) is a way of decomposing a time series into its components or actors. The different components the MRA generates are the components of the original signal at different resolutions (which sounds like what we are looking for). Via the use of MRA, we can generate components that span time scales from a few days to a few months. So, with MRA, we have a way of getting closer to our earlier statement about the market:
Objects are analyzed on different scales, with different
degrees of resolution, and the results are compared and
interrelated.
Before we discuss how MRA results are used, we need to take a slight detour into so-called GARCH (general-ized autoregressive conditional heteroskedasticity) mod-els. GARCH models are commonly used when model-ling financial time series that exhibit time-varying volatil-ity clustering; in other words, periods of high volatility interspersed with periods of relative calm. Over the past few years, GARCH modelers have also been looking at volatility over different time scales, typically by starting with tick-by-tick price data. The results they have achieved are very impressive, especially if you look at a recent model called LM (long memory) ARCH. However, there’s a differ-ence between the LM-ARCH approach and that of the RVI. LM-ARCH models do not rely explicitly on an assump-tion that all time scales are equivalent (i.e., on using data spanning time periods of days to a few months). Instead, they focus on intraday (tick-by-tick) to daily data. Another approach, called IGARCH, typically uses just one time period as input. The RVI, by contrast, is based explicitly on the “no privileged time scale” argument.
With our components in hand, we have the raw mate-rial to make a volatility forecast. As we want to forecast volatility, we need a guiding principle for constructing
our forecasts. I think a statement from Kevin Judd and Thomas Stemler3 is appropriate here: “Forecasting: it is not about statistics, it is about dynamics.” This is the title of their paper and a good guiding principle for us. I say this because in our personal relationships, we under-stand (or try to understand) the dynamics that are at play between ourselves and our friends, boss and spouse. And if you were asked to predict a friend’s reaction to something—a statement a colleague is thinking of saying, a change in events—you would use your understanding of your friend to predict what she might say or do. Of course, there is some wiggle room (called error bars, in statistics) in what we predict. Even then, more often than not we use our understanding of the person—our understanding of her internal workings and their relationship with us—to make our best forecast. So dynamics play a dominant role in our lives, and there is no reason to think that trying to forecast volatility—in other words, the interrelatedness of various people in the market—will be any different.
So how can we describe the dynamics of the compo-nents generated by MRA? First, we see if they’re random or deterministic. We look at this because it is impor-tant to distinguish the two. There are vastly different forecasting techniques used for random, as opposed to deterministic, processes. Again, we will not describe the
mathematics that are used to decide into which category market components fall, but we can say that for all but two short-dated components, we have strong indications of determinism. This is helpful to know. The two short-dated components that are random can be forecasted using fairly well-known techniques (such as so-called ARIMA models). The random results also confirm for us that, at short time intervals, volatility can be seen as a random (or stochastic) process.
As for the remaining components or actor groups, the multiresolution analysis suggests that they are determin-istic, albeit for a period of time that extends up to one month into the future.4 Beyond that, the determinism breaks down, and it appears that the process becomes stochastic again. Fortunately, we don’t have to know what happens after the determinism breaks down in order to make our volatility forecast.
Now we search for the right model to get a good forecast of those components that fit into the deterministic model. For the S&P 500, we find out that two simple models give us good forecasts. Now we have all the pieces in place to forecast volatility: a stochastic model for the short-dated components and these two simple models for the remain-
42 November / December 2011
While the mathematics of wavelets can be difficult
to understand, there is a simple way to explain their ability to
let us see or generate the time scales the market works on.

ing components. Now we will forecast each of the compo-nents separately and, according to the rules of the MRA decomposition, add up the individual forecasts to get our RVI volatility forecast.
Testing The Accuracy Of The RVIIn a test, we forecast the S&P 500 monthly volatility
from January 2007 through December 2010. We forecast the 21-day volatility of the index five, 10 and 21 days into the future using three models: I-GARCH(1), LM-ARCH and the RVI. I-GARCH(1) is very similar to MSCI’s RiskMetrics model that has been used by practitioners since 1998. Its updated version, the LM-ARCH, is the new measure of volatility RiskMetrics began to offer in 2006. Both methodologies are available on the MSCI website for the mathematically inclined.
We add the VIX to our 21-day comparison. However, by contrast with the other volatility measures, the VIX is a measure of implied volatility and not an estimate of the realized (or actual) volatility that an investor will experi-ence in the future.5 So although we will compare the VIX with the RVI and the other forecasts, the comparison must be taken with a grain of salt.
We define volatility as the annualized 21-business-day standard deviation of returns. This chosen time frame puts us in sync with the basic properties of the VIX.
We use three common error measures to evaluate the forecasts: root mean squared error (RMSE); mean absolute error (MAE); and mean absolute percentage error (MAPE). RMSE is a good measure of precision. It aggregates the errors into a single measure of predictive power. The errors typically occur because the forecasting technique doesn’t account for information that could produce a more accu-rate estimate. The MAE is self-explanatory. The MAPE is the average of the absolute value of the percentage differ-ence between forecast and actual. This percentage error allows one to compare the error of fitted time series that differ in level. Comparing the forecasts and actuals at dif-ferent levels is important, as during the test period, volatil-ity spikes were significant in both 2008 and 2009.
The results of our tests are given in Figure 1.For each of the three tests, the RVI is the best-perform-
ing forecast method (i.e., resulting in the lowest error scores). It clearly outperforms the IGARCH method and is better than the LM-ARCH, though the RMSE results over a 21-day forecast period for LM-ARCH and RVI are close.
As the VIX is just a 21-day forecast, the author will show here the RMSE, MAE and MAPE for the VIX: 12.8 percent, 8.6 percent and 29 percent. So the VIX is an infe-rior 21-day realized volatility forecast whether the error measure be RMSE, MAE or MAPE. However, it needs to be reiterated that the VIX is a forward-looking measure of implied volatility, not a forecast of realized volatility.
Our results speak well of the RVI and could encourage exchanges and ETF providers to build an RVI derivative. The RVI can be computed for any stock and commodity that trades and has at least 10 years of price history, even if there are no options for it. By contrast, the VIX needs options prices in order to be calculated. The RVI could be built in India, for example, where few options trade. The RVI complements implied volatility indexes, such as the VIX. Using realized and implied volatility indexes togeth-er would help risk managers look across the spectrum of stock and commodity index products, something they cannot do now. And realized volatility indexes should help portfolio managers manage the volatility risk of their portfolios across all markets, while implied volatility mea-sures only exist for selected indexes and securities.
Endnotes1. Olsen and Associates, Publications: http://www.olsen.ch/publications/working_papers/
2. See “Market Heterogeneities and Causal Structure of Volatility,” Paul E. Lynch and Gilles O. Zumbach. Quantitative Finance, volume 3, 2003, pp.320-331.
3. Philosophical Transactions of the Royal Society A – Mathematical, Physical and Engineering Sciences, vol. 368, 2010, pp. 263-271.
4. For the mathematically inclined, the nonlinear dynamics allow the reconstruction of the vector space and from that forecasts can be made. The length of
the forecast horizon is determined, in part, by the Lyapunov exponent.
5. Implied volatility has particular idiosyncrasies related to the options market: It reflects the supply and demand of the underlying security necessary to
implement the replication strategy. Similarly, options bear volatility risk and a related volatility risk premium can be expected. These particular effects
could bias the implied volatility upward.
Error Measures For Volatility Forecasting Methods
Figure 1
5 6.1 6.0 2.4
10 5.2 4.9 3.4
21 4.9 4.0 3.7
5 6.0 3.0 2.0
10 5.9 3.9 2.9
21 5.3 4.3 3.3
5 18.0 13.1 12.3
10 17.4 15.0 13.1
21 16.1 16.1 14.0
No. of Forecast Days IGARCH LM-ARCH RVI
Root Mean Squared Error (RMSE)
Mean Absolute Error (MAE)
Mean Absolute Percentage Error (MAPE)
www.journalofindexes.com 43November / December 2011
Source: Thomson Reuters Indices

November / December 201144
By Joseph Saluzzi and Sal Arnuk
Major market indexes reflect only a fraction of intraday trades
Phantom Indexes

November / December 2011www.journalofindexes.com 45
The investment world trusts and relies upon indexes such as the Dow Jones industrial average, S&P 500, Nasdaq 100 and Russell 2000 for gauging market
activity. In recent years, this emphasis has become even greater due to the explosion in popularity of tradable index-based products such as ETFs, futures and options. In addition, the market has become increasingly dominated by trading volume from arbitraging index, ETF and other derivative movements versus the underlying equities.
Surprisingly, we have found that on an intraday basis, these widely watched indexes and possibly others are based on less than 30 percent of all shares traded, therefore conveying incomplete trading data. We have confirmed in writing with representatives from Dow Jones Indexes, S&P, Nasdaq and Russell that these indexes are calculated using only primary market data. Nowadays, in a world of micro-second trading, these indexes have become phantoms—they reflect some trades involving their components, but not the majority of them.
This situation raises serious questions about the reli-ability of index-based trading products. The solution? Simple: Indexes should be calculated based on every trade involving a component that crosses the consolidated tape, which includes trades from nonprimary exchanges such as BATS, Direct Edge and NYSE Arca.
Incomplete Trading DataU.S. stocks are traded today on more than 50 market
centers. According to TABB Group, stock exchanges trade 67 percent of overall volume. The biggest exchanges are Nasdaq (26 percent of total U.S. stock exchange share); NYSE (19 percent); NYSE Arca (19 percent); Direct Edge (14 percent); and BATS (12 percent).1 The balance of shares traded (about 33 percent) occurs in dark pools, electronic communication networks (ECNs) and broker-internalized alternative trading systems.
As a result, many stocks are traded on exchanges other than where they have their primary listing.2 NYSE actually only trades 27 percent of the volume of NYSE-listed stocks,3 and Nasdaq just 29 percent of the volume of Nasdaq-listed stocks.4 Most major indexes, however, are calculated intra-day using sales from only the primary exchange where the component stock is listed. Thus, they do not incorporate the majority of shares traded. That means that these indexes are based on a little more than one out of every four shares traded.
This index incompleteness is compounded by the num-ber of respective components. There are 30 stocks in the DJIA, 100 in the Nasdaq 100, 500 in the S&P 500 and 2,000 in the Russell 2000. The problem can also be exacerbated components’ trading liquidity. In general, the smaller the market cap, the less liquid the trading, and the larger the variances that could occur between a trade on one market center and another trade on another market center.
Unintended Consequence Of Reg NMSThe phantom index problem appears to be another
unintended consequence of the Securities and Exchange
Commission’s Reg NMS, which was designed to create more efficient and competitive markets. Prior to 2007, approximately 80 percent of NYSE-listed stocks traded on the NYSE and the majority of stocks in the S&P 500 and the DJIA (the two-most-watched indexes) were NYSE-listed stocks. In 2007, Reg NMS resulted in the equity markets becoming extremely fragmented, spreading trades among a variety of competing market centers.
Almost overnight, NYSE’s market share of trading dropped from 80 percent to less than 30 percent, as faster, cheaper competitors captured share. Indexes, which were being calculated intraday based on 80 percent of all trades, began being calculated based on less than 30 percent of all trades. Owners of the major indexes, however, have not changed what data they capture to reflect this new paradigm.
NYSE LRPs: Another Source Of Index Inaccuracy?We also believe that during times of market stress, when
the whole world is watching, key indexes might reflect an even greater degree of inaccuracy. The conventional belief is that on May 6, 2010, the DJIA, under selling pressure due to a plethora of reasons, plunged nearly 1,000 points, and then recovered much of that loss within 20 or so minutes. Some speculate, however, that the DJIA actually fell 25 percent lower.5
One reason could be NYSE’s Liquidity Replenishment Points (LRPs). According to the NYSE, an LRP is: “A volatility control built into the Display Book to curb wide price movements resulting from automatic executions and sweeps over a short period of time. When triggered, LRPs automatically convert the market temporarily to slow or Auction Market-only mode, allowing specialists, floor bro-kers and customers to supplement liquidity and respond to the stock’s volatility.”6
During the May 6, 2010 flash crash, many LRPs were activated. Most trades that were executed at extreme pric-es, such as $0.01 per share in some extreme cases, did not occur on the NYSE. For example, Procter & Gamble (NYSE: PG)—a DJIA component—traded as low as $39.37 on nonprimary exchanges.7 However, because LRPs were acti-vated, the low of the day on the NYSE was only $56, at least 42 percent higher than its actual low across all exchanges. Any trades below $56 were not included in index calcula-tions because they were traded off the primary exchange.
In times of extreme volatility, NYSE LRPs will likely be activated, but nonprimary exchanges may continue trading NYSE stocks. However, intraday trades from these nonpri-mary exchanges will not be reflected in the indexes. Thus, investors who rely on index values in times of market stress could be relying on data that diverges sharply from reality.
ConclusionWould you bet on the Kentucky Derby (legally, of
course) if the results reflected only some of the horses in the race? Would you have confidence in a publicly traded company that reported results from only some of its sub-sidiaries? Yet something similar is occurring with the major stock indexes in the U.S. The indexes that everyday retail

November / December 201146
and institutional investors rely upon are being calculated on an intraday basis without a full deck, so to speak.
In a post-Reg NMS world, fragmentation among market centers has reduced the amount of trades that occur on the primary exchanges. The primary market alone is no longer a
complete-enough source of data when calculating an index value, since it represents only about one in four trades. Index suppliers must adjust their methodology to accurately reflect all trades intraday in a timely manner. If they don’t, they risk regulators or Congress doing it for them.
Trading
Symbol
3-Month Average
Daily VolumeCompany Primary ExchangeTicker % Trading On Primary Exchange
3M Co MMM NYSE 36.87
Alcoa Inc AA NYSE 15.52
American Express AXP NYSE 26.29
AT&T T NYSE 22.02
Bank of America Corp BAC NYSE 15.26
The Boeing Co BA NYSE 21.69
Caterpillar Inc. CAT NYSE 19.80
Chevron Corp CVX NYSE 28.75
Cisco Systems CSCO NDAQ 26.52
Coca-Cola Co KO NYSE 33.71
DuPont DD NYSE 29.01
Exxon Mobil XOM NYSE 34.24
General Electric GE NYSE 20.77
Hewlett-Packard HPQ NYSE 30.14
Home Depot HD NYSE 25.05
Intel INTC NDAQ 30.59
Int’l Business Machines IBM NYSE 26.91
Johnson & Johnson JNJ NYSE 28.52
JPMorgan Chase JPM NYSE 27.30
Kraft Foods KFT NYSE 28.07
McDonald’s MCD NYSE 29.26
Merck & Co MRK NYSE 20.87
Microsoft MSFT NDAQ 30.19
Pfizer PFE NYSE 20.50
Procter & Gamble PG NYSE 30.22
Travelers Cos TRV NYSE 50.29
United Technologies UTX NYSE 28.15
Verizon Communications VZ NYSE 20.66
Wal-Mart Stores WMT NYSE 27.96
Walt Disney Co DIS NYSE 29.83
Average 27.17
Figure 1
Source: Fidessa Fragmentation Index; http://fragmentation.fidessa.com/fragulator/. Percentage traded on primary exchange from May 1- May 31, 2011.
Dow Jones Industrial Average Components8
Endnotes1. See http://mm.tabbforum.com/liquidity_matrices/66/documents/original_TABB_Group_LiquidityMatrix_April_2011.pdf?1305559304 – TABB Group Liquidity Matrix April 2011
2. “The exchange where a corporate stock issue is primarily listed is the primary listing market.” − Larry Harris, “Trading and Exchanges” (New York: Oxford University Press, 2003), 48.
3. See https://batstrading.com/market_summary/ − 5-Day Average Chart
4. See http://www.nasdaqomxtrader.com/Trader.aspx?id=MarketShare − Market Share Statistics − May 2011
5. Melloy, John. “Did Dow Actually Drop 1250 in ‘Flash Crash’?” Retrieved May 31, 2011 from http://www.cnbc.com/id/37109515/Did_Dow_Actually_Drop_1250_in_Flash_Crash
6. See http://www.nyse.com/glossary/1127471914646.html
7. Goldman, David. “P&G Stock Drops 37% − Not Really” from http://money.cnn.com/2010/05/06/markets/procter_and_gamble_stock/index.htm?postversion=2010050619
8. See http://fragmentation.fidessa.com/fragulator/ − % traded on primary exchange from May 01- May 31, 2011

STOXX is part of Deutsche Börse and SIX Group
STOXX®, EURO STOXX 50®, DAX®, and SMI® indices are protected through intellectual
property rights. The use of these indices for fi nancial products or for other purposes
requires a license from STOXX Ltd. (“STOXX”), Deutsche Börse AG (“DBAG”), and/or
SIX Swiss Exchange AG (“SIX”). STOXX, DBAG, and SIX do not make any warranties or
representations, express or implied, with respect to the timeliness, sequence, accuracy,
completeness, currentness, merchantability, quality, or fi tness for any particular purpose
of their indices and index data. STOXX, DBAG, and SIX are not providing investment
advice through the publication of the STOXX®, DAX®, and SMI® indices or in connection
therewith. In particular, the inclusion of a company in an index, its weighting, or the
exclusion of a company from an index, does not in any way refl ect an opinion of STOXX,
DBAG, or SIX on the merits of that company or qualifi es as an investment advice.
Contacts
Zurich, Headquarters: +41 58 399 5300 [email protected]
STOXX LIMITED
INNOVATIVE GLOBAL
INDICESInnovation means, literally, “the introduction of something better” – a definition STOXX has always lived up to,
first and foremost with the EURO STOXX 50®, Europe’s leading blue-chip index. But STOXX has more to offer
than that: a truly global index family, ranging from blue-chip indices to broader benchmarks for virtually every
country and region. And because innovation is part of our DNA, STOXX offers advanced index concepts such
as Risk Control, Global ESG Leaders, and enhanced infrastructure indices – all applying a transparent, purely rules-
based methodology. Besides being one of the financial world’s most renowned index brands, STOXX Ltd. also
markets and distributes the complete portfolio of DAX® and SMI Indices®, the leading brands from Deutsche
Börse AG and SIX Swiss Exchange AG. While innovation is our driver for product development, established
values such as trustworthiness and responsiveness are what matters most to us in client relationships. A successful
combination, as the figures clearly show: in 2010, approx. 185,000 structured products were issued on STOXX®,
DAX®, and SMI® indices, and our indices are the fourth-largest underlying for ETFs worldwide. More about the
index innovators on www.stoxx.com

48 November / December 2011
Investors—particularly passive indexers—need to gear their asset mix decisions in view of these labor market trends. Broad stock market exposures, especially those tracking the most income-skewed Western economies, are likely to show muted returns. A better approach will be to focus on index constructions that emphasize global opportunities and sta-ble dividends and, importantly, overweight the world’s great asset class—the multinational corporation.
Workers may indeed be untied from corporate earn-ings trends of late, but this hardly proves Marx’s overall thesis correct. What he failed to recognize is that free financial markets, though not perfect, ultimately expose any underlying flaws and self-correct better than any type of government intervention. And, frankly, identify-ing distortions and allocating capital accordingly is also the job of portfolio managers.
Endnotes1 http://www.time.com/time/magazine/article/0,9171,924018,00.html 2 Figures from Bank Credit Analyst
Mordy continued from page 13
Cherney continued from page 39
DisclosuresPast performance or results should not be taken as an indication or guarantee of future performance or results, and no representation or warranty, express or implied, is made regarding future performance or results. The information contained in this document does not constitute an offer to sell, or a solicitation of an offer to purchase, any security, future or other financial instrument or product. Investors should review the prospectus or offering document for any security, financial instrument or product and make their own investment decisions based on their specific investment objectives and financial position and after consulting independent tax, accounting, legal and financial advisors. The information contained herein (including historical prices or values) has been obtained from sources that VelocityShares LLC and VLS Securities LLC (together, “VelocityShares”) consider to be reliable; however, VelocityShares does not make any representation as to, or accepts any responsibility or liability for, the accuracy or completeness of the information contained herein. VelocityShares” and the VelocityShares logo are registered trademarks of VelocityShares Index & Calculation Services, a division of VelocityShares, LLC. “Standard & Poor’s®”, “S&P®”, “S&P 500®”, “Standard & Poor’s 500™”, “S&P 500 VIX Short-Term Futures™ ER” and “S&P 500 VIX Mid-Term Futures™ ER” are trademarks of Standard & Poor’s Financial Services LLC (“S&P”) and have been licensed for use by VelocityShares LLC, and VLS Securities LLC. “VIX” is a trademark of the Chicago Board Options Exchange, Incorporated (“CBOE”) and has been licensed for use by S&P. S&P does not sponsor, promote, or sell any product based on the Index and neither S&P nor CBOE make any representation herein regarding the advisability of investing in any product based on the Index.
Endnotes1. http://www.cboe.com/micro/VIX/vixwhite.pdf2. Monthly rebalance to target portfolio weights3. “The Dynamics of Leveraged and Inverse Exchange-Traded Funds,” Cheng and Madhavan, 20094. Short volatility-hedged strategy represents the returns of a portfolio containing 90 percent -1x SPVXSP and 10 percent 2x SPVXSP for the period December 2005-Agust 2011.
The portfolio is rebalanced on a quarterly basis with an equal percentage of the portfolio being rebalanced on each trading day of the quarter.5. Tail risk strategy represents the returns of a portfolio containing 67 percent -1x SPVXSP and 33 percent 2x SPVXSP for the period December 2005-Agust 2011.The portfolio
is rebalanced on a quarterly basis with an equal percentage of the portfolio being rebalanced on each trading day of the quarter.6. Long-short volatility mid-term represents the returns of a portfolio containing 55 percent -1x SPVXSP and 45 percent 2x SPVXMP for the period December 2005-Agust
2011. The portfolio is rebalanced on a quarterly basis with an equal percentage of the portfolio being rebalanced on each trading day of the quarter.7. lllustrates the theoretical returns of a portfolio with a long exposure to an inverse index and a long exposure to a leveraged index for the period December 2005-Agust 2011.
The percentage exposure to each index depends on the strategy. The portfolio is rebalanced on a quarterly basis with an equal percentage of the portfolio being rebalanced on each trading day of the quarter.
8 Long/short volatility strategy short-term represents the returns of a portfolio containing 55 percent -1x SPVXSP and 45 percent 2x SPVXSP for the period December 2005-August 2011. The portfolio is rebalanced on a quarterly basis with an equal percentage of the portfolio being rebalanced on each trading day of the quarter.
Why subscribe to the
The Journal of Indexes Europe is the premier source for financial index research, news and data. Written by and for industry experts and financial practitioners, it is the book of record for the index industry. Browse content online at www.indexuniverse.com/JOI
TO SUBSCRIBE, VISIT:www.indexuniverse.com/JOI/subscriptions
Redefining Credit Risk
William Mast
Credit Derivatives Indexes
Gavan Nolan and Tobias Sproehnle
A Fixed-Income Roundtable
Ken Volpert, Jason Hsu, Waqas Samad, Larry Swedroe and more
The Impact of Bond Fund Flows
David Blanchett
Plus David Blitzer on bubbles, Jeremy Schwartz on dividends and buybacks, Francis Gupta on country
classifications and a biography on Bogle

NOT FDIC-INSURED • NOT BANK GUARANTEED • MAY LOSE VALUE
Guggenheim BulletShares® ETFsDefined-maturity exposure through portfolios
of investment-grade or high-yield corporate bonds
FOR MORE INFORMATION, CONTACT
GUGGENHEIM FUNDS AT 800-345-7999.
Consider the investment objectives, risks, charges and ongoing expenses of any ETF carefully before investing. The prospectus or summary prospectus, if available, contains this and other relevant information. Please read the prospectus carefully before investing. To obtain a prospectus, visit guggenheimfunds.com or contact a securities representative or Guggenheim Funds Distributors, Inc. 2455 Corporate West Drive, Lisle, IL 60532, 800-345-7999. Investors should consider the following risk factors and special considerations associated with investing in the Funds, which may cause you to lose money, including the entire
principal amount that you invest. Interest Rate Risk: As interest rates rise, the value of fi xed-income securities held by the Funds are likely to decrease. During the fi nal year of the
Funds’ operations, as the bonds held by the Funds mature and the Funds’ portfolio transitions to cash and cash equivalents, the Funds’ yield will generally tend to move toward
the yield of cash and cash equivalents and thus may be lower than the yields of the bonds previously held by the Funds and/or prevailing yields for bonds in the
market. In addition the Funds are subject to Credit/Default Risk, Asset Class Risk, Call Risk/Prepayment Risk, Extension Risk, Liquidity Risk, Fluctuation of Yield
and Liquidation Amount Risk, Non-Correlation Risk, Replication Management Risk, Issuer-Specifi c Changes, and Non-Diversifi ed Fund Risk. The Index provider
and its affi liates do not make any warranties or bear any liabilities with respect to Guggenheim Funds. BulletShares®, BulletShares® USD Corporate Bond Index,
and BulletShares® USD High Yield Corporate Bond Index are trademarks of Accretive Asset Management LLC and have been licensed for use by Guggenheim Funds
Investment Advisors, LLC. Guggenheim Funds Investment Advisors, LLC, an affi liate of Guggenheim Funds Distributors, Inc., serves as the investment adviser.
THE PRECISION OF BONDS. THE ADVANTAGES OF ETFs.
Scan with your
QR code readerNOT FDIC INSURED • NOT BANK GUARANTEED • MAY LOSE VALUE Member FINRA/SIPC 10/2011

News
November / December 201150
BlackRock To Use Own IndexesBlackRock Inc., parent of the
world’s largest ETF sponsor, iShares, filed paperwork in late August with the Securities and Exchange Commission to begin offering its own indexes, a potentially profound shift for a company that controls more than 40 percent of the $1 trillion U.S. exchange-traded market.
It’s still somewhat rare for ETF com-panies to provide indexes on their own ETFs, though it is done by firms includ-ing WisdomTree and Van Eck Global. To do so, greater regulatory disclosure is required in terms of index composi-tion. iShares said its request for exemp-tive relief was largely similar to that granted to the aforementioned firms.
BlackRock said in the filing that each of its indexes will be rules based and will comprise equity and/or fixed-income securities, including deposi-tary receipts and/or other assets.
If iShares chooses to segue to its own indexes on existing funds, the effects would reverberate widely in the U.S. ETF industry. After all, the firm now has almost $430 billion in ETF assets, according to data com-piled by IndexUniverse. It didn’t shed any light on its long-term inten-tions in the filing.
The company said in the filing that each BlackRock index will be “trans-parent.” It defined transparency as the methodology and the composi-tion of the benchmark being freely available to the public. It also said any change to the methodology will be announced at least 60 days prior to becoming effective; and any changes to constituents of and weightings of each index will be announced at least two days prior to the reconstitution and rebalance date.
It stressed in the filing that all such changes will be made freely available to the public.
MSCI Focuses On Enhanced BetaOutperforming the market has often
been associated with active manage-ment, but a growing number of alterna-tively weighted indexes are bringing to light the possibility that perhaps what has often been seen as alpha is in fact risk premia, or beta, and indexation might be the way to capture that added return, an MSCI study suggests.
Most of the alternatively weight-ed benchmarks take a broad view of the equity market by holding long-only exposure. But they then add a tilt toward a given factor to capture added risk premia. And it’s that equity risk premia—such as value, size or momentum—that can be the drivers of long-term portfolio performance, MSCI said in its research.
While institutional investors still focus on picking the right active manag-ers rather than the right combination of risk premia exposure when looking at how best to allocate assets, that may soon change, MSCI said. In anticipation of such a shift, MSCI has expanded its lineup of risk-premia strategies with the creation of another eight risk-weighted and three value-weighted indexes:r��.4$*�"$8*�*.*�3JTL�8FJHIUFE�*OEFY
r��.4$*�&NFSHJOH�.BSLFUT�*.*�3JTL�
Weighted Indexr��.4$*�8PSME�*.*�3JTL�8FJHIUFE�*OEFY
r��.4$*�&NFSHJOH�.BSLFUT�"TJB�3JTL�
Weighted Indexr��.4$*�&NFSHJOH�.BSLFUT�&.&"
Risk Weighted Indexr��.4$*�&NFSHJOH�.BSLFUT�-BUJO�
America Risk Weighted Indexr��.4$*�1BDJGJD�3JTL�8FJHIUFE�*OEFY
r��.4$*�8PSME�FY�6�4��3JTL Weighted Indexr��.4$*�"$8*�*.*�7BMVF
Weighted Indexr��.4$*�&NFSHJOH�.BSLFUT�*.*�7BMVF�
Weighted Indexr��.4$*�8PSME�*.*�7BMVF
Weighted Index
Six HOLDRS To Become Van Eck Sector ETFs
Van Eck Global filed paperwork with U.S. regulators in the third quar-ter to market six sector-specific ETFs UIBU� XPVME� SFQMBDF� .FSSJMM� -ZODI�T�
)0-%34��5FSNT�XFSFO�U�EJTDMPTFE�
Under an agreement, the ETFs now in registration will retain the correspond-JOH�)0-%34�� UJDLFST��5IF�TJY�)0-%34�
have a combined $3.65 billion in assets, or almost 90 percent of all assets in .FSSJMM�T����FYJTUJOH�)0-%3T�
-BVODIFE�JO�UIF����T �)0-%34�BSF�
narrowly focused portfolios that never changed. Van Eck said it expects both the exchange offer and the consum-mation of the transaction to occur in the fourth quarter.
The new ETFs will have expense ratios of 0.35 percent. They include:r��.BSLFU�7FDUPST�#JPUFDI�&5'
(NYSE Arca: BBH)r��.BSLFU�7FDUPST�.POFZ�$FOUFS�#BOL�
ETF (NYSE Arca: RKH) r��.BSLFU�7FDUPST�0JM�4FSWJDFT�&5'�
(NYSE Arca: OIH)r��.BSLFU�7FDUPST�1IBSNBDFVUJDBM�&5'�
/:4&�"SDB��11)
r��.BSLFU�7FDUPST�3FUBJM�&5' (NYSE Arca: RTH) r��.BSLFU�7FDUPST�4FNJDPOEVDUPS�&5'�
(NYSE Arca: SMH).FSSJMM� -ZODI� JT� FYQFDUFE� UP� EF�MJTU�
UIF� )0-%34� PODF� UIF� USBOTBDUJPO� JT�
completed, Van Eck said on its web-site. According to a prospectus supple-ment filed with the SEC, the remaining 11 funds will likely be shut down in the fourth quarter.
Case-Shiller Indexes Up In Q2U.S. home prices rose slightly in
the second quarter, staving off a fresh round of lows hinted at during the first three months of the year. 5IF�MBUFTU�4�1�$BTF�4IJMMFS�)PNF�
1SJDF�*OEFYFT�SFQPSU�TIPXFE�UIBU�UIF�
/BUJPOBM�)PNF�1SJDF�*OEFY �DPOTJTU-

www.journalofindexes.com November / December 2011 51
ing of all nine census divisions, rose
3.6 percent in the second quarter
after slumping more than 4 percent
in the first three months of the year.
But the strength, likely seasonal,
wasn’t enough to push home val-
ues above 2010 levels. The broadest
nationwide index was down nearly 6
percent on the year.
Housing was at the center of the
credit crisis that erupted in 2008, help-
ing send the U.S. economy into its
worst doldrums since the 1930s. After
topping in 2006, prices spiraled down
to bottom out in the spring of 2009,
and have since struggled to stage a
sustainable recovery, seen as key for
the economy’s overall health.
Although both the 10-City and
20-City composites posted gains in
June vs. May—marking the third con-
secutive month of positive readings,
with almost all cities surveyed seeing
a price uptick that month—the bigger
picture remains uncertain: All markets
surveyed, as well as both composites,
remain below levels seen a year ago,
some by as much as 10 percent.
The 10-City and 20-City Composites
each gained about 1 percent in June
from May levels, but they remained
3.8 percent and 4.5 percent lower on
the year, respectively. The report also
showed that nationally, home prices
are back to their early 2003 levels.
From a city perspective, none of the
20 cities surveyed posted losses in June.
Instead, 19 edged higher—many by
more than 1 percent—while Portland,
Ore., remained unchanged. And for a
dozen of them, June marked the third
consecutive month of recovery.
Still, on a year-over-year basis,
all 20 cities are in the red, with
Minneapolis the worst performer.
Home prices there are nearly 11 per-
cent below year-ago levels. Portland
and Phoenix also shed more than 9
percent in value in the last year.
FTSE Announces Classification Changes
In September, FTSE Group unveiled
the results of its annual country clas-
sification review. The index provider
has a four-tiered system that includes
categories for developed markets,
advanced emerging, secondary
emerging—which is less developed
than advanced emerging—and fron-
tier. The index provider conducts its
annual review every September.
The 2011 review saw a change in sta-
tus for two countries. Effective March
2012, Thailand’s status will be upgrad-
ed to advanced emerging from second-
ary emerging. Also, effective June 2012,
Ghana will be included in the FTSE
universe as a frontier market.
Colombia, which had been on
the watch list for a possible demo-
tion to frontier status since 2008,
was removed from the list as of the
September review. However, seven
countries remain on the list for pro-
motions or demotions.
Poland and Taiwan are both on
the list to be upgraded to developed
status, from advanced emerging sta-
tus. Meanwhile, Greece, given all its
recent problems, is on the list for the
exact opposite reason: It faces a pos-
sible downgrade from developed to
advanced emerging.
Kazakhstan and Ukraine are both
on the list for inclusion in the FTSE
universe as frontier markets if their
markets keep improving, while the
China A-shares market and Kuwait are
contenders for inclusion as secondary
emerging markets, skipping right over
the frontier market designation.
MSCI Debuts Overseas China Indexes
In September, MSCI launched a
new series of China-focused indexes
that include China-based companies
whose shares aren’t listed in China
and aren’t yet in any MSCI China
indexes, including firms such as
China’s Google, Baidu.
The MSCI Overseas China Indices
are designed to capture the investable
universe of Chinese securities out-
side Greater China, covering Chinese
securities listed on the NYSE Euronext
- New York, Nasdaq, New York AMEX
In September, MSCI launched a new series of China-focused indexes.

News
and the Singapore Exchange, MSCI said in a press release.
The new lineup is a departure from MSCI’s approach to China up to now, where the company’s existing index-es focused on securities listed on exchanges in Hong Kong, Shanghai and Shenzhen, and excluded those listed in New York or Singapore. Baidu tops the list of holdings of the MSCI Overseas China Index.
The new indexes cover more than 60 stocks, for a total market capi-talization of $68 billion, MSCI said. While listed outside of China, the companies in the new indexes are headquartered in China and generate most of their revenue or have most of their assets in that country.
The new indexes, combined with the existing MSCI China indexes, cre-ate 60 new benchmarks in total, the company said in the release.
For instance, the combination of the MSCI Overseas China Index with the existing MSCI China Index and the MSCI China A Index forms the new MSCI All China Index.
Large-, mid- and small-cap versions of the MSCI All China Index are also being made available, covering more than 2,100 names in a move that gives investors a comprehensive global rep-resentation of the China investable uni-verse, the company said in the release.
The indexes are reviewed quarterly.
Schwab Bond ETF Undercuts Competitors
Charles Schwab rolled out a broad-market U.S. bond ETF in July that’s cheaper than identical, and popu-lar, products from both iShares and Vanguard. The Schwab U.S. Aggregate Bond ETF (NYSE Arca: SCHZ) has an annual expense ratio of 0.10 percent, cheaper than any other broad U.S. fixed-income market product current-ly available. The competing funds and their expense ratios are:r��7BOHVBSE� 5PUBM� #POE� .BSLFU� &5'�
(NYSE Arca: BND), 0.11 percentr��J4IBSFT�"HHSFHBUF�#POE�'VOE�/:4&�
Arca: AGG), 0.22 percentr��41%3�#BSDMBZT�$BQJUBM�"HHSFHBUF�#POE�
ETF (NYSE Arca: LAG), 0.17 percentiShares’ AGG has about $12 billion
in assets, and Vanguard’s BND has more than $10.3 billion. LAG, from State Street Global Advisors, has just $267.3 million in assets, according to data compiled by IndexUniverse.
In response to the launch, iShares cut the expense ratio on AGG by 8.3 percent to its current price, but it still costs twice as much as BND. Nevertheless, the move indicates an upcoming price war in the space, and no matter the victor, bond ETF inves-tors will likely feel like winners.
INDEXING DEVELOPMENTSDow Jones Expands European Index Lineup
A September announcement detailed the launch of several new indexes from Dow Jones Indexes, each of which covers a slice of the European stock market. Six of the indexes are focused on dividend stocks, while two target real estate securities.
The Dow Jones Europe Select Dividend 30 Index and Dow Jones Eurozone Select Dividend 30 Index both use DJI’s standard Select Dividend methodology, which tracks the stocks paying out the highest divi-dend yields in the targeted market. However, the launch also includes four “Distributing” indexes, which combine the performance of the standard Select Dividend index with cash dividends paid by the compo-nents over the prior six-month peri-od. Twice a year, that cash distribu-tion is reset to zero, according to the methodology for the indexes.
The newly launched distributing indexes include: r��%PX�+POFT�&VSPQF�4FMFDU�%JWJEFOE�
30 Distributing Indexr��%PX�+POFT�&VSP[POF�4FMFDU�
Dividend 30 Distributing Indexr��%PX�+POFT�'SBODF�4FMFDU�%JWJEFOE�
20 Distributing Indexr��%PX�+POFT�(FSNBOZ�4FMFDU�
Dividend 20 Distributing IndexMeanwhile, the two remaining
indexes in the launch—the Dow Jones Europe Developed Markets Select
3FBM� &TUBUF� 4FDVSJUJFT� *OEFY� BOE� JUT�
subindex, the Dow Jones Europe %FWFMPQFE� .BSLFUT� 4FMFDU� 3&*5�
Index—are both designed to target securities with share prices that cor-relate strongly with real estate values, according to the press release.
S&P Debuts Global Luxury Index4�1� LJDLFE� PGG� 4FQUFNCFS� XJUI� UIF�
MBVODI�PG�UIF�4�1�(MPCBM�-VYVSZ�*OEFY��
The index covers 80 companies involved in the provision of luxury goods and services, according to the press release. The components are selected from specific subsectors of UIF�EFWFMPQFE�NBSLFU�JOEFYFT�JO�4�1�T�
Global BMI index family. Individual company weights are capped at 8 per-cent of the index during rebalances, the press release said.
There’s a certain amount of sub-jectivity to the index, as selection partially relies on a company’s “lux-VSZ�TUBUVT u�BDDPSEJOH�UP�BO�4�1�GBDU�
sheet. Among its largest companies are the likes of Daimler AG, Diageo 1MD � -7.)�.PFU� 7VJUUPO � /JLF� *OD� �
BMW and Hermes International.The index has already been licensed
to E Fund Management Co. Ltd., a Chinese asset management firm, to underlie an index fund that will be marketed to Chinese investors, the press release said.
Russell Launches More Investment Discipline Indexes*O�4FQUFNCFS �3VTTFMM�*OWFTUNFOUT�
said in a press release that it was add-ing to its family of investment disci-pline benchmarks, with the launch of four small-cap indexes.
The series is designed to capture popular investment management strategies, as determined by research DPOEVDUFE� CZ� 3VTTFMM� BOBMZTUT�� 5IF�
index family already included six large-cap strategy indexes derived GSPN�UIF�3VTTFMM������*OEFY��
The four new indexes are derived GSPN� UIF� 3VTTFMM� ����� *OEFY � XIJDI�
FODPNQBTTFT�UIF�TNBMMFTU�� ����TUPDLT�
JO� UIF� CSPBE� 3VTTFMM� ����� *OEFY
essentially the small- and mid-cap seg-
November / December 201152

What’s Your Exposure to the World’s Newest and Most Exciting Stocks?
A Q&A With Renaissance Capital Principal and Founder, Kathleen Shelton Smith
Early IPO Inclusion
What is the IPO Inclusion policy for your benchmark index? It typically takes up to a quarter or longer for most indices to include IPOs, causing many investors to miss out on early IPO
performance. The FTSE Renaissance Global IPO Index adds IPOs at the end of the first trading day, allowing investors to access the
early returns of these unseasoned equities.
Pure IPO Exposure
What is the weight of IPOs in your benchmark index? Once IPOs are included in major indices they are typically underweighted, resulting in little or no contribution to overall performance.
The FTSE Renaissance Global IPO Index Series is composed of a rolling two year population of IPOs, giving investors pure exposure to
the activity and performance of the world’s newest and most exciting stocks, which make their debut in the IPO market.
Global IPO Coverage
What type of geographical coverage does the FTSE Renaissance Global IPO Index Series offer?The index series includes all institutionally-investable IPOs in developed and emerging markets of operating companies that list with
an initial investable market capitalization of at least USD 100 million. Global, regional, country-level and industry-level IPO Indices are
available for license and as the basis for tradable products.
Index Design
What is unique about the index design?Jointly developed by IPO research and investment firm Renaissance Capital and leading global index provider FTSE Group, the FTSE
Renaissance Global IPO Index Series follows a methodology designed specifically to capture the essence of the global IPO market.
Qualified IPOs are added to the index series at the end of their first trading day and removed from the index series after approximately
two years, at which point they are considered “seasoned equities”. The index reflects the true investability of its constituents by using
a free float-adjusted weighting approach.
For further information, please visit www.ftse.com/ipo“FTSE®” is a trademark of the London Stock Exchange Plc and The Financial Times Limited and is used by FTSE International Limited (“FTSE”) under licence. Every effort is made to ensure that all information given in thispublication is accurate, but no responsibility or liability can be accepted by FTSE or its licensors for any errors or for any loss from use of this publication. Neither FTSE nor any of its licensors makes any claim, prediction,warranty or representation whatsoever, expressly or impliedly, either as to the results to be obtained from the use of the FTSE Infrastructure Index Series or the fitness or suitability of the Index for any particular purpose towhich it might be put. No part of this information may be reproduced, stored in a retrieval system or transmitted in any form or by any means, electronic, mechanical, photocopying, recording or otherwise, without priorwritten permission of FTSE. Distribution of FTSE Index values and the use of FTSE Indices to create financial products requires a licence with FTSE and/or its licensors.
ADVERTISEMENT – SPONSORED BY FTSE INTERNATIONAL LIMITED (“FTSE”)
FTSE Renaissance Global IPO Index FTSE All World Index
-60%
-40%
-20%
0%
20%
40%
60%
80%
Dec-2
005
Jun-
2007
Jun-
2008
Jun-
2006
Jun-
2009
Dec-2
010
Dec-2
006
Dec-2
007
Dec-2
008
Aug-2
011
Dec-2
009
Jun-
2010
FTSE Renaissance Global IPO Index Series

News
ments. The new benchmarks include the Russell U.S. Small Cap Aggressive Growth Index, Russell U.S. Small Cap Consistent Growth Index, Russell U.S. Small Cap Low P/E Index and Russell U.S. Small Cap Contrarian Index, the press release said.
S&P Debuts Macro- Focused Futures Index
In August, S&P announced the launch of the S&P Systematic Global Macro Index, which takes long or short positions in futures contracts drawn from six sectors.
The index’s methodology was devel-oped by Thayer Brook Partners LLP and is designed to capture the perfor-mance of global macro and managed futures strategies, a press release said. Positions in each component contract are determined by regressions of each contract’s historical returns, according to an S&P fact sheet.
At its launch, the index included 10 commodities contracts, six energy con-tracts, six fixed-income contracts, six currency contracts, six stock index con-tracts and three contracts tied to short-term interest rates, the fact sheet said.
S&P Rolls Out New EM IndexAugust saw the debut of the S&P
Next Emerging 40 Index. The new benchmark covers emerging markets excluding the four BRIC countries
(Brazil, Russia, India and China), in addition to South Korea and Taiwan.
According to an S&P fact sheet, at inception the index included com-ponents from Chile, Czech Republic, Hungary, Indonesia, Malaysia, Mexico, Peru, Poland, South Africa and Turkey, but can also select constituents from Egypt, Morocco, the Philippines and Thailand. The components repre-sent the largest stocks based on float-adjusted market capitalization from the S&P/IFCI indexes for each of the 16 eligible countries; country weights are capped at 25 percent of the index, with no country allowed to have more than 10 stocks in the index.
S&P said in a related press release that the index was created for investors looking to invest in smaller emerging markets undergoing rapid expansion.
Nasdaq Adds To Water IndexesThe Nasdaq OMX Group launched
two indexes in late July that focus on the water industry.
Nasdaq already offered the Nasdaq Water Index under its family of “green” strategies. The two new indexes—the Nasdaq OMX Global Water Index and the Nasdaq OMX US Water Index—pick companies from the same universe as their predecessor index, but have differ-ent weighting methodologies that factor in liquidity to determine the weightings of each component, the company said.
The lineup is designed to track companies that create products to conserve and purify water for domes-tic, commercial and industrial use. Price and total return versions are available for each index.
Tightening water supplies is a glob-al issue as world population continues to grow, and its demand for water increasingly puts a strain on the water supply chain. Companies involved with the production and service of water sit at the forefront of the issue.
New Version Of DJ- UBSCI Fights Contango
Dow Jones Indexes unveiled its Dow Jones-UBS Roll Select Commodity Index in August, which relies on a modified version of the DJ-UBS Commodity Index methodology.
According to the press release, rather than rolling into the next contract to expire for each commodity, as the stan-dard DJ-UBSCI does, the new index rolls into the contract displaying the least contango. Eligible contracts must expire within nine months of the roll date.
Contango is a recurring problem for investors in the commodities mar-kets, and the new index is designed to minimize its impact.
Other than the enhanced “roll” feature, the new index is constructed and calculated the same way as the DJ-UBSCI, the press release said. Like the original index, it covers 19 commodity futures contracts rang-ing from gold and aluminum to cof-fee and soybeans.
Stoxx Announces Rule ChangesIn an August press release, Stoxx
announced a number of rule chang-es it says are designed to accommo-date the increasingly fast-moving and volatile markets, and to enhance the liquidity of the index baskets.
The fast entry rule for regional blue-chip indexes became effec-tive immediately and allows stocks ranked in the “lower buffer” category fast entry into the appropriate index-es. Fast entry was previously only applicable for IPO companies.
November / December 201154
August saw the debut of the S&P Next Emerging 40 Index.

The second rule sets the minimum liquidity requirement for the compo-nents in Stoxx’s benchmark indexes, such as the Stoxx Europe 600 Index, at an average three-month daily trad-ing volume of €1 million. The rule will become effective at the time of the Q4 2011 benchmark index review.
Finally, the components of the regional Stoxx blue-chip indices are now selected on the basis of current free-float data, in contrast to the previ-ous system of using free-float data that was up to three months old.
BarCap Launches Fiscal Strength Indexes
Barclays Capital has launched a new suite of benchmark indexes that weight government bond markets using fundamental measures of fis-cal sustainability.
The Barclays Capital Fiscal Strength Weighted Bond Index family has been formulated as a result of investors’ increasing scrutiny of sovereign risk.
The new indexes use publicly avail-able macroeconomic and governance data to adjust the country weights within Barclays Capital’s exist-ing market-capitalization-weighted benchmarks. Countries are scored by financial solvency, external financing and institutional strength. Those with high scores will have their allocations increased, while exposure to those with lower scores will be reduced.
There are three indexes in the new suite: the Barclays Capital Global Treasury Fiscal Strength Weighted Index, the Barclays Capital Global Treasury Universal Fiscal Strength Weighted Index and the Barclays Capital Euro Treasury Fiscal Strength Weighted Index.
New Volatility Indexes From Dow Jones
Dow Jones has launched three new index series offering exposure to equity markets with a predetermined level of market volatility. The indexes achieve this objective by switching dynamically between the underlying equity market exposure and a cash component.
The volatility indexes are based on
existing Dow Jones benchmarks offer-ing exposure to European (Europe Titans 80), eurozone (Eurozone Titans 80) and BRIC (BRIC 50) equities.
For each index series, Dow Jones will offer individual indexes target-ing volatility levels of 5 percent, 10 percent, 15 percent and 20 percent. If the underlying equity index’s 30-day realized volatility is higher than the target, the allocation to equities will be reduced until the target volatility is achieved, with the remaining por-tion of the portfolio allocated to cash and accruing interest at the EONIA (euro overnight index average) rate. If the underlying equity index’s vola-tility is below target, leverage of up to 150 percent may be applied so as to reach the target volatility.
Citi Focuses On Market VolatilityCitigroup’s new unit, Citi Investment
Strategies (CIS), which develops quan-titative investment strategies, recently unveiled its first product: a series of volatility balanced beta strategies.
The Citi Volatility Balanced Beta (Citi VIBE) strategies adopt a risk-weighting approach in order to give investors index beta exposure. The approach is designed to be applicable to different asset classes and is avail-able through five regional indexes.
A Citigroup spokesman said that indexes will be used to underlie notes, swaps and funds.
Stoxx Launches Rare Earth IndexStoxx has announced the launch of
a rare earth index designed to capi-talize on the growing importance of metals used in high-tech products such as mobile phones.
The Stoxx Global Rare Earth Index was developed to underlie ETFs and includes companies that generate at least 30 percent of their revenues from the rare earth sector globally, either via exploration, extraction, transport, pro-cessing or any other business involving any of the rare earth elements.
There are 17 rare earth metals, all found in the Earth’s crust, and they are used in technology such as hard
drives, lasers and electric car batteries. Despite their name, rare earth metals are actually more abundant than pre-cious metals such as gold and plati-num. However, they are rarely found in high concentration in a single reserve.
The index has 14 component com-panies at present, and is weighted by free-float-adjusted market capitaliza-tion. It is rebalanced quarterly.
S&P Rolls Out Emerging Asia Index
In late July, S&P announced the rollout of the S&P Emerging Asia 40 Index, a blue-chip benchmark designed for diversification.
According to the press release, the index selects the 10 largest stocks from China and India each; however, the components must be listed on the Hong Kong Stock Exchange, the London Stock Exchange, the NYSE or Nasdaq. The remaining 20 components are selected based on market capitalization from Indonesia, Malaysia, the Philippines and Thailand and can be listed on either the aforementioned exchanges or locally. China and India are capped at a combined weight of 50 percent of the index, the press release said.
Prior to its official launch, China was the largest country in the index, at 35.6 percent, followed by Malaysia at 21.5 percent, Indonesia at 20.8 percent, India at 12.7 percent and Thailand at 9.4 percent according to an S&P fact sheet.
Hang Seng Indexes Debuts New Indexes
In late August, Hang Seng Indexes Co. Ltd. said in a press release that it had launched two new indexes target-ing foreign companies listed on the Hong Kong Stock Exchange.
The Hang Seng Foreign Com-panies Composite Index (HSFCCI) tracks foreign companies listed on the HKSE and Hong Kong depositary receipts (HDRs) for foreign compa-nies that have market capitalizations of at least HKD3.0 billion, according to the press release. It had 15 com-ponents as of late September.
www.journalofindexes.com November / December 2011 55

News
56 November / December 2011
Meanwhile, the Hang Seng Global Composite Index (HSGCI) simply combines the components of the HSFCCI and the Hang Seng Composite Index, the press release said. The Hang Seng Composite Index covers the largest 95 percent of the stocks that have their primary listing on the HKSE, according to the exchange’s website. The HSGCI had 401 holdings in late September.
BarCap Details Effects Of Downgrade
After S&P’s ratings arm downgrad-ed the debt rating of the United States from AAA to AA+ in August, Barclays Capital announced that there would be no changes to the inclusion of U.S. government debt in its indexes.
In a statement, the company said that eligibility and classification for investment-grade indexes is based on the “middle” rating from three ratings firms: Standard & Poor’s, Moody’s and Fitch. Since Moody’s and Fitch still consider U.S. government debt to be top tier, there is no real effect on the U.S.’ rating for Barclays’ pur-poses. Moreover, Barclays places AA+ ratings firmly in the investment-grade category, so the lowered rating will only become an issue if there are further downgrades.
Barclays said that it would moni-tor ratings developments on an ongoing basis.
Fitch Unveils CDS IndexesIn early September, Fitch Solutions
announced that it had launched a com-prehensive global family of credit deriva-tive swap indexes. The company already had an existing family of CDS indexes, but unlike the new family, it was based on fixed numbers of components.
Fitch selects the components for its new index family based on liquidity, cov-ering the leading 75 percent of eligible components in its universe; the bench-marks themselves are equal weighted and track changes in the spreads on a daily basis, the press release said.
The available subindexes include 15 regional sovereign indexes as well as 40 corporate indexes covering indus-try groups that can be broken down into a further 70 subsectors, accord-ing to the press release. Customized indexes targeting countries and sub-ordination levels are also available.
AROUND THE WORLD OF ETFsProShares Unveils Hedge Fund ETF
ProShares, in July, launched an ETF with a hedge fund replication strat-egy, the latest product to give retail investors access to parts of the market previously only available to so-called accredited investors.
The ProShares Hedge Replication ETF (NYSE Arca: HDG) has an annu-al expense ratio of 0.95 percent. The fund strives for a high correlation with hedge fund beta by tracking an index based on the Merrill Lynch Factor Model – Exchange Series.
HDG will compete with ETFs like Index IQ’s Hedge Multi-Strategy Tracker ETF (NYSE Arca: QAI), the pioneer in the space. QAI costs 1.13 percent in total operating expenses.
HDG’s underlying index targets a high correlation to the HFRI Fund Weighted Composite Index, an equal-ly weighted benchmark consisting of more than 2,000 hedge funds, the company said on its website.
iShares Rolls Out Emerging Markets Small-Cap ETF
iShares launched a broad emerg-ing markets equities ETF in August focused on small-cap companies. The iShares Emerging Markets Small Cap Index Fund (NYSE Arca: EEMS), costing 0.69 percent, will go head-to-head with the SPDR S&P Emerging Markets Small Cap ETF (NYSE Arca: EWX), which costs 0.65 percent.
While EEMS will track an MSCI benchmark that tracks companies with market capitalization under $3 billion in 21 emerging markets, EWX is linked to an S&P index comprising the under-$2-billion-in-market-cap names.
EEMS allocates nearly 20 percent of its basket to Taiwan names, with South Korea and Hong Kong also at the top. By contrast, EWX allocates 32 percent of its portfolio to Taiwan, with China, South Africa and India round-ing off its top country holdings.
New iPath ETN Debuts Dynamic Volatility Play
Barclays Bank added to its iPath roster of volatility-linked ETNs with the launch of its first dynamic volatility strategy, designed as a tool for investors to benefit from volatility spikes while managing the roll cost during calm markets.
The iPath S&P 500 Dynamic VIX ETN (NYSE Arca: XVZ) is designed to give exposure to the S&P 500 Dynamic VIX Futures TR Index, which allocates between the S&P 500 Short-Term Futures Index Excess Return and the S&P 500 VIX Mid-Term Futures Index Excess Return by monitoring the steep-ness of the implied volatility curve. XVZ comes with a yearly fee of 0.95 percent.
DB Buys Back 3 Elements ETNs Germany-based Deutsche Bank
bought back three Elements ETNs that carry investing legend Benjamin Graham’s name. It didn’t cite a rea-son, but the three ETNs have gath-ered few assets.
The three ETNs were:r��&MFNFOUT�#FOKBNJO�(SBIBN�5PUBM�
Market Value Index-Total Return ETN (NYSE Arca: BVT)

www.journalofindexes.com 57November / December 2011
r��&MFNFOUT�#FOKBNJO�(SBIBN�-BSHF�
$BQ�7BMVF�*OEFY�5PUBM�3FUVSO�&5/�
/:4&�"SDB��#7-
r��&MFNFOUT�#FOKBNJO�(SBIBN�4NBMM�
$BQ�7BMVF�*OEFY�5PUBM�3FUVSO�&5/�
/:4&�"SDB��#4$
)PMEFST� PG� UIF� &5/T� SFDFJWFE� B�
DBTI�QBZNFOU�PO�"VH�����FRVBM�UP�UIF�
EBJMZ� SFQVSDIBTF� WBMVF� PO� "VH�� �� �
%FVUTDIF� TBJE� JO� B� QSFTT� SFMFBTF�� 5IF�
DPNQBOZ �XIJDI�BMSFBEZ�VTFT� *OWFTDP�
1PXFS4IBSFT� UP� NBSLFU� B� GBNJMZ� PG�
&5'T�BOE�&5/T�JU�TQPOTPST�JO�UIF�6�4� �
BMTP�CFHBO�UP�SPMM�PVU�JUT�WFSZ�PXO�&5'T�
VOEFS�UIF�%#9�CSBOE�FBSMJFS�UIJT�ZFBS�
Van Eck Debuts Mortgage REIT ETF 7BO�&DL�(MPCBM� MBVODIFE� B�NPSU�
HBHF�3&*5�&5'� UIBU� GPDVTFT�PO�DPN�
QBOJFT�JOWPMWFE�XJUI�UIF�QVSDIBTF�PS�
TFSWJDF�PG�DPNNFSDJBM�BOE�SFTJEFOUJBM�
NPSUHBHF�MPBOT�
5IF�.BSLFU�7FDUPST�.PSUHBHF�3&*5�
*ODPNF�&5'�/:4&�"SDB��.035�XJMM�
USBDL� 7BO� &DL�T� QSPQSJFUBSZ� .BSLFU�
7FDUPST�(MPCBM�.PSUHBHF�3&*5T�*OEFY �
B� SVMFT�CBTFE � DBQJUBMJ[BUJPO�XFJHIU�
FE�CFODINBSL�DPNQSJTJOH�DPNQBOJFT�
UIBU�EFSJWF�BU�MFBTU����QFSDFOU�PG�UIFJS�
SFWFOVF�GSPN�NPSUHBHF�3&*5T��*UT�OFU�
FYQFOTF�SBUJP�JT������QFSDFOU�
5IF�FOUJSF����TUPDL�QPSUGPMJP� JT�BMMP�
DBUFE� UP� 3&*5T� GPDVTFE� PO� SFTJEFO�
UJBM� BOE� DPNNFSDJBM� NPSUHBHFT � CVU�
FYDMVEFT� NPSUHBHF� GJOBODF� DPNQBOJFT�
BOE�TBWJOH�BDDPVOUT �UIF�DPNQBOZ�TBJE�
BACK TO THE FUTURESCME Sees Record Volumes In August"VHVTU�SFQSFTFOUFE�B�SFDPSE�NPOUI�
GPS�UIF�$.&�(SPVQ �XJUI�B�ZFBS�PWFS�
ZFBS� ��� QFSDFOU� JODSFBTF� JO� BWFSBHF�
EBJMZ� WPMVNF�� *O� BMM � UIF� DPNQBOZ�T�
FYDIBOHFT� USBEFE� ���� NJMMJPO� DPO�
USBDUT � PS� BO� BWFSBHF� PG� ����� NJMMJPO�
DPOUSBDUT�QFS�EBZ�
&RVJUZ�JOEFY�DPOUSBDUT�TBX�UIF�NPTU�
JNQSPWFNFOU � XJUI� BO� ��� QFSDFOU�
KVNQ� JO� ZFBS�PWFS�ZFBS� BWFSBHF� EBJMZ�
WPMVNF�� *OUFSFTU� SBUF� DPOUSBDUT� IBE� B�
IJHIFS�BWFSBHF�EBJMZ�WPMVNF �CVU�UIFJS�
WPMVNF�XBT�VQ�POMZ����QFSDFOU�
"NPOH� UIF� JOEFY� GVUVSFT� DPOUSBDUT �
UIF� F�NJOJ� 4�1� ���� DPOUSBDU� SFNBJOFE�
CZ� GBS� UIF� NPTU� BDUJWFMZ� USBEFE � XJUI� B�
NPOUIMZ�WPMVNF�PG�NPSF�UIBO����NJMMJPO�
DPOUSBDUT � VQ����QFSDFOU� GSPN� UIF�QSJPS�
ZFBS��5IF�OFYU�NPTU�BDUJWFMZ�USBEFE�JOEFY�
GVUVSFT�DPOUSBDUT �UIF�F�NJOJ�/BTEBR�����
DPOUSBDU�BOE�UIF�NJOJ����%PX�DPOUSBDU �
CZ�DPNQBSJTPO �TBX�UIFJS�WPMVNFT�SJTF�CZ�
�����BOE������QFSDFOU �SFTQFDUJWFMZ�
NYSE Euronext Launches Commodity Futures Indexes*O�+VMZ �UIF�/:4&�&VSPOFYU�EFCVUFE�
DPNNPEJUZ�JOEFYFT�EFTJHOFE�UP�USBDL�
UIF�NPTU�BDUJWF�/:4&�-JGGF�GVUVSFT�DPO�
USBDUT�PO�XIFBU�BOE�DPDPB �BDDPSEJOH�
UP�B�TUBUFNFOU�CZ�UIF�FYDIBOHF�
5IF� /:4&� -JGGF� .JMMJOH� 8IFBU�
$PNNPEJUZ�*OEFY�BOE�UIF�/:4&�-JGGF�
$PDPB�$PNNPEJUZ�*OEFY�FBDI�SPMM�JOUP�
UIF� DPOUSBDU� XJUI� UIF� IJHIFTU� PQFO�
JOUFSFTU� BT� UIF� DVSSFOU� DPOUSBDU� UIFZ�
BSF�IPMEJOH�OFBST� JUT�FYQJSZ�EBUF��5IF�
OFX�DPOUSBDU�JT�BMTP�IFME�VOUJM�JU�OFBST�
JUT� FYQJSZ� EBUF � BOE� UIF� SPMM� QSPDFTT�
CFHJOT�BMM�PWFS�BHBJO�
5IF� QSFTT� SFMFBTF� TBJE� UIBU� FYDFTT�
SFUVSO�BOE�UPUBM�SFUVSO�WFSTJPOT�XPVME�
CF�DBMDVMBUFE�GPS�FBDI�JOEFY�
KNOW YOUR OPTIONSCBOE Launches SPXpm In October$#0&�)PMEJOHT�TBJE�JO�4FQUFNCFS�
UIBU� JU� IBE� SFDFJWFE� BQQSPWBM� UP�
MBVODI� iQNu� TFUUMFNFOU� PQUJPOT� PO�
UIF�4�1������
5IF�OFX�DPOUSBDUT�BSF�WFSZ�TJNJMBS�
UP�UIF�TUBOEBSE�4�1�����PQUJPOT�DPO�
USBDUT�� MJLF� UIPTF� DPOUSBDUT � UIF� OFX�
419QN� DPOUSBDUT�XJMM� CF� DBTI� TFUUMFE�
BOE� VTF� &VSPQFBO�TUZMF� FYFSDJTF��
)PXFWFS � SBUIFS� UIBO� CFJOH� TFUUMFE�
CBTFE�PO�UIF�PQFOJOH�WBMVF�PG�UIF�4�1�
���� PO� UIF� EBZ� CFGPSF� UIF� FYQJSBUJPO�
EBUF � BT� UIF� 419� DPOUSBDUT� BSF � UIF�
419QN�DPOUSBDUT�XJMM�CF�TFUUMFE�VTJOH�
UIF�4�1�����T�DMPTF�PO�UIBU�EBZ��
$#0&�)PMEJOHT� TBJE� UIF� DPOUSBDUT�
XPVME�CFHJO�USBEJOH�PO�JUT�$��0QUJPOT�
&YDIBOHF�PO�0DU����
CBOE Reports August Volumes"T�XJUI�UIF�$.&�(SPVQ �"VHVTU�XBT�
B�HSFBU�NPOUI�GPS�$#0&�)PMEJOHT��5IF�
DPNQBOZ�T�NBJO�FYDIBOHF �UIF�$IJDBHP�
#PBSE�0QUJPOT�&YDIBOHF �SBDLFE�VQ�UIF�
IJHIFTU�NPOUIMZ�WPMVNF�JO�JUT�IJTUPSZ�BU�
����NJMMJPO�DPOUSBDUT��5IBU�T�BO�BWFSBHF�
EBJMZ�WPMVNF�PG�����NJMMJPO�DPOUSBDUT �VQ�
���QFSDFOU�GSPN�UIF�QSJPS�ZFBS��
.VDI�PG�UIBU�JODSFBTF�DBO�CF�BUUSJC�
VUFE� UP� JODSFBTFE� WPMVNFT� GPS� JOEFY�
BOE� &5'� PQUJPOT�� 8IJMF� UIF� "%7� GPS�
FRVJUZ�PQUJPOT�XBT�VQ����QFSDFOU �UIF�
"%7T�GPS�JOEFY�BOE�&5'�PQUJPOT�XFSF�
VQ�����BOE�����QFSDFOU �SFTQFDUJWFMZ�
5IF� UPQ�DPOUSBDUT� JO� UFSNT�PG� WPM�
VNF� JO� "VHVTU� XFSF� UIF� GVUVSFT� PO�
UIF� 4�1� ���� *OEFY � UIF� 41%3� 4�1�
����&5'�/:4&�"SDB��41: �UIF�$#0&�
7PMBUJMJUZ� *OEFY� 7*9 � UIF� J4IBSFT�
3VTTFMM������*OEFY�'VOE�/:4&�"SDB��
*8.� BOE� UIF� 1PXFS4IBSFT� 222�
5SVTU�/BTEBR��222�
FROM THE EXCHANGESObstacles Remain For Exchange Merger5IF�QSPQPTFE�NFSHFS� PG�%FVUTDIF�
#ÕSTF� "(� BOE� /:4&� &VSPOFYU� IBT�
CFFO�BQQSPWFE�CZ�(FSNBOZ�T�'FEFSBM�
'JOBODJBM� 4VQFSWJTPSZ� "VUIPSJUZ�
#B'JO��5IF�BQQSPWBM�GPMMPXT�UIF�DPN�
QMFUJPO� JO� "VHVTU� PG� UIF� $PNNJUUFF�
PO� 'PSFJHO� *OWFTUNFOU� JO� UIF�6OJUFE�
4UBUFT� $'*64� SFWJFX � XIJDI� GPVOE�
OP�PCKFDUJPO�UP�UIF�NFSHFS��
5IF� SPBE� UP� UIF� EFBM� CFJOH� GVMMZ�
BQQSPWFE�JT�OPU�FOUJSFMZ�TUSBJHIUGPSXBSE �
IPXFWFS��'PMMPXJOH�BO�JOJUJBM�JOWFTUJHB�
UJPO � UIF� &VSPQFBO� $PNNJTTJPO� &$�
IBT� JOJUJBUFE� B� NPSF� EFUBJMFE� JOWFT�
UJHBUJPO� PG� UIF� EFBM � XIJDI� JT� TFU� UP�
DPODMVEF� PO� %FD�� �� � ������ $PODFSOT�
SFNBJO� BCPVU� UIF� NFSHFS�T� FGGFDU� PO�
DPNQFUJUJPO�BOE�NBSLFU�FGGJDJFODZ�
"� QSFTT� SFMFBTF� JTTVFE� CZ� UIF� UXP�
FYDIBOHFT�DPNNFOUT��i5IF�&VSPQFBO�
$PNNJTTJPO�T�EFDJTJPO�UP�PQFO�BO�JO�
EFQUI�JOWFTUJHBUJPO�XBT�GVMMZ�BOUJDJQBU�
FE�� ����5IF�$PNQBOJFT�IBWF�IBE�PQFO�
BOE� DPOTUSVDUJWF� EJTDVTTJPOT� XJUI�
&VSPQFBO�$PNNJTTJPO� TUBGG� UISPVHI�
PVU � BOE� MPPL� GPSXBSE� UP� DPOUJOVJOH�
UP� XPSL� DMPTFMZ� XJUI� UIF� &VSPQFBO�
$PNNJTTJPO�UP�PCUBJO�DMFBSBODF�GPS�B�
USBOTBDUJPO� UIBU�XJMM�EFMJWFS� BO�FYUSB�
PSEJOBSJMZ� CSPBE� SBOHF� PG� CFOFGJUT� UP�
&VSPQFBO�NBSLFU�QBSUJDJQBOUT�u
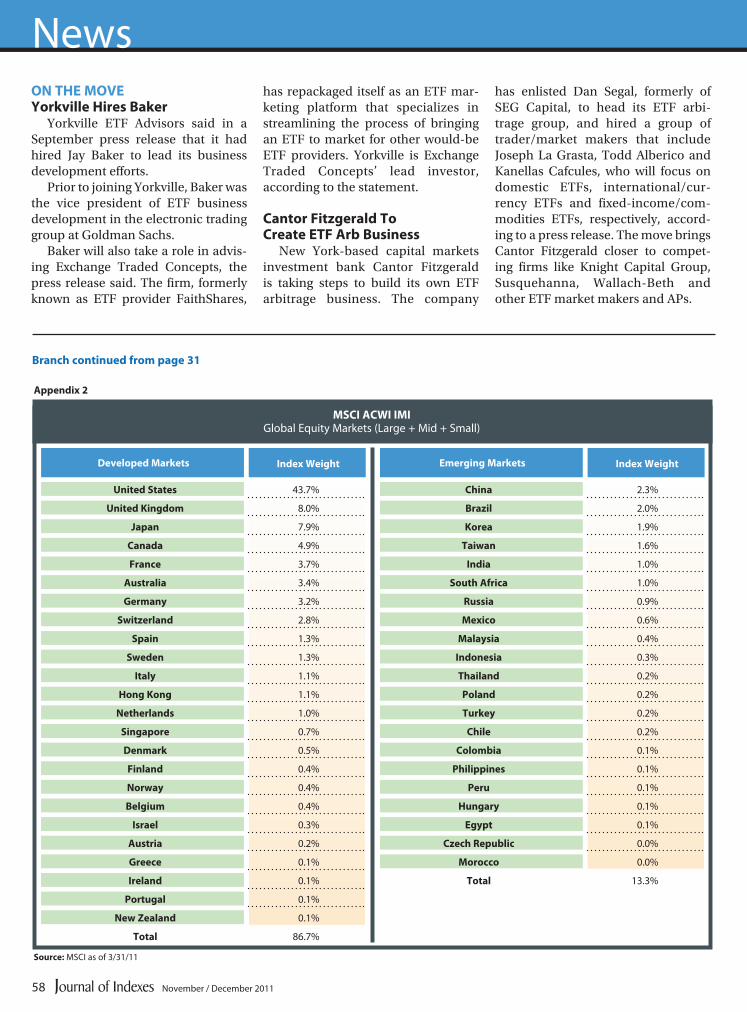
ON THE MOVEYorkville Hires Baker
Yorkville ETF Advisors said in a
September press release that it had
hired Jay Baker to lead its business
development efforts.
Prior to joining Yorkville, Baker was
the vice president of ETF business
development in the electronic trading
group at Goldman Sachs.
Baker will also take a role in advis-
ing Exchange Traded Concepts, the
press release said. The firm, formerly
known as ETF provider FaithShares,
has repackaged itself as an ETF mar-
keting platform that specializes in
streamlining the process of bringing
an ETF to market for other would-be
ETF providers. Yorkville is Exchange
Traded Concepts’ lead investor,
according to the statement.
Cantor Fitzgerald To Create ETF Arb Business
New York-based capital markets
investment bank Cantor Fitzgerald
is taking steps to build its own ETF
arbitrage business. The company
has enlisted Dan Segal, formerly of
SEG Capital, to head its ETF arbi-
trage group, and hired a group of
trader/market makers that include
Joseph La Grasta, Todd Alberico and
Kanellas Cafcules, who will focus on
domestic ETFs, international/cur-
rency ETFs and fixed-income/com-
modities ETFs, respectively, accord-
ing to a press release. The move brings
Cantor Fitzgerald closer to compet-
ing firms like Knight Capital Group,
Susquehanna, Wallach-Beth and
other ETF market makers and APs.
News
58 November / December 2011
Branch continued from page 31
Developed Markets Index Weight
United States 43.7%
United Kingdom 8.0%
Japan 7.9%
Canada 4.9%
France 3.7%
Australia 3.4%
Germany 3.2%
Switzerland 2.8%
Spain 1.3%
Sweden 1.3%
Italy 1.1%
Hong Kong 1.1%
Netherlands 1.0%
Singapore 0.7%
Denmark 0.5%
Finland 0.4%
Norway 0.4%
Belgium 0.4%
Israel 0.3%
Austria 0.2%
Greece 0.1%
Ireland 0.1%
Portugal 0.1%
New Zealand 0.1%
Total 86.7%
MSCI ACWI IMIGlobal Equity Markets (Large + Mid + Small)
Source: MSCI as of 3/31/11
Appendix 2
Emerging Markets Index Weight
China 2.3%
Brazil 2.0%
Korea 1.9%
Taiwan 1.6%
India 1.0%
South Africa 1.0%
Russia 0.9%
Mexico 0.6%
Malaysia 0.4%
Indonesia 0.3%
Thailand 0.2%
Poland 0.2%
Turkey 0.2%
Chile 0.2%
Colombia 0.1%
Philippines 0.1%
Peru 0.1%
Hungary 0.1%
Egypt 0.1%
Czech Republic 0.0%
Morocco 0.0%
Total 13.3%

Global Index Data
November / December 2011www.journalofindexes.com 59

November / December 2011
Index Funds
60

Source: Morningstar. Data as of 2/29/08
November / December 2011www.journalofindexes.com
Morningstar U.S. Style Overview Jan. 1 - Aug. 31, 2011
61
Source: Morningstar. Data as of Aug. 31, 2011

November / December 201162
Dow Jones U.S. Industry Review

November / December 2011www.journalofindexes.com 63
Exchange-Traded Funds Corner

Test Your Skills
November / December 201164
Modern Portfolio Theory
ACROSS
1. Enron’s home state 5. _____-Frank reform 8. It replaced the lira
and franc 9. Giant broker/dealer
(abbr.)11. Basic risk technique
of MPT14. 24-hr. shopping
network15. Trump’s
“Art of the ___”16. Gordon from
“Wall Street”17. Like Nasdaq stocks
(abbr.)19. One of three inputs to
many MPT algorithms21. IBM − “Big ___”23. Microsoft’s online
encyclopedia25. Certain bonds’
coupon rate27. “________ variance,”
measure of downside volatility
28. Examples: currency, credit, liquidity, market
31. Former Intel leader Grove
32. Claim against property
33. Word in many inter-national index names
34. Nobel prize- cowinning contributor to MPT
How much do you
know about MPT?
By Bruce Greig
DOWN
2, Common asset class 3. Investment strategy to
achieve 11-Across (2 words)
4. Giant food company bought by Philip Morris
6. Standard ____, risk measure used in MPT
7. Gold, silver, tin and copper
9. Fidelity’s star manager Peter
10. Nobel prize-cowinning contributor to MPT
12. Stock market regulatory agency (abbr.)
13. Swedish furniture retailer18. Condition due to panic
selling20. Gain on an investment21. Common asset class22. Cost of doing business24. Bid/__ spread26. Common office
communications29. Order to a broker30. Product of beverage
company (NYSE:PEP)
Solution
ACROSS: 1. Texas; 5. Dodd; 8. Euro; 9. LPL; 11. Diversification; 14. HSN; 15. Deal; 16. Gekko; 17. OTC;
19. Correlation; 21. Blue; 23. Encarta; 25. Zero; 27. Semi; 28. Risks; 31. Andy; 32. Lien; 33. Global; 34. Sharpe
DOWN: 2. Equities; 3. Asset Allocation; 4. Kraft; 6. Deviation; 7. Elements; 9. Lynch; 10. Markowitz; 12. SEC;
13. Ikea; 18. Oversold; 20. Return; 21. Bonds; 22. Expense; 24. Ask; 26. Emails; 29. Sell; 30. Sobe

Research Affi liates
Fundamental Index
In 2005, Research Affi liates introduced the Fundamental Index®
approach, revolutionizing the way people invest. It offers the
alpha potential of top-performing active managers in a low cost,
rules-based, transparent format.
This information is not intended as an offer or solicitation for the purchase or sale of any security or fi nancial
instrument, nor is it advice or a recommendation to enter into any transaction. Research Affi liates, LLC is an
investment adviser registered with the U.S. Securities and Exchange Commission under the Investment Advisors
Act of 1940. The trade names Fundamental Index®, RAFI®, the RAFI logo, and the Research Affi liates® corporate
name and logo are registered trademarks and are the exclusive intellectual property of Research Affi liates, LLC.
One methodology, many applications
researchaffi liates.com
®

All investments are subject to risk. Vanguard funds are not insured or guaranteed.
To buy or sell Vanguard ETF Shares, contact your financial advisor. Usual commissions apply. Not redeemable. Market price may be more or less than NAV.
For more information about Vanguard ETF Shares, visit advisors.vanguard.com/VWO, call 800-453-3398, or contact your broker to obtain a prospectus. Investment objectives, risks, charges, expenses, and other important information are contained in the prospectus; read and consider it carefully before investing.
Foreign investing involves additional risks including currency fluctuations and political uncertainty. Stocks of companies in emerging markets are generally more risky than stocks of companies in developed countries.
The funds or securities referred to herein are not sponsored, endorsed, or promoted by MSCI, and MSCI bears no liability with respect to any such funds or securities. For any such funds or securities, the prospectus or the Statement of Additional Information contains a more detailed description of the limited relationship MSCI has with The Vanguard Group and any related funds.
*Source: Morningstar as of 05/01/2011. Based on 2011 industry average expense ratio for emerging market ETFs of 0.63% and Vanguard VWO expense ratio of 0.22%.
© 2011 The Vanguard Group, Inc. All rights reserved. U.S. Pat. No. 6,879,964 B2; 7,337,138. Vanguard Marketing Corporation, Distributor.
Follow us @Vanguard_FA for important insights, news and education.
VWOVanguard MSCI Emerging Markets ETFVWO has a 65% lower expense ratio than the industry average.*
Lower expense ratios mean your clients can keep more of their returns. So take a
closer look at the Vanguard MSCI Emerging Markets ETF. With a lower expense ratio
than the industry average, it can help your clients build a more solid portfolio.
Take a closer look at advisors.vanguard.com/VWO 800-453-3398
Every client’s portfolio could use some Vanguarding.®

CAPITAL APPRECIATION
RISK MANAGEMENT
INCOME GENERATION
LIQUIDITY
Based on understanding. Built on experience.
Your clients spoke. FlexShares ETFs heard every word.
FlexShares ETFs are engineered
with a simple goal. They listen to
and address investor objectives,
like managing inflation risk and
building their wealth. What’s
more, they leverage deep portfolio
management expertise and more
than a century of experience
from the world’s fourth-largest
index manager. So you won’t just
track the latest index. With
FlexShares, you’ll target real-
world goals. For more information,
visit flexshares.com/client.
Or scan here to view our video.
Before investing carefully consider the FlexShares investment objectives, risks, charges and expenses. This and other information is in
the prospectus, a copy of which may be obtained by visiting www.flexshares.com. Read the prospectus carefully before you invest.
Foreside Fund Services, LLC, distributor.
An investment in FlexShares is subject to investment risk, including the possible loss of principal amount invested. Funds’
returns may not match the returns of their respective indexes. The Funds may invest in emerging markets, derivatives and
concentrated sectors. In addition, the Funds may be subject to fluctuation of yield, income risk, interest rate risk, non-diversification
risk, asset class risk and market risk. For a complete description of Fund risks please refer to the prospectus.