Work-Value Profile and Career Success
152
University of South Florida Scholar Commons Graduate eses and Dissertations Graduate School 7-1-2016 Work-Value Profile and Career Success Chee Wee Koh University of South Florida, [email protected] Follow this and additional works at: hp://scholarcommons.usf.edu/etd Part of the Business Administration, Management, and Operations Commons , and the Other Psychology Commons is esis is brought to you for free and open access by the Graduate School at Scholar Commons. It has been accepted for inclusion in Graduate eses and Dissertations by an authorized administrator of Scholar Commons. For more information, please contact [email protected]. Scholar Commons Citation Koh, Chee Wee, "Work-Value Profile and Career Success" (2016). Graduate eses and Dissertations. hp://scholarcommons.usf.edu/etd/6281
Transcript of Work-Value Profile and Career Success

University of South FloridaScholar Commons
Graduate Theses and Dissertations Graduate School
7-1-2016
Work-Value Profile and Career SuccessChee Wee KohUniversity of South Florida, [email protected]
Follow this and additional works at: http://scholarcommons.usf.edu/etd
Part of the Business Administration, Management, and Operations Commons, and the OtherPsychology Commons
This Thesis is brought to you for free and open access by the Graduate School at Scholar Commons. It has been accepted for inclusion in GraduateTheses and Dissertations by an authorized administrator of Scholar Commons. For more information, please contact [email protected].
Scholar Commons CitationKoh, Chee Wee, "Work-Value Profile and Career Success" (2016). Graduate Theses and Dissertations.http://scholarcommons.usf.edu/etd/6281
Work-Value Profile and Career Success
by
Chee Wee Koh
A dissertation submitted in partial fulfillment
of the requirements for the degree of
Doctor of Philosophy
Department of Psychology
College of Arts and Sciences
University of South Florida
Major Professor: Walter C. Borman, Ph.D.
Tammy D. Allen, Ph.D.
Michael T. Brannick, Ph.D.
Judith B. Bryant, Ph.D.
Walter R. Nord, Ph.D.
Date of Approval:
June 15, 2016
Keywords: intrinsic work values, extrinsic work values, career success, lawyers,
latent profile analysis, self-determination theory
Copyright © 2016, Chee Wee Koh

Dedication
To my wife Kathlyn and daughter Caeia, who have shared every step of this journey with me.
To our family members for their unconditional love, support, and trust.
To the Singapore Public Service, for a meaningful and satisfying career.

Acknowledgements
One highly gratifying aspect of an academic endeavor is the privilege to stand on the
shoulders of giants. I would like to acknowledge all researchers who have made this piece of
work possible. My advisor, Wally Borman, has been most encouraging and supportive in this
journey; Wally taught me that while our business is science, we need to communicate artistically,
and I continue to refine this skill every day. I would also like to acknowledge the members of my
dissertation committee, Tammy Allen, Michael Brannick, Judith Bryant, and Walter Nord, for
their time and constructive feedback. It was during Tammy’s engaging seminar on Careers when
I first encountered the dataset used in this study. Next, I wish to thank my friends at the USF
Industrial-Organizational Psychology program, in particular Seok Joon Chun, Kimberly French,
and Michele Gazica, as well as Soon Hee Koh, for sharing with me their unique knowledge and
perspectives which contributed to the study. Finally, I would like to express my gratitude to the
American Bar Foundation, specifically Dr. Robert Nelson and Dr. Ronit Dinovitzer, for granting
me access to the dataset from the After the Juris Doctorate Study.

i
Table of Contents
List of Tables iii
List of Figures vi
Glossary vii
Abstract ix
Chapter One – Introduction 1
Career Success 5
Antecedents of Career Success 9
Work Values 10
Career Outcomes 14
Synthesis of Literature 18
Structure of Present Study 20
Hypotheses and Research Questions 21
Supplementary Hypotheses and Research Questions 26
Chapter Two – Method 28
Archival Dataset 28
Sample for Present Study 30
Measures 31
Antecedent and work values 31
Gender 31
Work values 32
Career variables 35
Practice setting 35
Salary 35
Current position 35
Supervisory authority 37
Career satisfaction 37
Job satisfaction 38
WLB satisfaction 38
Control variables 39
Race 39
Marital status 39
UGPA 39
LOC 40

ii
Analytic Strategy 40
Establishing measurement invariance 40
Description of LPA 42
Considerations in model specification and evaluation 44
Treatment of career variables 46
Analyses 46
Supplementary Analyses 48
Chapter Three – Results 50
Descriptive Statistics 50
Measurement Invariance 57
Profile Configuration 60
Association between Gender and Profile Assignment 65
Preparation of Data for Further Analyses 65
Practice Setting 66
Salary 72
Position 76
Supervisory Authority 77
Career Satisfaction 78
Job Satisfaction 80
WLB Satisfaction 81
Supplementary Analyses 83
OCS indicators 84
SCS indicators 88
Chapter Four – Discussion 94
Work-Value Profiles 95
Practice Setting 97
Objective Career Success 99
Subjective Career Success 101
Validity and Utility of Work-Value Profile Approach 104
Practical Implications 107
Limitations 108
Future Directions 109
Conclusion 111
References 112
Appendices 134
Appendix A: IRB Exemption Letter 135
Appendix B: Work Value Items 136
Appendix C: Job Satisfaction Items 137
Appendix D: Locus of Control Items 138

iii
List of Tables
Table 1. Hypothetical Profiles of Intrinsic and Extrinsic Work Values 22
Table 2. Comparisons between Current Sample and Population in AJD’s Sampling
Frame 31
Table 3. Factor Loadings from Exploratory Factor Analysis with Varimax Rotation of
Intrinsic and Extrinsic Work Value Items 33
Table 4. Percentage of Respondents who Categorized Each Work Value Statement
Correctly 34
Table 5. List of “Current Position” in AJD Sorted into Non-senior Position, Senior
Position, and Positions which Cannot be Categorized 36
Table 6. Means, SDs and Correlations of Study Variables (n = 905) 51
Table 7. Fit Statistics for Profile Structure among Female Lawyers (n = 388) 57
Table 8. Fit Statistics for Profile Structure among Male Lawyers (n = 517) 58
Table 9. Fit Statistics for Profile Structure with Gender Modelled as Covariate
(n = 905) 61
Table 10. Means, Standard Errors, and Profile Proportions in Final Latent Profile Model 63
Table 11. Average Latent Profile Probabilities for Most Likely Latent Profile
Membership (Row) by Latent Profile (Column) 65
Table 12. Distribution of Lawyers - Profile by Practice Setting in 2002, 2007, and 2012 67
Table 13.1. Mean Salaries in 2002, Standard Errors, and Pairwise Comparisons (n = 873) 72
Table 13.2. Mean Salaries in 2002 (controlling for gender, race, age and UGPA),
Standard Errors, and Pairwise Comparisons (n = 852) 73
Table 14.1. Mean Salaries in 2006, Standard Errors, and Pairwise Comparisons (n = 820) 74
Table 14.2. Mean Salaries in 2006 (controlling for gender, marital status and UGPA),
Standard Errors, and Pairwise Comparisons (n = 796) 74

iv
Table 15.1. Mean Salaries in 2011, Standard Errors, and Pairwise Comparisons (n = 812) 75
Table 15.2. Mean Salaries in 2011 (controlling for gender, marital status, and UGPA),
Standard Errors, and Pairwise Comparisons (n = 779) 75
Table 16.1. Mean Career Satisfaction in 2002, Standard Errors, and Pairwise Comparisons
(n = 886) 79
Table 16.2. Mean Career Satisfaction in 2002 (controlling for UGPA and LOC), Standard
Errors, and Pairwise Comparisons (n = 750) 79
Table 17.1. Mean Job Satisfaction in 2002, Standard Errors, and Pairwise Comparisons
(n = 897) 80
Table 17.2. Mean Job Satisfaction in 2002 (controlling for gender, race, and marital
status), Standard Errors, and Pairwise Comparisons (n = 888) 81
Table 18. Mean WLB Satisfaction in 2007, Standard Errors, and Pairwise
Comparisons (n = 849) 82
Table 19.1. Predictors of Salary in 2002 84
Table 19.2. Predictors of Salary in 2006 85
Table 19.3. Predictors of Salary in 2011 85
Table 20.1. Predictors of Senior Position in 2002 86
Table 20.2. Predictors of Senior Position in 2007 86
Table 20.3. Predictors of Senior Position in 2012 86
Table 21.1. Predictors of Career Satisfaction in 2002 88
Table 21.2. Predictors of Career Satisfaction in 2007 89
Table 21.3. Predictors of Career Satisfaction in 2012 89
Table 22.1. Predictors of Job Satisfaction in 2002 90
Table 22.2. Predictors of Job Satisfaction in 2007 91
Table 22.3. Predictors of Job Satisfaction in 2012 91
Table 23.1. Predictors of WLB Satisfaction in 2007 92

v
Table 23.2. Predictors of WLB Satisfaction in 2012 93

vi
List of Figures
Figure 1. Work-Value Profiles among Female and Male Lawyers 59
Figure 2. Work-Value Profiles in Entire Sample 62
Figure 3.1. Plot of Practice Setting by Profile Distribution in 2002 68
Figure 3.2. Plot of Practice Setting by Profile Distribution in 2007 69
Figure 3.3. Plot of Practice Setting by Profile Distribution in 2012 69

vii
Glossary
ABF: American Bar Foundation
AIC: Akaike information criterion
AJD: After the Juris Doctorate study
BCH: LPA module in Mplus which models both antecedents and outcomes
BIC: Bayesian information criterion
BLRT: Bootstrap likelihood ratio test
BTL: Business, trade association, or labor union
EFA: Exploratory factor analysis
GPI: Government or public interest (firm)
HE[I]: The “highly extrinsic, also intrinsic” work-value profile
HI: The “highly intrinsic” work-value profile
HI[E]: The “highly intrinsic, also extrinsic” work-value profile
JD: Juris doctorate
LCA: Latent class analysis
LL: Log-likelihood
LMR: Lo-Mendell-Rubin likelihood ratio test
LPA: Latent profile analysis
LOC: Locus of control
MI: Measurement invariance
MIE: The “moderately intrinsic and extrinsic” work-value profile
MLR: Robust maximum likelihood (estimates)

viii
NALP: National Association for Law Placement
NIE: The “neither intrinsic nor extrinsic” work-value profile
OCS: Objective career success
P-O fit: Person-organization fit
R3STEP: LPA module in Mplus which is computationally equivalent to BCH; it only models
antecedents but provides most-likely profile information in its output
SCCT: Social cognitive career theory
SCS: Subjective career success
SDT: Self-determination theory
SEM: Structural equation modeling
SSA-BIC: Sample-size-adjusted BIC
TWA: Theory of work adjustment
UGPA: Undergraduate grade point average
WLB: Work-life balance
ix
Abstract
Work values, defined as the end states people desire and expect to realize through work,
appear to play a role in career success, but the small number of past studies have reported
conflicting results, some of which may be attributed to research methodology. Using a person-
centered approach to model the conjoint effects of intrinsic and extrinsic work values, the present
study inductively investigated the association between work-value profile and career success
using a three-panel longitudinal dataset consisting of 905 lawyers from the After the Juris
Doctorate (AJD) study. Latent profile analysis identified five work-value profiles: (i) Neither
Intrinsic nor Extrinsic (NIE); (ii) Moderately Intrinsic and Extrinsic (MIE); (iii) Highly Intrinsic
(HI); (iv) Highly Intrinsic, also Extrinsic (HI[E]); and (v) Highly Extrinsic, also Intrinsic (HE[I]).
Measurement invariance was established across gender, but gender was an antecedent to profile
assignment, with males being more likely to belong to the NIE, MIE, or HE[I] profiles compared
to the HI profile. The work-value profile construct displayed intuitive and meaningful
relationships with objective and subjective career success indicators over time. The results
exposed the inadequacies of methods that examine the effects of intrinsic and extrinsic work
values separately. The two sets of values appeared to interact in a non-linear fashion in their
associations with career variables, such that modelling them simultaneously, but only linearly,
might also be misleading. Contrary to claims made by studies based on the self-determination
theory, the HI profile was not positively associated with subjective career success. Generally, the
more successful lawyers from early to mid-career also tended to report high intrinsic and high

x
extrinsic work values i.e., those with the HI[E] and HE[I] profiles; the former enjoyed higher
subjective career success while the latter exhibited the highest objective career success. The
absence of the highly extrinsic profile among this sample of lawyers reinforced past calls to
restructure the transactional rewards systems in large law firms.
Chapter One
Introduction
A career used to be conceived as a sequence of positions held by a person during the
course of a lifetime (Super, 1957). It often evolved within a single organization as secured,
committed, and motivated employees advanced in the hierarchy (Kanter, 1989). Economic and
social vicissitudes along with major industrial transformations in the past few decades have
decoupled career from organizations and given rise to new career constructs that reside within
the individual e.g., the protean career (Hall, 1976), the boundaryless career (Arthur, 1994), and
psychological success (Mirvis & Hall, 1994). While the traditional organizational career still
exists (e.g., Chudzikowski, 2012), and job mobility is not universally beneficial (e.g.,
Verbruggen, 2012), the preponderance of evidence does show that individuals - at least those
with higher human capital1 - have been experiencing greater variety in career trajectories as they
become more proactive in charting their own careers (e.g., Colakoglu, 2011; Stumpf, 2014).
Echoing this trend, career success has been defined as ‘accomplishment of desirable
work-related outcomes at any point in a person’s work experience over time’ (Arthur, Khapova,
& Wilderom, 2005, p. 179; italics added). Among the constructs that have shaped career
scholarship in the past 25 years, ‘career success’ has registered the highest citation rate, trumping
terms like ‘career stage’ and ‘employability’ (Baruch, Szucs, & Gunz, 2015). This is not
unexpected. Career success influences individuals’ living standards, the sense of satisfaction they
derive from their work, and their overall well-being; organizations also benefit because
1 The participants in most career success studies were professionals, managers, or MBA students (Hennequin, 2007).

2
employees’ personal successes ultimately accrue to organizational success (Judge, Higgins,
Thoresen, & Barrick, 1999).
As more individuals assume stewardship of their own careers, individual differences
naturally emerged as one key theme in career success research. The individual differences
predictors in career research have closely mirrored those in job performance studies i.e.,
cognitive ability and personality (Ng, Eby, Sorensen, & Feldman, 2005; Ng & Feldman, 2014),
likely because jobs are building blocks of careers. The current study aims to extend career
success research beyond these familiar clusters of individual differences predictors. Specifically,
it examines the association between work values and career success.
Work values are the end states people desire and expect to realize through work (Nord,
Brief, Atieh, & Doherty, 1990). Work value research originated in vocational guidance and
career counselling (Zytowski, 1994); it was integral to the life-span, life-space theory (Super,
1980), the theory of work adjustment (Dawis & Lofquist, 1984), Holland’s (1997) vocational
interest theory, and social cognitive career theory (Lent, Brown, & Hackett, 1994). The
overarching idea is that people are more motivated, satisfied, and committed when the values
emphasized in the organization or job are congruent with their own. This concept of “fit” has
spawned much I/O psychology research focusing on person-job and person-organizational fit
(Murdoch & Rounds, 2014). However, the impact of work values is seldom investigated beyond
this contingency approach. Only a small number of studies have examined the direct relationship
between work values and career outcomes.
Two meta-analytic findings suggest that this line of inquiry can be productive. First,
although personality may influence personal values (e.g., Olver & Mooradian, 2003; Roberts &
Robins, 2000), values and personality are distinct constructs (Parks-Leduc, Feldman, & Bardi,

3
2015). Second, work values may be even more stable than personality; they crystallize in early
adulthood and individuals generally maintain their rank-order in a group across the life span (Jin
& Rounds, 2012). Work values measured in early adulthood have been shown to endure rapid
social changes to predict later career outcomes, and this effect has been attributed to their focus
on general job features instead of specific job characteristics (Johnson & Mortimer, 2011).
Because work values are relatively stable across time and situations, and because
individuals differ in their work values, people will differentially perceive their work situations,
resulting in varied career consequences (Hofman, De Gieter, & Pepermans, 2013). Yet,
compared to vocational interests, abilities, and personality traits, values have not gained as much
attention from career researchers (Bouwkamp-Memmer, Whiston, & Hartung, 2013).
There exist numerous work value measures, which have led to different work value
taxonomies with significant overlaps (Leuty & Hansen, 2011). The higher order extrinsic-
intrinsic distinction has dominated studies on work values as antecedents of work outcomes
(Johnson, Mortimer, Lee, & Stern, 2007; Wang, 1992). Intrinsic work values reflect the
importance attached to the rewarding nature of the work tasks themselves, including autonomy,
learning, or helping others, whereas extrinsic work values capture the degree of importance
bestowed on job features that are means to other ends, such as pay, security or prestige (Johnson,
Sage, & Mortimer, 2012).
The two sets of values are not opposite ends of a continuum because most people would
likely value some degree of material success as well as fulfilling work (e.g., Johnson & Mortimer,
2011; Judge, Cable, Boudreau, & Bretz, 1995; Mortimer, Pimentel, Ryu, Nash, & Lee, 1996).
This suggests that it may be illuminating to examine the conjoint effects of intrinsic and extrinsic

4
values within persons. The relative importance of extrinsic versus intrinsic values, or work-value
orientation, is expected to vary across individuals (Malka & Chatman, 2003).
Consequently, the current study adopts a person-centered approach (e.g., Owens &
Schoenfeldt, 1979) to explore career outcomes in various subgroups that comprise individuals
who share similar work-value orientations. Specifically, latent profile analysis (LPA; Hagenaars
& McCutcheon, 2002) was applied to identify latent work-value profiles in an archival dataset
and to relate profile membership to various career variables over time. This approach may help
explain discrepant results from previous, variable-centered, studies that treated intrinsic and
extrinsic work values as separate antecedents (e.g., Frieze, Olson, Murrell, & Selvan, 2006;
Mortimer & Lorence, 1979). More consistent findings have already emerged from studies that
investigated job outcomes associated with an extrinsic work-value orientation (e.g., Kasser &
Ryan, 1993; Vansteenkiste, Neyrinck, Niemiec, Soenens, De Witte, & Van den Broeck, 2007);
other profiles likely exist and they may impact career variables in different but systematic ways.
The sample for the current study was drawn from the After the Juris Doctorate (AJD)
study, whose purpose was to understand the nature and complexities of legal careers as they
unfold over time (Dinovitzer, Garth, Sander, Sterling, & Wilder, 2004). Legal career research
based on AJD and other data have consistently found that more well-paid lawyers also tended to
report lower career satisfaction and subjective well-being (e.g., Dinovitzer & Garth, 2007;
Sheldon & Krieger, 2014). This contrasts with meta-analytic findings (Ng et al., 2005) as well as
results from cross-lagged panel studies involving professional samples (Abele & Spurk, 2009a;
Spurk & Abele, 2014), which have shown that salary and affective evaluation of career were
positively correlated. Some of these apparent contradictions may be resolved using a person-
centered approach i.e., population heterogeneity likely exists in the form of work-value profiles,

5
and the relationship between salary and career satisfaction may be quantitatively and/or
qualitatively different across these profiles.
Career Success
Individuals can experience career success in the material (objective) and psychological
(subjective) realms (London & Stumpf, 1982). Objective career success (OCS) refers to
externally verifiable accomplishments like salary, promotion, and job level (Judge & Kammeyer-
Mueller, 2007). It also reflects the shared social understanding of success by a referent group
(Arthur et al., 2005).
The importance of OCS has never been challenged, but OCS is only one aspect of career
success. For instance, a series of studies in the 1970s found that managers were often dissatisfied
with their career, despite their income and position (see Korman, 1980; Korman, Wittig-Berman,
& Lang, 1981). Concurrently, the erosion of traditional career elements like vertical mobility and
job security in the post-industrial economic landscape has inspired career theories that emphasize
the need for individual career self-management (Briscoe & Hall, 2006), alongside the recognition
that individuals show considerable variation in what they value in a career and the factors they
use to evaluate their own career success (Greenhaus & Callanan, 2013).
These cognitive and affective evaluations constitute a person’s subjective career success
(SCS), which reflect the individual’s interpretation of his or her career accomplishments (e.g.,
Gattiker & Larwood, 1986). Despite earlier claims about (objective) career success leading to
personal failure (e.g., Korman, 1980), a meta-analysis has found that the key dimensions of OCS
(salary and promotion) and SCS (career satisfaction) are positively correlated (rc = .30 and .18,
respectively; Ng et al., 2005).

6
Career success exhibits high stability over time. Among university graduates, correlations
between salary over time were in the .55 to .60 range when measurements were taken 2 years
apart; the corresponding SCS measures have displayed even greater stability, in the .70 to .80
range (Spurk & Abele, 2014). One interesting empirical question would be whether there exist
population subgroups where individuals share similar patterns of career changes over time.
While conceptually well-defined, when used as a criterion, the operationalization of OCS
often requires compromises, leading to criterion deficiency and contamination (Heslin, 2005).
For instance, when OCS is examined in the general population, salary and promotions are likely
contaminated by labor market differences across occupations. This source of contamination can
either be statistically controlled if sample size is large (e.g., Abele & Spurk, 2009b) or by
sampling only individuals from the same profession. The present study used the latter strategy.
The OCS criterion is often deficient in studies that use confirmatory analytic techniques
like structural equation modeling (SEM). For instance, salary and promotion are conceptually
distinct; although they are positively related, the size of the correlation is quite small (meta-
analytic effect size rc = .18; Ng et al., 2005). In other words, if they were to be modeled as
separate indicators of a latent OCS construct, the measurement model may not converge. This
may account for why, in many studies, OCS has been indexed either by salary only (e.g., Judge
et al., 1995; Spurk & Abele, 2014; Wolff & Moser, 2009) or by position in the corporate
hierarchy only (e.g., Bozionelos, 2004; Gattiker & Larwood, 1990). A small number of studies
have tried to alleviate criterion deficiency through measures based on a linear combination of
OCS indicators (e.g., Abele, 2003; Abele & Spurk, 2009a; Judge & Bretz, 1994); however the
psychometric properties of these ad-hoc scales were often not reported. Alternatively, one can

7
include multiple OCS indicators as separate observed variables in a study (e.g., Abele & Spurk,
2009b). This approach is particularly well-suited for exploratory research like the present study.
In contrast to OCS, there has not been a strong consensus on the dimensions of SCS. The
following operationalization have emerged from a quick, non-exhaustive survey of the literature:
perceived career success (e.g., Forret & Doherty, 2004; Kirchmeyer, 1998), career satisfaction
only (e.g., De Vos, Dewettinck, & Buyens, 2009; Wolff & Moser, 2009), career and job
satisfaction (e.g., Verbruggen, 2012), job and life satisfaction (e.g., Judge & Bretz, 1994), career,
job and life satisfaction (Russo, Guo, & Baruch, 2014), job satisfaction only (Judge et al., 1999),
career satisfaction, perceived internal marketability, and perceived external marketability (Eby,
Butts, & Lockwood, 2003) and even core self-evaluations (Stumpf and Tymon, 2012). Shockley,
Ureksoy, Rodopman, Poteat, and Dullaghan (2016) estimated that about half of all SCS studies
to date have used unidimensional operationalization, either as career satisfaction (e.g., Greenhaus,
Parasuraman, & Wormley, 1990) or perceived career success (Turban & Dougherty, 1994). This
has naturally created some unease relating to criterion deficiency (e.g., Arthur et al., 2005;
Heslin, 2005).
As part of their efforts to develop more comprehensive SCS scales, three recent studies
(Pan & Zhou, 2015; Shockley et al., 2016; Zhou, Su, Guan, Li, & Pan, 2013) have clarified the
structure of SCS. Zhou et al. (2013) used the grounded theory approach to develop a theory of
SCS through a bottom-up process in China. Structured interviews were first conducted to
determine the criteria of SCS. This generated a set of preliminary items. A group of participants
then rated how much they thought each item could be a criterion for career success. The data
underwent exploratory factor analysis and some items were dropped. Finally, another group of
8
participants performed the same task for a confirmatory factor analysis. The process resulted in
three categories of items - intrinsic fulfilment, external compensation, and work-life balance.
Using the items from Zhou et al. (2013) as their starting point, Pan and Zhou (2015)
replicated the factor structure, derived a shorter scale, and established the convergent,
discriminant, and incremental validity of the new scale in China. Shockley et al. (2016) used
similar strategies as Zhou and colleagues to create a scale for the western context. The final scale
consists of eight dimensions2, one of which is positive affect or feelings toward one’s career in
general i.e., career satisfaction.
Collectively, the three studies provided at least three insights. First, there were
similarities in qualitative and quantitative findings from the oriental and western samples,
suggesting overlaps in SCS dimensions across the cultures. Second, all three studies identified
work-life balance (WLB) as a dimension of career success, affirming the finding of several
earlier studies (e.g., Afiouni & Karam, 2014; Dyke & Murphy, 2006; Kim, 2004; McDonald &
Hite, 2008). To date, SCS studies seldom include WLB as a criterion. Third, in Shockley et al.
(2016), the career satisfaction dimension and the overall SCS index were highly correlated (r
= .82 in one of the validation studies, r = .80 in the other), showing that career satisfaction is
indeed an adequate indicator of SCS. Furthermore, correlation between the career satisfaction
and WLB dimensions was in the low to moderate range (r = .22 in one study; r = .37 in the
other), suggesting that a study including measures of career and WLB satisfaction may capture
much of the variance in SCS. Both SCS indicators are examined in the present study.
2 A ninth dimension, financial stability and advancement (similar to the external compensation dimension from the
Chinese studies), was dropped from the scale based on theoretical consideration (Shockley et al., 2016).
9
Antecedents of Career Success
Despite operationalization challenges, a large body of work on the antecedents of OCS
and SCS has been accumulated. Ng et al. (2015) conducted a comprehensive quantitative review
on the antecedents of OCS (salary and promotion) and SCS (career satisfaction). Another meta-
analysis has focused on the hurdles to SCS in which SCS was operationalized more broadly
(affect-based or cognition-based; Ng & Feldman, 2014).
Ng et al. (2005) classified career success antecedents into four categories: human capital,
organizational sponsorship, socio-demographic, and stable individual differences. Human capital
includes an individual's education, work experience, and social capital. Organizational
sponsorship involves career support from senior executives and training/development
opportunities. Socio-demographic predictors include variables such as gender, age and marital
status. Stable individual differences variables include cognitive ability, the Big Five personality
factors, proactive personality, and locus of control.
Several results from Ng et al. (2015) have implications for the current study, specifically
those relating to the socio-demographic and stable individual differences variables. First, among
socio-demographics, age (rc = .26), gender (coded as male = 1, female = 0; rc = .18), and marital
status (married = 1, unmarried = 0; rc = .16) have small meta-analytic associations with salary.
Second, among the individual differences predictors of salary, cognitive ability stood out with an
rc of .27 (the next highest rc was -.12, for neuroticism). Third, with regard to career satisfaction,
none of the effect sizes associated with the socio-demographic variables was greater than .10,
and the best individual differences predictor was locus of control (LOC; rc = .47; internal LOC
associated with higher satisfaction).

10
Ng and Feldman (2014) have likewise reported a meta-analytic correlation of .40
between external LOC and SCS (operationalized as career satisfaction). At least two meta-
analyses have found moderate association between LOC and job satisfaction (rc = .32 in Judge &
Bono, 2001; rc = .33 in Ng, Sorensen, & Eby, 2006), another popular SCS indicator. With regard
to cognitive ability, it has been shown that the higher the occupational complexity, the greater its
effect on salary (e.g., Ganzach, Gotlibobski, Greenberg, & Pazy, 2013). Therefore, we would
expect cognitive ability to have a significant impact on lawyers’ salary.
The first implication of these results for the present study is that we may have to control
for the effects of age, sex, marital status, cognitive ability, and LOC during data analysis. The
second implication is that there is a gap in the literature with regard to whether and how work
values relates to career success - despite their extensive lists of antecedents, both Ng et al. (2005)
and Ng and Feldman (2014) do not feature work values, which suggests the paucity of primary
studies. The following section explains why this particular individual differences attribute may
be important to career success.
Work Values
Values can be defined as ‘desirable end states or behaviors that transcend specific
situations, guide selection or evaluation of behavior and events, and are ordered by relative
importance’ (Schwartz & Bilsky, 1987, p. 551). Like need, value is a motivational construct.
Although ‘needs’ and ‘values’ are sometimes used interchangeably, most scholars would
perceive needs as a more basic entity linked to biological necessity (e.g., Rokeach, 1973). Values,
on the other hand, are often seen as a higher-order psychological construct emerging from the
interactions among needs, culture, and experience, and thus capable of explaining a wider range
of phenomena (Murdoch & Rounds, 2014).
11
Work values are expressions of basic values in the work setting (Ros, Schwartz, &
Surkiss, 1999). By definition, they capture the general goals or satisfactions sought by people at
work (Savickas, 2014). Work values have been an important individual differences variable
explaining career choice, adjustment, and satisfaction. What follows is a brief review of four
influential career theories that illustrate the integral role of work values in career research, and
more importantly, show how they have been typecast in such research.
Super (1953, 1962) conceived of an occupational selection model where work values
constituted a critical aspect of vocational identity. In this model, self-concept was a joint product
of vocational identity (e.g., work values, interests, and abilities), objective feedback (e.g., job
performance) and subjective sense of self (e.g., whether one is creative). People are drawn to
work that would enable them to foster their ideal self-concepts because that would result in the
greatest satisfaction. According to Super, career decisions are driven by one’s belief in the
potential of various occupations to facilitate this desired end state. In this regard, choosing a
career is a lifelong developmental process of which work values are an integral part.
Holland’s theory of vocational choice (1959, 1997) proposed that both people and their
working environments can be categorized into one of the six types: realistic, investigative,
artistic, social, enterprising, and conventional (RIASEC). Each personality type exhibits
distinctive preferences, values, and self-evaluations. Individuals resemble the six model
personalities to varying degrees, and a person may be described in terms his or her dominant
personality types. Each of the six model environments is expected to make different demands,
provide different rewards and opportunities, and encourage the expression of different values.
Again, actual work environments can be classified according to this typology. People seek work
environments that will let them express their competencies, preferences, and values. Similarly,
12
any work environment would reward the characteristic attitudes, competencies, and interests
associated with its corresponding personality type and not support development of personalities
incompatible with it.
The theory of work adjustment (TWA; Dawis & Lofquist, 1984) is also based on person-
environment fit (or “correspondence”). However it focuses on work-related abilities and work
values rather than interests. TWA posits a reciprocal relationship between person (job-holder)
and environment (e.g., job) that together determines job tenure. Jobs require employees to have
certain abilities, and employees expect jobs to provide “reinforcers” of key values like status,
safety, and autonomy. If a person’s abilities (e.g., knowledge and skills) meet or exceed the
requirements of the job role or the organization, s/he would likely perform well and be perceived
as “satisfactory” by the employer. Similarly, when the reinforcers correspond to the person’s
work values, s/he will likely perceive the job as “satisfying”. Even a good correspondence can
change over time, and the tolerance for less than ideal correspondence depends on flexibility of
the person or the environment. Otherwise, poor fit must be addressed by active or reactive
adjustments (i.e., either changing to meet expectations or lowering expectations to meet reality).
Where adjustments fail, unsatisfactory employees may be fired, transferred, or laid off, while
dissatisfied employees may engage in counterproductive behaviors or quit the job.
In social cognitive career theory (SCCT; Lent & Brown, 2013; Lent et al., 1994),
adaptive career behaviors (e.g., engaging in career exploration) are conceived as a function of an
individual’s self-efficacy, outcome expectations, goals, and support or barriers in the
environment. Outcome expectations are beliefs about the consequences of courses of actions in a
particular environment. The desirability of an outcome depends on how much it is valued i.e.,
work values are incorporated as part of outcome expectations in SCCT (Hartung, 2014). The

13
main contribution of SCCT lies in the explication of self-efficacy’s role in career development,
but the role of work values is also acknowledged - they are thought to influence adaptive career
behaviors through self-regulatory processes that interact with social-contextual factors to initiate
career attainment behaviors (Huttges & Fay, 2015).
It is clear that person-environment fit is a key theme in all of the above theories. Together,
they have placed work values in a contingency role and inspired a large body of work on how
“fit” relates to important work consequences such as job satisfaction, organizational commitment,
intent to quit, job performance, and organizational citizenship behavior (e.g., Boon, Den Hartog,
Boselie, & Paauwe, 2011; Oh, Guay, Kim, Harold, Lee, Heo, & Shin, 2014; Vilela, Gonzales, &
Ferrin, 2008).
A few studies have also examined the effects of fit on career success (e.g., Bretz & Judge,
1994; Y. Haines, Hamouche, & Saba, 2014). For instance, Bretz and Judge (1994) created two
parallel 15-item lists, one on “individual preferences” (i.e., work values; e.g., “I place a high
emphasis on helping others.”) and the other on “job and organization perception” (i.e., reinforcer;
e.g., “There is an emphasis on helping others.”). Person-organization (P-O) fit was determined
by the extent to which participants endorsed corresponding items on both lists. Controlling for
demographics, human capital, and contextual factors, the authors did find a sizeable effect of P-
O fit on job satisfaction, and smaller effects on salary, promotion, and tenure. Interestingly, work
values also showed independent effects on tenure, job satisfaction, and job level, but it was
difficult to interpret the results because the work value items were not theoretically-derived.
The fit approach is consistent with current knowledge that value expressions are
moderated by situational strength (Weick, 1996) and social norms (Bardi & Schwartz, 2003).
The same constraints apply to the expression of personality (e.g., Funder, 2008; Judge & Zapata,

14
2015) but they have not hindered research on effects of personality. A key prerequisite appears to
be a consensus on taxonomy i.e., the dominant Big-Five model (McCrae & Costa, 1989) has
facilitated the accumulation of personality research. In a similar vein, some studies have adopted
the extrinsic-intrinsic framework (Brief & Aldag, 1977) to examine the impact of work values on
career success indicators (e.g., Huttges & Fay, 2015; Mortimer & Lorence, 1979; Vansteenkiste
et al., 2007). As elaborated earlier, intrinsic work values refer to end states that can be attained
through work itself, whereas extrinsic work values relate to end states which arise irrespective of
the content of the work (Nord et al., 1990). The distinction between intrinsic and extrinsic work
values has received ample support in the literature (e.g., Dagenais, 1998; Johnson et al., 2007;
Kalleberg, 1977).
Career Outcomes
Although the body of work that examines the relationship between extrinsic/intrinsic
work values and career outcomes is not large, studies seemed to have approached it from
different theoretical perspectives. For discussion purpose, the studies can be loosely classified
into three categories based on their theoretical underpinning (and methodology). This is done
solely to facilitate sense-making, and no attempt is being made to reify the categories.
The first category of studies are grounded on the premise that extrinsic and intrinsic work
values influence work activities and thus impact career outcomes (e.g., Roe & Ester, 1999). The
samples in these studies were usually working adults, or those who were workforce-ready. At
least two longitudinal studies have found that individuals with high extrinsic work values
exhibited greater OCS compared to peers lower in extrinsic work values (Abele & Spurk, 2009b;
Frieze et al., 2006), although another longitudinal study did not replicate such results (Konrad,
Yang, Goldberg, & Sullivan, 2005). The relationship between extrinsic work values and SCS

15
was infrequently examined; at least one reported a positive association (Huttges & Fay, 2015)
but another found a negative correlation (Abele & Spurk, 2009b). Finally, at least one
longitudinal study had investigated how intrinsic work values predicted career outcomes. In the
study, graduating students were classified into two groups (“primarily intrinsic” vs. “others”)
using an open-ended work value question; two years later, both OCS and SCS were found to be
higher in the primarily intrinsic group (Bridgstock, 2011).
The second category of studies examines the relationship between work values and
perceived job rewards over time. Mortimer and Lorence (1979) hypothesized that work values
would be associated with their corresponding job rewards though two processes - selection and
socialization. Selection refers to how people choose jobs and socialization refers to the mutual
influence between work values and job rewards. In these studies, work values were typically
measured while the participants were still in school, and their perception of extrinsic and
intrinsic job rewards were collected years later. Research generally supported the hypotheses.
First, numerous studies have established the selection effect of work values i.e., individuals are
more likely to choose jobs where content matches their values (e.g., Judge & Bretz, 1992).
Second, Mortimer and Lorence (1979) showed that initial value differences during the senior
year of college, which constituted the basis for job selection, were amplified by subsequent
processes of occupational socialization i.e., values reinforced by current job rewards influenced
future career moves to maximize the same fulfilling work experiences. Third, these results were
replicated in subsequent longitudinal studies (Johnson, 2001; Johnson & Monserud, 2010;
Johnson & Mortimer, 2011; Lindsay & Knox, 1984). In particular, Johnson and Mortimer (2011)
found that intrinsic and extrinsic work values reported by respondents in their early twenties

16
were predictive of occupational outcomes like salary and intrinsic rewards when they were in
their early thirties.
For skilled workers with multiple job options (e.g., lawyers), the selection and
socialization processes may be manifestations of the gravitational influence of work values i.e.,
over the course of their careers, the extrinsic and intrinsic rewards they seek and perceive in their
jobs may generally correspond to their work values. Higher SCS is expected when work values
and perceived job rewards are congruent (e.g., Gattiker & Larwood, 1988), and goal-setting
theory also posits that fulfilled values promote job satisfaction (Locke & Latham, 2004).
Therefore, high extrinsic and high intrinsic work values are both expected to lead to higher SCS.
Several of the studies in this category also collected salary data (Johnson & Monserud,
2010; Johnson & Mortimer, 2011; Lindsay & Knox, 1984; Mortimer & Lorence, 1979) and they
all reported a positive relationship between extrinsic work values and salary. Together with two
other studies reviewed earlier (Abele & Spurk, 2009b; Frieze et al., 2006), these studies have
made a case for the predictive validity of extrinsic work values on OCS.
The third category of studies echoed themes of the self-determination theory (SDT; Deci
& Ryan, 1985; Ryan & Deci, 2000). According to SDT, extrinsic work values are neither
positive nor negative by themselves; however, an overwhelming emphasis on external rewards
can distract people from intrinsic endeavors. A key distinction between SDT and other
motivational theories is that it does not posit that attainment of voluntary goals will always lead
to positive psychological outcomes; instead, the nature of the goal matters (Ryan, Sheldon,
Kasser, & Deci, 1996). Most of the studies in this category used cross-sectional designs.
Consistent with predictions of the SDT, some studies have shown that higher extrinsic, relative
to intrinsic, work values were associated with negative outcomes such as high negative affect,

17
low positive affect, low vitality, psychological distress, and poor health (e.g., Kasser & Ryan,
1993, 1996; Sheldon & Krieger, 2014). Furthermore, in a post-college sample, those who valued
and attained intrinsic rewards reported significantly higher well-being compared to those who
valued and attained extrinsic rewards (Niemiec, Ryan, & Deci, 2009).
Results pertaining to job satisfaction have been mixed. For instance, one study found a
negative relationship between job satisfaction and need for financial success only among lower-
income participants (Nickerson, Schwartz, Diener, & Kahneman, 2003); in another study
extrinsic work values were positively related to job satisfaction, but only among higher-income
individuals (Malka & Chatman, 2003); and a third study found no relationship between money
orientation and various aspects of job satisfaction (Froese & Xiao, 2012). Several studies
reported positive associations between intrinsic work values and job satisfaction (e.g., Amabile,
Hill, Hennessey, & Tighe, 1994; Moniarou-Papaconstantinou & Triantafyllou, 2015); but there
were also some exceptions (e.g., Drummond & Stoddard, 1994; Knoop, 2004).
According to SDT, the most optimal outcomes are expected when people’s intrinsic
values are relatively stronger than their extrinsic values because intrinsic values are theorized to
allow for greater satisfaction of the basic psychological needs (e.g., Kasser & Ryan, 1996).
Vansteenkiste et al. (2007) argued that inconsistent findings in the literature could be due to
differences in operationalization and advocated for an index of relative importance between
extrinsic and intrinsic values, in place of the absolute importance of each set of values.
Specifically, Vansteenkiste et al. (2007) hypothesized that an extrinsic work-value orientation
(i.e., higher extrinsic, relative to intrinsic, work values) was detrimental to job satisfaction.
Using a Belgian cross-sectional dataset, Vansteenkiste et al. (2007) first regressed job
satisfaction on the control variables and total work values, followed by regressing the residual on

18
extrinsic work values. The results supported their hypothesis; furthermore, contrary to Nickerson
et al. (2003), higher income did not buffer the negative effect of an extrinsic work-value
orientation. Two subsequent cross-sectional studies (Caricati et al., 2015; Sheldon & Krieger,
2014) computed intrinsic work- value orientation by subtracting extrinsic ratings from the
intrinsic ratings. Consistent with the results of Vansteenkiste et al. (2007), intrinsic work-value
orientation and job satisfaction were positively related (Caricati et al., 2015) and income was not
a moderator (Sheldon & Kreiger, 2014). In addition, an intrinsic work-value orientation was
negatively associated with income (Sheldon & Kreiger, 2014).
Synthesis of Literature
On the whole, studies across all three categories generally suggest that intrinsic work
values are positively associated with SCS, whereas extrinsic work values have a positive impact
on OCS. Such consistency is quite encouraging because the studies were quite diverse – they
were motivated by different research questions, recruited different samples, and used different
research methodologies.
However there were also some inconsistent findings. Studies supporting the gravitational
hypothesis suggest that high extrinsic values should contribute positively to SCS, but this was
contradicted by studies supporting SDT. Even studies that took relative importance of extrinsic
and intrinsic values into account have reported conflicting findings e.g., one found a positive
relationship between intrinsic work-value orientation and salary (Bridgstock, 2011) whereas
another found a negative relationship (Sheldon & Kreiger, 2014).
The work-value orientation approach recognizes the possible trade-offs between extrinsic
and intrinsic work values when individuals make career decisions. However it also assumes that
individuals high in extrinsic and intrinsic work values will experience similar outcomes as those

19
with low extrinsic and intrinsic values. This is probably not true across a broader range of
outcomes e.g., the preponderance of evidence reviewed here suggests that the high-extrinsic
group is likely to attain greater OCS than the low-extrinsic group. Moreover, there is evidence
that OCS (Spurk & Abele, 2014) and satisfaction with OCS (Pan & Zhou, 2015; Shockley et al.,
2016; Zhou et al., 2013) are positively associated with SCS. On the other hand, when someone
possesses high extrinsic work values but lower intrinsic work values, the overall relationship
with job satisfaction (an SCS indicator) appears to be negative (Sheldon & Krieger, 2014;
Vansteenkiste et al., 2007).
It is plausible that high extrinsic work values would positively predict SCS if and only if
intrinsic work values are also high. A recent meta-analysis has shown that intrinsic motivation
and extrinsic incentives jointly predict performance (Cerasoli, Nicklin, & Ford, 2014). Because
performance should contribute to career success (Dries, Pepermans, & Carlier, 2008), individuals
with a high-extrinsic, high-intrinsic profile should have higher levels of both OCS and SCS.
On the other hand, high-extrinsic, low-intrinsic (i.e., extrinsic work-value orientation)
individuals may experience OCS to the detriment of SCS. This profile may correspond to the
“(objective) career success, personal failures” label coined by Korman and colleagues (Korman,
1980; Korman et al., 1981). Contrary to the implicit assumption of Vansteenkiste et al. (2007), a
majority of studies suggest that workers with a low-extrinsic, low-intrinsic profile would likely
experience worse career outcomes (i.e., lower OCS and SCS) than those with a high-extrinsic,
high-intrinsic profile. Finally, although one study found that an intrinsic work-value orientation
was negatively associated with OCS (Sheldon & Krieger, 2014), other studies have suggested
that intrinsic work values may, over time, show a positive cross-over effect on extrinsic rewards
like salary (Bridgstock, 2011) and job security (Johnson & Mortimer, 2011). In other words, the

20
high-intrinsic, low-extrinsic profile individuals may eventually attain higher levels of OCS than
those with low-intrinsic, low-extrinsic profiles.
More generally, the studies suggest that extrinsic and intrinsic work values, along with
their interaction, are associated with some important career outcomes. However they provide
little information on the possible forms of the relationships e.g., it is not known if nonlinear
effects are involved. A person-centered approach is suitable for exploring this phenomenon for
two reasons (Bauer & Shanahan, 2007). First, unlike variable-centered methods like polynomial
regression, a person-centered approach does not require nonlinear effects to be specified a priori.
Second, in a regression analysis, ad-hoc decisions are still needed on which configurations of
variables to consider when examining interaction effects and the analysis can get unwieldy when
there are multiple variables and interactions; in a person-centered approach, the identified
profiles would already embody these interactions.
Structure of Present Study
The key premise of the present study is that there may be subgroups of individuals within
the working population who can be stratified according to their work-value profiles, specifically,
the absolute as well as relative levels of their extrinsic and intrinsic work values (i.e., both
quantitative and qualitative differences; Lubke & Muthén, 2005). Furthermore, across the
subgroups, there may be meaningful variation in career success. Therefore, an in-depth and
systematic exploration of these research questions may be well-served by a person-centered,
instead of variable-centered, approach (Pastor, Barron, Miller, & Davis, 2007).
The person-centered approach is not novel to career research. For instance, there have
been several studies on how interest profiles along Holland’s RIASEC dimensions relate to
occupational outcomes (e.g., Rounds, Smith, Hubert, Lewis, & Rivkin, 1999; Wille, Tracey,

21
Feys, & De Fruyt, 2014). In the work value domain, a recent study has identified two “person
types” with distinct job reward - job satisfaction relationships; person type 1 values both
financial security and recognition, whereas person type 2 values only recognition, and the two
types differ in turnover and organizational commitment (Hofmans et al., 2013). However, the
present study appears to be the first to establish distinct intrinsic-extrinsic work-value profiles,
and to relate them to career variables.
Among the existing studies on work values, some of the conflicting results were also
associated with different analytical approaches. When a finding can be replicated across methods,
its validity is greatly enhanced; on the other hand, there is uncertainty when different results arise
from different methods. The variable-centered studies cast the absolute levels of extrinsic and
intrinsic work values as separate predictors and seldom explore their interaction. The work-value
orientation method focuses on relative work values and disregards the absolute levels of work
values. The present study uses a third approach i.e. a person-centered analysis. In order to
compare findings from this study to those from past research, the same dataset was re-analyzed
using the work-value orientation method of Vansteenkiste et al. (2007). This design also allowed
a direct comparison of the pros and cons of both analytic methods.
Hypotheses and Research Questions
The current study uses an inductive approach because there has been no prior research on
work-value profiles. The purpose is to explore the existence of quantitatively and qualitatively
distinct profiles, as indicated by combinations of different levels of intrinsic and extrinsic work
values. Based on literature review, four hypothetical profiles are presented in Table 1.
Because there is no a priori information on the actual number of distinct work-value
profiles (they are latent); the present study is guided by the following general research question:

22
Research Question 1 (RQ1): Are there quantitatively and qualitatively distinct profiles of work
values?
Table 1
Hypothetical Profiles of Intrinsic and Extrinsic Work Values
Intrinsic work values Extrinsic work values
Low High
Low Neither intrinsic nor extrinsic Extrinsic
High Intrinsic Both intrinsic and extrinsic
One way to establish the construct validity of a latent profile variable is to develop a
nomological network with antecedents and outcomes (Wang & Hanges, 2011). Unlike profile
indicators, antecedents and outcomes are auxiliary variables i.e., they are specified in the
analytical model but do not define the profiles (e.g., Asparouhov & Muthén, 2014). Instead,
antecedents can influence the profile indicators and/or the likelihood of individuals being
classified into particular profiles, whereas outcomes are dependent variables associated with
profile membership (Lubke & Muthén, 2005).
In the current study, one category of potential antecedents is socio-demographic factors,
because research has shown that levels of intrinsic and extrinsic work values can vary according
to age, education level, gender, and employment status (e.g., Warr, 2008). There was little
variation in education level within the AJD study sample. With regard to employment status,
lawyers who reported working part-time were excluded because it was difficult to interpret their
salary data. Exclusion of part-timers’ data has been a common practice in career success studies
(e.g., Abele & Spurk, 2009b). Even though lawyers in the AJD study obtained their law degrees

23
and were admitted to the bar at around the same time period, there were significant age
variations. AJD1 lawyers who were more than 36 years old were somewhat different from those
who were younger e.g., they began their legal careers later in life, likely at a time when they
already had a family to support, and they tended to report a higher career satisfaction (Dinovitzer
& Garth, 2007). Furthermore, it is unclear how age interacts with gender to influence work
values (Warr, 2008). Given that age was not a variable of interest in the study, and there was no
straightforward way to statistically control for its effect, only data from lawyers who were under
37 years old at AJD1 were included in the present study.
Gender, on the other hand, is a demographic antecedent of interest. First, two large
studies with representative samples have reported consistent gender differences in work values;
specifically, they found higher intrinsic work values among females, and no gender difference in
extrinsic work values (Marini, Fan, Finley, & Beutel, 1996; Mortimer et al., 1996)3. Second, the
gender by legal practice setting distribution is well-known to be skewed i.e., female lawyers tend
to be employed by the government and smaller law firms that focus on servicing the community
or individuals (jobs with higher intrinsic rewards), whereas male lawyers tend to practice in large
corporate law firms that offer attractive remunerations (e.g., Dinovitzer & Hagan, 2014;
Reichman & Stirling, 2002). Furthermore, male and female lawyers do not have drastically
different career starting points; instead, their career paths just diverge over the life course (Kay &
Hagan, 1995). In addition, practice settings appear to be associated with different job rewards -
lawyers who work in large private law firms have higher income but reported lower career
satisfaction, and the converse was true for lawyers in government jobs (Dinovitzer & Garth,
2007). Also, lawyers with intrinsic work values tend to work in government and public interest
3 Older studies (e.g., Lindsay & Knox, 1984) had reported higher extrinsic work values among males. The change
could have been a result of reduced gender inequality and women’s advancement in occupational status since the
1960s (Marini et al., 1996).
24
organizations (McGill, 2006). Together, these findings are consistent with what the gravitational
hypothesis would suggest i.e., the gender effect on choice of practice setting (and associated job
rewards) are related to gender differences in work values.
The findings above lead to a hypothesis and two further research questions. The
hypothesis and first research question concern whether gender is an antecedent to work-value
profile. The second research question relates to whether work-value profile is associated with
practice setting, and if so, whether this association strengthens over time.
Hypothesis 1 (H1): Females have higher intrinsic work values than males.
RQ2a: Is gender associated with extrinsic work values?
RQ2b: Is gender a covariate of work-value profile membership?
RQ3a: Is work-value profile associated with the practice setting of JDs?
RQ3b: Does the association between work-value profile and practice setting strengthen over time?
If H1 is supported, and the answer to RQ2a is negative, then these results would be
consistent with those of Marini et al. (1996) and Mortimer et al. (1996), as well as provide some
support for the construct validity of the work value scales in the present study.
Another key objective of this study is to explore the association between work-value
profile and career success. Specifically, the study explores the pattern of relationships between
work-value profile and a range of OCS and SCS indicators over three time points. The OCS
indicators include salary, the dominant variable in the OCS literature, and two less prominent
indicators i.e., current position in the organization and supervisory authority.
RQ4: Is work-value profile associated with salary?
RQ5: Is work-value profile associated with position in the organization?
RQ6: Is work-value profile associated with supervisory authority?

25
SCS has frequently been operationalized as career satisfaction. Despite previous concerns
(e.g., Heslin, 2005), the relationship between career satisfaction and SCS appears to be quite
strong (Shockley et al., 2016). Job satisfaction has been another oft-used SCS indicator (e.g.,
Judge et al., 1999). A recent trio of scale construction studies (Pan & Zhou, 2015; Shockley et al.,
2016; Zhou et al., 2013) have identified satisfaction with WLB as yet another key dimension of
SCS. To ensure good coverage of the SCS domain, the present study examines the relationship
between work-value profile and all three SCS indicators.
RQ7: Is work-value profile associated with career satisfaction?
RQ8: Is work-value profile associated with job satisfaction?
RQ9: Is work-value profile associated with WLB satisfaction?
While accumulated work accomplishments can be measured at any point in a person’s
career (Arthur et al., 2005), greater understanding of career success is gained by taking multiple
career snapshots (e.g., Spurk & Abele, 2014). This study uses a dataset from three waves of data
collection over 11 years although some career variables were only measured in two waves.
Therefore, the study also explores the extent to which findings on RQ4 to RQ9 would replicate
over the three waves. Intuitively, there can be quantitative and/or quantitative changes over time.
A quantitative change occurs when work-value profile differences on a career variable observed
at wave 1 increased or decreased without any change in rank order of the profiles at waves 2 and
3. A qualitative change involves either change in rank order or in the overall relationship e.g., the
association between work-value profile and position in the organization may be significant in
mid-career but not in early career.
In addition, the present study also explores the potential career advantages and
disadvantages associated with each profile e.g., the extrinsic work-value profile may consistently

26
exhibit higher salary and lower career satisfaction compared to most other profiles. Recently,
Ganzach and Pazy (2015) argued that temporal changes in validity should be considered when
evaluating the impact of career success antecedents; for instance, they found that whereas the
predictive validity of cognitive ability on salary increased significantly over time, core self-
evaluations only displayed very weak incremental validity. If significant relationships between
work-value profile and career success are identified along with some evidence of incremental
validity, then there is even stronger support for the construct validity of work-value profile.
RQ10: Do the associations between work-value profile and career success indicators change
quantitatively and qualitatively over the course of a career?
RQ11: Do certain work-value profiles consistently display stronger associations with particular
career success indicators?
To summarize, the present study explores if work-value profiles derived using a person-
centered approach would have theoretically important relationships with career variables. The
approach of exploring each career variable separately, instead of trying to model them as
indicators of latent constructs, allows the study to side-step a major constraint in many other
career studies i.e., the trade-off between measurement model fit and coverage of the career
success content domain.
Supplementary Hypotheses and Research Questions
As explained earlier, the same dataset was re-analyzed using the work-value orientation
approach (Vansteenkiste et al., 2007). Overall, studies using this method have consistently found
that an extrinsic, relative to an intrinsic, work-value orientation is negatively associated with
SCS, but its relationship with OCS is unclear, because studies that used the work-value
27
orientation method were mostly SDT-based, where the typical outcomes of interest were well-
being and affective variables (e.g., job satisfaction).
RQ12: What is the relationship between an extrinsic work-value orientation and (a) salary; (b)
position in the organization; and (c) supervisory authority?
H2: An extrinsic work-value orientation is negatively associated with (a) career satisfaction; (b)
job satisfaction; and (c) satisfaction with WLB.
28
Chapter Two
Method
Archival Dataset
This study used an archival dataset from the AJD study (Dinovitzer et al., 2004) which
was conducted by the National Association for Law Placement (NALP) and the American Bar
Foundation (ABF). Because the public access version of the dataset4 does not contain all the
required data, the researcher gained access to the restricted dataset through the ABF (ABF, 2015).
AJD was a longitudinal study designed to follow a sample of all lawyers who were admitted to a
state bar in 2000 and graduated from law school between June 1998 and July 2000 (Dinovitzer et
al., 2004). Data collection via mailed surveys or interviews took place over three waves between
2002 and 2013. The comprehensive surveys covered a range of career and personal details (e.g.,
salary, position, supervisory authority, career satisfaction, job satisfaction, and work-life
balance). Work values were measured only in the first wave of the study.
Administration details and summary results of each AJD survey have been documented
elsewhere (Dinovitzer et al., 2004; Dinovitzer, Nelson, Plichert, Sandefur, & Stirling, 2009;
Garth, Nelson, Donivitzer, & Sandefur, 2014); therefore its methodology will only be briefly
described here. In 2002, a stratified sampling strategy was used to identify an initial pool of
9,192 lawyers. This initial sample was nationally representative, with oversampling of minority
groups. The first wave of data collection (AJD1) started in May 2002 and received valid
responses from 4,538 lawyers. The results provided a snapshot of the early careers and personal
4 The public access version of the dataset, along with the survey codebooks, can be obtained from either ABF or the
Inter-university Consortium for Political Science and Social Research (ICPSR).

29
lives of this cohort about three years after they began practicing law. AJD2 was initiated in May
2007; everyone in the initial pool was invited to participate regardless of whether one had
responded to AJD1. This wave received 3,705 valid responses which served to elucidate the
career progression of lawyers through about seven years in practice. The seventh year marks a
significant milestone in many lawyers’ careers e.g., some lawyers could be made partners in
private law firms at around this time (e.g., Hull & Nelson, 2000). Finally, between May 2012 and
early 2013, participants in AJD1 and/or AJD2 were invited to participate in AJD3. At this point,
the majority of the lawyers were in mid-career, with more than a decade of professional
experience behind them. AJD3 had 2,984 respondents. All in all, a total number of 5,399 lawyers
responded to at least one wave of the AJD study.
The results from the three waves were provided in separate SPSS data files and each AJD
participant was assigned a unique ID to enable linkage of data across time. To date, there have
been about 40 publications based on the AJD dataset. A majority of the studies have focused on
the relationship between gender, race, and SES on practice setting, pay, and job satisfaction. The
researcher was unaware of any published work that investigated work values using the AJD data.
The use of a single-profession, single-cohort sample in the current study conferred at
least three advantages. First, it responded to appeals from scholars to study career preferences
within specific occupational contexts (e.g., Rodrigues, Guest, & Budjanovcanin, 2013). Second,
it added to the diversity of the literature, because oft-cited career success studies tend to involve
managerial samples (e.g., Gattiker & Larwood, 1988, 1989; Greenhaus et al., 1990; Judge et al.,
1995; Kirchmeyer, 1998). Finally, because past studies have shown that both work values and
career outcomes are associated with numerous demographic factors like age, education, and
labor market differences (Ng et al., 2005; Warr, 2008), having a more demographically

30
homogenous sample eases the demand on statistical control, thus boosting power. There are
some inevitable trade-offs. Some of the findings may not generalize to all employees, or even to
lawyers in other cohorts; in addition, range restriction may also be encountered in some
measured variables.
Sample for Present Study
From the total pool of 5,399 lawyers, the researcher selected only cases that responded to
all three waves of the survey and excluded cases who reported working part-time at any wave.
These criteria resulted in a sample of 1,587 lawyers. Next, all cases with missing values on any
of the six work value items were deleted because there was no good way to handle missing data
in LPA (e.g., see Gabriel, Daniels, Diefendorff, & Greguras, 2015; VanKim, Erickson, & Laska,
2015). Standard imputation algorithms are inappropriate for mixture models because there is no
way to preserve profile-specific parameters during the imputation process (Enders, 2013). A
visual inspection of the 533 cases which were excluded as a result of this decision revealed that
the majority of them had multiple missing values on the work value questions. Finally, as
explained earlier, lawyers who reported that they were born prior to 1966 (i.e., age 37 or older in
2002) were excluded, leaving a sample of 905 JDs who were 24 to 36 years old in 2002.
The AJD1 technical addendum (Plickert & Dinovitzer, 2007) provided selected
demographic information (gender, race, and parental education) for all eligible lawyers in the
AJD1 sampling frame (N=32,889), which were compared to those for the sample in the present
study (see Table 2). The gender distribution in the latter was lower than that in the national
eligibility sample. There could be several possible reasons for this difference; one is the well-
established fact that women are more likely to leave legal practice than are men (e.g., Stirling &
Reichman, 2013). The percentage of non-whites in the present sample was higher than that in the
31
national eligibility sample. As stated earlier, the AJD study oversampled minorities. In terms of
parental education, the percentages of mothers and fathers with some postgraduate work or
graduate/professional degree in the present sample were quite comparable to those in the national
eligibility sample.
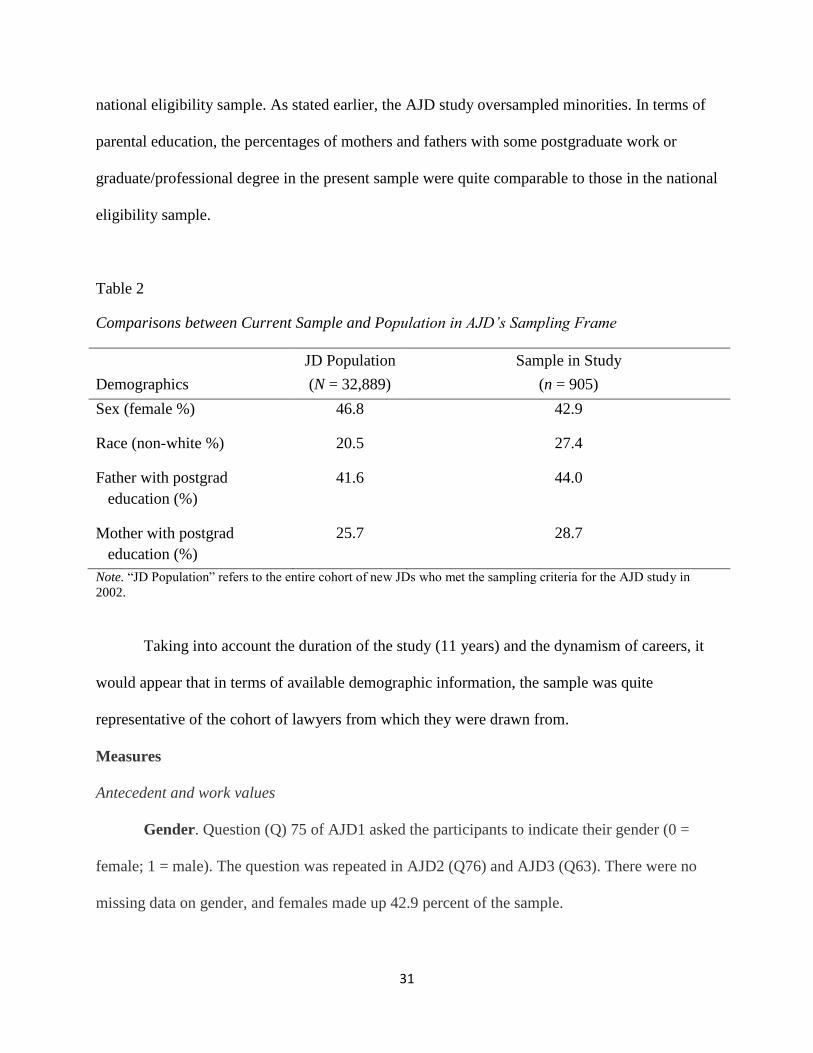
Table 2
Comparisons between Current Sample and Population in AJD’s Sampling Frame
Demographics
JD Population
(N = 32,889)
Sample in Study
(n = 905)
Sex (female %) 46.8 42.9
Race (non-white %) 20.5 27.4
Father with postgrad
education (%)
41.6 44.0
Mother with postgrad
education (%)
25.7 28.7
Note. “JD Population” refers to the entire cohort of new JDs who met the sampling criteria for the AJD study in
2002.
Taking into account the duration of the study (11 years) and the dynamism of careers, it
would appear that in terms of available demographic information, the sample was quite
representative of the cohort of lawyers from which they were drawn from.
Measures
Antecedent and work values
Gender. Question (Q) 75 of AJD1 asked the participants to indicate their gender (0 =
female; 1 = male). The question was repeated in AJD2 (Q76) and AJD3 (Q63). There were no
missing data on gender, and females made up 42.9 percent of the sample.

32
Work values. Measures for extrinsic and intrinsic work values were obtained from Q38
of AJD1. The stem of the question was: “Thinking about the principal types of settings in which
lawyers work (e.g., government, large law firms, business), how important was each of the
following factors in determining the sector in which you began your professional career?”
Participants responded to each factor on a scale of 1 (“Not at all important”) to 7 (“Extremely
important”). Q38 was clearly about what lawyers valued in their work. Nine factors were listed,
two of which concerned debt repayment; contrary to the AJD researchers’ anticipation, these
were rated among the least valued factors (Wilder, 2007). Of the remaining factors, three
reflected extrinsic work rewards (“medium-to-long-term earning potential”; “prestige of the
sector” and “opportunities for future career mobility”), three mirrored intrinsic rewards
(“substantive interest in a specific field of law”, “opportunity to develop specific skills”, and
“opportunity to do socially responsible work”), and one (“potential to balance work and personal
life”) was neither clearly intrinsic nor extrinsic (see Huttges & Fay, 2015).
SPSS Version 22.0 (IBM Corp., 2013) was used to explore scale properties. First, the six
intrinsic and extrinsic work value items were subject to an exploratory factor analysis using the
principal component extraction method with varimax rotation. The number of factors to be
extracted was not pre-specified. Nonetheless, two factors emerged and all six items loaded
significantly (i.e., factor loading larger than .4; Hair, Anderson, Tatham, Black, 1998) on only
the factor that they were anticipated to load on (see Table 3). Factor 1 was labelled “Extrinsic
Work Values” and Factor 2, “Intrinsic Work Values”.

33
Table 3
Factor Loadings from Exploratory Factor Analysis with Varimax Rotation of Intrinsic and
Extrinsic Work Value Items
Item Extrinsic Intrinsic
Substantive interest in a specific field of law .23 .70
Opportunity to develop specific skills .30 .76
Opportunity to do socially responsible work -.21 .80
Medium-to-long-term earning potential .77 -.16
Prestige of the sector .70 .26
Opportunities for future career mobility .78 .23
Next, scale reliability analyses were conducted. The extrinsic and intrinsic work value
scales have coefficient alpha of .65 and 64, respectively. Studies that used brief intrinsic and
extrinsic work value scales have often reported similar alpha values (e.g., Huttges & Fay, 2015;
Malka & Chatman, 2003). In particular, Hirschi (2010) has argued that alphas of brief intrinsic
and extrinsic work value scales would not be high because they measure higher level constructs.
A brief scale can achieve a good alpha by including items that are similar, but it would likely be
a deficient measure of the construct domain (Schmitt, 1996). Such views have been reiterated by
other researchers (e.g., Choi, Kim, Jang, Jung, Ahn, Lee, & Gysbers, 2013).
The extrinsic and intrinsic work value scales in the current study were brief, and yet they
also comprised items tapping on different aspects of the respective constructs; therefore the
lower alpha coefficients might not be a major concern. As expected, there was a small
correlation between extrinsic work values and intrinsic work values (r = .23, p < .01).
A pilot study was conducted to examine the construct-related validity of the extrinsic and
intrinsic work value scales (USF IRB# Pro00025095; see Appendix A). Forty-seven current
graduate students in I/O psychology and individuals with Ph.D. in I/O Psychology or a related
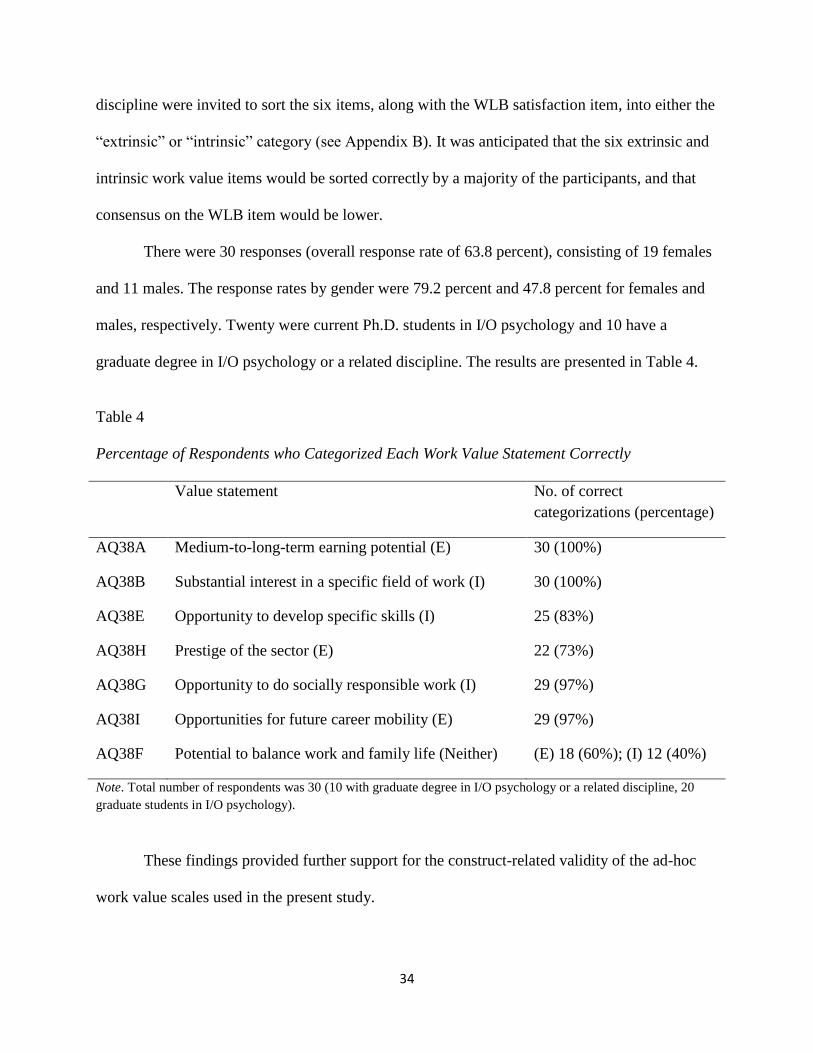
34
discipline were invited to sort the six items, along with the WLB satisfaction item, into either the
“extrinsic” or “intrinsic” category (see Appendix B). It was anticipated that the six extrinsic and
intrinsic work value items would be sorted correctly by a majority of the participants, and that
consensus on the WLB item would be lower.
There were 30 responses (overall response rate of 63.8 percent), consisting of 19 females
and 11 males. The response rates by gender were 79.2 percent and 47.8 percent for females and
males, respectively. Twenty were current Ph.D. students in I/O psychology and 10 have a
graduate degree in I/O psychology or a related discipline. The results are presented in Table 4.
Table 4
Percentage of Respondents who Categorized Each Work Value Statement Correctly
Value statement No. of correct
categorizations (percentage)
AQ38A Medium-to-long-term earning potential (E) 30 (100%)
AQ38B Substantial interest in a specific field of work (I) 30 (100%)
AQ38E Opportunity to develop specific skills (I) 25 (83%)
AQ38H Prestige of the sector (E) 22 (73%)
AQ38G Opportunity to do socially responsible work (I) 29 (97%)
AQ38I Opportunities for future career mobility (E) 29 (97%)
AQ38F Potential to balance work and family life (Neither) (E) 18 (60%); (I) 12 (40%)
Note. Total number of respondents was 30 (10 with graduate degree in I/O psychology or a related discipline, 20
graduate students in I/O psychology).
These findings provided further support for the construct-related validity of the ad-hoc
work value scales used in the present study.

35
Career variables
Practice setting. Responses from relevant questions in AJD (AJD1 Q4 and Q5a, AJD2
Q4 and Q9a, and AJD3 Q4 and Q12a) were used to classify the practice setting of lawyers into
one of the following categories proposed by McGill (2006): (i) large private law firms (more
than 100 lawyers; Dinovitzer & Garth, 2007); (ii) businesses/trade associations/labor unions
(BTLs); (iii) smaller private law firms (100 or fewer lawyers); (iv) government or public interest
(GPI) firms5. It was expected that as one moves from setting (i) to (iv), the job focus shifts from
making profits to providing service to individuals or the society. Consequently, the mix of job
rewards would also differ across settings (McGill, 2006; Sheldon & Krieger, 2014).
Salary. AJD1 Q24 asked about total annual salary including estimated bonus before
taxes in current job. Given that AJD1 began in May 2002, lawyers most likely reported their
anticipated income for calendar year 2002. AJD2 Q95 and AJD3 Q71 asked for a breakdown on
total annual salary components in calendar years 2006 and 2011, respectively. For each year, the
total salary was obtained by summing the component salaries. The AJD1 technical addendum
(Plickert & Dinovitzer, 2007) recoded total annual salary of less than $10,000 to missing6; the
same convention was used when cleaning AJD2 and AJD3 data. As expected, the salary
distributions deviated significantly from normality (positively skewed and leptokurtic).
Current position. At all three waves, lawyers reported their current position with their
employer (AJD1 Q10, AJD2 Q16, and AJD3 Q5). There were numerous response options, and
the options changed over the three waves. There was also an “other (specify)” option which
responses were coded for AJD3 but not for AJD1 and AJD2. In consultation with two JDs, the
5 Among the 4,248 respondents to AJD1 whose practice settings could be inferred, 28.9%, 8.9%, 40.0%, and 22.1%
worked in large law firms, businesses, smaller law firms, and GPI firms, respectively. The corresponding figures in
the current sample were quite similar at 30.3%, 7.9%, 36.1%, and 25.7%, suggesting that the sample was a
reasonably representative subset of the AJD1 respondents. 6 The rationale was that it was unlikely for full-time lawyers to have an annual salary lower than $10k.

36
researcher classified the positions into either “senior position”, “non-senior position” or “cannot
be categorized” (see Table 5). This variable was examined as a binary categorical variable i.e.,
“Not in senior position” (0) vs. “In senior position” (1). Positions that could not be categorized
were recoded as missing data.
Table 5
List of “Current Position” in AJD Sorted into Non-senior Position, Senior Position, and
Positions which Cannot be Categorized
Position category Position
Non-senior Analyst/Advisor
Associate
Contract attorney
Entry-level manager/consultant
Law clerk/senior law clerk/clerk of court/permanent judicial clerk
Law professor (non-tenure track)
Mid-level manager/consultant
Of counsel/counsel
Prosecutor (assistant/deputy)
Public defender (Deputy)
Solo practitioner
Staff attorney
State’s attorney
Student/Fellow
U.S. attorney (Assistant)
Senior Assistant VP/VP/senior VP/executive VP
Attorney general (deputy)
Business owner/operator
Counsel and officer/director/president/VP
Director (deputy/executive/managing)
Elected official (other than judge)
Equity partner/shareholder
Inside/general counsel
Judge
Law professor (tenure track)
Non-equity partner
President/CEO or other official position

37
Table 5 (Continued)
Position category Position
Senior Senior counsel
Senior level manager/consultant
Supervising/managing attorney
Cannot be
categorized
Analyst/Advisor
Associate general counsel/Associate counsel
City attorney/County attorney (Deputy)
Corporate counsel
District attorney (Deputy/Counsel)
Law professor (unclear if tenure-tracked)
Law school/academic administrator
Legal counsel (Assistant/Senior)
Lobbyist/Governmental affairs
Non-elected public official
Other (than law) teacher/lecturer/professor
State’s attorney (assistant)
Senior attorney/Attorney advisor
Senior IP or patent counsel/Patent attorney/IP attorney
Trial attorney/Litigator/Litigation counsel
Supervisory authority. Questions relating to supervisory authority were asked in AJD2
(Q10 and Q11) and AJD3 (Q13 and Q14). Following Dinovitzer (2011), the responses were
coded into an ordinal variable: “No supervisory authority” (1); “Supervisor with limited power”
(2); “Supervisor with full power” (3); and “Supervisor with at least 2 levels below” (4).
Career satisfaction. All three waves of the study included the career satisfaction item
“How satisfied are you with your decision to become a lawyer?” (AJD1 Q30, AJD2 Q46, and
AJD3 Q49a), to which responses could range from extremely dissatisfied (coded as 1) to
extremely satisfied (coded as 5). A single-item overall career satisfaction measure has been used
in several other studies (e.g. Abele, 2003; Abele & Spurk, 2009a; Dubrin, 2001; Valcour &
Tolbert, 2003). Elsewhere, single-item overall job satisfaction measures have been shown to
possess acceptable reliability and convergent validity (Scarpello & Campbell, 1983; Wanous,

38
Reichers, & Hudy, 1997). Furthermore, investigations on measurement invariance of the
Greenhaus et al. (1990) five-item career satisfaction scale have revealed that only the overall
satisfaction item was gender invariant (Hofmans, Dries, & Pepermans, 2008; Spurk, Meinecke,
Kauffeld, & Volmer, 2015).
Job satisfaction. AJD used an ad-hoc job satisfaction scale tailored to legal practice
(AJD1 Q26, AJD2 Q43, and AJD3 Q47). The items varied slightly over the three waves of the
study. One item on compensation was excluded from further analysis because its substantive
content changed over the three waves (from satisfaction with compensation to satisfaction with
method which determined compensation). Participants based their responses on a seven-point
scale (1 = highly dissatisfied; 7 = highly satisfied). Sixteen items were consistently used in all
three surveys. EFAs specified to extract a single factor from responses on the items showed that
only one item (“Opportunities for doing pro-bono work”) had a factor loading that was lower
than .40, and this happened only in AJD1. The item was retained because pro-bono work is a key
aspect of some legal careers (Dinovitzer & Garth, 2009a). The reliability of the scale (α) was
around .90 in all three waves. Some of the items were more relevant to certain practice settings
(e.g., the item on pro-bono work), resulting in numerous “NA” responses or missing data. It was
decided that if a participant provided valid responses to at least ten (i.e., around two-thirds) of
the sixteen items (see Appendix C), the job satisfaction score would be the mean score based on
the items responded to; otherwise it would be coded as missing.
WLB satisfaction. The WLB satisfaction item was actually part of the original job
satisfaction scale in AJD2 (Q43s) and AJD3 (Q47s). Given that WLB has recently been
identified as a key dimension of SCS, the response to this item was analyzed separately. The
39
item (“Balance between personal life and work”) used the same question stem and response
format as those presented in Appendix C.
Control variables
The earlier review on Ng et al., (2005) highlighted four socio-demographic (gender, race
– white vs. non-white, marital status – married vs. unmarried, and age) and two individual
differences variables (cognitive ability, LOC) that have significant meta-analytic relationships
with career success. Specifically, all four socio-demographic variables are related to salary and
career satisfaction, cognitive ability has a significant effect on salary, and LOC influences career
satisfaction. The gender data have been described earlier; descriptions of the other variables are
provided below.
Race. Q76 of AJD1 asked the participants to indicate their race. The question was
repeated in AJD2 (Q77) and AJD3 (Q64). There were no missing data. The responses were
recoded as White (1) vs. non-White (0). Whites made up 72.6 percent of the sample.
Marital status. Participants indicated their marital status through AJD1 Q85, AJD2 Q86,
and AJD3 Q67. There were some missing data - around 1 percent in AJD1 and AJD2, 3 percent
in AJD3. Responses that indicated “married, first time” or “remarried” were code as “1”; all
other responses (excluding missing data) were coded as “0”. The percentages of married lawyers
were 47.3, 70.5, and 76.8 percent in AJD1, AJD2, and AJD3, respectively.
UGPA. Cognitive ability was not measured in AJD. However there was an item on
undergraduate grade point average (UGPA; AJD1 Q48 and AJD2 Q56). A recent study with a
large, representative sample established that the relationship between cognitive ability and self-
reported first-year UGPA was linear (i.e., no support for a curvilinear relationship) and r = .26
(Coyle, 2015). Some studies have also reported a positive effect of UGPA on OCS (e.g., Abele

40
& Spurk, 2009a). Thus, UGPA was used as a control variable. AJD lawyers reported their UGPA
according to eight categories (1 = 3.75-4.00; 2 = 3.50-3.74; 3 = 3.25-3.49; 4 = 3.00-3.24; 5 =
2.75-2.99; 6 = 2.50 – 2.74; 7 = 2.25 – 2.49; 8 = under 2.25). The scores were reverse coded such
that a higher score would correspond to a better GPA. Three percent of the data were missing.
LOC. LOC was measured in AJD2 (Q100) with the scale created by Mirowsky and Ross
(1991; see Appendix D). Sample items are “I am responsible for my own successes” (internal
LOC item) and “Most of my problems are due to bad breaks” (external LOC item). Responses
were made on a seven-point scale (1 = strongly disagree; 7 = strongly agree). The overall LOC
score was computed by first summing the responses to the internal LOC items and subtracting
the responses to the external LOC items, followed by adding 24 to avoid a negative score. The
possible range of score was 0 (extreme external) to 48 (extreme internal). There were 122
missing values (13.5 percent).
Analytic Strategy
Establishing measurement invariance
The potential association between gender and one of the profile indicators (i.e., intrinsic
work values) implied that measurement invariance (MI) might not hold across gender in this
study (Clogg & Goodman, 1985, 1986). Conceptually, MI has been defined as equivalence at
three increasingly stringent levels: configural, metric, and scalar (e.g., Steenkamp &
Baumgartner, 1998). Generally, there is MI in the best-fit model if a LPA covariate (gender in
this study) is not directly related to any of the profile indicators after accounting for profile
membership (e.g., Lubke & Muthén, 2005; McCutcheon & Hagenaars, 1997).
In LPA, MI is usually investigated through the extent to which the dataset satisfies four
conditions (McCutcheon & Hagenaars, 1997). First, the data from the groups are separately
41
analyzed to see if the same number of profiles would emerge from both analyses; if so, the
profiles are further examined for qualitative similarity. These two conditions constitute
configural equivalence.
The next steps are to establish metric and structural equivalence. In factor analysis, latent
factors are often assumed to be on a continuous measurement scale, and metric equivalence is
determined by comparing the factor loadings across groups (e.g., Byrne, 2008). In LPA, there is
no factor loading because the latent profile variable is categorical, but structural equivalence can
be tested directly after imposing metric equivalence through constraining the interaction between
the grouping and latent profile variable to zero (Kankaras & Moors, 2011). Specifically, one
specifies a model where the measurement parameters (i.e., within-profile indicator means,
covariance, and variances) are identical across groups, and compare its log-likelihood (LL) value
to that of a model where the indicator means are freely-estimated (e.g., Collins & Lanza, 2010;
McCutcheon & Hagenaars, 1997). If the LL difference chi-square7 (which degrees of freedom is
determined by the difference in the number of parameters estimated in each model) is not
statistically significant, then there is structural and metric equivalence (third condition); where
the LL difference test yields a significant result, one can attempt to identify the indicators
responsible for non-equivalence (e.g., Kankaras, Moors, & Vermunt, 2010) and determine if MI
exists in a subset of the profiles (partial MI; Collins & Lanza, 2010). Structural and metric
equivalences imply that group membership has no direct effect on any profile indicator.
Finally, one examines whether group membership is a covariate of the latent profile (i.e.,
if membership is related to profile assignment); if it is not, then there is also distributional
homogeneity (fourth condition; McCutcheon & Hagenaars, 1997) and the latent profile variable
would be totally independent of group membership.
7 LL difference chi-sqaure = -2(LLNested model – LL Baseline model)

42
Description of LPA
To recap, the main purpose of the current study were: (i) to explore if there were
unobserved subgroups within the JD sample that exhibited quantitatively or qualitatively distinct
work-value profiles (RQ1); (ii) to evaluate if gender plays a role in assignment to work-value
profile (RQ2); (iii) to assess if individuals with particular work-value profiles would gravitate
toward certain practice settings (RQ3a-b); (iv) to explore the relationships between work-value
profile and various OCS and SCS indicators (RQ4-9); and (v) to appraise if there were
consistency in the patterns of relationships over time (RQ10-11). Two popular exploratory
analytic tools met the needs of the study - cluster analysis and LPA. As stated earlier, LPA was
used, because cluster analysis presents a number of challenges (Speece, 1994). First, they
provide no clear guideline on how to identify the correct number of clusters in the data; (b) their
results are sensitive to measurement scales and distributions, and even to the ordering of cases in
the data; and (c) they involve rigid assumptions (i.e., conditional independence, class-invariant
variances, etc.) which real-life data may not conform to. LPA offers ways to circumvent those
limits while achieving the same goal of cluster analysis (e.g., Fonseca, 2013).
LPA is a latent class analysis (LCA) with continuous (rather than categorical) indicators
of the latent variable. The key objective of LPA is to uncover profiles within a distribution with
unobserved heterogeneity, and to assign each individual in the sample to a profile. The case for a
LPA can be made when M continuous variables observed on n participants are assumed to be the
indicators of an underlying unordered categorical latent profile indicator c, the unobserved group
membership with a finite number (K) of profiles (Muthén, 2001). Within each profile, the M
indicators are assumed to have a multivariate normal distribution; because the overall joint
distribution of the M indicators (i.e., the manifest joint distribution) is a consequence of mixing

43
the K profile distributions, no distributional assumption is made about the manifest distribution
(Masyn, 2013). Conceptually, the K profiles are exhaustive and mutually exclusive such that any
individual in the population inherently belongs to only one of the K profiles (Masyn, 2013).
Like other latent variable models, a LPA model has two components. The measurement
model consists of parameters that describe profile-specific probability distributions of the
indicator variables (means, variances, and covariance); whereas the structural component
specifies the distribution of the latent profile variable in the population (i.e., profile proportions),
as well as the relationships between the latent profile variable and its antecedent and outcome
variables (e.g., Collins & Lanza, 2010).
Unlike cluster analysis, LPA is a model-based approach. It starts with the assumption that
a mixture of population probabilities underlies the observed data; alternative models can then be
specified and compared using various fit statistics (Vermunt & Magidson, 2002). In addition, the
probability of an individual’s membership in a profile can be estimated in the same step as
profile estimation; thereafter, each individual may be classified into a most likely profile but the
classification uncertainty can still be accounted for when relating the latent profiles to other
variables (Hill, Degnan, Calkins, & Keane, 2006). The latter feature is a major improvement
over traditional cluster analysis which only classifies individuals into mutually exclusive types.
In the present study, profile formation (assignment of cases into profiles based on
extrinsic and intrinsic work values; concerns RQ1) was managed independently from the
evaluation of relationships between profile and antecedent/outcome (Bolck, Croon, & Hagenaars,
2004). The researcher first derives the latent profile and obtains parameter estimates of the
measurement model (e.g., mean of indicators in each profile). Individuals are then assigned to
the latent profiles according to their posterior class membership probabilities, which are based on

44
the parameter estimates as well as their patterns of observed responses. Assignment can be made
simultaneously to several profiles with “weights” that reflect the posterior membership
probabilities, or simply to the most likely profile (proportional vs. modal assignment; Vermunt,
2010). The assigned profile is subsequently treated as an observed variable that can be related to
other variables.
Considerations in model specification and evaluation
There are at least four key considerations in LPA model specification and evaluation.
First, in LCA, the correlations between class indicators are assumed to exist because of the
underlying latent classes; once the classes are explicitly modeled, there should no longer be any
relationship between indicators within each class (i.e., local independence; Collins & Lanza,
2010). However, when the profile indicators are continuous, it is unrealistic to expect local
independence, and indicators can be allowed to correlate within profiles. In the present study, the
local independence restriction was relaxed in all analyses.
Second, additional decisions relating to the measurement parameters are required. By
default, LPA allows indicator means to vary across profiles (such variations define the
uniqueness of profiles). However, one can choose to freely estimate or fix the residual
covariances and variances among indicators within each profile to be equal across profiles
(Vermunt & Magidson, 2002). As per the recommendations of Berlin, Williams, & Parra (2014),
the present study first fixed these parameters to be equal across profiles because restrictive
models would converge more readily; the initial solution was then modified by freeing the
parameters one at a time to see how model fit was affected.
Third, LPA is an exploratory method i.e., there is no closed-form solution (Masyn, 2013).
The algorithm searches for the maximum value along a particular LL function in an iterative

45
process. Local optima are often encountered along the LL function and it is necessary to use
several different sets of starting values to help achieve the optimal maximum likelihood solution
(Muthén, 2004). Contemporary LPA softwares do this automatically.
Besides LL, six other fit statistics are typically used to evaluate models: Akaike
information criterion (AIC), Bayesian information criterion (BIC), sample-size-adjusted BIC
(SSA–BIC), Lo-Mendell-Rubin likelihood ratio test (LMR; Lo, Mendell, & Rubin, 2001),
bootstrap likelihood ratio test (BLRT), and entropy. The IC statistics take into account both the
goodness-of-fit and the complexity of a model; LMR and BLRT evaluate whether the current
model significantly improves data fit over the model with one fewer profile, and entropy (which
takes on values between 0 and 1) indicates the extent of separation between profiles. These
indices do not have cut-off scores. According to Foti, Bray, Thompson, and Allgood (2012), the
best model would tend to have the following fit statistics: LL, AIC, BIC, and SSA–BIC values
should be lower in comparison to other profile solutions; LMR and BLRT should be significant
(p < .05); and entropy should be larger in comparison to other profile solutions. The current
study allocated a greater weight to BIC, as this was recommended by several studies (e.g.,
Nylund, Asparouhov, & Muthén, 2007; Roeder & Wasserman, 1997).
Finally, there has been no prior research on the potential number of distinct work-value
profiles. As such, the study started with specifying two latent profiles and increased the number
of profiles until the improvement in model fit could not justify the reduction in parsimony caused
by specifying another latent profile. This inductive approach has been widely utilized in LPA
(Gabriel et al., 2015). The theoretical meaning of solutions should also be considered when
selecting the best profile structure.

46
Treatment of career variables
There were two possible analytic approaches for the career variables. First, a growth
model could be fitted to the continuous career variables to see if the work-value profiles display
distinct career trajectories (e.g., diverse salary trends over time), especially if the trajectories
were known to be linear. However career trajectories are not always linear e.g., salary of U.S.
teachers over time was better described by a curvilinear model (Eubank & Spiegelman, 1990).
Although variables measured at three different occasions could technically be fitted with a
quadratic growth curve (Collins, 2006), the modeling should be supported by theory (Burke,
Shrout, & Bolger, 2007), which was contrary to the exploratory nature of the present study.
The present study thus used a mixture of cross-sectional and longitudinal data exploration
techniques. Specifically, to address RQ3-9, the study treated the dataset as three cross-sectional
blocs. The fact that the timing of AJD1, AJD2, and AJD3 corresponded to significant career
milestones further bolstered the case for this approach.
Analyses
LPA was conducted using Mplus Version 7.4 (Muthén & Muthén, 1998–2015).
Specifically, the R3STEP (Asparahov & Muthén, 2014) and BCH (Bakk, Tekle, & Vermunt,
2013; Bakk & Vermunt, 2016; Vermunt, 2010) modules were used with robust maximum
likelihood (MLR) estimates to cope with non-normal distributions among variables. The two
modules were computationally equivalent and produced exactly the same number of profiles and
classification of individuals. They were used in different analyses because each of them imposed
unique constraints on inputs and outputs.
When exploring the antecedent effect of gender, R3STEP ran a series of multinomial
logistic regressions to assess whether a change in the antecedent would result in a higher

47
probability that a person belonged to one profile over another. R3STEP’s output also contained
information on most-likely profile, which was used in modal assignment.
The relationships between work-value profiles and career variables were examined using
BCH, which avoids latent profile shift through a weighted multiple profile analysis. Specifically,
the measurement errors of the latent profile variable (i.e., classification uncertainty) were saved
as weights and used in subsequent analyses with auxiliary variables i.e., everyone in the sample
contributed a weighted observation to each profile, and the same set of weights was used for all
auxiliary variables (Asparouhov & Muthén, 2015). This was critical for the present study
because it would otherwise not be possible to make valid comparisons across multiple
measurement occasions. Within each cross-sectional bloc, the weighted profile means of each
continuous or binary career variable were compared in a pairwise fashion using Wald tests
(Asparouhov & Muthén, 2014)8, and Bonferroni correction was used to control inflation in Type
1 error. Given that missing data were handled by listwise deletion, different analyses involved
slightly different sample sizes.
Two sets of BCH analyses were used to address RQs concerning the continuous or binary
career variables i.e., RQs 4, 5, 7-9, and they were repeated for each cross-sectional bloc. First,
the profile means were compared. Then, the career variables were regressed on the relevant
control variables (e.g., UGPA for salary; LOC for career satisfaction) and the resulting intercept
values were compared to see if the relationships changed with the inclusion of covariates.
BCH was not used for exploring RQs 3 and 6 (which concerned practice setting and
supervisory authority) because it was not recommended for nominal and ordinal outcome
variables (Bakk & Vermunt, 2016). Therefore, lawyers were assigned to subgroups based on
their most likely profile (i.e., modal assignment), after which classical multi-group statistical
8 Due to how they are computed, these means cannot be compared using normal parametric methods like ANOVA.

48
techniques were used to address RQs 3 and 6. While modal assignment sacrifices a key
advantage of LPA over cluster analysis, it is acceptable if entropy is high (.80 or higher; Clark
and Muthén, 2009). In practice, modal assignment has occasionally been used in studies where
entropy was between .60-.70 (e.g., Wang, Liu, Chatzisarantis, & Lim, 2010).
Variations in practice setting and supervisory authority across work-value profiles were
explored within each cross-sectional bloc; in addition, effect sizes were computed. To address
RQ3a-b, cross-tab analyses were used to explore the dependency between work-value profile and
practice setting. Because supervisory authority (concerns RQ6) was ordinal, the Kruskal-Wallis
test was performed, and the Mann-Whitney U test was used in post-hoc analyses.
The associations between work-value profile and career variables over time were
examined for quantitative and qualitative changes (RQ10). RQ11 was evaluated through whether
certain profiles were consistently related to particular career variables; where significant inter-
profile differences on a career variable showed up on more than one measurement occasion,
regression on the prior measure of the career variable (auto-regression) was used to explore the
incremental validity of the work-value profile construct.
Supplementary Analyses
In the supplementary analyses, the associations between holding an extrinsic, relative to
an intrinsic, work-value orientation and career variables were examined through a series of
multiple linear regression analyses (see Kasser & Ryan, 1993, 1996; Vansteenkiste et al., 2007).
Although this method is more sophisticated than the typical variable-centered approach because
it takes relative work value strengths into account, it still sidesteps the possibility of non-linear
interactions between intrinsic and extrinsic work values. In addition, it disregards the possible
effects of absolute levels of work values.
49
As mentioned earlier, in this method, the control variables (e.g., gender) were entered
into the equation, followed by overall work values (i.e., sum of intrinsic and extrinsic work value
scores); finally, the residual was regressed on extrinsic work values. The overall work values
variable was construed as a control for the possible effect of acquiescence (Vansteenkiste et al.,
2007). These steps would yield an estimate of the effect of an extrinsic, relative to an intrinsic,
work-value orientation on a career variable. They addressed H2 and RQ12.

50
Chapter Three
Results
Descriptive Statistics
The means, standard deviations, and correlations between all study variables (with the
exception of practice setting) are presented in Table 6. All the continuous variables were
approximately normally distributed, with the exception of salary. The salary data distributions
were positively-skewed and leptokurtic and were therefore log-transformed for computations in
this table (untransformed data were used in LPA). The median salaries (not shown in Table 6)
were USD70,500 in 2002, USD109,425 in 2006, and USD140,000 in 2011. The median of
supervisory authority, an ordinal variable, were 2.00 in 2007 and 3.00 in 2012 (not shown in
Table 6); its relationships with other variables were indexed either by Spearman’s ρ (where the
other variable was continuous) or r derived from the Mann-Whitney U test (where the other
variable was binary). Only 3 percent of the JDs were in senior position in 2002; this increased to
24 and 63 percent in 2007 and 2012, respectively. The mean career satisfaction was quite high in
2002, and was even higher in 2012. Job satisfaction appeared to increase from 2002 to 2007, and
remained stable thereafter. WLB satisfaction also seemed to rise marginally from 2007 to 2012.

51
Table 6
Means, SDs and Correlations of Study Variables (n = 905)
Variables 1 2 3 4 5 6 7
1. Intrinsic work value -
2. Extrinsic work value .23** -
3. Gender -.12** .04 -
4. Race -.02 -.01 .15** -
5. Age 2002 .01 -.02 .09** .03 -
6. Age 2007 .01 -.02 .09** .03 1.00 -
7. Age 2012 .01 -.02 .09** .03 1.00 1.00 -
8. Marital status 2002 -.05 .01 .18** .19** .14** .14** .14**
9. Marital status 2007 -.05 .02 .17** .17** .04 .04 .04
10. Marital status 2012 -.06 .00 .17** .16** .01 .01 .01
11. UGPA .01 .05 -.09** .07 -.16** -.16** -.16**
12. LOC .00 .03 -.01 -.00 -.01 -.01 -.01
13. Salary 2002a -.22** .37** .12** -.08* .08* .08* .08*
14. Salary 2006a -.09** .37** .15** -.00 -.02 -.02 -.02
15. Salary 2011a -.09** .25** .17** .04 -.01 -.01 -.01
16. Position 2002 -.03 -.03 .05 .03 -.04 -.04 -.04
17. Position 2007 -.02 .09* .13** .15** .02 .02 .02
18. Position 2012 .02 .17** .05 .08* -.01 -.01 -.01
19. Sup Auth 2007b -.05 .14** .12** .06 .02 .02 .02
20. Sup Auth 2012b -.08* .06 .13** .05 -.04 -.04 -.04
21. Career SAT 2002 .23** .07* .03 -.01 .04 .04 .04
22. Career SAT 2007 .13** .03 .05 .01 .08* .08* .08*
23. Career SAT 2012 .09** .01 .04 .01 .07* .07* .07*
24. Job SAT 2002 .24** -.00 .07* .10** .01 .01 .01
25. Job SAT 2007 .06 -.02 .06 .07* -.01 -.01 -.01
26. Job SAT 2012 .05 .03 .06 .03 -.03 -.03 -.03
27. WLB SAT 2007 .01 -.08* -.03 -.02 .01 .01 .01
28. WLB SAT 2012 -.03 -.07* -.03 -.01 .02 .02 .02
M 14.68 14.30 .57 .73 29.68 34.68 39.68
SD 4.08 4.24 .50 .45 2.49 2.49 2.49
Note. Gender (1 = male; 0 = female); race (1 = white; 0 = non-white); marital status (1 = married; 0 = not married);
UGPA = undergraduate GPA; LOC = locus of control; position (1 = senior; 0 = not senior); Sup Auth = supervisory
authority (1 = no supervisory authority; 4 = supervisor with at least 2 levels below); SAT = satisfaction; WLB =
work-life balance. aLog-transformed salary data.
bSpearman’s ρ or r derived from Mann-Whitney U test presented instead of Pearson’s
correlation.
*p < .05, two-tailed. **p < .01, two-tailed.

52
Table 6 (Continued)
Variables 8 9 10 11 12 13 14
1. Intrinsic work value
2. Extrinsic work value
3. Gender
4. Race
5. Age 2002
6. Age 2007
7. Age 2012
8. Marital status 2002 -
9. Marital status 2007 .49** -
10. Marital status 2012 .33** .61** -
11. UGPA .01 .03 -.02 -
12. LOC .08* .06 .04 .01 -
13. Salary 2002a .05 .06 .07* .16** -.02 -
14. Salary 2006a .07* .12** .07* .15** .01 .68** -
15. Salary 2011a .11** .12** .15** .15** .01 .54** .72**
16. Position 2002 .06 .07* .05 .02 .03 -.12** -.09*
17. Position 2007 .11** .08* .06 -.02 .09* .07 .15**
18. Position 2012 .09* .07 .08* .10** -.01 .23** .32**
19. Sup Auth 2007b .04 .04 .02 .06 -.02 .16** .27**
20. Sup Auth 2012b .11** .08* .09** .09** .03 .15** .22**
21. Career SAT 2002 .02 .06 .08* -.09** .14** -.02 .06
22. Career SAT 2007 .02 .01 .06 -.01 .12** .03 .10**
23. Career SAT 2012 .07 .06 .10** -.01 .12** .04 .08*
24. Job SAT 2002 .11** .10** .13** -.02 .06 -.16** -.04
25. Job SAT 2007 .06 .03 .10** .03 .15** -.08* -.03
26. Job SAT 2012 .04 .05 .09** -.02 .15** .03 .02
27. WLB SAT 2007 .01 .00 .04 -.05 .06 -.11** -.16**
28. WLB SAT 2012 .04 .01 .02 -.08* .00 -.05 -.14**
M .48 .71 .79 - 36.56 11.20 11.63
SD .50 .45 .41 - 5.95 .50 .53

53
Table 6 (Continued)
Variables 15 16 17 18 19 20 21
1. Intrinsic work value
2. Extrinsic work value
3. Gender
4. Race
5. Age 2002
6. Age 2007
7. Age 2012
8. Marital status 2002
9. Marital status 2007
10. Marital status 2012
11. UGPA
12. LOC
13. Salary 2002a
14. Salary 2006a
15. Salary 2011a -
16. Position 2002 -.11** -
17. Position 2007 .17** .16** -
18. Position 2012 .41** -.02 .30** -
19. Sup Auth 2007b .21** .10** .26** .17** -
20. Sup Auth 2012b .31** .02 .19** .33** .41** -
21. Career SAT 2002 .09* .09* .03 -.03 .09* .05 -
22. Career SAT 2007 .13** .04 .06 .08* .08* .02 .50**
23. Career SAT 2012 .16** -.04 .10** .10** .08* .09** .45**
24. Job SAT 2002 .00 .20** .09* .01 .04 .06 .43**
25. Job SAT 2007 .03 .05 .15** .04 .09** .11** .21**
26. Job SAT 2012 .06 .02 .14** .11** .08* .14** .21**
27. WLB SAT 2007 -.11** .02 -.02 -.13** -.23** -.13** .09*
28. WLB SAT 2012 -.16** -.03 -.02 -.07 -.13** -.12** .07
M 11.87 .03 .24 .63 - - 3.89
SD .67 .16 .43 .48 - - 1.08

54
Table 6 (Continued)
Variables 22 23 24 25 26 27 28
1. Intrinsic work value
2. Extrinsic work value
3. Gender
4. Race
5. Age 2002
6. Age 2007
7. Age 2012
8. Marital status 2002
9. Marital status 2007
10. Marital status 2012
11. UGPA
12. LOC
13. Salary 2002a
14. Salary 2006a
15. Salary 2011a
16. Position 2002
17. Position 2007
18. Position 2012
19. Sup Auth 2007b
20. Sup Auth 2012b
21. Career SAT 2002
22. Career SAT 2007 -
23. Career SAT 2012 .57** -
24. Job SAT 2002 .23** .19** -
25. Job SAT 2007 .44** .27** .28** -
26. Job SAT 2012 .24** .43** .27** .34** -
27. WLB SAT 2007 .27** .16** .12** .39** .13* -
28. WLB SAT 2012 .07* .21** .06 .11** .42** .34** -
M 3.97 4.01 4.81 5.27 5.23 5.11 5.35
SD 1.02 1.02 1.04 1.00 1.01 1.69 1.65
The median UGPA category (not shown in Table 6) was 3.25-3.49 - quite high but not
surprising for a sample that subsequently continued their education in law school. There was a
significant relationship between gender and intrinsic work values, r = -.12, p < .01, which
showed that female lawyers reported higher intrinsic work values than males. Therefore H1 was

55
supported. With regard to RQ2a, the correlation between gender and extrinsic work values was
not statistically significant, r = .04, p > .05. No other socio-demographic variables in the study
were associated with either extrinsic or intrinsic work values.
Consistent with past findings, salaries at all three waves of the study were negatively
associated with intrinsic work values and positively associated with extrinsic work values.
Position in the organization hierarchy and supervisory authority - OCS indicators infrequently
used in other studies - showed a trend of being positively related to extrinsic work values.
Intrinsic work values were consistently and positively related to career satisfaction. Besides
showing a small positive relationship with career satisfaction in 2002, extrinsic work values also
displayed a small negative association with WLB satisfaction in 2007 and 2012, suggesting that
the relationship between extrinsic work values and SCS may be complex. Gender (being male)
has a notable positive effect on OCS indicators; so did UGPA. As expected, LOC was positively
correlated with career and job satisfaction.
The rank-order stability of salary was moderate to high, r = .68 between 2002 and 2006, r
= .72 between 2006 and 2011, and r = .54 between 2002 and 2011; so was the rank-order
stability in career satisfaction, r = .50 between 2002 and 2007, r = .57 between 2007 and 2012,
and r = .45 between 2002 and 2012. Comparatively, the rank-order stability of job satisfaction
was lower, with correlations ranging from .27 to .34. The p-values for all of the above
correlations were lower than .01. The correlation between career satisfaction and WLB
satisfaction was small, r = .27, p < .01 and r = .21, p < .01 in 2007 and 2012 respectively;
Shockley et al. (2016) also reported a small to moderate relationship between career satisfaction
and personal life satisfaction.

56
In the first seven years of a lawyer’s career, the relationship between salary and senior
position was quite weak and inconsistent (r = -.12, p < .01 in 2002; r = .15, p < .01 in 2007),
although the linkage strengthened significantly in mid-career (r = .41 in 2012). The relationship
between salary and supervisory authority was moderate, r = .27, p < .01 in 2007 and r = .31, p
< .01 in 2012. These results reaffirmed the approach to examine these variables separately
instead of modeling them as indicators of a latent OCS construct. The positive correlations
among the SCS indicators were stronger and consistent, ranging from r = .21 to .44, all p-values
< .01, at all three waves of the study.
A higher salary was associated with a lower job satisfaction (r = -.16, p < .01) in 2002; in
2007 higher salary was associated with higher career satisfaction (r = .10, p < .01) but lower
WLB satisfaction (r = -.16, p < .01) and similar results emerged in 2012 (r = .16, p < .01 with
career satisfaction and r = -.16, p < .01 with WLB satisfaction). Senior position has a significant
though small relationship with career satisfaction in 2002 (r = .09, p < .05) and 2012 (r = .10, p
< .01); it also has a significant association with job satisfaction at all three waves of the study (r
= .20, p < .01; r = .15, p < .01; and r = .11, p < .01 in 2002, 2007, and 2012, respectively).
Supervisory authority, which was only measured in 2007 and 2012, was positively associated
with both career satisfaction (r = .08, p < .05 in 2007 and r = .09, p < .01 in 2012) and job
satisfaction (r = .09, p < .01 in 2007 and r = .14, p < .01 in 2012); however it also has a negative
relationship with WLB satisfaction (r = -.23, p < .01 in 2007 and r = -.12, p < .01 in 2012).
Collectively, these results showed that with a more comprehensive set of career success
indicators, particularly the inclusion of WLB satisfaction, the relationship between OCS and SCS
might be weaker than Ng et al.’s (2005) meta-analytic estimate (ρ = .3) which was based on
studies measuring salary and career satisfaction only.
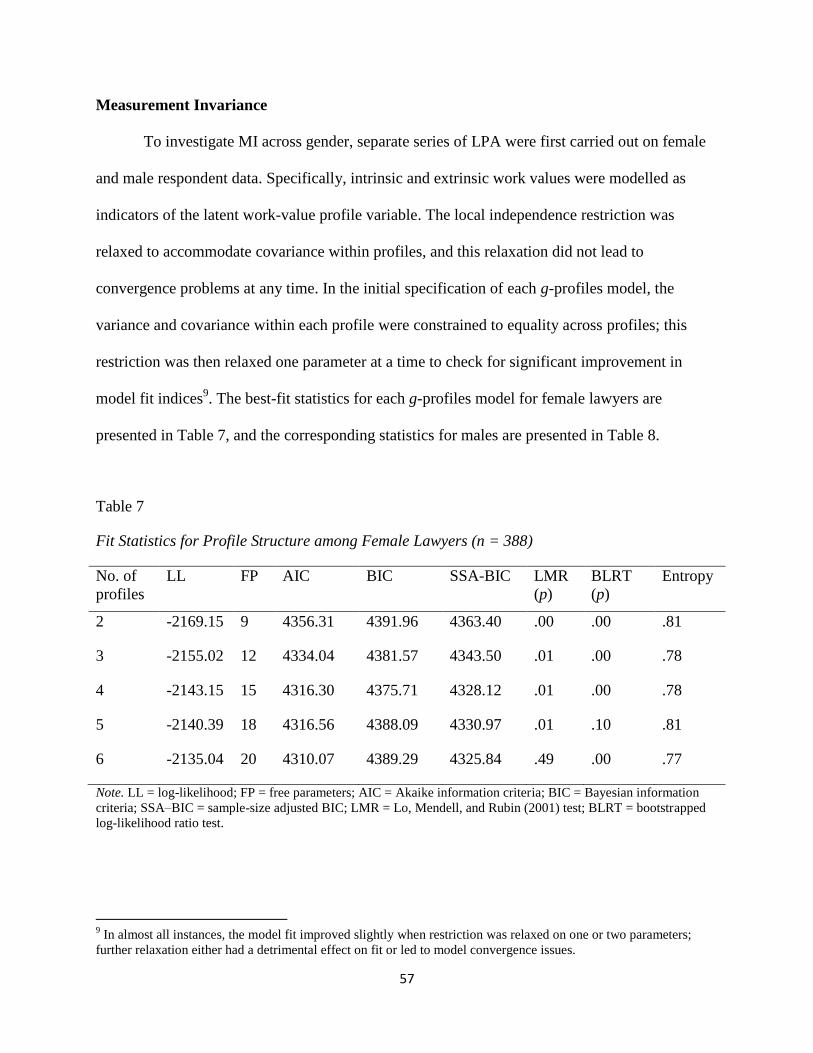
57
Measurement Invariance
To investigate MI across gender, separate series of LPA were first carried out on female
and male respondent data. Specifically, intrinsic and extrinsic work values were modelled as
indicators of the latent work-value profile variable. The local independence restriction was
relaxed to accommodate covariance within profiles, and this relaxation did not lead to
convergence problems at any time. In the initial specification of each g-profiles model, the
variance and covariance within each profile were constrained to equality across profiles; this
restriction was then relaxed one parameter at a time to check for significant improvement in
model fit indices9. The best-fit statistics for each g-profiles model for female lawyers are
presented in Table 7, and the corresponding statistics for males are presented in Table 8.
Table 7
Fit Statistics for Profile Structure among Female Lawyers (n = 388)
No. of
profiles
LL FP AIC BIC SSA-BIC LMR
(p)
BLRT
(p)
Entropy
2 -2169.15 9 4356.31 4391.96 4363.40 .00 .00 .81
3 -2155.02 12 4334.04 4381.57 4343.50 .01 .00 .78
4 -2143.15 15 4316.30 4375.71 4328.12 .01 .00 .78
5 -2140.39 18 4316.56 4388.09 4330.97 .01 .10 .81
6 -2135.04 20 4310.07 4389.29 4325.84 .49 .00 .77
Note. LL = log-likelihood; FP = free parameters; AIC = Akaike information criteria; BIC = Bayesian information
criteria; SSA–BIC = sample-size adjusted BIC; LMR = Lo, Mendell, and Rubin (2001) test; BLRT = bootstrapped
log-likelihood ratio test.
9 In almost all instances, the model fit improved slightly when restriction was relaxed on one or two parameters;
further relaxation either had a detrimental effect on fit or led to model convergence issues.

58
Among female lawyers, there were progressive and consistent improvements in fit from
the two-profile to four-profile model; BIC was lowest for the four-profile model, and both the
LMR (p < .05) and BLRT (p < .01) statistics also showed that it was a significant improvement
over the three-profile model. The BLRT statistic indicated that the five-profile model was not
better than the four-profile one (p > .05); its BIC was also higher. The LMR statistic for the six-
profile model clearly indicated that it offered no improvement over the five-profile model
(p > .05). Therefore, a four-profile model appeared to provide the best fit for data from female
lawyers.
Table 8
Fit Statistics for Profile Structure among Male Lawyers (n = 517)
No. of
profiles
LL FP AIC BIC SSA-BIC LMR
(p)
BLRT
(p)
Entropy
2 -2850.38 10 5720.75 5763.23 5731.49 .00 .00 .80
3 -2834.02 13 5694.04 5749.27 5708.00 .03 .00 .82
4 -2827.41 15 5684.83 5748.55 5700.94 .01 .00 .78
5 -2822.36 18 5680.72 5757.19 5700.05 .04 .00 .74
6 -2819.17 21 5680.34 5769.55 5702.89 .28 .20 .77
Note. LL = log-likelihood; FP = free parameters; AIC = Akaike information criteria; BIC = Bayesian information
criteria; SSA–BIC = sample-size adjusted BIC; LMR = Lo, Mendell, and Rubin (2001) test; BLRT = bootstrapped
log-likelihood ratio test.
Similar to results from the female lawyers, the four-profile model was clearly better than
the three-profile one among the male lawyers (lower BIC, statistically significant LMR and
BLRT), and the six-profile model was evidently worse than the five-model one. Although the
LMR (p < .05) and BLRT (p < .01) statistics suggested that the five-profile model might offer

59
improvement over the four-profile one, BIC implied otherwise. When two models are both
plausible and there is no strong theoretical justification for either, the analyst should choose the
more parsimonious model (Masyn, 2013). Therefore the four-profile model was selected.
In summary, the results showed that a four-profile model fitted both groups i.e., there was
no compelling evidence of different configurations of profiles existing within male and female
lawyers. This satisfied the first condition for MI. Next, the indicator means within each profile
were plotted for each gender (see Figure 1).
Figure 1. Work-Value Profiles among Female and Male Lawyers

60
The work-value profiles were highly similar across gender, except for a small disparity in
Profile #1, where the mean extrinsic work values was visibly higher than the mean intrinsic work
values among female lawyers, whereas they were about the same among male lawyers. On the
whole, the second condition for MI was met and configural MI was established.
Next, to assess structural equivalence, a series of four-profile models was specified for
both male and female lawyers in a multiple group analysis. Specifically, the fit of a restricted
(nested) model where indicator means of corresponding profiles were specified to be equal
across gender was compared to that of a baseline model where all means were freely-estimated
in males and females (Muthén & Muthén, 1998-2015). The LL difference test statistic was not
significant, χ2(8, N = 905) = 13.85, p > .05, and therefore provided no support for non-MI across
gender. Thus, structural equivalence (and metric equivalence) was established, and the data from
male and female respondents were pooled for further analyses.
Profile Configuration
To investigate the profile configuration in the entire sample of 905 lawyers and to
determine whether gender was associated with profile assignment, a series of LPA was
performed using the R3STEP module in Mplus. Briefly, in Step 1, the best-fit k-profile model
was determined (unconditional LPA; Masyn, 2013); in Step 2, each respondent was assigned to a
profile and the classification uncertainty (posterior membership probabilities) for each
assignment was computed; in Step 3, the effect of gender was estimated using the information
from Steps 1 and 2.
The results are presented in Table 9. Almost all the fit indices (with the exception of LL
which does not take model parsimony into account) supported a five-profile model; in particular,
it has the lowest BIC and both the LMR and BLRT statistics were significant (p < .01), implying

61
that it was an improvement over the four-profile model. The six-profile model had a higher BIC
and did not offer significant improvement over the five-profile model (the p-values of both the
LMR and BLRT statistics were greater than .05), and the seven-profile model was clearly worse
than the six-profile one.
Table 9
Fit Statistics for Profile Structure with Gender Modelled as Covariate (n = 905)
No. of
profiles
LL FP AIC BIC SSA-BIC LMR
(p)
BLRT
(p)
Entropy
2 -5034.45 10 10088.90 10136.98 10105.22 .00 .00 .75
3 -5010.09 12 10044.18 10101.87 10063.76 .00 .00 .81
4 -4993.60 15 10017.21 10089.33 10041.69 .00 .00 .69
5 -4984.64 17 10003.28 10085.01 10031.02 .00 .00 .77
6 -4976.74 20 9993.77 10089.64 10026.12 .06 .05 .75
7 -4973.76 23 9992.95 10103.54 10030.49 .49 .50 .72
Note. LL = log-likelihood; FP = free parameters; AIC = Akaike information criteria; BIC = Bayesian information
criteria; SSA–BIC = sample-size adjusted BIC; LMR = Lo, Mendell, and Rubin (2001) test; BLRT = bootstrapped
log-likelihood ratio test.
The emergence of an additional profile over earlier results where a four-profile model
was the best fit for both the male and female data was not necessarily an anomaly. First, in those
analyses, the five-profile model also appeared plausible, especially among male lawyers. Second,
it was possible that a small distinct subgroup in the population had been detected due to higher
power of the combined sample (Lubke, 2010). To examine if the five-profile model was indeed
an extension of the four-profile model, the indicator means within each profile were plotted
(Figure 2). Profiles 2-5 were very similar to the male and female profile configurations in Figure

62
1. Furthermore, the first profile, comprising of lawyers who reported low extrinsic as well as low
intrinsic work values, was also the smallest group (see Table 10).
Figure 2. Work-Value Profiles in Entire Sample
In addition, the first profile was theoretically relevant as it was expected to display the
lowest level of OCS and SCS relative to the other profiles. These observations strongly implied
that the series of LPA (i.e., first by gender, then overall) have yielded consistent results and the
five-profile solution was indeed a highly similar but more detailed description of the overall
dataset compared to those derived from gender-based analyses.

63
Table 10
Means, Standard Errors, and Profile Proportions in Final Latent Profile Model
Latent profile
Mean intrinsic
work value (SE)
Mean extrinsic
work value (SE)
Number (percentage
of sample)
1. Neither Intrinsic nor Extrinsic
(NIE)
5.08 (.52) 4.26 (.45) 26 (2.9%)
2. Moderately Intrinsic and
Extrinsic (MIE)
9.38 (.77) 10.49 (.62) 67 (7.4%)
3. Highly Intrinsic (HI) 17.00 (.36) 7.49 (.37) 83 (9.2%)
4. Highly Intrinsic, also Extrinsic
(HI[E])
16.37 (.40) 13.26 (.29) 274 (30.3%)
5. Highly Extrinsic, also Intrinsic
(HE[I])
14.68 (.19) 17.57 (.17) 455 (50.3%)
Note. Both the intrinsic and extrinsic work value scores ranged from 3 to 21.
The answer to RQ1 was therefore affirmative - quantitatively and qualitatively distinct
work-value profiles did exist. The following is a brief description of each profile:
Profile 1. This profile consisted of lawyers who reported low intrinsic and extrinsic work
values (x̄intrinsic = 5.08; x̄extrinsic = 4.26) and shall be labeled “neither intrinsic nor extrinsic” (NIE).
Twenty-six of the 905 lawyers (2.9 percent) were assigned to this profile.
Profile 2. Sixty-seven lawyers (7.4 percent of sample) who reported a moderate level of
intrinsic and extrinsic work values (x̄intrinsic = 9.38; x̄extrinsic = 10.49) were assigned to this profile.
It shall be labeled “moderately intrinsic and extrinsic” (MIE).
Profile 3. This profile comprised eighty-three lawyers (9.2 percent of sample) with high
intrinsic work values and low to moderate levels of extrinsic work values (x̄intrinsic = 17.00;
x̄extrinsic = 7.49). It shall be labeled “highly intrinsic” (HI).

64
Profile 4. This profile has a similar level of intrinsic values as the highly intrinsic profile;
however it also exhibited moderately high extrinsic values (x̄intrinsic = 16.37; x̄extrinsic = 13.26), and
shall be labeled “highly intrinsic, also extrinsic” (HI[E]). Two hundred and seventy-four lawyers
(30.3 percent of sample) were assigned to this profile.
Profile 5. About half of the total sample (455 lawyers; 50.3 percent) belonged to this
profile, which was characterized by a high level of extrinsic work values and moderately high
intrinsic work values (x̄intrinsic = 14.68; x̄extrinsic = 17.57). It was essentially the inverse of Profile 4
and shall be labeled “highly extrinsic, also intrinsic” (HE[I]).
The entropy of the five-profile solution was .77, indicating that good separation existed
between the profiles. To investigate some of the RQs in the present study, the sample needed to
be partitioned according to their most likely profiles, without regard for classification uncertainty
(i.e., modal assignment). Good entropy is a necessary condition for modal assignment (Clark &
Muthén, 2009).
LPA assigned each individual to a most likely profile based on his/her posterior
membership probabilities (i.e., to the profile with the highest posterior probability). As explained
earlier, posterior membership probabilities provided information on classification uncertainty.
The average posterior membership probabilities for each profile are presented in Table 11. For
instance, the first row in Table 11 shows that among lawyers assigned to the NIE profile, the
average posterior probability for NIE was .94, and their probability of belonging to either HI[E]
or HE[I] was zero. The diagonals in Table 11 inform us about the homogeneity within profiles
e.g., NIE (average probability of .94) was the most homogenous, followed by HE[I] (average
probability of .89); MIE (average probability of .74) was, relatively, the least homogenous.

65
Table 11
Average Latent Profile Probabilities for Most Likely Latent Profile Membership (Row) by Latent
Profile (Column)
NIE MIE HI HI[E] HE[I]
NIE .94 .05 .01 .00 .00
MIE .05 .74 .04 .15 .02
HI .01 .03 .86 .09 .00
HI[E] .00 .06 .04 .79 .11
HE[I] .00 .01 .00 .10 .89
Note. NIE = Neither Intrinsic nor Extrinsic; MIE = Moderately Intrinsic and Extrinsic; HI = Highly Intrinsic; HI[E]
= Highly Intrinsic, also Extrinsic; HE[I] = Highly Extrinsic, also Intrinsic. Bold figures are the average posterior
membership probabilities associated with each profile.
Association between Gender and Profile Assignment
Multinomial logistic regression analyses (implemented in R3STEP) showed that gender
was significantly associated with profile assignment: (i) given membership in either NIE or HI,
male lawyers were more likely to be in NIE than were female lawyers (z = 2.63, p = .009); (ii)
given membership in either MIE or HI, male lawyers were more likely to be in MIE than were
female lawyers (z = 2.26, p = .024); (iii) given membership in either HE[I] or HI, male lawyers
were more likely to be in HE[I] than were female lawyers (z = 3.03, p = .002). These findings
addressed RQ2b i.e., gender was a covariate of the latent work-value profile. Specifically, it was
associated with how lawyers were assigned to the profiles.
Preparation of Data for Further Analyses
Because entropy was quite good, a modally-assigned dataset was derived to explore RQs
involving categorical or ordinal variables i.e., RQ3 (practice setting) and RQ6 (supervisory
authority). The number of lawyers within each profile is shown in the fourth column of Table 10.

66
The proportionally-assigned dataset (which took classification uncertainty into account)
were used for RQs involving binary or continuous variables i.e., RQs 4, 5, 7-9. In these analyses,
the Mplus BCH module was first used to classify the respondents into profiles and generate the
weights associated with the classification; these weights were then used to explore the above
RQs and the relationships across measurement occasions (RQ10 and RQ11). The weights were
invariant across analyses because they were generated using the same input (i.e., intrinsic and
extrinsic work value scores measured in AJD1). For each career variable, two sets of results are
presented: one without, and the other with, the covariates.
Practice Setting
The modally-assigned dataset was used to address RQ3, which concerned whether work-
value profile was associated with practice setting. The distributions of lawyers in each practice
setting by profile in 2002, 2007, and 2012 are presented in Table 12.
The bottom of the table shows the total number of lawyers in each setting for each year.
Although there were some missing data in each wave of the study, their proportions were quite
small and should therefore not invalidate longitudinal comparisons. Between 2002 and 2007, a
large number of lawyers departed large law firms, and a similarly large number joined BTLs.
There was also a noticeable outflow from smaller law firms and inflow to GPI firms, but not at
the same scale. These trends continued between 2007 and 2012, although the switches in practice
settings were more moderate.

67
Table 12
Distribution of Lawyers - Profile by Practice Setting in 2002, 2007, and 2012
Year Profile Number in practice setting (proportion of profile) Total
GPI firm Smaller law firm
(<=100 lawyers)
BTL Large law firm
(>100 lawyers)
2002 NIE 5 (.20) 18 (.72) 1 (.04) 1 (.04) 25
MIE 11 (.16) 31 (.46) 6 (.09) 19 (.28) 67
HI 49 (.59) 24 (.29) 4 (.05) 6 (.07) 83
HI[E] 116 (.43) 97 (.36) 19 (.07) 40 (.15) 272
HE[I] 51 (.11) 155 (.34) 41 (.09) 207 (.46) 454
2007 NIE 6 (.23) 16 (.62) 3 (.12) 1 (.04) 26
MIE 21 (.32) 19 (.29) 15 (.23) 10 (.15) 65
HI 48 (.61) 21 (.27) 4 (.05) 6 (.08) 79
HI[E] 111 (.41) 92 (.34) 37 (.14) 28 (.10) 268
HE[I] 68 (.15) 135 (.31) 114 (.26) 125 (.28) 442
2012 NIE 7 (.29) 13 (.54) 4 (.14) 0 (.00) 24
MIE 23 (.36) 19 (.30) 13 (.20) 9 (.14) 64
HI 51 (.61) 21 (.25) 5 (.06) 6 (.07) 83
HI[E] 112 (.41) 86 (.33) 43 (.16) 23 (.09) 264
HE[I] 82 (.19) 143 (.32) 135 (.30) 84 (.19) 444
Total (2002) 232 (.26) 325 (.36) 71 (.08) 273 (.30) 901
Total (2007) 254 (.29) 283 (.32) 173 (.20) 170 (.19) 880
Total (2012) 275 (.31) 282 (.32) 200 (.23) 122 (.14) 879
Note. NIE = Neither Intrinsic nor Extrinsic; MIE = Moderately Intrinsic and Extrinsic; HI = Highly Intrinsic; HI[E]
= Highly Intrinsic, also Extrinsic; HE[I] = Highly Extrinsic, also Intrinsic; GPI = Government or Public Interest
firm; BTL = Business, Trade Association, or Labor Union.
To address RQ3a, a crosstab analysis was performed to explore if practice setting was
independent of work-value profile. Because the expected frequencies in some cells were fewer
than 5, Pearson chi-square test would be inappropriate; instead, a Fisher’s exact test using Monte
Carlo approximation involving 10,000 draws was used to estimate the exact significance level.

68
Results showed that practice setting was not independent of work-value profile in 2002 (p <
0.001), although the effect size was moderate10
, λ = .17. The finding was replicated in 2007 (p <
0.001; λ = .08) and 2012 (p < 0.001; λ = .10). The reduction in the value of λ from 2002 to 2007
suggested that in early career, there was a greater concentration of lawyers with certain profiles
in particular practice settings, but subsequent career movements have resulted in a relatively
more even distribution of lawyers with different profiles. However lawyers with certain profiles
still tended to be employed in particular settings in mid-career, because λ was still significant
then; in fact the effect was greater at 2012 than at 2007.
The practice setting by profile plots are presented in Figures 3.1 (2002), 3.2 (2007), and
3.3 (2012). These figures were based on data in Table 12.
Figure 3.1. Plot of Practice Setting by Profile Distribution in 2002
10
Lambda is a conservative effect size estimate (e.g., Folz, 1996), so the actual effect sizes were probably higher.
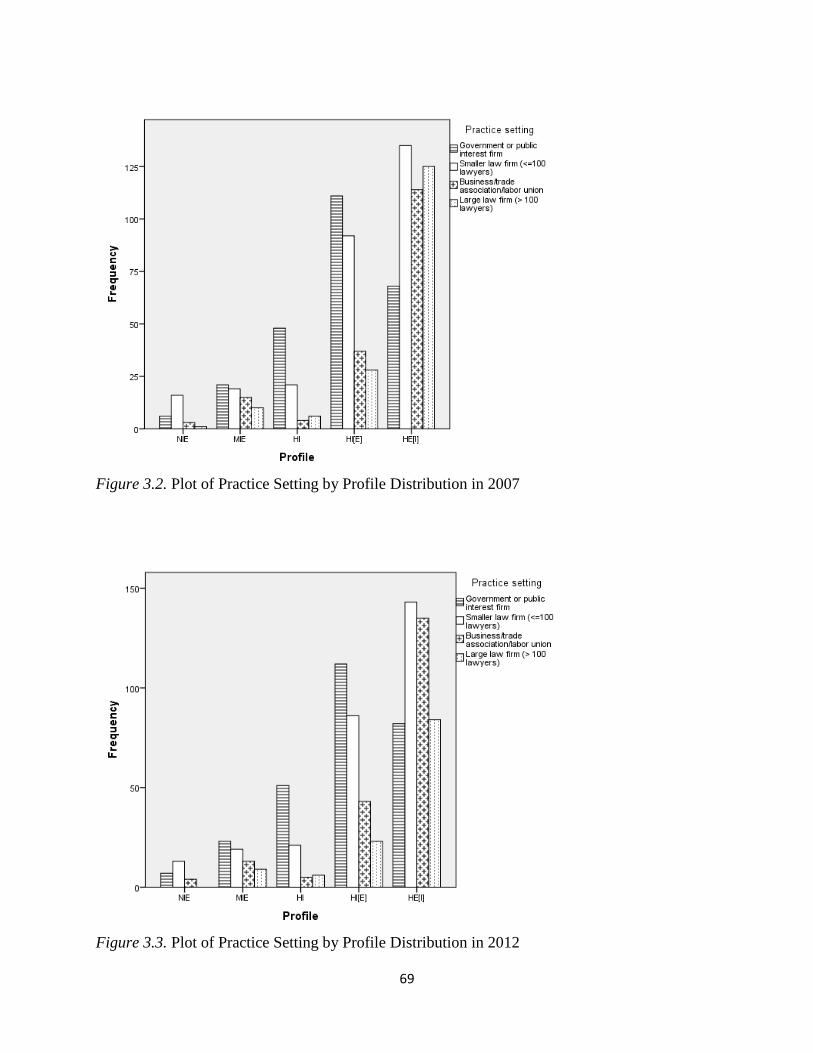
69
Figure 3.2. Plot of Practice Setting by Profile Distribution in 2007
Figure 3.3. Plot of Practice Setting by Profile Distribution in 2012

70
The association between work-value profile and practice setting evolved over time, and
the changes were more pronounced between 2002 and 2007. In the NIE profile, the major change
over time appeared to be a switch from smaller law firms to BTLs. In 2002, the mode in the MIE
profile was smaller law firm, followed by large law firm; in 2007, the largest number was in the
GPI setting. The HI profile exhibited the greatest stability in terms of the relative number of
lawyers in each setting - the rank order of the four settings did not change from 2002 to 2012.
Within the HI[E] profile, the smallest number of lawyers worked in BTLs in 2002; however by
2007 the smallest number was in large law firms. Setting switches were most numerous in the
HE[I] profile; in 2002 the mode was large law firm with the smallest number of lawyers in BTLs;
by 2007, a quarter were in the latter setting and by 2012, lawyers in BTLs and smaller law firms
dominated the HE[I] profile.
In summary, although there were some common trends across profiles, each of the
profiles has also displayed a unique pattern of practice setting changes over time. The exodus of
the HE[I] lawyers from large law firms between 2002 and 2007 probably played a significant
role in the decrease in value of λ during the same period.
Although there were changes over time, there was also evidence of stability. An
overwhelming majority of lawyers with the NIE profile had stayed within smaller law firms or
GPI firms from early to mid-career; by 2012, none was in a large law firm. A similar trend was
observed in the HI profile; however, unlike the NIE profile, its biggest group was in GPI firms
(consistently around 60 percent). Furthermore, on all three measurement occasions, the
proportion of HI lawyers in BTLs and large law firms (the “money jobs”; Sheldon & Krieger,
2014; also see Dinovitzer & Hagan, 2014) never exceeded 13%, although those who were
already in these jobs had stayed on.
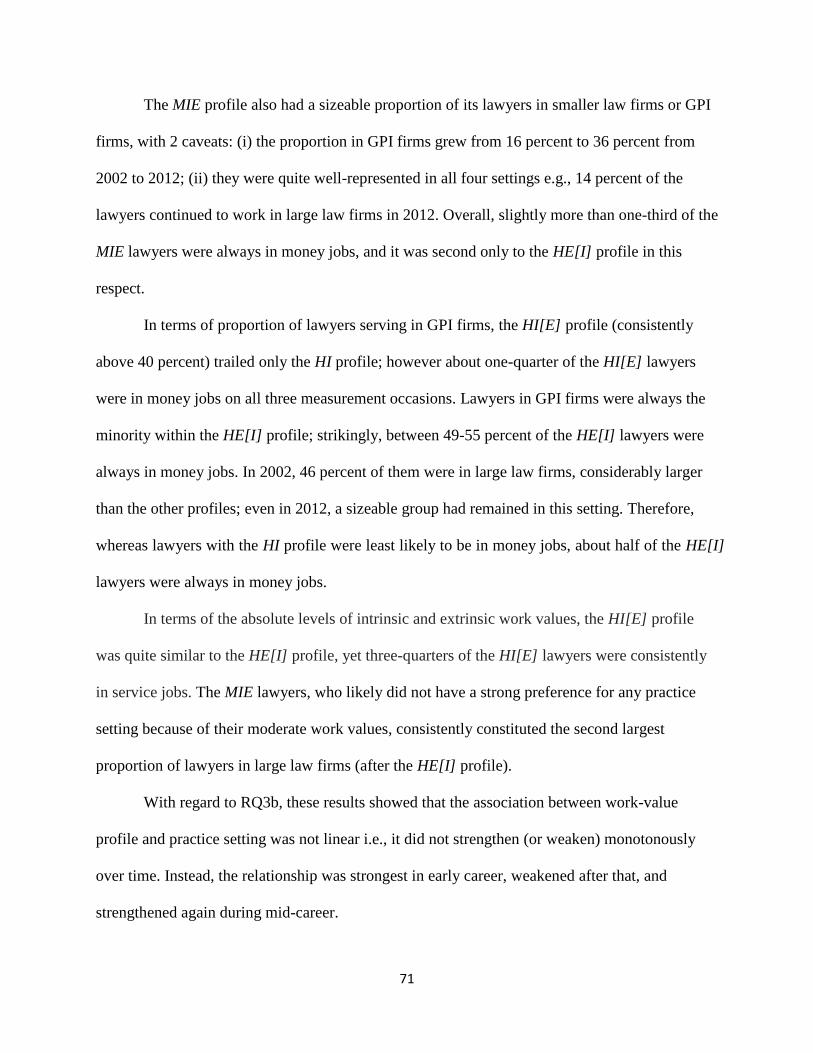
71
The MIE profile also had a sizeable proportion of its lawyers in smaller law firms or GPI
firms, with 2 caveats: (i) the proportion in GPI firms grew from 16 percent to 36 percent from
2002 to 2012; (ii) they were quite well-represented in all four settings e.g., 14 percent of the
lawyers continued to work in large law firms in 2012. Overall, slightly more than one-third of the
MIE lawyers were always in money jobs, and it was second only to the HE[I] profile in this
respect.
In terms of proportion of lawyers serving in GPI firms, the HI[E] profile (consistently
above 40 percent) trailed only the HI profile; however about one-quarter of the HI[E] lawyers
were in money jobs on all three measurement occasions. Lawyers in GPI firms were always the
minority within the HE[I] profile; strikingly, between 49-55 percent of the HE[I] lawyers were
always in money jobs. In 2002, 46 percent of them were in large law firms, considerably larger
than the other profiles; even in 2012, a sizeable group had remained in this setting. Therefore,
whereas lawyers with the HI profile were least likely to be in money jobs, about half of the HE[I]
lawyers were always in money jobs.
In terms of the absolute levels of intrinsic and extrinsic work values, the HI[E] profile
was quite similar to the HE[I] profile, yet three-quarters of the HI[E] lawyers were consistently
in service jobs. The MIE lawyers, who likely did not have a strong preference for any practice
setting because of their moderate work values, consistently constituted the second largest
proportion of lawyers in large law firms (after the HE[I] profile).
With regard to RQ3b, these results showed that the association between work-value
profile and practice setting was not linear i.e., it did not strengthen (or weaken) monotonously
over time. Instead, the relationship was strongest in early career, weakened after that, and
strengthened again during mid-career.

72
Salary
RQ4 concerned whether work-value profile was associated with salary. In the analyses,
the mean salary in each year associated with each profile was computed. The profile means were
first compared pairwise using Wald test; next, the means were regressed on their covariates
(identified through bivariate correlations in Table 6) and the resulting intercepts were again
compared. Bonferroni correction was used to compensate for Type 1 error inflation arising from
multiple comparisons. The same general approach was also applied to later analyses involving
seniority, career satisfaction, job satisfaction, and WLB satisfaction.
In 2002, the mean salaries of HE[I] and MIE lawyers were not significantly different, but
they were both significantly higher than those of NIE, HI, and HI[E] lawyers (see Table 13.1).
Next, the covariates (gender, race, age, and UGPA) were added to the analyses one at a time. The
significant relationships remained even after controlling for the effects of all these covariates
(see Table 13.2).
Table 13.1
Mean Salaries in 2002, Standard Errors, and Pairwise Comparisons (n = 873)
Profile Results of pairwise mean comparisons a
1 2 3 4 5
1. NIE -
2. MIE 10.82* -
3. HI .70 18.18** -
4. HI[E] .13 11.21** 2.23 -
5. HE[I] 68.76** 4.90 136.88** 95.92** -
Mean 57, 987.00 87,184.00 53,200.00 59,896.00 104,102.00
SE 4,681.00 7,062.00 3,211.00 2,790.00 3,002.00
N 23 64 81 260 445 Note. NIE = Neither Intrinsic nor Extrinsic; MIE = Moderately Intrinsic and Extrinsic; HI = Highly Intrinsic; HI[E]
= Highly Intrinsic, also Extrinsic; HE[I] = Highly Extrinsic, also Intrinsic. a
Chi-square values (df = 1) are presented; significant differences are in bold; *p < .05; **p <. 01 (with Bonferroni
correction).
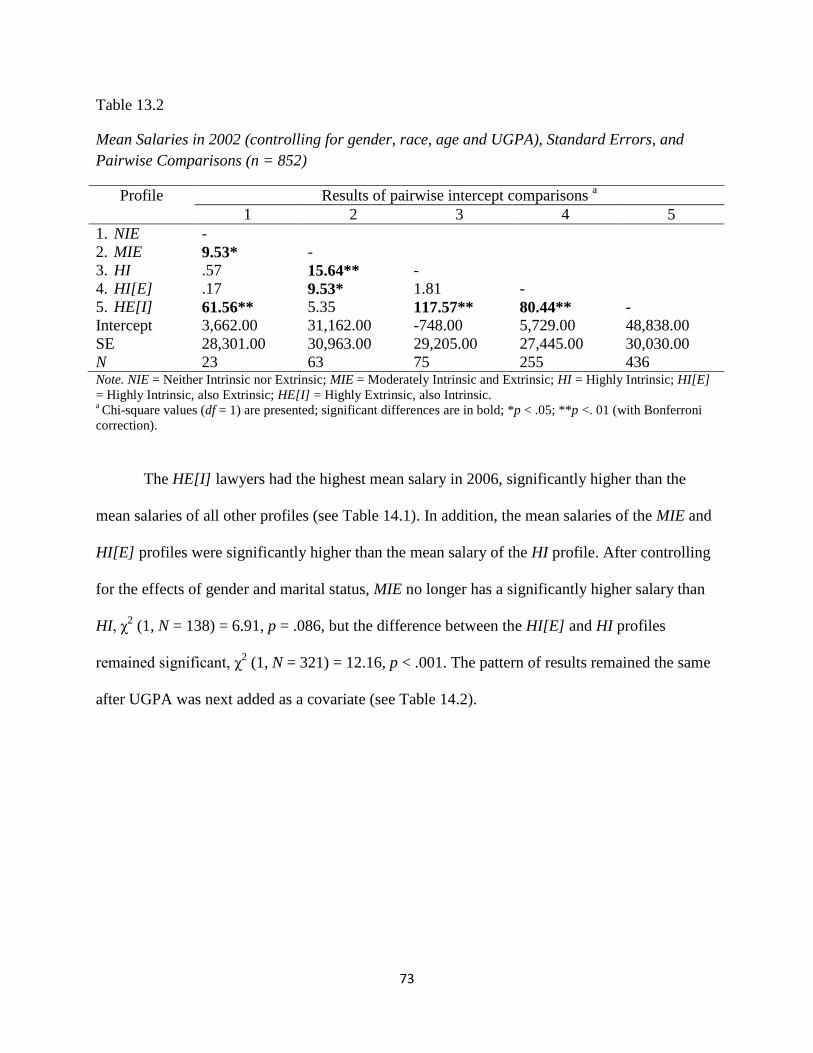
73
Table 13.2
Mean Salaries in 2002 (controlling for gender, race, age and UGPA), Standard Errors, and
Pairwise Comparisons (n = 852)
Profile Results of pairwise intercept comparisons a
1 2 3 4 5
1. NIE -
2. MIE 9.53* -
3. HI .57 15.64** -
4. HI[E] .17 9.53* 1.81 -
5. HE[I] 61.56** 5.35 117.57** 80.44** -
Intercept 3,662.00 31,162.00 -748.00 5,729.00 48,838.00
SE 28,301.00 30,963.00 29,205.00 27,445.00 30,030.00
N 23 63 75 255 436 Note. NIE = Neither Intrinsic nor Extrinsic; MIE = Moderately Intrinsic and Extrinsic; HI = Highly Intrinsic; HI[E]
= Highly Intrinsic, also Extrinsic; HE[I] = Highly Extrinsic, also Intrinsic. a Chi-square values (df = 1) are presented; significant differences are in bold; *p < .05; **p <. 01 (with Bonferroni
correction).
The HE[I] lawyers had the highest mean salary in 2006, significantly higher than the
mean salaries of all other profiles (see Table 14.1). In addition, the mean salaries of the MIE and
HI[E] profiles were significantly higher than the mean salary of the HI profile. After controlling
for the effects of gender and marital status, MIE no longer has a significantly higher salary than
HI, χ2 (1, N = 138) = 6.91, p = .086, but the difference between the HI[E] and HI profiles
remained significant, χ2 (1, N = 321) = 12.16, p < .001. The pattern of results remained the same
after UGPA was next added as a covariate (see Table 14.2).

74
Table 14.1
Mean Salaries in 2006, Standard Errors, and Pairwise Comparisons (n = 820)
Profile Results of pairwise mean comparisons a
1 2 3 4 5
1. NIE -
2. MIE 2.96 -
3. HI 2.78 10.15* -
4. HI[E] 4.73 0.00 13.70** -
5. HE[I] 82.43** 26.85** 169.64** 29.70** -
Mean 89,135.00 108,242.00 76,777.00 108,724.00 159,324.00
SE 6,010.00 8,682.00 4,236.00 6,834.00 4,858.00
N 23 60 78 244 415 Note. NIE = Neither Intrinsic nor Extrinsic; MIE = Moderately Intrinsic and Extrinsic; HI = Highly Intrinsic; HI[E]
= Highly Intrinsic, also Extrinsic; HE[I] = Highly Extrinsic, also Intrinsic. a
Chi-square values (df = 1) are presented; significant differences are in bold; *p < .05; **p <. 01 (with Bonferroni
correction).
Table 14.2
Mean Salaries in 2006 (controlling for gender, marital status and UGPA), Standard Errors, and
Pairwise Comparisons (n = 796)
Profile Results of pairwise intercept comparisons a
1 2 3 4 5
1. NIE -
2. MIE 2.15 -
3. HI 1.81 6.25 -
4. HI[E] 5.98 0.16 12.72** -
5. HE[I] 76.15** 28.32** 100.22** 31.58** -
Intercept 63,642.00 80,016.00 51,976.00 84,760.00 132,272.00
SE 32,383.00 34,626.00 28,864.00 35,387.00 33,411.00
N 23 59 72 238 404 Note. NIE = Neither Intrinsic nor Extrinsic; MIE = Moderately Intrinsic and Extrinsic; HI = Highly Intrinsic; HI[E]
= Highly Intrinsic, also Extrinsic; HE[I] = Highly Extrinsic, also Intrinsic. a
Chi-square values (df = 1) are presented; significant differences are in bold; *p < .05; **p <. 01 (with Bonferroni
correction).
In 2011, the HE[I] profile was again associated with a significantly higher mean salary
relative to all the other profiles (see Table 15.1). The pattern of results did not change after
controlling for the effects of gender and marital status; however, after UGPA was added, the
difference between the HI[E] and HE[I] profiles became insignificant (see Table 15.2).
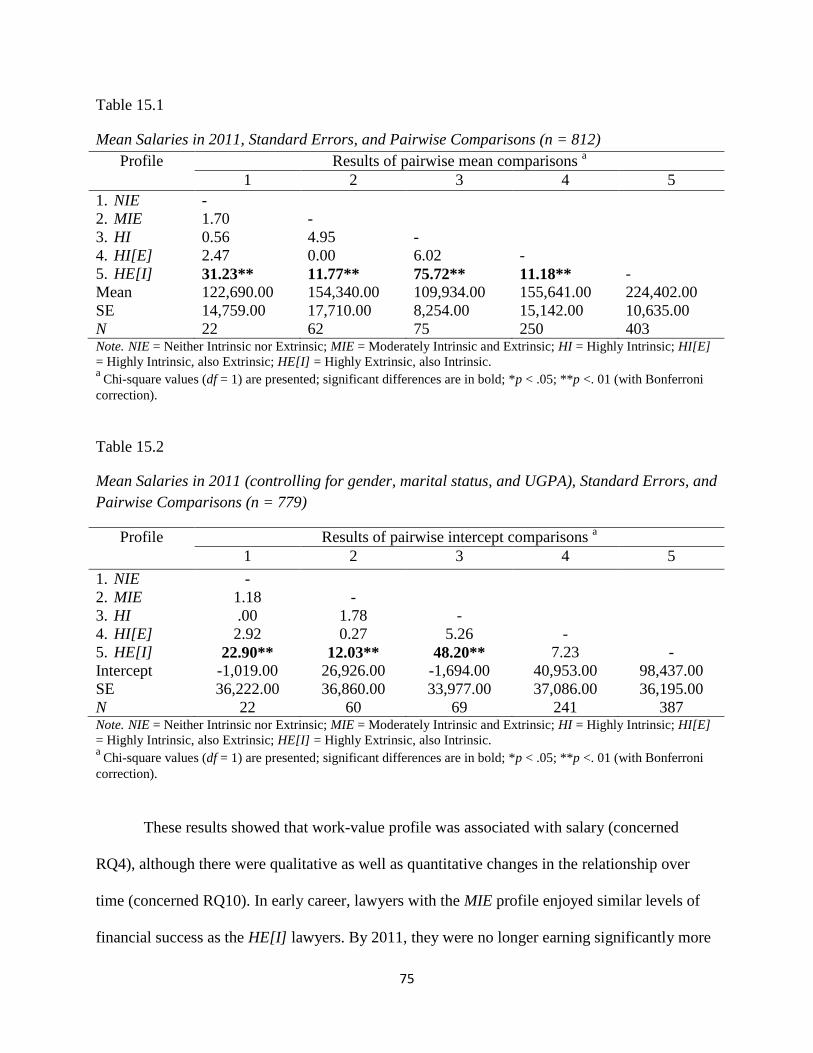
75
Table 15.1
Mean Salaries in 2011, Standard Errors, and Pairwise Comparisons (n = 812)
Profile Results of pairwise mean comparisons a
1 2 3 4 5
1. NIE -
2. MIE 1.70 -
3. HI 0.56 4.95 -
4. HI[E] 2.47 0.00 6.02 -
5. HE[I] 31.23** 11.77** 75.72** 11.18** -
Mean 122,690.00 154,340.00 109,934.00 155,641.00 224,402.00
SE 14,759.00 17,710.00 8,254.00 15,142.00 10,635.00
N 22 62 75 250 403 Note. NIE = Neither Intrinsic nor Extrinsic; MIE = Moderately Intrinsic and Extrinsic; HI = Highly Intrinsic; HI[E]
= Highly Intrinsic, also Extrinsic; HE[I] = Highly Extrinsic, also Intrinsic. a
Chi-square values (df = 1) are presented; significant differences are in bold; *p < .05; **p <. 01 (with Bonferroni
correction).
Table 15.2
Mean Salaries in 2011 (controlling for gender, marital status, and UGPA), Standard Errors, and
Pairwise Comparisons (n = 779)
Profile Results of pairwise intercept comparisons a
1 2 3 4 5
1. NIE -
2. MIE 1.18 -
3. HI .00 1.78 -
4. HI[E] 2.92 0.27 5.26 -
5. HE[I] 22.90** 12.03** 48.20** 7.23 -
Intercept -1,019.00 26,926.00 -1,694.00 40,953.00 98,437.00
SE 36,222.00 36,860.00 33,977.00 37,086.00 36,195.00
N 22 60 69 241 387 Note. NIE = Neither Intrinsic nor Extrinsic; MIE = Moderately Intrinsic and Extrinsic; HI = Highly Intrinsic; HI[E]
= Highly Intrinsic, also Extrinsic; HE[I] = Highly Extrinsic, also Intrinsic. a
Chi-square values (df = 1) are presented; significant differences are in bold; *p < .05; **p <. 01 (with Bonferroni
correction).
These results showed that work-value profile was associated with salary (concerned
RQ4), although there were qualitative as well as quantitative changes in the relationship over
time (concerned RQ10). In early career, lawyers with the MIE profile enjoyed similar levels of
financial success as the HE[I] lawyers. By 2011, they were no longer earning significantly more
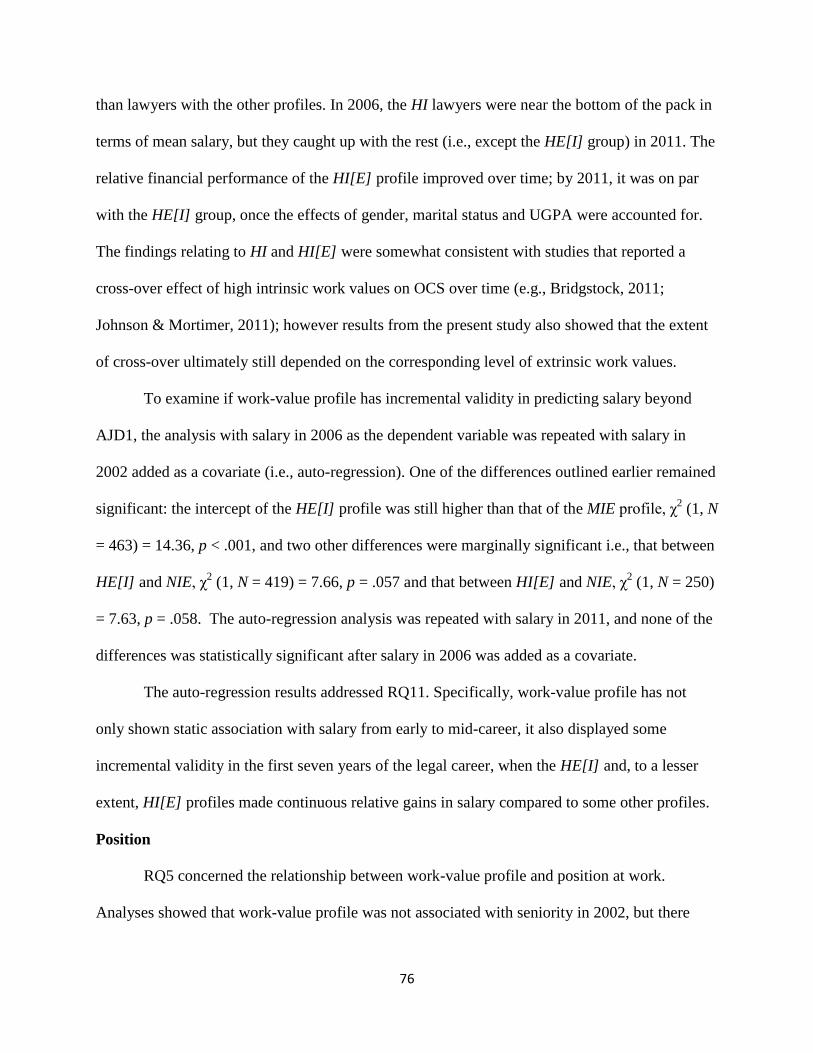
76
than lawyers with the other profiles. In 2006, the HI lawyers were near the bottom of the pack in
terms of mean salary, but they caught up with the rest (i.e., except the HE[I] group) in 2011. The
relative financial performance of the HI[E] profile improved over time; by 2011, it was on par
with the HE[I] group, once the effects of gender, marital status and UGPA were accounted for.
The findings relating to HI and HI[E] were somewhat consistent with studies that reported a
cross-over effect of high intrinsic work values on OCS over time (e.g., Bridgstock, 2011;
Johnson & Mortimer, 2011); however results from the present study also showed that the extent
of cross-over ultimately still depended on the corresponding level of extrinsic work values.
To examine if work-value profile has incremental validity in predicting salary beyond
AJD1, the analysis with salary in 2006 as the dependent variable was repeated with salary in
2002 added as a covariate (i.e., auto-regression). One of the differences outlined earlier remained
significant: the intercept of the HE[I] profile was still higher than that of the MIE profile, χ2 (1, N
= 463) = 14.36, p < .001, and two other differences were marginally significant i.e., that between
HE[I] and NIE, χ2 (1, N = 419) = 7.66, p = .057 and that between HI[E] and NIE, χ
2 (1, N = 250)
= 7.63, p = .058. The auto-regression analysis was repeated with salary in 2011, and none of the
differences was statistically significant after salary in 2006 was added as a covariate.
The auto-regression results addressed RQ11. Specifically, work-value profile has not
only shown static association with salary from early to mid-career, it also displayed some
incremental validity in the first seven years of the legal career, when the HE[I] and, to a lesser
extent, HI[E] profiles made continuous relative gains in salary compared to some other profiles.
Position
RQ5 concerned the relationship between work-value profile and position at work.
Analyses showed that work-value profile was not associated with seniority in 2002, but there

77
was a floor effect - out of 778 lawyers whose seniority could be inferred, only 21 were in a
senior position (2.7 percent). This was because the lawyers were generally in the early career
stage. In 2007, 190 out of 797 lawyers had reached senior positions (23.8 percent). There was
only one significant result from the pairwise comparisons; a greater proportion of HE[I] lawyers
were in senior positions compared to HI[E] lawyers (OR = 1.29 p < .001). In 2012, 468 out of
746 lawyers were in senior positions (62.7 percent), and lawyers with the HE[I] profile have
higher odds of being in senior positions than the HI (OR = 2.94, p = .01) and HI[E] (OR = 2.21,
p < .001) lawyers. Because seniority was a binary variable, covariates could not be factored into
this particular analysis.
This set of results further illustrated the distinct advantage associated with the HE[I]
profile with regard to OCS indicators (concerned RQ11). In terms of the absolute levels of
extrinsic and intrinsic work values, the HE[I] and HI[E] profiles would appear more similar to
each other than to the NIE and MIE profiles (see Figure 2), yet they were associated with
contrasting odds of being in a senior position. The results suggested that high intrinsic work
values could be detrimental to attainment of senior positions, except when the level of extrinsic
work values was even higher. A variable-centered approach would have missed this insight.
Supervisory Authority
To address RQ6, the Kruskal-Wallis test was conducted on the modally-assigned dataset
to compare the five work-value profiles using their mean ranks on four levels of supervisory
authority (1 = no supervisory authority; 2 = limited supervisory authority; 3 = full supervisory
authority; 4 = has at least 2 levels below). In 2007, the test results were significant, χ2
(4, N = 801)
= 17.48, p = .002; with a mean rank supervisory score of 390.79 for NIE, 344.31 for MIE, 346.72
for HI, 383.04 for HI[E], and 431.71 for HE[I]. Post-hoc Mann-Whitney U tests with Bonferroni
correction indicated that supervisory authority was significantly higher for HE[I] (mean rank =

78
236.22) than for MIE (mean rank = 185.77), U = 9441.00, p = .04. Supervisory authority was
also significantly higher for HE[I] (mean rank = 245.15) than for HI (mean rank = 194.44), U =
11851.50, p = .002. In mid-career, there was no evidence that level of supervisory authority
differed according to work-value profile, χ2
(4, N = 901) = 5.12, p = .276.
Results showed that supervisory authority (as operationalized in the current study) was
not a reliable indicator for comparing OCS across groups because it was sensitive to career stage.
There appeared to be a ceiling effect by mid-career i.e., given enough time, most lawyers would
take on some substantial supervisory responsibility. However, the 2007 results were still helpful
as they showed that on average, HE[I] lawyers attained greater supervisory power sooner than
lawyers with the other profiles. This complemented earlier findings related to salary and senior
position, and further illustrated that the HE[I] profile was qualitatively different from (superior
to) the other profiles in terms of its association with OCS.
Career Satisfaction
RQ7 concerned the relationship between work-value profile and career satisfaction. For
the 2002 data, pairwise comparisons with Bonferroni correction yielded two significant results
(see Table 16.1) - the mean career satisfaction of the HE[I] and HI[E] profiles were both
significantly higher than that of the MIE profile.
Adding UGPA as a covariate did not alter this pattern of results, but when LOC was also
added to the analysis, the difference in mean career satisfaction between HE[I] and MIE became
statistically insignificant, χ2
(1, N = 431) = 7.70, p = .055, whereas the difference between HI[E]
and MIE remained significant, χ2
(1, N = 431) = 9.23, p = .024 (see Table 16.2).
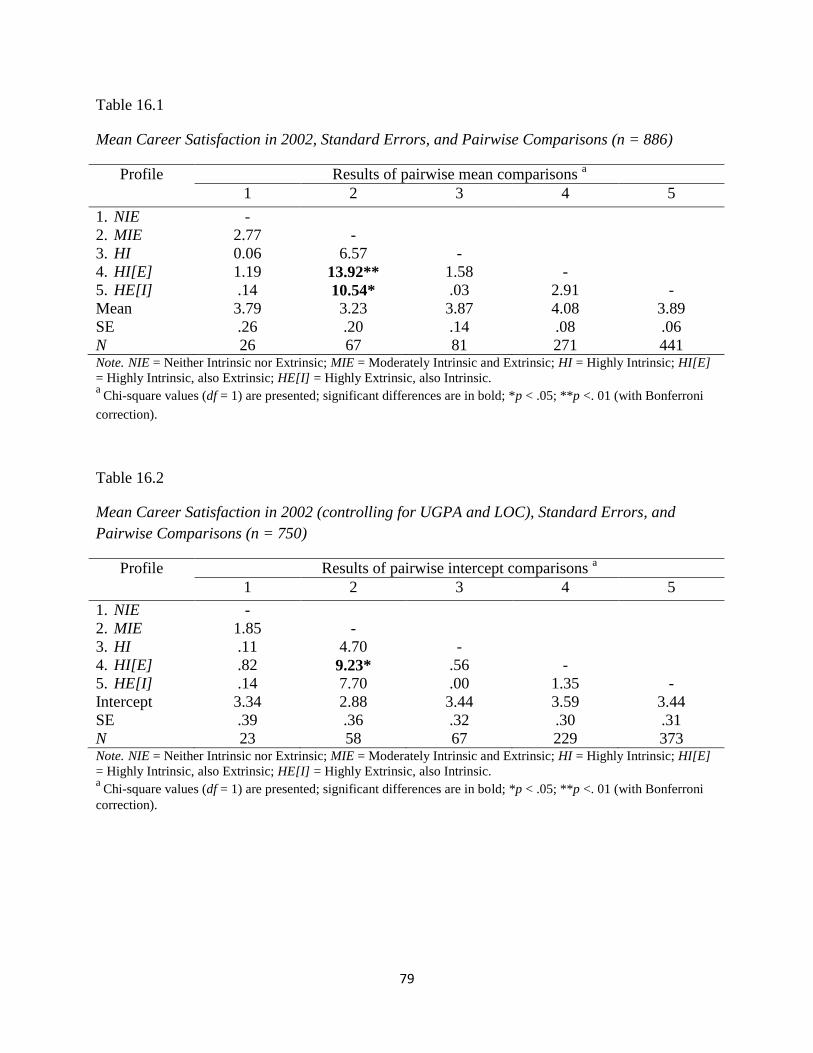
79
Table 16.1
Mean Career Satisfaction in 2002, Standard Errors, and Pairwise Comparisons (n = 886)
Profile Results of pairwise mean comparisons a
1 2 3 4 5
1. NIE -
2. MIE 2.77 -
3. HI 0.06 6.57 -
4. HI[E] 1.19 13.92** 1.58 -
5. HE[I] .14 10.54* .03 2.91 -
Mean 3.79 3.23 3.87 4.08 3.89
SE .26 .20 .14 .08 .06
N 26 67 81 271 441 Note. NIE = Neither Intrinsic nor Extrinsic; MIE = Moderately Intrinsic and Extrinsic; HI = Highly Intrinsic; HI[E]
= Highly Intrinsic, also Extrinsic; HE[I] = Highly Extrinsic, also Intrinsic. a
Chi-square values (df = 1) are presented; significant differences are in bold; *p < .05; **p <. 01 (with Bonferroni
correction).
Table 16.2
Mean Career Satisfaction in 2002 (controlling for UGPA and LOC), Standard Errors, and
Pairwise Comparisons (n = 750)
Profile Results of pairwise intercept comparisons a
1 2 3 4 5
1. NIE -
2. MIE 1.85 -
3. HI .11 4.70 -
4. HI[E] .82 9.23* .56 -
5. HE[I] .14 7.70 .00 1.35 -
Intercept 3.34 2.88 3.44 3.59 3.44
SE .39 .36 .32 .30 .31
N 23 58 67 229 373 Note. NIE = Neither Intrinsic nor Extrinsic; MIE = Moderately Intrinsic and Extrinsic; HI = Highly Intrinsic; HI[E]
= Highly Intrinsic, also Extrinsic; HE[I] = Highly Extrinsic, also Intrinsic. a
Chi-square values (df = 1) are presented; significant differences are in bold; *p < .05; **p <. 01 (with Bonferroni
correction).
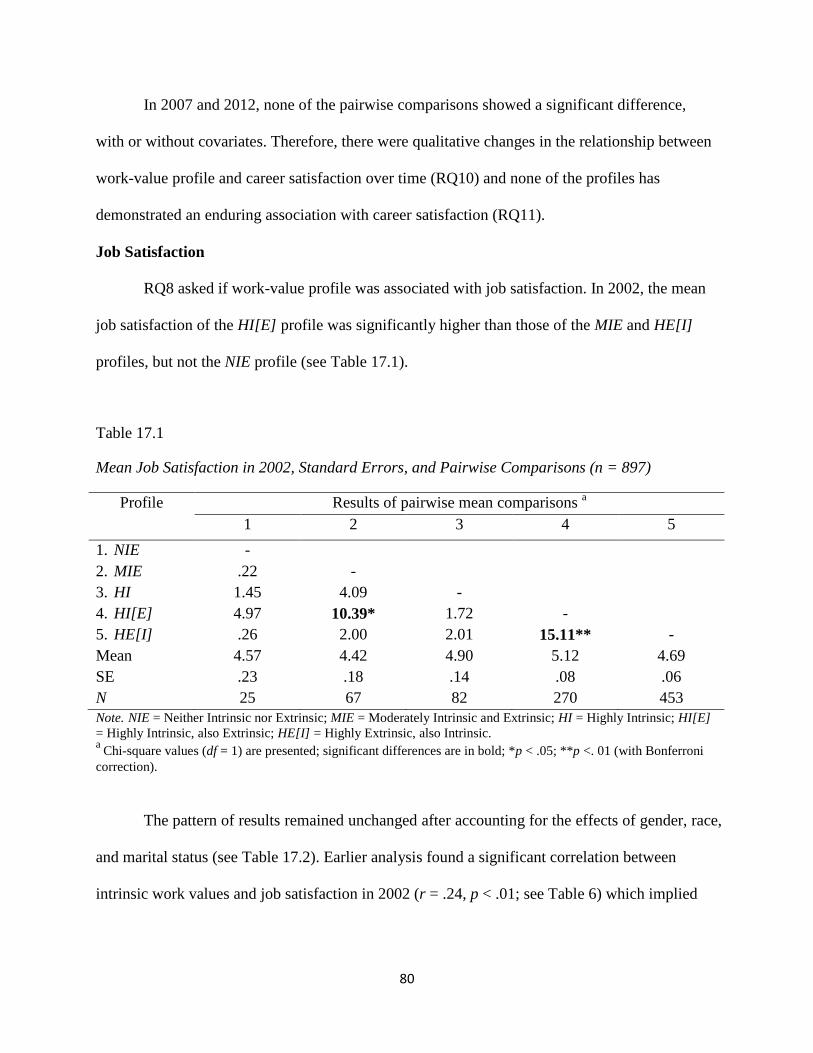
80
In 2007 and 2012, none of the pairwise comparisons showed a significant difference,
with or without covariates. Therefore, there were qualitative changes in the relationship between
work-value profile and career satisfaction over time (RQ10) and none of the profiles has
demonstrated an enduring association with career satisfaction (RQ11).
Job Satisfaction
RQ8 asked if work-value profile was associated with job satisfaction. In 2002, the mean
job satisfaction of the HI[E] profile was significantly higher than those of the MIE and HE[I]
profiles, but not the NIE profile (see Table 17.1).
Table 17.1
Mean Job Satisfaction in 2002, Standard Errors, and Pairwise Comparisons (n = 897)
Profile Results of pairwise mean comparisons a
1 2 3 4 5
1. NIE -
2. MIE .22 -
3. HI 1.45 4.09 -
4. HI[E] 4.97 10.39* 1.72 -
5. HE[I] .26 2.00 2.01 15.11** -
Mean 4.57 4.42 4.90 5.12 4.69
SE .23 .18 .14 .08 .06
N 25 67 82 270 453
Note. NIE = Neither Intrinsic nor Extrinsic; MIE = Moderately Intrinsic and Extrinsic; HI = Highly Intrinsic; HI[E]
= Highly Intrinsic, also Extrinsic; HE[I] = Highly Extrinsic, also Intrinsic. a
Chi-square values (df = 1) are presented; significant differences are in bold; *p < .05; **p <. 01 (with Bonferroni
correction).
The pattern of results remained unchanged after accounting for the effects of gender, race,
and marital status (see Table 17.2). Earlier analysis found a significant correlation between
intrinsic work values and job satisfaction in 2002 (r = .24, p < .01; see Table 6) which implied

81
that the NIE profile ought to exhibit the worst job satisfaction. This was not the case; again, LPA
has revealed nonlinear trends in the dataset.
Table 17.2
Mean Job Satisfaction in 2002 (controlling for gender, race, and marital status), Standard
Errors, and Pairwise Comparisons (n = 888)
Profile Results of pairwise intercept comparisons a
1 2 3 4 5
1. NIE -
2. MIE .25 -
3. HI 1.90 5.52 -
4. HI[E] 5.62 12.77** 1.81 -
5. HE[I] .32 2.54 3.01 19.23** -
Mean 4.24 4.07 4.63 4.86 4.38
SE .26 .21 .16 .11 .10
N 24 66 82 267 449 Note. NIE = Neither Intrinsic nor Extrinsic; MIE = Moderately Intrinsic and Extrinsic; HI = Highly Intrinsic; HI[E]
= Highly Intrinsic, also Extrinsic; HE[I] = Highly Extrinsic, also Intrinsic. a Chi-square values (df = 1) are presented; significant differences are in bold; *p < .05; **p <. 01 (with Bonferroni
correction).
In 2007 and 2012, none of the pairwise comparisons on job satisfaction revealed any
significant difference, either with or without covariates in the analyses. Therefore, similar to the
results for career satisfaction, the relationship between work-value profile and job satisfaction
has changed qualitatively over time (RQ10) as the advantages associated with the HI[E] profile
apparently diminished over time (RQ11).
WLB Satisfaction
RQ9 concerned the relationship between work-value profile and satisfaction with WLB.
In 2007, lawyers with the NIE profile appeared to be most satisfied with their WLB, although the
difference only attained statistical significance in one of the pairwise comparisons - that between
NIE and HE[I]. There was no covariate in this analysis (see Table 18). This difference was no
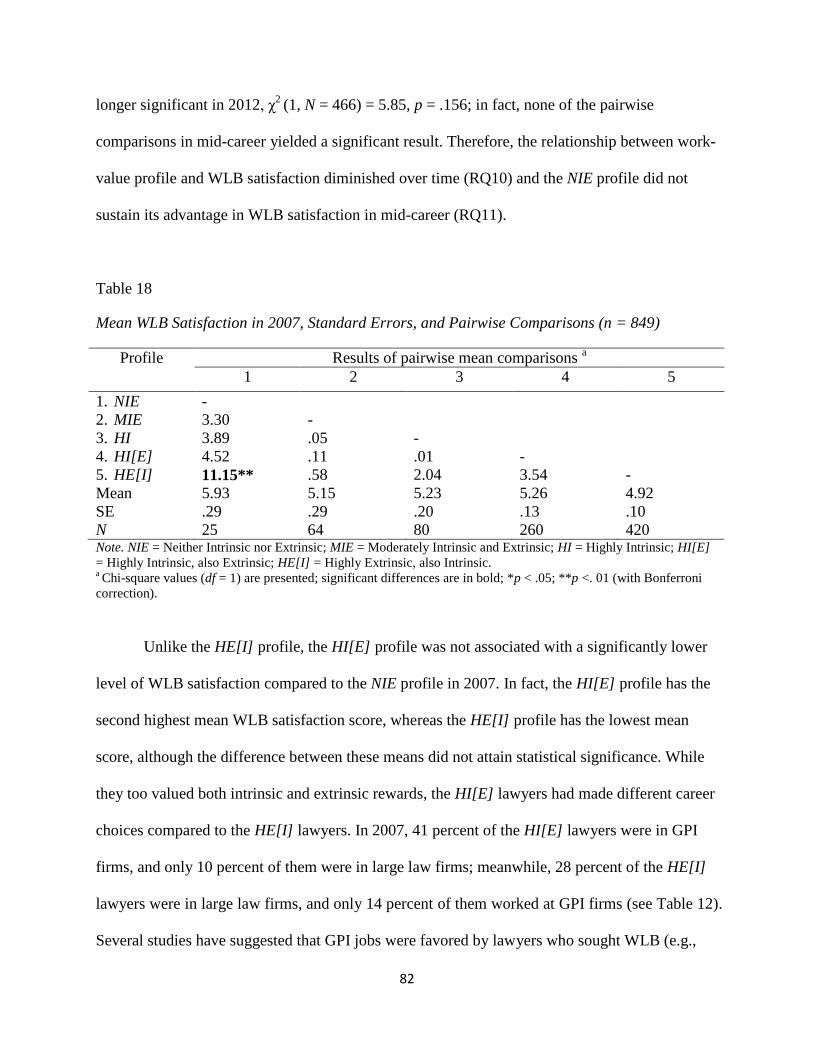
82
longer significant in 2012, χ2
(1, N = 466) = 5.85, p = .156; in fact, none of the pairwise
comparisons in mid-career yielded a significant result. Therefore, the relationship between work-
value profile and WLB satisfaction diminished over time (RQ10) and the NIE profile did not
sustain its advantage in WLB satisfaction in mid-career (RQ11).
Table 18
Mean WLB Satisfaction in 2007, Standard Errors, and Pairwise Comparisons (n = 849)
Profile Results of pairwise mean comparisons a
1 2 3 4 5
1. NIE -
2. MIE 3.30 -
3. HI 3.89 .05 -
4. HI[E] 4.52 .11 .01 -
5. HE[I] 11.15** .58 2.04 3.54 -
Mean 5.93 5.15 5.23 5.26 4.92
SE .29 .29 .20 .13 .10
N 25 64 80 260 420 Note. NIE = Neither Intrinsic nor Extrinsic; MIE = Moderately Intrinsic and Extrinsic; HI = Highly Intrinsic; HI[E]
= Highly Intrinsic, also Extrinsic; HE[I] = Highly Extrinsic, also Intrinsic. a Chi-square values (df = 1) are presented; significant differences are in bold; *p < .05; **p <. 01 (with Bonferroni
correction).
Unlike the HE[I] profile, the HI[E] profile was not associated with a significantly lower
level of WLB satisfaction compared to the NIE profile in 2007. In fact, the HI[E] profile has the
second highest mean WLB satisfaction score, whereas the HE[I] profile has the lowest mean
score, although the difference between these means did not attain statistical significance. While
they too valued both intrinsic and extrinsic rewards, the HI[E] lawyers had made different career
choices compared to the HE[I] lawyers. In 2007, 41 percent of the HI[E] lawyers were in GPI
firms, and only 10 percent of them were in large law firms; meanwhile, 28 percent of the HE[I]
lawyers were in large law firms, and only 14 percent of them worked at GPI firms (see Table 12).
Several studies have suggested that GPI jobs were favored by lawyers who sought WLB (e.g.,
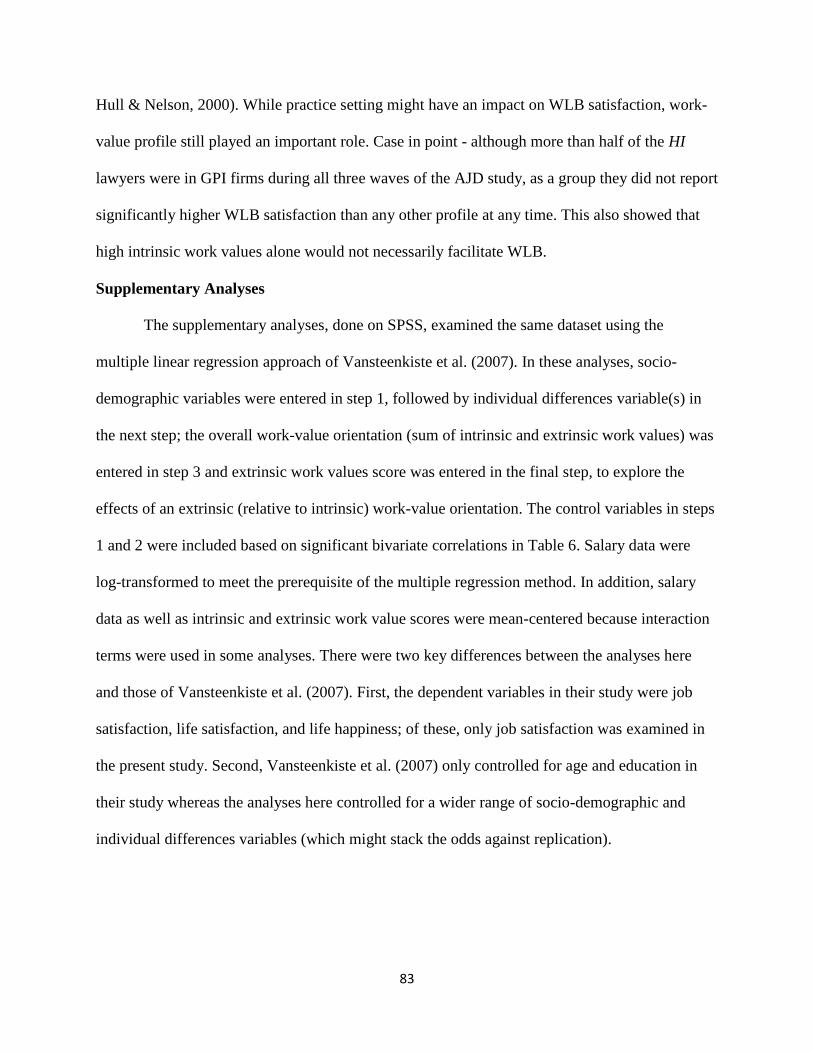
83
Hull & Nelson, 2000). While practice setting might have an impact on WLB satisfaction, work-
value profile still played an important role. Case in point - although more than half of the HI
lawyers were in GPI firms during all three waves of the AJD study, as a group they did not report
significantly higher WLB satisfaction than any other profile at any time. This also showed that
high intrinsic work values alone would not necessarily facilitate WLB.
Supplementary Analyses
The supplementary analyses, done on SPSS, examined the same dataset using the
multiple linear regression approach of Vansteenkiste et al. (2007). In these analyses, socio-
demographic variables were entered in step 1, followed by individual differences variable(s) in
the next step; the overall work-value orientation (sum of intrinsic and extrinsic work values) was
entered in step 3 and extrinsic work values score was entered in the final step, to explore the
effects of an extrinsic (relative to intrinsic) work-value orientation. The control variables in steps
1 and 2 were included based on significant bivariate correlations in Table 6. Salary data were
log-transformed to meet the prerequisite of the multiple regression method. In addition, salary
data as well as intrinsic and extrinsic work value scores were mean-centered because interaction
terms were used in some analyses. There were two key differences between the analyses here
and those of Vansteenkiste et al. (2007). First, the dependent variables in their study were job
satisfaction, life satisfaction, and life happiness; of these, only job satisfaction was examined in
the present study. Second, Vansteenkiste et al. (2007) only controlled for age and education in
their study whereas the analyses here controlled for a wider range of socio-demographic and
individual differences variables (which might stack the odds against replication).

84
OCS indicators
Salary was positively associated with an extrinsic work-value orientation from 2002 to
2011 (RQ12a, see Tables 19.1 – 19.3). In all three multiple-regression analyses, the amount of
variance in salary account for (R2) increased significantly when the extrinsic work values score
was added in the final step. Recall that LPA also found significant associations between work-
value profile and salary at all three waves of the AJD. Specifically, the HE[I] profile has a salary
advantage at all times, and the HI profile was associated with lower salary, especially in 2002
and 2006. These results were consistent with the multiple-regression results here. However, the
person-centered approach also revealed other nuances in the data which the linear regression
approach could not detect e.g., the relatively high salary associated with the MIE profile in 2002,
and the salary gain of the HI[E] profile compared to the HE[I] profile over time, such that the
mean salary difference between these two profiles were no longer statistically significant in 2011.
Table 19.1
Predictors of Salary in 2002
Step 1 ß Step 2 ß Step 3 ß Step 4 ß
Constant -.43* -1.07** -1.07** -1.05**
Gender .13** .15** .15** .09**
Race -.11** -.13** -.13** -.13**
Age .02* .02** .02** .02**
UGPA .07** .07** .06**
Overall work-value orientation .01 -.04**
Extrinsic work-value orientation .09**
R2
.03 .07 .08 .28
F 8.35** 14.84** 13.94** 54.02**
Δ R2 .03 .04 .01 .20
Δ F 8.35** 33.36** 9.71** 235.14** Note. Gender (1 = male; 0 = female); race (1 = white; 0 = non-white); UGPA = undergraduate GPA.

85
Table 19.2
Predictors of Salary in 2006
Step 1 ß Step 2 ß Step 3 ß Step 4 ß
Constant -.09** -.50** -.48** -.44**
Gender .16** .18** .18** .13**
Marital status .00 .00 .00 .00
UGPA .06** .06** .06**
Overall work-value orientation .02** -.02**
Extrinsic work-value orientation .07**
R2
.02 .05 .08 .20
F 9.49** 13.75** 17.98** 39.70**
Δ R2 .02 .03 .03 .12
Δ F 9.49** 21.78** 29.22** 116.13** Note. Gender (1 = male; 0 = female); marital status (1 = married; 0 = not married); UGPA = undergraduate GPA.
Table 19.3
Predictors of Salary in 2011
Step 1 ß Step 2 ß Step 3 ß Step 4 ß
Constant -.27** -.80** -.79** -.73**
Gender .21** .24** .24** .19**
Marital status .19** .19** .20** .18**
UGPA .08** .08** .08**
Overall work-value orientation .01** -.02**
Extrinsic work-value orientation .06**
R2
.04 .07 .08 .14
F 17.90** 20.03** 17.05** 24.08**
Δ R2 .04 .03 .01 .05
Δ F 17.90** 23.26** 7.59** 48.08** Note. Gender (1 = male; 0 = female); marital status (1 = married; 0 = not married); UGPA = undergraduate GPA.
Logistic regression analyses with position (senior = 1; non-senior = 0) as the dependent
variable showed that an extrinsic work-value orientation was not associated with position in
2002 and 2007 (RQ12b; see Tables 20.1 – 20.2). The relationship was significant in 2012, but
the effect was quite small as the change in the pseudo (Nagelkerke) R2 was only .02 (see Table
20.3).
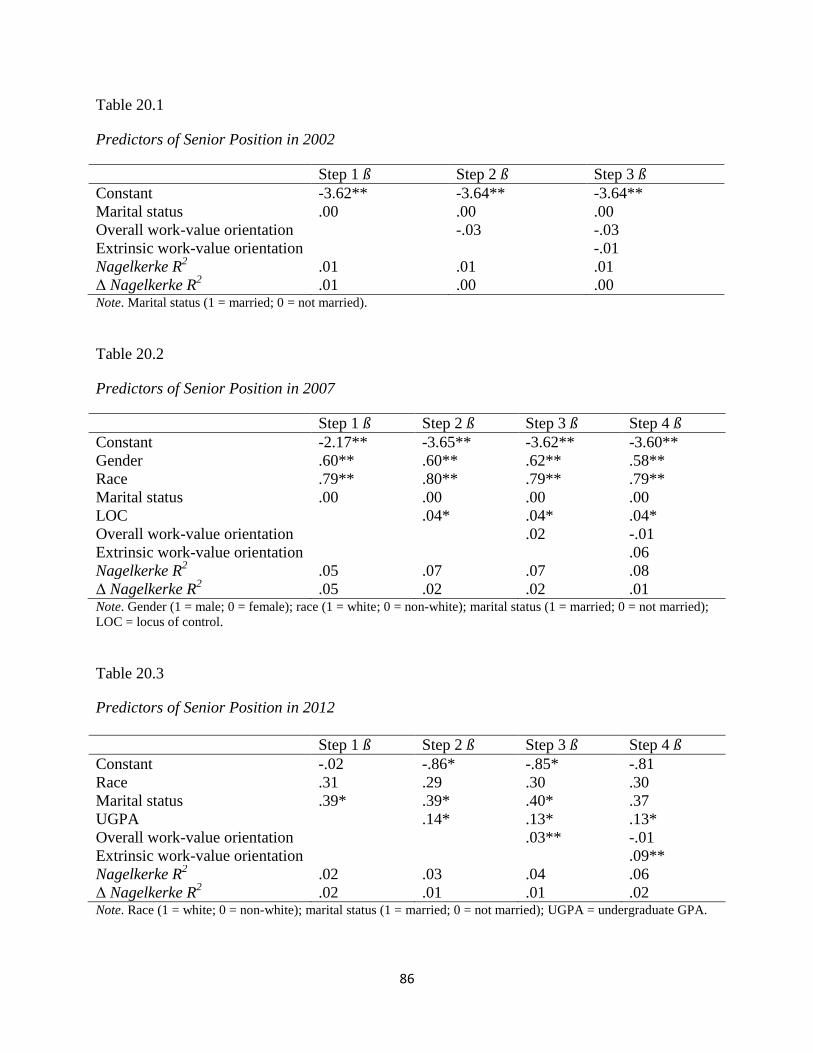
86
Table 20.1
Predictors of Senior Position in 2002
Step 1 ß Step 2 ß Step 3 ß
Constant -3.62** -3.64** -3.64**
Marital status .00 .00 .00
Overall work-value orientation -.03 -.03
Extrinsic work-value orientation -.01
Nagelkerke R2 .01 .01 .01
Δ Nagelkerke R2 .01 .00 .00
Note. Marital status (1 = married; 0 = not married).
Table 20.2
Predictors of Senior Position in 2007
Step 1 ß Step 2 ß Step 3 ß Step 4 ß
Constant -2.17** -3.65** -3.62** -3.60**
Gender .60** .60** .62** .58**
Race .79** .80** .79** .79**
Marital status .00 .00 .00 .00
LOC .04* .04* .04*
Overall work-value orientation .02 -.01
Extrinsic work-value orientation .06
Nagelkerke R2
.05 .07 .07 .08
Δ Nagelkerke R2 .05 .02 .02 .01
Note. Gender (1 = male; 0 = female); race (1 = white; 0 = non-white); marital status (1 = married; 0 = not married);
LOC = locus of control.
Table 20.3
Predictors of Senior Position in 2012
Step 1 ß Step 2 ß Step 3 ß Step 4 ß
Constant -.02 -.86* -.85* -.81
Race .31 .29 .30 .30
Marital status .39* .39* .40* .37
UGPA .14* .13* .13*
Overall work-value orientation .03** -.01
Extrinsic work-value orientation .09**
Nagelkerke R2
.02 .03 .04 .06
Δ Nagelkerke R2 .02 .01 .01 .02
Note. Race (1 = white; 0 = non-white); marital status (1 = married; 0 = not married); UGPA = undergraduate GPA.

87
In the earlier LPA, there was also no significant result relating to position in 2002.
However, it did find a larger proportion of the HE[I] lawyers in senior position compared to the
HI[E] lawyers in 2007. In other words, the person-centered approach displayed a higher
sensitivity in this case, likely due to its ability to account for non-linear interactions. It also found
that in mid-career (i.e., 2012), high intrinsic work values, when coupled with lower extrinsic
work values, were negatively associated with the likelihood of holding senior positions. However,
the association became positive when high intrinsic work values were matched with even higher
extrinsic work values. Such findings were insightful and more informative than the small linear
effect size derived from the corresponding multiple-regression analysis here.
The effect of an extrinsic work-value orientation on supervisory authority was
investigated through ordinal regression to address RQ12c. Significant results were obtained from
the 2007 dataset, ß = .09, χ2 (1, N = 801) = 12.19, p < .001. Between being a supervisor with 2
levels below (coded as 4) and having no supervisory responsibility (coded as 1), the odds of
belonging to the former increased as extrinsic work-value orientation increased. However,
between being a supervisor with 2 levels below and one with full power (coded as 3), the odds of
belonging to the latter increased as extrinsic work-value orientation increased. The Nagelkerke
R2 of the full model was .04. The effect of an extrinsic work-value orientation was again
statistically significant in mid-career, ß = .05, χ2 (1, N = 849) = 4.53, p = .033, and the
Nagelkerke R2 of the full model was also .04. Again, between being a supervisor with 2 levels
below and one just with full power, the odds of belonging to the latter increased as extrinsic
work-value orientation increased. These results suggested that the relationship between work-
value orientation and supervisory authority was not linear.

88
Earlier, LPA also found that the HE[I] profile was superior in terms of supervisory
authority in 2007; however it failed to produce any significant result in 2012. While the person-
centered approach was able to reveal nuanced relationships in a dataset, it could also possess
lower power than the multiple-regression approach because LPA essentially reorganized
continuous independent variables into discrete categories.
SCS indicators
LPA only identified a significant relationship between work-value profile and career
satisfaction in 2002; specifically, the HI[E] profile was superior to the MIE profile. All pairwise
comparisons yielded statistically insignificant results in 2007 and 2012. Multiple linear
regression analyses, on the other hand, found a negative association between extrinsic work-
value orientation and career satisfaction at all three waves of the AJD (see Tables 21.1-21.3).
Therefore, H2a was supported. However, the effect size was small and also diminished over time.
Moreover, the multiple-regression results implied that the HI profile should associate with the
highest level of career satisfaction whereas LPA results have shown otherwise.
Table 21.1
Predictors of Career Satisfaction in 2002
Step 1 ß Step 2 ß Step 3 ß Step 4 ß
Constant 4.35** 3.47** 3.55** 3.51**
UGPA -.07* -.07* -.08** -.08**
LOC .02** .02** .02**
Overall work-value orientation .03** .06**
Extrinsic work-value orientation -.05**
R2
.01 .03 .06 .07
F 6.46* 10.16** 14.88** 14.66**
Δ R2 .01 .02 .03 .02
Δ F 6.46* 13.75** 23.69** 13.26** Note. UGPA = undergraduate GPA; LOC = locus of control.

89
Table 21.2
Predictors of Career Satisfaction in 2007
Step 1 ß Step 2 ß Step 3 ß Step 4 ß
Constant 3.22** 2.46** 2.45** 2.47**
Age .02 .02 .02 .02
LOC .02** .02** .02**
Overall work-value orientation .01* .03**
Extrinsic work-value orientation -.04**
R2
.00 .02 .03 .04
F 2.22 6.89** 6.66* 7.10**
Δ R2 .00 .02 .01 .01
Δ F 2.22 11.54** 6.10* 8.22** Note. LOC = locus of control.
Table 21.3
Predictors of Career Satisfaction in 2012
Step 1 ß Step 2 ß Step 3 ß Step 4 ß
Constant 2.97** 2.18** 2.17** 2.19**
Age .02 .02 .02 .02
Marital status .25** .24** .25** .26**
LOC .02** .02** .02**
Overall work-value orientation .01* .03**
Extrinsic work-value orientation -.03*
R2
.01 .03 .04 .04
F 4.91** 7.34** 6.86** 6.44**
Δ R2 .01 .02 .01 .01
Δ F 4.91** 12.04** 5.28* 4.65* Note. Marital status (1 = married; 0 = not married); LOC = locus of control.
Besides the covariates already used in the other analyses so far, the multiple-regression
analysis with job satisfaction as the dependent variable also included salary as a covariate and
the interaction term between extrinsic work values and salary as a predictor to mimic the
analyses of Vansteenkiste et al. (2007). Furthermore, there was no individual differences
covariate in the analysis of the 2002 dataset. Therefore this particular analysis was almost a
direct replication of Vansteenkiste et al. (2007), who used a cross-sectional design. The results
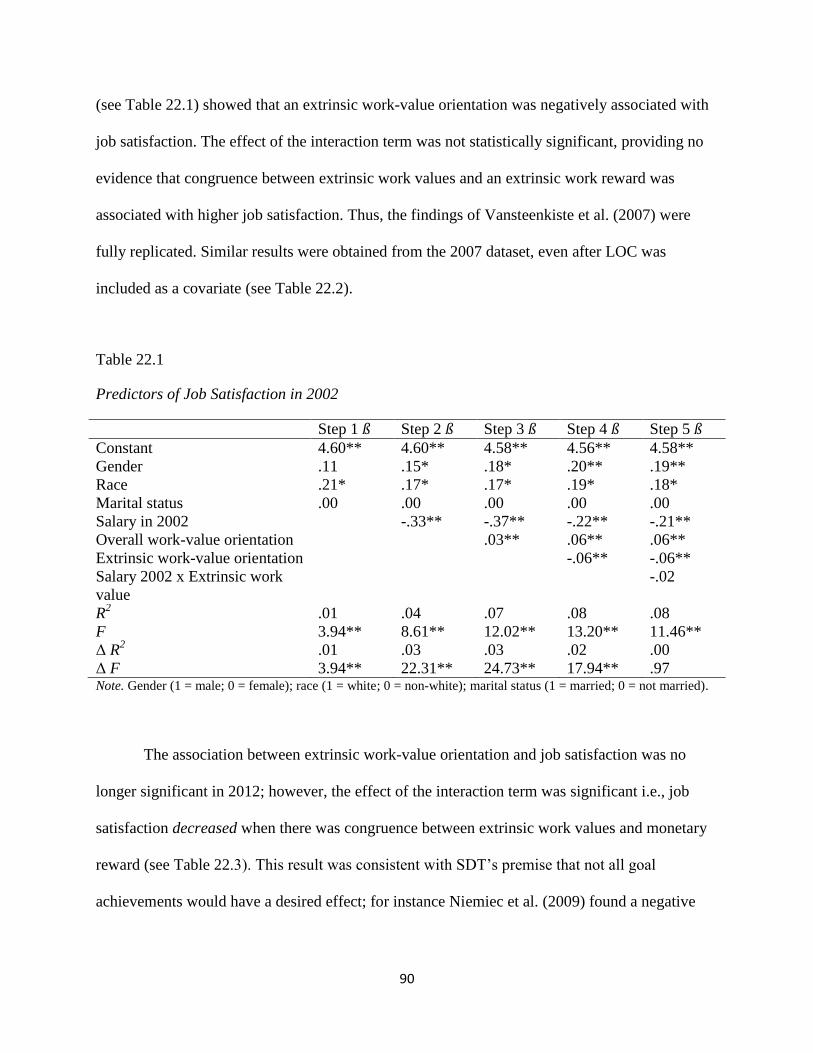
90
(see Table 22.1) showed that an extrinsic work-value orientation was negatively associated with
job satisfaction. The effect of the interaction term was not statistically significant, providing no
evidence that congruence between extrinsic work values and an extrinsic work reward was
associated with higher job satisfaction. Thus, the findings of Vansteenkiste et al. (2007) were
fully replicated. Similar results were obtained from the 2007 dataset, even after LOC was
included as a covariate (see Table 22.2).
Table 22.1
Predictors of Job Satisfaction in 2002
Step 1 ß Step 2 ß Step 3 ß Step 4 ß Step 5 ß
Constant 4.60** 4.60** 4.58** 4.56** 4.58**
Gender .11 .15* .18* .20** .19**
Race .21* .17* .17* .19* .18*
Marital status .00 .00 .00 .00 .00
Salary in 2002 -.33** -.37** -.22** -.21**
Overall work-value orientation .03** .06** .06**
Extrinsic work-value orientation -.06** -.06**
Salary 2002 x Extrinsic work
value
-.02
R2
.01 .04 .07 .08 .08
F 3.94** 8.61** 12.02** 13.20** 11.46**
Δ R2 .01 .03 .03 .02 .00
Δ F 3.94** 22.31** 24.73** 17.94** .97 Note. Gender (1 = male; 0 = female); race (1 = white; 0 = non-white); marital status (1 = married; 0 = not married).
The association between extrinsic work-value orientation and job satisfaction was no
longer significant in 2012; however, the effect of the interaction term was significant i.e., job
satisfaction decreased when there was congruence between extrinsic work values and monetary
reward (see Table 22.3). This result was consistent with SDT’s premise that not all goal
achievements would have a desired effect; for instance Niemiec et al. (2009) found a negative

91
relationship between attainment of extrinsic aspirations and feelings of well-being. On the whole,
the results provided some support for H2b.
Table 22.2
Predictors of Job Satisfaction in 2007
Step 1 ß Step 2 ß Step 3 ß Step 4 ß Step 5 ß Step 6 ß
Constant 5.12** 4.22** 4.22** 4.23** 4.22** 4.24**
Race .14 .15 .15 .15 .15 .15
LOC .03** .03** .02** .03** .02**
Salary in 2006 -.05 -.06 .00 .01
Overall work-value orientation .01 .02* .02*
Extrinsic work-value orientation -.03* -.03*
Salary 2006 x Extrinsic work
value
-.02
R2
.00 .03 .03 .03 .03 .03
F 2.75 9.09** 6.20** 4.86** 4.78** 4.13**
Δ R2 .00 .02 .00 .00 .01 .00
Δ F 2.72 15.37** .43 .86 4.38* .86 Note. Race (1 = white; 0 = non-white); LOC = locus of control.
Table 22.3
Predictors of Job Satisfaction in 2012
Step 1 ß Step 2 ß Step 3 ß Step 4 ß Step 5 ß Step 6 ß
Constant 5.01** 4.10** 4.11** 4.11** 4.10** 4.13**
Marital status 2012 .24* .23* .22* .23* .24* .23*
LOC .03** .03** .03** .03** .03**
Salary in 2011 .04 .03 .05 .08
Overall work-value orientation .01* .02* .02*
Extrinsic work-value orientation -.02 -.03
Salary 2011 x Extrinsic work
value
-.04*
R2
.01 .03 .03 .03 .03 .04
F 6.55 11.19 7.60 6.74 5.90 5.89
Δ R2 .01 .02 .00 .01 .00 .01
Δ F 6.55* 15.68** .43 4.06* 2.49 5.65* Note. Marital status (1 = married; 0 = not married); LOC = locus of control.
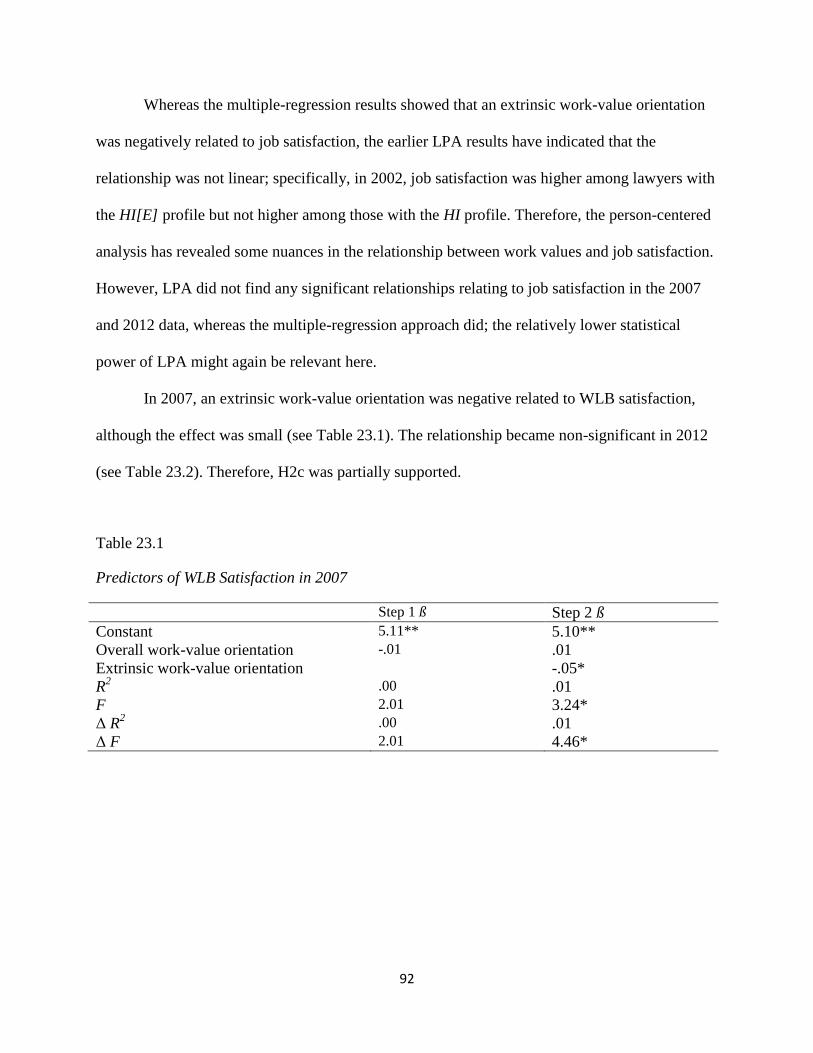
92
Whereas the multiple-regression results showed that an extrinsic work-value orientation
was negatively related to job satisfaction, the earlier LPA results have indicated that the
relationship was not linear; specifically, in 2002, job satisfaction was higher among lawyers with
the HI[E] profile but not higher among those with the HI profile. Therefore, the person-centered
analysis has revealed some nuances in the relationship between work values and job satisfaction.
However, LPA did not find any significant relationships relating to job satisfaction in the 2007
and 2012 data, whereas the multiple-regression approach did; the relatively lower statistical
power of LPA might again be relevant here.
In 2007, an extrinsic work-value orientation was negative related to WLB satisfaction,
although the effect was small (see Table 23.1). The relationship became non-significant in 2012
(see Table 23.2). Therefore, H2c was partially supported.
Table 23.1
Predictors of WLB Satisfaction in 2007
Step 1 ß Step 2 ß
Constant 5.11** 5.10**
Overall work-value orientation -.01 .01
Extrinsic work-value orientation -.05*
R2 .00 .01
F 2.01 3.24*
Δ R2 .00 .01
Δ F 2.01 4.46*

93
Table 23.2
Predictors of WLB Satisfaction in 2012
Step 1 ß Step 2 ß Step 3 ß
Constant 5.95** 5.94** 5.93**
UGPA -.10* -.10* -.10*
Overall work-value orientation -.02* -.01
Extrinsic work-value orientation -.02
R2
.01 .01 .01
F 5.48* 4.76** 3.38*
Δ R2 .01 .01 .00
Δ F 5.48* 4.02* .63 Note. UGPA = undergraduate GPA
Likewise, LPA has earlier identified statistically significant relationships relating to WLB
satisfaction in 2007 but not in 2012. Whereas the multiple-regression results suggested that
lawyers with the HI profile should perceive the highest level of WLB satisfaction in 2007, the
only significant difference that emerged from LPA was that between NIE and HE[I]; mean WLB
satisfaction of the HI[E] profile appeared to be higher than that of the HE[I] profile, but the
difference was not statistically significant. The multiple-regression results were probably driven
by data from the HI[E] and HE[I] lawyers, as they were the largest subgroups in the sample; on
the other hand data from the super-minority NIE lawyers were likely ‘drowned out’ in the
analyses. Once again, the person-centered approach demonstrated a trend that eluded the
multiple-regression approach.

94
Chapter Four
Discussion
The objectives of this study were to examine if work values are meaningfully associated
with career success and to explore if latent profiles corresponding to various combinations of
intrinsic and extrinsic work values could address some contradictory findings from past studies
based on the variable-centered and work-value orientation approaches. To achieve these goals,
the study first used LPA to identify latent AJD subgroups that exhibited qualitatively or
quantitatively distinct work-value profiles. Attempts were then made to place these profiles in a
nomological network. Specifically, gender was proposed to be an antecedent, influencing how
individuals were assigned to work-value profiles; a range of career variables, including practice
setting and various OCS and SCS indicators were proposed to meaningfully co-vary with work-
value profile. Results from three key career stages – early career, transition into senior roles, and
mid-career - were compared to evaluate if there was consistency in the patterns of relationships
over time. Finally, the data were re-analyzed using the work-value orientation approach to enable
direct comparisons between present and past findings, as well as to evaluate if LPA provided
additional insights over the multiple linear regression method.
On the whole, this study has made four contributions to the career success literature. First,
it has established work values as significant predictors of career success. Second, it distinguished
between five meaningful work-value profiles, identified one of their antecedents, and traced their
associations with career variables. Third, through the inclusion of a range of career success
indicators, this study has reduced criterion deficiency, which was a limitation in many career

95
success studies (Heslin, 2005). Fourth, this study has helped to strengthen the linkage between
the substantial body of legal career research and the generic career success literature.
Work-Value Profiles
Five work-value profiles have been identified through LPA. The largest subgroup made
up half of the sample, and consisted of lawyers who were highly extrinsic, but also intrinsic
(HE[I]); the next largest group (30.3 percent of sample) contained highly intrinsic lawyers who
were also extrinsic (HI[E]). After investing much personal resources in a legal education to
embark on a prestigious professional career, it was not surprising that the majority of lawyers
would have high extrinsic reward expectations. On the other hand, the generally high
expectations of intrinsic work rewards were consistent with past findings that intrinsic work
values were positively associated with educational attainment (e.g., Johnson & Mortimer, 2011;
Vansteenkiste et al., 2007). The other three profiles accounted for slightly less than 20 percent of
the sample. Lawyers with the highly intrinsic (HI) profile belonged to the third largest group (9.2
percent). This was a critical profile from the theoretical perspective because according to SDT, it
ought to be associated with the best affective and well-being outcomes; results from the present
study have shown otherwise. Lawyers who reported moderate levels of intrinsic and extrinsic
work values (MIE) and those who were neither intrinsic nor extrinsic (NIE) were the smallest
groups, making up 7.4 and 2.9 percent of the sample, respectively. From the work-value
orientation perspective (e.g., Vansteenkiste et al., 2007), these two groups were anticipated to
exhibit similar affective and well-being outcomes. This was not the case; the NIE and MIE
profiles exhibited some distinct relationships with career variables, showing that absolute levels
of work values also mattered in career success.
96
LPA did not identify a highly extrinsic profile within the AJD sample. Theoretically, in
any population, there would be a finite number of work-value profiles (e.g., Muthén, 2001), and
the subgroups corresponding to these profiles would vary in size, just as the present study has
demonstrated. In LPA, sample size determines the power of the analysis i.e., the number of
qualitatively or quantitatively distinct profiles which can be successfully retrieved; however
sample size determination in LPA is complex because it involves estimating the true value of
several parameters, most of which could not be known prior to the LPA (Lubke, 2010). The
importance of power was also illustrated in the present study, where the profile with the smallest
number of lawyers (NIE) only emerged after pooling the male and female data. Evidence
suggested that the sample of lawyers in the present study was quite representative of their cohort;
therefore it is probable that the hypothetical highly extrinsic profile, if it exists within the cohort,
must be even less prevalent than the NIE profile.
Consistent with past studies (Marini et al., 1996; Mortimer et al., 1996), gender
difference was found for intrinsic work values (females higher) but not for extrinsic work values.
These results also provided further support for the construct (criterion-related) validity of the two
work value scales used in this study. Although female lawyers as a group reported higher levels
of intrinsic work values than male lawyers did, MI was established across gender i.e., gender did
not have a direct effect on the magnitudes of intrinsic and extrinsic work values within each
profile. Instead, gender acted as an antecedent in the nomological network, by influencing how
lawyers were assigned to the profiles. Specifically, the results showed that male lawyers have a
lower likelihood of belonging to the HI profile compared to the NIE, MIE, and HE[I] profiles.

97
Practice Setting
Generally, this study found that work-value profile was associated with practice setting
i.e., they may play a role in gravitating lawyers toward particular settings. The relationship held
for all three measurement occasions, from early to mid-career, and was the strongest in early
career, weakened slightly in 2007, and then strengthened again during mid-career. Compared to
those in later career stages, fresh JDs might allocate a greater weight to work values when
selecting practice settings because they had yet to experience the practical constraints in each
setting. The significant movements between AJD1 and AJD2 showed that like other workers,
lawyers also tended to change jobs more frequently earlier in their careers. In particular, the
recent trend of new associates leaving large firms has been documented in other studies based on
the AJD data (e.g., Dinovitzer, Garth, & Stirling, 2013)11
.
Regression to the mean (since work values were only measured in AJD1) would not be a
good explanation for the smaller effect sizes in AJD2 and AJD3 because the effect size in AJD3
was bigger than that in AJD2. One may also argue that the effects observed at AJD2 and AJD3
might simply be a function of inertia i.e., lawyers basically just stayed put in the practice setting
they selected in early career, but this argument is not supported by the significant movements
across practice settings over time. Moreover, the work-value profile by practice setting
distribution in the present study was intuitive and demonstrated the utility of the person-centered
approach in explaining choice of practice setting.
First, the differences between the HI and HI[E] profiles were not trivial and they also
made theoretical sense. Among the five profiles, these two have the highest mean intrinsic work
values and, as expected, they dominated the GPI and, to a lesser extent, smaller law firm settings
11
According to Dinovitzer et al. (2013), the attrition rate from large law firms between AJD 1 and AJD2 based on
the sample which responded to both waves of the study was 36.9%. Within the sample of the present study, the
corresponding figure was 37.7%, which again provided support for the representativeness of the current sample.

98
(where the “service jobs” were; Sheldon & Krieger, 2014). However, HI lawyers generally
eschewed the money jobs, whereas HI[E] lawyers did not, and this was consistent with the
difference in mean extrinsic work values between them. A variable-centered approach could
have missed this insight e.g., it would have treated the two groups of lawyers as similar if the
focus was solely on intrinsic work values. Second, because individuals with the HI[E] or HE[I]
profiles reported high intrinsic and high extrinsic work values, they would appear homogenous to
the variable-centered approach. The person-centered approach, on the other hand, not only
differentiated the two groups but also revealed significant differences in practice settings
between them. Third, a study that focuses on extrinsic work values would not have anticipated a
larger proportion of lawyers in the MIE profile to be in money jobs compared to lawyers in the
HI[E] profile, because the mean level of extrinsic work values was higher in the latter. Fourth,
the work-value orientation approach (e.g., Vansteenkiste et al., 2007) would not have
distinguished between the NIE and MIE groups, and would therefore not have found their
differences in practice settings. On the other hand, variable-centered studies would have paid
little attention to lawyers with the MIE profile because they were just the ‘average’ individuals.
The present study showed that collectively, lawyers with the MIE profile were the most
versatile and a sizeable proportion of them could be found in all practice settings. In early career,
a relatively large proportion of them were in large law firms, probably because these firms have
been the default practice setting for capable new JDs. Besides financial perks and development
opportunities, large firms also provide the widest career options in the long run (Heinz, Nelson,
Sandefur, & Laumann, 2005). However, given that jobs in large law firms are highly demanding,
they should have the least appeal to lawyers who have low expectations of both intrinsic and

99
extrinsic work rewards. This was exactly what the present study found - by mid-career, none of
the NIE lawyers was working in large law firms.
In the last 50 years, there have been numerous studies on the gender gap in OCS among
lawyers (e.g., Dinovitzer & Hagan, 2014; Dinovitzer, Reichman, & Stirling, 2009; Kay & Hagan,
1995; Pinnington & Sansberg, 2013; White, 1967). In particular, Dinovitzer et al. (2009)
attempted to explain gender salary gap using a large number of demographic and work setting
variables from AJD1, and concluded that 75 percent of the gap remained unexplained even after
accounting for gender differences on these variables. Subsequently, using AJD1 and AJD2 data,
Dinovitzer and Hagan (2014) showed that female lawyers were disproportionately allocated to
the public sector, and suggested that men were hoarding jobs and financial resources in the
private law firm sector. Work value was not included in these studies, and how much unique
variance it may actually account for remains an empirical question. Results from the present
study suggested that this line of inquiry could be productive. Specifically, lawyers belonging to
the HI profile were least likely to be in money jobs; in addition, male lawyers were more likely
to belong to the NIE, MIE, or HE[I] profiles than to the HI profile. Thus, some of the gender
salary gap among lawyers may be accounted for by gender differences in work values.
Objective Career Success
Among the five work-value profiles, HE[I] was consistently associated with the highest
mean salary at all three waves of the AJD study. This result was in harmony with both the
variable-centered and work-value orientation perspectives because lawyers in this group reported
the highest mean level of extrinsic work values, which was higher than their already high level of
mean intrinsic work values. However these perspectives were challenged by other results from
the present study. For instance, in 2002, the mean salary associated with the MIE profile was on

100
par with that of the HE[I] profile, although this was not sustained beyond early career. A likely
explanation is because their work values were moderate, some MIE lawyers might have just
followed the money in early career but switched jobs subsequently when they realized that they
were not motivated enough to persevere in highly demanding money jobs. Regardless of the
validity of this explanation, the results implied a non-linear trend in the relationships between
work values and salary.
The HI[E] profile was characterized by a higher level of extrinsic work values than the
MIE profile but HI[E] lawyers actually showed a weaker preference for money jobs; this could
only be rationalized if their level of intrinsic work values, which was even higher than their
extrinsic work values, was simultaneously taken into account. Notably, by mid-career, even
though 41 percent of the HI[E] lawyers were in the GPI sector, which generally offered the
lowest pay, their mean salary was not statistically different from that of the HE[I] group (after
controlling for covariate effects). It is plausible that while remaining true to their wishes of
performing intrinsically-motivating work, the HI[E] lawyers also selected high-paying jobs.
Their higher level of extrinsic work values differentiated them from the HI lawyers, whose
strong intrinsic work-value orientation probably overshadowed extrinsic strivings. Therefore the
level of intrinsic work values alone could not adequately predict salary - information on the
corresponding levels of extrinsic work values was also needed.
The analyses on hierarchical position showed that high intrinsic work values could be
detrimental to the attainment of senior positions, except when the level of extrinsic work values
was even higher. One plausible explanation is that lawyers with an intrinsic work-value
orientation may be less keen to assume senior positions because these jobs often involve taking
on additional administrative responsibilities which would not necessarily make the work feel

101
more meaningful or fulfilling. In terms of how early one was entrusted with substantial
supervisory authority, the HE[I] profile was again superior to the other profiles.
Therefore, work-value profile has displayed interesting, consistent, and meaningful
relationships with all three OCS indicators in the present study. In contrast, a variable-centered
approach examining the effects of intrinsic and extrinsic work values separately would not have
detected the unique salary pattern of the MIE profile from 2002 to 2006. It also could not explain
why the NIE profile, characterized by low extrinsic work values (and low intrinsic values), were
not significantly worse off than most other profiles (except HE[I]) in terms of OCS. In particular,
relative to the NIE profile, the HI profile was characterized by higher levels of both extrinsic and
intrinsic work values, yet it did not perform better than the NIE profile in any of the direct
comparisons between them. In several OCS comparisons, lawyers with the HI profile also fared
worse than the HE[I], MIE, and HI[E] lawyers. Collectively, these results suggested that in the
context of a legal career, a highly intrinsic work-value orientation might be detrimental to OCS.
Studies adopting the work-value orientation approach seldom measured OCS indicators.
One found a negative relationship between intrinsic work-value orientation and salary (Sheldon
& Krieger, 2014) whereas another reported a positive association (Bridgstock, 2011). Consistent
with the former, the present study found that the HE[I] profile was generally associated with the
best, whereas the HI profile typically showed the worst, OCS outcomes. However, the present
study also found that by mid-career, the mean salary of HI[E] lawyers were on par with that of
the HE[I] lawyers. It is hard to explain this finding within the work-value orientation framework.
Subjective Career Success
In early career, lawyers with the MIE profile reported lower career and job satisfaction
than lawyers with the HI[E] profile (and HE[I] profile as well, although the relationship became
102
statistically insignificant after covariate effects were accounted for). This finding appeared to
support the variable-centered approach; however the rest of the results were at odds with it. First,
the HI profile, which was characterized by an even higher level of intrinsic work values than the
HI[E] profile, did not display higher career or job satisfaction than the MIE (or any other) profile.
Second, the mean career and job satisfaction associated with the NIE profile were not
significantly lower than those associated with the HI[E] or HI profiles. Third, although the HI[E]
and HE[I] profiles were both characterized by a high level of intrinsic work values, the latter was
associated with significantly lower job satisfaction than the former in early career. The last
finding clearly illustrated the importance of considering the conjoint effects of intrinsic and
extrinsic work values; it was also consistent with SDT. However SDT was not able to explain
why a highly intrinsic, relative to extrinsic, work-value orientation (represented by the HI profile)
was associated with neither higher career satisfaction (cf. Bridgstock, 2011) nor higher job
satisfaction (cf. Sheldon & Krieger, 2014) at any time of the AJD study. With regard to why the
NIE profile did not report the lowest mean career or job satisfaction, one plausible explanation is
that since they did not have high expectations in the first place, they were more easily satisfied.
Earlier analyses on salary showed that the MIE profile was associated with greater
financial success in 2002. The results on career and job satisfaction suggested that while some
lawyers in the MIE profile were well-paid in 2002, they were not particularly satisfied with their
jobs and careers (i.e., relatively high OCS, but relatively low SCS). The salary advantage of the
MIE profile diminished in 2006, especially after covariates were accounted for in the analysis,
and remained as such in 2011. Meanwhile, the MIE lawyers were also reporting levels of career
and job satisfaction comparable to those of all other profiles in 2007 and 2012.

103
The results on practice settings (Table 12) provided some clues on what might have
happened: within the MIE profile, there were net movements out of large and smaller law firms
into BTLs and GPI firms between 2002 and 2007. It was probable that a significant number of
MIE lawyers opted for higher-salary jobs in early career because that appeared to be the
conventional path to career success, and because their moderate extrinsic and intrinsic work
values did not predispose them toward (or turn them away from) any practice setting. With
experience, they probably gained greater insights of their preferences and made corresponding
career moves - thus the relative increase in mean career and job satisfaction in 2007. Some of the
moves probably involved financial sacrifices (thus the relative reduction in mean salary) which
they probably accepted because their extrinsic work values were not very high.
WLB satisfaction was seldom investigated as a career success indicator. In the present
study, the bivariate relationship between intrinsic work values and WLB satisfaction was not
significant, whereas the correlation between extrinsic work values and WLB satisfaction was
negative but quite small. Consistent with previous results (Shockley et al., 2016), WLB
satisfaction and career satisfaction was not strongly correlated, indicating that the inclusion of
WLB satisfaction could significantly expand the domain of the SCS criterion.
In 2007, NIE lawyers reported higher WLB satisfaction than HE[I] lawyers. Because the
NIE lawyers have low expectations of intrinsic and extrinsic job rewards, they were probably
more ready to trade job rewards for a balanced lifestyle. The HE[I] lawyers, on the other hand,
probably prioritized career achievements over other personal goals, especially at this critical
juncture of their career, when milestone achievements were attained or within reach. To recap, in
2007, more than one quarter of the HE[I] lawyers were still in large law firms (see Table 12),
where the pressure to make partner was likely peaking (e.g., Hull & Nelson, 2000).

104
Among the five work-value profiles, the HE[I] and NIE profiles were characterized by
the highest and lowest level of extrinsic work values, respectively. Ostensibly, the difference in
WLB satisfaction between these two profiles could be explained by extrinsic work values alone
(i.e., variable-centered approach). However such explanation would be inadequate because there
were also nonlinear trends e.g., the mean WLB satisfaction of the HI[E] profile was closer to
that of the NIE rather than the HE[I] profile.
Given that WLB satisfaction was an affective variable, one could also interpret the results
as being consistent with SDT, because the results showed a negative association between
extrinsic work-value orientation (represented by the HE[I] profile) and an affective outcome.
However, for the results to be fully consistent with SDT, HI, rather than NIE, should be
associated with the highest mean WLB satisfaction. Therefore, neither the variable-centered nor
the work-value orientation approach could fully account for the various associations between
work values and WLB satisfaction found in this study.
On the whole, the results illustrated that high intrinsic work values alone could not
predict SCS. Furthermore, contrary to what SDT would imply, a highly intrinsic, relative to
extrinsic, work-value orientation (i.e., the HI profile) was also not systematically associated with
any of the SCS indicators in this study. In other words, the person-centered approach has yielded
insights that eluded the variable-centered and work-value orientation approaches.
Validity and Utility of Work-Value Profile Approach
The current study has not only identified five work-value profiles through LPA, it has
also placed the work-value profile construct in a nomological network consisting of an
antecedent (gender) and career variables (practice setting, OCS and SCS indicators). So far,
studies that were variable-centered and/or assumed linear relationships have generally reported

105
that extrinsic work values or an extrinsic work-value orientation would be positively associated
with OCS, whereas intrinsic work values or an intrinsic work-value orientation would be
positively associated with SCS. The present study employed a person-centered approach and
revealed some nuances in the relationships which should prompt rethinking on how the effects of
work values should be studied.
Specifically, although work values exhibited weak linear associations with career success
indicators, some interesting and meaningful results were obtained when the effects of intrinsic
and extrinsic work values were modelled jointly using LPA. As explained earlier, a key strength
of LPA is that both linear and nonlinear effects in a dataset can be captured without explicitly
modelling those effects (Bauer & Shanahan, 2007). Results from the supplementary analyses
showed that the person-centered approach could provide additional insights over linear
regression methods. First, when job satisfaction data were analyzed using the work-value
orientation approach, the results of Vansteenkiste (2007) were fully replicated. Furthermore,
when the other career variables were subjected to the same analysis, results which generally
conformed to the predictions of SDT were obtained i.e., OCS indicators were positively
associated with, and SCS indicators negatively related to, an extrinsic work-value orientation.
Therefore, had the current study not used a person-centered approach, it would simply have
replicated past findings. On the other hand, the decision to use LPA has produced some
intriguing results that have opened new opportunities for future research.
Although career success studies using conventional linear analytical approaches (e.g.,
multiple linear regression) do not use discrete profiles as predictors, many have nevertheless
communicated their results using typology language e.g., the main conclusion from the SDT-
based studies has been that a highly extrinsic, relative to intrinsic, work-value orientation would

106
be detrimental to subjective well-being. Although the present study found similar results when it
used the same method as these studies, the use of LPA has revealed a more complex picture.
First, the highly extrinsic, relative to intrinsic, work-value profile did not emerge; if it existed at
all in the AJD population, its prevalence would likely be lower than 3 percent (because the NIE
profile which corresponded to the smallest subgroup in this study made up 2.9 percent of the
sample). There was, however, a highly extrinsic, but also intrinsic, profile, which happened to be
the largest subgroup (i.e., HE[I] profile; 50.3 percent of the sample). Second, although a highly
intrinsic, relative to extrinsic, profile did emerge, it only made up 9.2 percent of the sample;
more critically, it did not display the most positive relationships with SCS indicators, as SDT
would have predicted, although it did exhibit negative associations with OCS indicators (but
OCS has typically not been the focus of SDT-based studies). Third, the weak linear relationships
between an extrinsic work-value orientation and career success indicators in the present study
were likely driven by data from lawyers belonging to either the HE[I] or the HI[E] profiles, who
collectively made up four-fifths of the sample. Fourth, two small subgroups (NIE and MIE)
constituted slightly more than 10 percent of the sample and each has displayed some unique
relationships with career success variables; however the work-value orientation approach would
have omitted both groups because they were characterized by similar levels of intrinsic and
extrinsic work values.
A longitudinal analysis in the present study showed that work-value profile was
associated with salary in 2006 even after controlling for salary in 2002 (i.e., auto-regression) and
a number of other socio-demographic and individual differences variables. This result is notable
because bivariate correlations between salaries in this study, as well as results from past studies
(e.g., Spurk & Abele, 2014), have consistently shown that about 30 to 60 percent of the variance

107
in salary is predicted by past salary. In other words, any variable that can account for additional
variance would be of theoretical and applied relevance (Abele & Spurk, 2009b). The significant
auto-regression result also implied that work-value profile has passed the ‘stricter test’ (Ganzach
& Pazy, 2015, p. 717) for an OCS antecedent, at least in the first seven years of a lawyer’s career.
Practical Implications
One key finding of the present study is that the highly extrinsic, relative to intrinsic,
profile did not emerge from the LPA. Paradoxically, reward systems in the large law firms,
which generally targeted and employed the top law graduates, were designed to attract JDs with
this almost non-existent profile i.e., high emphasis on salary and statuses, to the detriment of
intrinsic rewards like good work relationships, professional development, and interesting work
(e.g., Forstenlechner & Lettice; 2008; Stirling & Reichman, 2010). In other words, the supposed
most desirable jobs for new lawyers are also those that, by nature, appeal to very few of them.
This disconnect may help to explain why large law firms have the highest attrition rates of new
associates (Dinovitzer & Garth, 2009b; also see the analysis on practice setting in this study),
and why one quarter of lawyers quit legal practice within 12 years of being admitted to the Bar
(Weiss, 2014). The present study therefore reinforced the calls of previous studies on the need to
recalibrate the incentive structure and redesign the jobs in large law firms (e.g., Dinovitzer &
Garth, 2009b; Krieger & Sheldon, 2015).
Four-fifths of the lawyers in the AJD cohort valued both extrinsic and intrinsic rewards
quite highly. From early to mid-career, HE[I] lawyers displayed the best OCS outcomes,
whereas HI[E] lawyers generally experienced higher levels of SCS. By mid-career, the HI[E]
lawyers were also enjoying moderately high salaries; although the HE[I] lawyers experienced
lower SCS in the earlier part of their career, these effects dissipated by mid-career. Therefore, the
choice between ‘career’ and ‘lifestyle’ in a legal career (see Reichman & Stirling, 2013) appears
108
to be a false choice. Over time, the most successful lawyers (in terms of both OCS and SCS) are
those who aspire to high levels of intrinsic and extrinsic job rewards in early career. Because
work values remain malleable while individuals are still in school (Johnson & Mortimer, 2011),
these results imply that law schools may contribute to future career success of their students by
inspiring them to set challenging intrinsic and extrinsic career goals.
Limitations
One limitation of this study (and work values study in general) was the use of ad-hoc
work value scales. Because extrinsic and intrinsic work values are higher level constructs, it is
challenging to ensure good content validity and reliability, especially when using an archival
dataset. However, the work value scales in the present study have acceptable psychometric
properties, and their construct validity has further been established through a field study. The
relationships between work values and other variables (e.g., gender, salary, job satisfaction) in
the present study were also consistent with those in the literature. Furthermore, results of the
Vansteenkiste et al. (2007) study were replicated, even though its work value scales did not
resemble those used in the present study.
Work values were measured only at AJD1. This limitation should not compromise the
validity of findings from the present study because there is meta-analytic evidence that work
values are even more stable than personality (Jin & Rounds, 2012), and studies examining the
antecedent role of personality have often used data collected in early adulthood to predict
outcomes in middle or even late adulthood (e.g., Judge et al., 1999). In the supplementary
analyses, the relationship between work-value orientation and career success was replicated
across all measurement occasions for four out of the six career success indicators, providing
further support for the premise that there were probably no significant shifts in work values over
the course of the AJD study.
109
Survey research, by its nature, is associated with some limitations like the common
method bias. The design of this study, however, was more robust than a typical survey study.
First, data were collected over three time periods, and key predictors (i.e., work values) and
outcomes (i.e., career variables) were not necessarily from the same time period. Second, the
AJD designers were not simply guided by a few specific or transparent hypotheses; the surveys
were quite comprehensive and touched on many aspects of a lawyer’s professional and personal
life. Third, the current study only used a small percentage of the AJD items, and these items were
found in different sections of the survey. For instance, in AJD2, the job satisfaction items were
on page 7, the career satisfaction item on page 9, whereas the LOC items were on page 22. This
reduced the likelihood of response on one item being contaminated by responses to earlier items.
Finally, the sample of this study was a group of highly educated professionals and
therefore its results may not generalize to the entire working population. Because generational
shifts in work values cannot be ruled out (e.g., Warr, 2008), not all the results from the present
study may generalize to other cohorts of lawyers; for instance, the profile proportions may be
different among lawyers in the millennial generation. However, the specific relationships
between work-value profile and career success indicators may be more generalizable.
Future Directions
While the present study has broken some new grounds, it also raises further questions.
For instance, to assess the generalizability of the findings, one could investigate if the work-
value profiles here would emerge among other professionals like accountants and engineers. If
they do, then the follow-up questions would be whether the profile proportions differ and if the
profiles display similar relationships with career success. Blue-collar workers should also be
studied. Specifically, given the differences in education between white-collar professionals and
110
blue-collar workers, and the finding that level of intrinsic work values increases with education
level (e.g., Johnson & Mortimer, 2011), a highly extrinsic profile, which was not identified in the
present study, may emerge among blue collar workers. This profile will facilitate further
evaluation of SDT’s key premises e.g., whether workers who are highly extrinsic would show
the worst affective and well-being outcomes.
The present study demonstrated how five work-value profiles were differentially
associated with seven career variables. To gain a deeper understanding of the relationship
between work-value profile and career success, future studies may examine whether and how
each profile is also associated with a distinct configuration of work behaviors that can more
directly account for the variance in career success.
At a more micro level, it is critical to probe the reasons for the apparent career
disadvantages associated with the HI profile, because this gets to the heart of SDT. For instance,
studies could examine if workers with this profile fare better in some other careers. The NIE
profile comprised the smallest number of lawyers in the present study; it will be useful to
establish if they are more prevalent in other occupations.
In summary, more studies on the relationships between work values and career success
are needed. As the present study has shown, it may be more productive if future research can
model the conjoint effects of intrinsic and extrinsic work values within persons than to adopt the
more conventional variable-centered approach. To facilitate the accumulation of empirical
results, where feasible, studies should use measures of work values (e.g., Ye. 2015) and SCS
(e.g., Shockley et al., 2016) that are rigorously developed based on sound psychometric
principles.

111
Conclusion
Work value can be productively investigated as an antecedent of career success without
taking a contingency approach i.e., it is not always necessary to consider “fit”. In addition,
instead of using variable-centered methods, it may be more appropriate to adopt a person-
centered approach that models the conjoint effects of intrinsic and extrinsic work values. Using
LPA, the present study identified five work-value profiles among a cohort of U.S. lawyers based
on self-reported intrinsic and extrinsic work values during early career; furthermore, results from
this study also embedded the work-value profile construct in a nomological network consisting
of gender and multiple variables relating to career success. Some of the key premises of SDT (or
at least how they have been operationalized in some studies) were challenged by the present
findings. Through adopting a person-centered approach, the present study may have created a
new and potentially fruitful path for research on work values and career success.

112
References
ABF (2015). Guidelines for obtaining the restricted data from the After the JD Study. Retrieved
from http://www.americanbarfoundation.org/uploads/cms/documents/ajdrestricted_data_
contract_august_2015.pdf
Abele, A. E. (2003). The dynamics of masculine-agentic and feminine-communal traits: findings
from a prospective study. Journal of personality and social psychology, 85, 768-776.
Abele, A. E., & Spurk, D. (2009a). How do objective and subjective career success interrelate
over time? Journal of Occupational and Organizational Psychology, 82, 803-824.
Abele, A. E., & Spurk, D. (2009b). The longitudinal impact of self-efficacy and career goals on
objective and subjective career success. Journal of Vocational Behavior, 74, 53-62.
Afiouni, F., & M. Karam, C. (2014). Structure, agency, and notions of career success: A process-
oriented, subjectively malleable and localized approach. Career Development
International, 19, 548-571.
Amabile, T. M., Hill, K. G., Hennessey, B. A., & Tighe, E. M. (1994). The Work Preference
Inventory: Assessing intrinsic and extrinsic motivational orientations. Journal of Personality
and Social Psychology, 66, 950-967.
Arthur, M. B. (1994). The boundaryless career: A new perspective for organizational
inquiry. Journal of Organizational Behavior, 15, 295-306.
Arthur, M. B., Khapova, S. N., & Wilderom, C. P. (2005). Career success in a boundaryless
career world. Journal of Organizational Behavior, 26, 177-202.

113
Asparouhov, T., & Muthén, B. (2014). Auxiliary variables in mixture modeling: Three-step
approaches using Mplus. Structural Equation Modeling, 21, 329-341.
Asparouhov, T., & Muthén, B. (2015, May 14). Auxiliary variables in mixture modeling: Using
the BCH method in Mplus to estimate a distal outcome model and an arbitrary secondary
model. Retrieved from https://www.statmodel.com/examples/webnotes/webnote21.pdf
Bakk, Z., Tekle, F. B., & Vermunt, J. K. (2013). Estimating the association between latent class
membership and external variables using bias-adjusted three-step approaches. Sociological
Methodology, 43, 272-311.
Bakk, Z., & Vermunt, J. K. (2016) Robustness of stepwise latent class modeling with continuous
distal outcomes, Structural Equation Modeling, 23, 20-31.
Bardi, A., & Schwartz, S. H. (2003). Values and behavior: Strength and structure of
relations. Personality and Social Psychology Bulletin, 29, 1207-1220.
Baruch, Y., Szűcs, N., & Gunz, H. (2015). Career studies in search of theory: The rise and rise of
concepts. Career Development International, 20, 3-20.
Bauer, D. J., & Shanahan, M. J. (2007). Modeling complex interactions: Person-centered and
variable-centered approaches. In T. D. Little, J. A. Bovaird & N. A. Card (Eds.), Modeling
contextual effects in longitudinal studies (pp. 255-283). Mahwah, N.J.: Lawrence Erlbaum
Associates.
Berlin, K. S., Williams, N. A., & Parra, G. R. (2014). An introduction to latent variable mixture
modeling (part 1): Overview and cross-sectional latent class and latent profile analyses.
Journal of Pediatric Psychology, 39, 174-187.
Bolck, A., Croon, M., & Hagenaars, J. (2004). Estimating latent structure models with
categorical variables: One-Step versus three-step estimators. Political Analysis, 12, 3-27.
114
Boon C., Den Hartog, D. N., Boselie, P., & Paauwe, J. (2011). The relationship between
perceptions of HR practices and employee outcomes: Examining the role of person-
organisation and person–job fit. International Journal of Human Resource Management, 22,
138–162.
Bouwkamp-Memmer, J. C., Whiston, S. C., & Hartung, P. J. (2013). Work values and job
satisfaction of family physicians. Journal of Vocational Behavior, 82, 248-255.
Bozionelos, N. (2004). The relationship between disposition and career success: A British
study. Journal of Occupational and Organizational Psychology, 77, 403-420.
Bretz, R. D., & Judge, T. A. (1994). The role of human resource systems in job applicant
decision processes. Journal of Management, 20, 531-551.
Bridgstock, R. (2011). Skills for creative industries graduate success. Education + Training, 53,
9-26.
Brief, A. P., & Aldag, R. J. (1977). The intrinsic-extrinsic dichotomy: Toward conceptual
clarity. Academy of Management Review, 2, 496-500.
Briscoe, J. P., & Hall, D. T. (2006). Special section on boundaryless and protean careers: Next
steps in conceptualizing and measuring boundaryless and protean careers. Journal of
Vocational Behavior, 69, 1-3.
Burke, C. T., Shrout, P. E., & Bolger, N. (2007). Individual differences in adjustment to spousal
loss: A nonlinear mixed model analysis. International Journal of Behavioral
Development, 31, 405-415.
Byrne, B. M. (2008). Testing for multigroup equivalence of a measuring instrument: A walk
through the process. Psicothema, 20, 872-882.

115
Caricati, L., Sala, R. L., Marletta, G., Pelosi, G., Ampollini, M., Fabbri, A., ... & Mancini, T.
(2014). Work climate, work values and professional commitment as predictors of job
satisfaction in nurses. Journal of Nursing Management, 22, 984-994.
Cerasoli, C. P., Nickloin, J. M., & Ford, M. T. (2014). Intrinsic motivation and extrinsic
incentives jointly predict performance: A 40-year meta-analysis. Psychological Bulletin, 140,
980-1008.
Choi, B. Y., Kim, B., Jang, S. H., Jung, S. H., Ahn, S. S., Lee, S. M., & Gysbers, N. (2013). An
individual's work values in career development. Journal of Employment Counseling, 50, 154-
165.
Chudzikowski, K. (2012). Career transitions and career success in the ‘new’ career era. Journal
of Vocational Behavior, 81, 298-306.
Clark, S. L., & Muthén, B. (2009). Relating latent class analysis results to variables not included
in the analysis. Retrieved from http://statmodel2.com/download/relatinglca.pdf
Clogg, C.C., and Goodman, L.A. (1985). Simultaneous latent structure analysis in several groups.
Sociological Methodology, 15, 81-110.
Clogg, C.C., and Goodman, L.A. (1986). On scaling models applied to data from several groups.
Psychometrika, 51, 123-135.
Colakoglu, S. N. (2011). The impact of career boundarylessness on subjective career success:
The role of career competencies, career autonomy, and career insecurity. Journal of
Vocational Behavior, 79, 47-59.
Collins, L. (2006). Analysis of longitudinal data: The integration of theoretical model, temporal
design, and statistical model. Annual Review of Psychology, 57, 505–528.

116
Collins, L. M., & Lanza, S. T. (2010). Latent class and latent transition analysis: With
applications in the social, behavioral, and health sciences. Hoboken, NJ: Wiley.
Coyle, T. R. (2015). Relations among general intelligence (g), aptitude tests, and GPA: Linear
effects dominate. Intelligence, 53, 16-22.
Dagenais, F. (1998). Super's work values inventory scales as intrinsic or extrinsic constructs.
Psychological Reports, 83, 197-198.
Dawis, R. V., & Lofquist, L. H. (1984). A psychological theory of work adjustment: An
individual differences model and its application. Minneapolis: University of Minnesota.
Deci, E. L., & Ryan, R. M. (1985). Intrinsic motivation and self-determination in human
behavior. New York: Plenum Press.
De Vos, A., Dewettinck, K., & Buyens, D. (2009). The professional career on the right track: A
study on the interaction between career self-management and organizational career
management in explaining employee outcomes. European Journal of Work and
Organizational Psychology, 18, 55-80.
Dinovitzer, R. (2011). The financial rewards of elite status in the legal profession. Law and
Social Inquiry, 36, 971-998.
Dinovitzer, R., & Garth, B. (2007). Lawyer satisfaction in the process of structuring legal careers.
Law and Society Review, 41, 1-50.
Dinovitzer, R., & Garth, B. (2009a). Pro bono as an elite strategy in early lawyer careers. In R.
Granfield & L. Mather (Eds.), Private lawyers and the public interest: The evolving role of
pro bono in the legal profession (pp. 115-134). New York, NY: Oxford University Press.
Dinovitzer, R., & Garth, B. (2009b). Not that into you. Retrieved from
http://www.americanbarfoundation.org/uploads/cms/documents/001090904americanbar.pdf

117
Dinovitzer, R., Garth, B., Sander, R., Sterling, J., & Wilder, G. Z. (2004). After the JD: First
results of a national study of legal careers. Overland Park, KS: The NALP Foundation for
Law Career Research and Education.
Dinovitzer, R., Garth, B., & Sterling, J. S. (2013). Buyers' remorse? An empirical assessment of
the desirability of a legal career. Journal of Legal Education, 63, 211-234.
Dinovitzer, R., & Hagan, J. (2014). Hierarchical structure and gender dissimilarity in American
legal labor markets. Social Forces, 92, 929-955.
Dinovitzer, R., Nelson, R. L., Plickert, G., Sandefur, R., & Sterling, J. (2009). After the JD II:
Second results from a national study of legal careers. Overland Park, KS: The NALP
Foundation for Law Career Research and Education.
Dinovitzer, R., Reichman, N., & Stirling, J. (2009). The differential valuation of women’s work:
A new look at the gender gap in lawyers’ incomes. Social Forces, 88, 819-864.
Dries, N., Pepermans, R., & Carlier, O. (2008). Career success: Constructing a multidimensional
model. Journal of Vocational Behavior, 73, 254-267.
Drummond, R. J., & Stoddard, A. (1991). Job satisfaction and work values. Psychological
Reports, 69, 116–118.
DuBrin, A. J. (2001). Career-related correlates of self-discipline. Psychological reports, 89, 107-
110.
Dyke, L. S., & Murphy, S. A. (2006). How we define success: A qualitative study of what
matters most to women and men. Sex Roles, 55, 357-371.
Eby, L. T., Butts, M., & Lockwood, A. (2003). Predictors of success in the era of the
boundaryless career. Journal of Organizational Behavior, 24, 689-708.

118
Enders, C. K. (2013). Analyzing structural equation models with missing data. In G. R. Hancock
& R. O. Mueller (Eds.), Structural equation modeling: A second course (pp. 493-519).
Charlotte, NC: IAP.
Eubank, R. L., & Spiegelman, C. H. (1990). Testing the goodness of fit of a linear model via
nonparametric regression techniques. Journal of the American Statistical Association, 85,
387-392.
Folz, D. H. (1996). Survey research for public administration. Thousand Oaks, CA: Sage.
Fonseca, J. R. S. (2013). Clustering in the field of social sciences: That is your choice.
International Journal of Social Research Methodology, 16, 403-428.
Forret, M. L., & Dougherty, T. W. (2004). Networking behaviors and career outcomes:
Differences for men and women? Journal of Organizational Behavior, 25, 419-437.
Forstenlechner, I., & Lettice, F. (2008). Well paid but undervalued and overworked. Employee
Relations, 30, 640-652.
Foti, R. J., Bray, B. C., Thompson, N. J., & Allgood, S. F. (2012). Know thy self, know thy
leader: Contributions of a pattern-oriented approach to examining leader perceptions. The
Leadership Quarterly, 23, 702–717.
Frieze, I. H., Olson, J. E., Murrell, A. J., & Selvan, M. S. (2006). Work values and their effect on
work behavior and work outcomes in female and male managers. Sex Roles, 54, 83-93.
Froese, F. J., & Xiao, S. (2012). Work values, job satisfaction and organizational commitment in
China. The International Journal of Human Resource Management, 23, 2144-2162.
Funder, D. C. (2008). Persons, situations, and person-situation interactions. In O. P. John, R. W.
Robins, & L. A. Pervin (Eds.), Handbook of personality: Theory and research (3rd ed., pp.
568-580). New York, NY: Guilford Press.

119
Gabriel, A. S., Daniels, M. A., Diefendorff, J. M., & Greguras, G. J. (2015). Emotional labor
actors: A latent profile analysis of emotional labor strategies. Journal of Applied
Psychology, 100, 863-879.
Ganzach, Y., Gotlibobski, C., Greenberg, D., & Pazy, A. (2013). General mental ability and pay:
Nonlinear effects. Intelligence, 41, 631-637.
Ganzach, Y., & Pazy, A. (2015). Cognitive versus non-cognitive individual differences and the
dynamics of career success. Applied Psychology: An International Review, 64, 701-726.
Garth, B. G., Nelson, R. L., Dinovitzer, R., & Sandefur, R. (2014). After the JD III: Third results
from a national study of legal careers. Overland Park, KS: The NALP Foundation for Law
Career Research and Education.
Gattiker, U. E., & Larwood, L. (1986). Subjective career success: A study of managers and
support personnel. Journal of Business & Psychology, 1, 78-94.
Gattiker, U. E., & Larwood, L. (1988). Predictors for managers' career mobility, success, and
satisfaction. Human relations, 41, 569-591.
Gattiker, U. E., & Larwood, L. (1989). Career success, mobility and extrinsic satisfaction of
corporate managers. The Social Science Journal, 26, 75-92.
Gattiker, U. E., & Larwood, L. (1990). Predictors for career achievement in the corporate
hierarchy. Human Relations, 43, 703-726.
Greenhaus, J. H., & Callanan, G. A. (2013). Career dynamics. In N. Schmitt & S. Highhouse
(Eds.), Handbook of Psychology (Vol. 12, pp. 593-614). New York, NY: Wiley.
Greenhaus, J. H., Parasuraman, S., & Wormley, W. M. (1990). Effects of race on organizational
experiences, job performance evaluations, and career outcomes. Academy of Management
Journal, 33, 64-86.

120
Hagenaars, J. A., & McCutcheon, A. L. (Eds.). (2002). Applied latent class analysis. Cambridge:
Cambridge University Press.
Hair, J. F. Jr., Anderson, R. E., Tatham, R. L., & Black, W. C. (1998). Multivariate data analysis
(5th ed.). Upper Saddle River, NJ: Prentice Hall.
Hall, D. T. (1976). Careers in organizations. Santa Monica, CA: Goodyear.
Hartung, P. J. (2014). The history of work values: Morals, measurement, and meaning making.
In M. Pope, L. Y. Flores, P. J. Rottinghaus (Eds.), The role of values in careers (pp.21-36).
Charlotte, NC: IAP.
Heinz, J. P., Nelson, R. L., Sandefur, R. L., & Laumann, E. O. (2005). Urban lawyers: The new
social structure of the bar. Chicago, IL: University of Chicago Press.
Hennequin, E. (2007). What ‘career success’ means to blue-collar workers. Career Development
International, 12, 565-581.
Heslin, P. A. (2005). Conceptualizing and evaluating career success. Journal of Organizational
Behavior, 26, 113-136.
Hill, A. L., Degnan, K. A., Calkins, S. D., & Keane, S. P. (2006). Profiles of externalizing
behavior problems for boys and girls across preschool: The roles of emotion regulation and
inattention. Developmental Psychology, 42, 913–928.
Hirschi, A. (2010). Positive adolescent career development: The role of intrinsic and extrinsic
work values. The Career Development Quarterly, 58, 276-287.
Hofmans, J., De Gieter, S., & Pepermans, R. (2013). Individual differences in the relationship
between satisfaction with job rewards and job satisfaction. Journal of Vocational
Behavior, 82, 1-9.

121
Hofmans, J., Dries, N., & Pepermans, R. (2008). The Career Satisfaction Scale: Response bias
among men and women. Journal of Vocational Behavior, 73, 397-403.
Holland, J. L. (1959). A theory of vocational choice. Journal of Counseling Psychology, 6, 35–
45.
Holland, J. L. (1997). Making vocational choices: A theory of vocational personalities and work
environments. Odessa, FL: Psychological Assessment Resources.
Hull, K. E., & Nelson, R. L. (2000). Assimilation, choice, or constraint? Testing theories of
gender differences in the career of lawyers. Social Forces, 79, 229-264.
Hüttges, A., & Fay, D. (2015). The gender-differential impact of work values on prospects in
research careers. Journal of Career Development, 42, 524-539.
IBM Corp. (2013). IBM SPSS statistics for Windows, version 22.0. Armonk, NY: Author.
Jin, J., & Rounds, J. (2012). Stability and change in work values: A meta-analysis of longitudinal
studies. Journal of Vocational Behavior, 80, 326-339.
Johnson, M. K. (2001). Change in job values during the transition to adulthood. Work and
Occupations, 28, 315-345.
Johnson, M. K., & Monserud, M. A. (2010). Judgments about work and the features of young
adults’ jobs. Work and Occupations, 37, 194-224.
Johnson, M. K., & Mortimer, J. T. (2011). Origins and outcomes of judgments about
work. Social Forces, 89, 1239-1260.
Johnson, M. K., Mortimer, J. T., Lee, J. C., & Stern, M. J. (2007). Judgments about work
dimensionality revisited. Work and Occupations, 34, 290-317.
Johnson, M. K., Sage, R. A., & Mortimer, J. T. (2012). Work values, early career difficulties,
and the U.S. economic recession. Social Psychology Quarterly, 75, 242-267.

122
Judge, T. A., & Bono, J. E. (2001). Relationship of core self-evaluations traits—self-esteem,
generalized self-efficacy, locus of control, and emotional stability—with job satisfaction and
job performance: A meta-analysis. Journal of Applied Psychology, 86, 80-92.
Judge, T. A., & Bretz, R. D. (1992). Effects of work values on job choice decisions. Journal of
Applied Psychology, 77, 261-271.
Judge, T. A., & Bretz, R. D. (1994). Political influence behavior and career success. Journal of
Management, 20, 43-65.
Judge, T. A., Cable, D. M., Boudreau, J. W., & Bretz, R. D. (1995). An empirical investigation
of the predictors of executive career success. Personnel Psychology, 48, 485-519.
Judge, T. A., Higgins, C. A., Thoresen, C. J., & Barrick, M. R. (1999). The Big Five personality
traits, general mental ability, and career success across the life span. Personnel Psychology,
52, 621-652.
Judge, T.A., & Kammeyer-Mueller, J.D. (2007). Personality and Career Success. In M. Peiperl
& H. Gunz (Eds.), Handbook of career studies (pp. 59-78). Thousand Oaks, CA: Sage.
Judge, T. A., & Zapata, C. P. (2015). The person–situation debate revisited: Effect of situation
strength and trait activation on the validity of the Big Five personality traits in predicting job
performance. Academy of Management Journal, 58, 1149-1179.
Kalleberg, A. L. (1977). Work values and job rewards: A theory of job satisfaction. American
Sociological Review, 42, 124-143.
Kankaraš, M., & Moors, G. (2011). Measurement equivalence and extreme response bias in the
comparison of attitudes across Europe. Methodology, 7, 68-80.

123
Kankaraš, M., Moors, G., & Vermunt, J. K. (2010). Testing for measurement invariance with
latent class analysis. In E. Davidov, P. Schmidt & J. Billiet (Eds.), Cross-cultural analysis:
Methods and applications (pp. 359-384). New York: NY: Routledge.
Kanter, R. M. (1989). When giants learn to dance: Mastering the challenges of strategy,
management, and careers in the 1990s. New York, NY: Simon and Schuster.
Kasser, T., & Ryan, R. M. (1993). A dark side of the American dream: correlates of financial
success as a central life aspiration. Journal of Personality and Social Psychology, 65, 410-
422.
Kasser, T., & Ryan, R. M. (1996). Further examining the American dream: Differential
correlates of intrinsic and extrinsic goals. Personality and Social Psychology Bulletin, 22,
280-287.
Kay, F. M., & Hagan, J. (1995). The persistent glass ceiling: Gendered inequalities in the
earnings of lawyers. British Journal of Sociology, 46, 279-310.
Kim, N. (2004). Career success orientation of Korean women bank employees. Career
Development International, 9, 595-608.
Kirchmeyer, C. (1998). Determinants of managerial career success: Evidence and explanation of
male/female differences. Journal of Management, 24, 673-692.
Konrad, A. M., Yang, Y., Goldberg, C., & Sullivan, S. E. (2005). Preferences for job attributes
associated with work and family: A longitudinal study of career outcomes. Sex Roles, 53,
303-315.
Korman, A. K. (1980). Career success, personal failure. Englewood Cliffs, NJ: Prentice-Hall.
Korman, A. K., Wittig-Berman, U., & Lang, D. (1981). Career success and personal failure:
Alienation in professionals and managers. Academy of Management Journal, 24, 342-360.

124
Knoop, R. (1994). Work values and job satisfaction. Journal of Psychology, 128, 595–605.
Kreiger, L. S., & Sheldon, K. M. (2015). What makes lawyers happy? A data-driven prescription
to redefine professional success. George Washington Law Review, 83, 554-627.
Lent, R. W., & Brown, S. D. (2013). Social cognitive model of career self-management: Toward
a unifying view of adaptive career behavior across the life span. Journal of Counseling
Psychology, 60, 557-568.
Lent, R. W., Brown, S. D., & Hackett, G. (1994). Toward a unifying social cognitive theory of
career and academic interest, choice, and performance [Monograph]. Journal of Vocational
Behavior, 45, 79–122.
Leuty, M. E., & Hansen, J. I. C. (2011). Evidence of construct validity for work values. Journal
of Vocational Behavior, 79, 379-390.
Lindsay, P., & Knox, W. E. (1984). Continuity and change in work values among young adults:
A longitudinal study. American Journal of Sociology, 89, 918-931.
Lo, Y., Mendell, N. R., & Rubin, D. B. (2001). Testing the number of components in a normal
mixture. Biometrika, 88, 767-778.
Locke, E. A., & Latham, G. P. (2004). What should we do about motivation theory? Six
recommendations for the twenty-first century. Academy of Management Review, 29, 388-403.
London, M., & Stumpf, S. A. (1982). Managing careers. Reading, MA: Addison-Wesley.
Lubke, G., (2010). Latent variable mixture models. In G. Hancock & R. Mueller (Eds.), The
reviewer’s guide to quantitative methods in the social sciences (pp. 209-220). New York, NY:
Routledge.
Lubke, G. H., & Muthén, B. (2005). Investigating population heterogeneity with factor mixture
models. Psychological Methods, 10, 21-39.

125
Malka, A., & Chatman, J. A. (2003). Intrinsic and extrinsic work orientations as moderators of
the effect of annual income on subjective well-being: A longitudinal study. Personality and
Social Psychology Bulletin, 29, 737-746.
Marini, M. M., Fan, P., Finley, E., & Beutel, A. M. (1996). Gender and job values. Sociology of
Education, 69, 49-65.
Masyn, K. (2013). Latent class analysis and finite mixture modeling. In T. D. Little (Ed.), The
Oxford handbook of quantitative methods (Vol. 2, pp. 551-611). New York, NY: Oxford
University Press.
McCrae, R. R., & Costa, P. T., Jr. (1989). More reasons to adopt the five-factor model. American
Psychologist, 44, 451-452.
McCutcheon, A. L., & Hagenaars, J. A. (1997). Comparative social research with multi-sample
latent class models. In J. Rost & R. Langeheine (Eds.), Applications of latent trait and latent
class models in the social sciences (pp. 266-277). Münster: Waxmann.
McDonald, K. S., & Hite, L. M. (2008). The next generation of career success: Implications for
HRD. Advances in Developing Human Resources, 10, 86-103.
McGill, C. (2006). Educational debt and law student failure to enter public service careers:
Bringing empirical data to bear. Law and Social Inquiry, 31, 677-708.
Mirowsky, J., & Ross, C. E. (1991). Eliminating defense and agreement bias from measures of
the sense of control: A 2 x 2 index. Social Psychology Quarterly, 54, 127-145.
Mirvis, P. H., & Hall, D. T. (1994). Psychological success and the boundaryless career. Journal
of Organizational Behavior, 15, 365-380.

126
Moniarou-Papaconstantinou, V., & Triantafyllou, K. (2015). Job satisfaction and work values:
Investigating sources of job satisfaction with respect to information professionals. Library &
Information Science Research, 37, 164-170.
Mortimer, J. T., & Lorence, J. (1979). Work experience and occupational value socialization: A
longitudinal study. American Journal of Sociology, 84, 1361-1385.
Mortimer, J. T., Pimentel, E. E., Ryu, S., Nash, K., & Lee, C. (1996). Part-time work and
occupational value formation in adolescence. Social forces, 74, 1405-1418.
Murdoch, C., & Rounds, J. (2014). Work values: Understanding and assessing motivation to
work. In D. R. Strauser (Ed.), Career development, employment, and disability in
rehabilitation (pp. 193-206). New York, NY: Springer.
Muthén, B. (2001). Latent variable mixture modeling. In G. A. Marcoulides & R. E. Schumacker
(Eds.), New developments and techniques in structural equation modeling (pp. 1-33).
Mahwah, NJ: Lawrence Erlbaum.
Muthén, B. (2004). Latent variable analysis. In Kaplan, D. (Ed.), The Sage handbook of
quantitative methodology for the social sciences (pp. 345-368). Thousand Oaks, CA: Sage.
Muthén, L. K., & Muthén, B. O. (1998–2015). Mplus User's Guide (7th
ed.). Los Angeles, CA:
Muthén & Muthén.
Ng, T. W. H., Eby, L. T., Sorensen, K. L., & Feldman, D. C. (2005). Predictors of objective and
subjective career success: A meta-analysis. Personnel Psychology, 58, 367-408.
Ng, T. W. H., & Feldman, D. C. (2014). Subjective career success: A meta-analytic review.
Journal of Vocational Behavior, 85, 169-179.
Ng, T. W. H., Sorensen, K. L., & Eby, L. T. (2006). Locus of control at work: A meta‐
analysis. Journal of Organizational Behavior, 27, 1057-1087.
127
Nickerson, C., Schwarz, N., Diener, E., & Kahneman, D. (2003). Zeroing in on the dark side of
the American dream: A closer look at the negative consequences of the goal for financial
success. Psychological Science, 14, 531-536.
Niemiec, C. P., Ryan, R. M., & Deci, E. L. (2009). The path taken: Consequences of attaining
intrinsic and extrinsic aspirations in post-college life. Journal of Research in Personality, 43,
291-306.
Nord, W. R., Brief, A. P., Atieh, J. M., & Doherty, E. M. (1990). Studying meanings of work:
The case of work values. In A. Brief & W. Nord (Eds.), Meanings of occupational work: A
collection of essays (pp. 21-64). Lexington, MA: Lexington Books.
Nylund, K., Asparouhov, T., & Muthén, B. (2007). Deciding on the number of classes in latent
class analysis and growth mixture modeling: A Monte Carlo simulation study. Structural
Equation Modeling, 14, 535-569.
Oh, I. S., Guay, R. P., Kim, K., Harold, C. M., Lee, J. H., Heo, C. G., & Shin, K. H. (2014). Fit
happens globally: A meta‐analytic comparison of the relationships of person–environment fit
dimensions with work attitudes and performance across East Asia, Europe, and North
America. Personnel Psychology, 67, 99-152.
Olver, J. M., & Mooradian, T. A. (2003). Personality traits and personal values: A conceptual
and empirical integration. Personality and Individual Differences, 35, 109-125.
Owens, W. A., & Schoenfeldt, L. F. (1979). Toward a classification of persons [Monograph].
Journal of Applied Psychology, 64, 569-607.
Pan, J., & Zhou, W. (2015). How do employees construe their career success: An improved
measure of subjective career success. International Journal of Selection and Assessment, 23,
45-58.
128
Parks-Leduc, L., Feldman, G., & Bardi, A. (2014). Personality traits and personal values: A
meta-analysis. Personality and Social Psychology Review, 19, 3-29.
Pastor, D. A., Barron, K. E., Miller, B. J., & Davis, S. L. (2007). A latent profile analysis of
college students’ achievement goal orientation. Contemporary Educational Psychology, 32,
8-47.
Pinnington, A. H., & Sandberg, J. (2013). Lawyers’ professional careers: Increasing women’s
inclusion in the partnership of law firms. Gender, Work, & Organization, 20, 616-631.
Plickert, G., & Dinovitzer, R. (2007). After the JD: First results report (Technical addendum
June 2007). Retrieved from http://www.abf-sociolegal.org/afterjd.html
Reichman, N., & Sterling, J. S. (2002). Recasting the brass ring: Deconstructing and
reconstructing workplace opportunities for women lawyers. Capital University Law Review,
29, 923-977.
Reichman, N., & Sterling, J. S. (2013). Parenthood status and compensation in law practice.
Indiana Journal of Global Legal Studies, 20, 1203-1222.
Roberts, B. W., & Robins, R. W. (2000). Broad dispositions, broad aspirations: The intersection
of personality traits and major life goals. Personality and Social Psychology Bulletin, 26,
1284-1296.
Rodrigues, R., Guest, D., & Budjanovcanin, A. (2013). From anchors to orientations: Towards a
contemporary theory of career preferences. Journal of Vocational Behavior, 83, 142-152.
Roe, R. A., & Ester, P. (1999). Values and work: Empirical findings and theoretical perspective.
Applied Psychology, 48, 1-21.
Roeder, K., & Wasserman, L. (1997). Practical Bayesian density estimation using mixtures of
normals. Journal of the American Statistical Association, 92, 894–902.

129
Rokeach, M. (1973). The nature of human values. New York, NY: Free Press.
Ros, M., Schwartz, S. H., & Surkiss, S. (1999). Basic individual values, work values, and the
meaning of work. Applied Psychology, 48, 49-71.
Rounds, J., Smith, T., Hubert, L., Lewis, P., & Rivkin, D. (1999). Development of occupational
interest profiles for O*NET. Raleigh, NC: National Center for O*NET Development.
Russo, M., Guo, L., & Baruch, Y. (2014). Work attitudes, career success and health: Evidence
from China. Journal of Vocational Behavior, 84, 248-258.
Ryan, R. M., & Deci, E. L. (2000). Self-determination theory and the facilitation of intrinsic
motivation, social development, and well-being. American Psychologist, 55, 68-78.
Ryan, R. M., Sheldon, K. M., Kasser, T., & Deci, E. L. (1996). All goals are not created equal:
An organismic perspective on the nature of goals and their regulation. In P. M. Gollwitzer &
J. A. Bargh (Eds.), The psychology of action: Linking cognition and motivation to behavior
(pp. 7–26). New York: Guilford Press.
Savickas, M. L. (2014). Work values: A career construction elaboration. In M. Pope, L. Y. Flores,
P. J. Rottinghaus (Eds.), The role of values in careers (pp.3-20). Charlotte, NC: IAP.
Scarpello, V., & Campbell, J. P. (1983). Job satisfaction: Are all the parts there? Personnel
Psychology, 36, 577-600.
Schmitt, N. (1996). Uses and abuses of coefficient alpha. Psychological Assessment, 8, 350-353.
Schwartz, S. H., & Bilsky, W. (1987). Toward a universal psychological structure of human
values. Journal of Personality and Social Psychology, 53, 550–562.
Sheldon, K. M., & Krieger, L. S. (2014). Service job lawyers are happier than money job lawyers,
despite their lower income. The Journal of Positive Psychology, 9, 219-226.

130
Shockley, K. M., Ureksoy, H., Rodopman, O. B., Poteat, L. F., & Dullaghan, T. R. (2016).
Development of a new scale to measure subjective career success: A mixed‐methods
study. Journal of Organizational Behavior, 37, 128-153.
Speece, D. L. (1994). Cluster analysis in perspective. Exceptionality, 5, 31-44.
Spurk, D., & Abele, A. E. (2014). Synchronous and time-lagged effects between occupational
self-efficacy and objective and subjective career success: Findings from a four-wave and 9-
year longitudinal study. Journal of Vocational Behavior, 84, 119-132.
Spurk, D., Meinecke, A. L., Kauffeld, S., & Volmer, J. (2015). Gender, professional networks,
and subjective career success within early academic science careers. Journal of Personnel
Psychology, 14, 121-130.
Steenkamp, J. E. M., & Baumgartner, H. (1998). Assessing measurement invariance in cross-
national consumer research. Journal of Consumer Research, 25, 78–90.
Sterling, J. S., & Reichman, N. (2010). So, you want to be a lawyer? The quest for professional
status in a changing legal world. Fordham Law Review, 78, 2289-2314.
Sterling, J. S., & Reichman, N. (2013). Navigating the gap: Reflections on 20 years researching
gender disparities in the legal profession. FIU Law Review, 8, 515-539.
Stumpf, S. A. (2014). A longitudinal study of career success, embeddedness, and mobility of
early career professionals. Journal of Vocational Behavior, 85, 180-190.
Stumpf, S. A., & Tymon, W. G. (2012). The effects of objective career success on subsequent
subjective career success. Journal of Vocational Behavior, 81, 345-353.
Super, D. E. (1953). A theory of vocational development. American Psychologist, 8, 185-190.
Super, D. E. (1957). The psychology of careers. New York: Harper & Row.

131
Super, D. E. (1962). The structure of work values in relation to status, achievement, interests,
and adjustment. Journal of Applied Psychology, 46, 231-239.
Super, D. E. (1980). A life-span, life-space approach to career development. Journal of
Vocational Behavior, 16, 282-298.
Turban, D. B., & Dougherty, T. W. (1994). Role of protégé personality in receipt of mentoring
and career success. Academy of Management Journal, 37, 688-702.
Valcour, P. M., & Tolbert, P. (2003). Gender, family and career in the era of boundarylessness:
Determinants and effects of intra-and inter-organizational mobility. International Journal of
Human Resource Management, 14, 768-787.
VanKim, N. A., Erickson, D. J., & Laska, M. N. (2015). Food shopping profiles and their
association with dietary patterns: A latent class analysis. Academy of Nutrition and Dietetics,
115, 1109-1116.
Vansteenkiste, M., Neyrinck, B., Niemiec, C., Soenens, B., De Witte, H., & Van den Broeck, A.
(2007). Examining the relations among extrinsic versus intrinsic work value orientations,
basic need satisfaction, and job experience: A self-determination theory approach. Journal of
Occupational and Organizational Psychology, 80, 251-277.
Verbruggen, M. (2012). Psychological mobility and career success in the ‘new’ career climate.
Journal of Vocational Behavior, 81, 289-297.
Vermunt, J. K. (2010). Latent class modeling with covariates: Two improved three-step
approaches. Political Analysis, 18, 450-469.
Vermunt, J. K., & Magidson, J. (2002). Latent class cluster analysis. In J. Hagenaars & A.
McCutcheon (Eds.), Applied latent class analysis (pp. 89-106). Cambridge: Cambridge
University Press.

132
Vilela, B. B., Gonzales J. A. V., Ferrin, P. F. (2008). Person-organization fit, OCB and
performance appraisal: Evidence from matched supervisor-salesperson data set in a Spanish
context. Industrial Marketing Management, 37, 1005–1019.
Wang, G. T. (1992). Extrinsic and intrinsic work values: A comparative study of employees in
the United States and Japan (Doctoral dissertation). Available from ProQuest Dissertations
and Theses database. (UMI No. 9307265)
Wang, J. C., Liu, W. C., Chatzisarantis, N., & Lim, C. B. S. (2010). Influence of perceived
motivational climate on achievement goals in physical education: A structural equation
mixture modeling analysis. Journal of Sport and Exercise Psychology, 32, 324-338.
Wang, M., & Hanges, P. J. (2011). Latent class procedures: Applications to organizational
research. Organizational Research Methods, 14, 24–31.
Wanous, J. P., Reichers, A. E., & Hudy, M. J. (1997). Overall job satisfaction: How good are
single-item measures? Journal of Applied Psychology, 82, 247-252.
Warr, P. (2008). Work values: Some demographic and cultural correlates. Journal of
Occupational and Organizational Psychology, 81, 751-775.
Weick, K. E. (1996). Enactment in the boundaryless career: Organizing as we work. In M. B.
Arthur & D. M. Rousseau (Eds.), The boundaryless career: A new employment principle for
a new organizational era (pp. 40-57). New York, NY: Oxford University Press.
Weiss, D. C. (2014). ‘After the JD’ study shows many leave law practice. ABA Law Journal, 100,
1.
White, J. J. (1967). Women in the law. Michigan Law Review, 65, 1051-1122.
Wilder, G. Z. (2007). Law school debt among new lawyers: An After the JD monograph.
Overland Park, KS: The NALP Foundation for Law Career Research and Education.

133
Wille, B., Tracey, T. J., Feys, M., & De Fruyt, F. (2014). A longitudinal and multi-method
examination of interest–occupation congruence within and across time. Journal of
Vocational Behavior, 84, 59-73.
Wolff, H. G., & Moser, K. (2009). Effects of networking on career success: A longitudinal
study. Journal of Applied Psychology, 94, 196-206.
Y. Haines, V., Hamouche, S., & Saba, T. (2014). Career success: Fit or marketability? Career
Development International, 19, 779-793.
Ye, L. (2015). Work values and career adaptability of Chinese university students. Social
Behavior and Personality, 43, 411-422.
Zhou, W., Sun, J., Guan, Y., Li, Y., & Pan, J. (2013). Criteria of career success among Chinese
employees: Developing a multidimensional scale with qualitative and quantitative
approaches. Journal of Career Assessment, 21, 265-277.
Zytowski, D. G. (1994). A Super contribution to vocational theory: Work values. The Career
Development Quarterly, 43, 25-31.

134
Appendices
135
Appendix A: IRB Exemption Letter

136
Appendix B: Work Value Items
Note: The following survey was conducted online, through the Qualtrics survey tool.
Demographic items
Age, gender, whether enrolled in an educational institution
Instructions
The following items are survey questions intended to reflect either an extrinsic or intrinsic work
value. Extrinsic work values reflect the importance attached to job features that are means to
other ends or that provide more or less desirable conditions of work, such as a job’s pay or
security. Intrinsic work values capture the degree of importance attached to the rewarding nature
of the work tasks themselves, including opportunities for self-expression, learning, or helping
others.
Please classify the following seven statements according to whether you think each reflects
an extrinsic (E) or intrinsic (I) work value.
Value statement E or I
AQ38A Medium-to-long-term earning potential E
AQ38B Substantial interest in a specific field of work I
AQ38E Opportunity to develop specific skills I
AQ38H Prestige of the sector E
AQ38G Opportunity to do socially responsible work I
AQ38I Opportunities for future career mobility E
AQ38F Potential to balance work and family life
Please indicate below whether you felt any of the items were ambiguous or difficult to categorize
and why.

137
Appendix C: Job Satisfaction Items
How satisfied are you with each of the following aspects of your current position?
1 2 3 4 5 6 7 N/A
Highly
dissatisfied
Neither
satisfied
nor
dissatisfied
Highly
satisfied
1. Level of responsibility you have
2. Recognition you receive for your work
3. Substantive area of your work
4. Tasks you perform
5. Opportunities for advancement
6. Control you have over the amount of work you do
7. Control you have over how you do your work
8. Relationships with colleagues
9. Opportunities for doing pro bono work
10. Intellectual challenge of your work
11. Opportunities for building skills
12. Amount of travel required
13. Diversity of the workplace
14. Performance evaluation process
15. Value of your work to society
16. Job security

138
Appendix D: Locus of Control Items*
How strongly do you agree or disagree with each of the following statements?
1 2 3 4 5 6 7
Strongly
disagree
Strongly
agree
1. I am responsible for my own successes. (I)
2. I can do just about anything I really set my mind to. (I)
3. My misfortunes are the result of mistakes I have made. (I)
4. I am responsible for my failures. (I)
5. The really good things that happen to me are mostly luck. (E)
6. There’s no sense planning a lot, if something good is going to happen, it will. (E)
7. Most of my problems are due to bad breaks. (E)
8. I have little control over the bad things that happen to me. (E)
*Items denoted by letters “I” and “E” address internal LOC and external LOC, respectively.